Article

Comparative Transcriptomic Analysis of Staphylococcus aureus Reveals the Genes Involved in Survival at Low Temperature

1
College of Food Science and Technology, Henan Agricultural University, Zhengzhou 450002, China
2
Key Laboratory of Staple Grain Processing, Ministry of Agriculture and Rural Affairs, Zhengzhou 450002, China
3
Henan Engineering Laboratory of Quick-Frozen Flour-Rice Food and Prepared Food, Henan Engineering Research Center for Cold-Chain Food, Henan Agricultural University, Zhengzhou 450002, China
*
Author to whom correspondence should be addressed.
Foods 2022, 11(7), 996; https://doi.org/10.3390/foods11070996
Submission received: 18 February 2022 / Revised: 23 March 2022 / Accepted: 26 March 2022 / Published: 29 March 2022
(This article belongs to the Section Food Microbiology)

Abstract

:
In food processing, the temperature is usually reduced to limit bacterial reproduction and maintain food safety. However, Staphylococcus aureus can adapt to low temperatures by controlling gene expression and protein activity, although its survival strategies normally vary between different strains. The present study investigated the molecular mechanisms of S. aureus with different survival strategies in response to low temperatures (4 °C). The survival curve showed that strain BA-26 was inactivated by 6.0 logCFU/mL after 4 weeks of low-temperature treatment, while strain BB-11 only decreased by 1.8 logCFU/mL. Intracellular nucleic acid leakage, transmission electron microscopy, and confocal laser scanning microscopy analyses revealed better cell membrane integrity of strain BB-11 than that of strain BA-26 after low-temperature treatment. Regarding oxidative stress, the superoxide dismutase activity and the reduced glutathione content in BB-11 were higher than those in BA-26; thus, BB-11 contained less malondialdehyde than BA-26. RNA-seq showed a significantly upregulated expression of the fatty acid biosynthesis in membrane gene (fabG) in BB-11 compared with BA-26 because of the damaged cell membrane. Then, catalase (katA), reduced glutathione (grxC), and peroxidase (ahpC) were found to be significantly upregulated in BB-11, leading to an increase in the oxidative stress response, but BA-26-related genes were downregulated. NADH dehydrogenase (nadE) and α-glucosidase (malA) were upregulated in the cold-tolerant strain BB-11 but were downregulated in the cold-sensitive strain BA-26, suggesting that energy metabolism might play a role in S. aureus under low-temperature stress. Furthermore, defense mechanisms, such as those involving asp23, greA, and yafY, played a pivotal role in the response of BB-11 to stress. The study provided a new perspective for understanding the survival mechanism of S. aureus at low temperatures.

1. Introduction

Staphylococcus aureus is a Gram-positive bacterium that infects the human body and produces enterotoxins [1,2]. According to a report by the Centers for Disease Control and Prevention [3,4], approximately 241,000 foodborne diseases are caused by S. aureus each year in the United States, and it is the third most prevalent foodborne disease in the world [5], as it is often present in frozen and refrigerated food, such as meat, aquatic products, and ice cream [6].
The cell membrane of bacteria plays an important role in maintaining cell morphology, exchanging substances with the outside world, and preserving the relative stability of the intracellular environment [7]. When the cell membrane is destroyed, the integrity change causes the cellular content to flow out, followed by cell lysis and death [8,9]. Cell membrane damage is caused by a variety of conditions; extreme temperatures will decrease cell membrane fluidity and cause it to solidify and break [10]. When the organism is harmed, it will produce reactive oxygen species (ROS), which attack the polyunsaturated fatty acids in the cell membrane, causing lipid peroxidation to destroy the structure and change the integrity [11,12].
Bacterial survival mechanisms regulate cellular metabolites and proteins through gene expression in response to exposure to different pH levels, temperature, osmotic pressure, and toxic chemicals, thereby maximizing the chance of survival [13,14]. For example, S. aureus overexpresses the csp family gene to enhance its cold stress response at low temperatures [15]; S. aureus undergoes exhibits of amino acids, citric acid, and β-aminoisobutyric acid after cold stress, allowing the bacteria to adapt to long-term low-temperature environments [16].
The important role of RNA makes it the primary factor to analyze for a comprehensive description of the physiological state of cells [17], revealing the association between gene expression and life activities [18]. In recent years, the effect of low-temperature stress on S. aureus has been reported, but the object of the analysis is generally a single sample. However, small genetic differences affect stress tolerance in bacteria, and differences between sensitive isolates and tolerant isolates have been identified [19]. Therefore, by comparing strains with different resistance levels, we obtained a comprehensive understanding of which molecular mechanisms played a role in regulating stress resistance [20].
Therefore, the purposes of this study were (1) to explore the differences in the cell membrane integrity of S. aureus with different survival strategies at a low temperature and (2) to study the differences in the changes in oxidative stress in S. aureus at a low temperature. (3) Based on an RNA-Seq analysis of the differences in transcript levels in S. aureus with different survival strategies for exposure to a low temperature, we discovered the role of stress resistance-related genes in this study.

2. Materials and Methods

2.1. Bacterial Strains and Culture Conditions

The two S.aureus strains, BB-11 and BA-26, used in this study, were collected in our lab from meat samples and were confirmed to be S. aureus using the Biolog technique [21] and PCR amplification of the nuc gene [22]. After homogenizing 25 g meat samples, they were placed in 225 mL of trypticase soy broth supplemented with 0.6% (w/v) yeast extract (TSB-YE) (Land Bridge Technology Co., Ltd., Beijing, China) and 10% (w/v) sodium chloride (Fuyu Technology Co., Ltd., Tianjin, China) at 37 °C, 150rpm/min shaker culture for 18h. Then, separation and purification on tryptone soy agar with 0.6% (w/v) yeast extract (TSA-YE) (Land Bridge Technology Co., Ltd., Beijing, China) plates were repeated three times [23]. The two strains were stored in trypticase soy broth supplemented with 0.6% (w/v) yeast extract (TSB-YE) and 50% (v/v) glycerin (Fuyu Technology Co., Ltd., Tianjin, China) at −80 °C until use.

2.2. Preparation of Bacterial Suspensions and Cold Treatment

The S. aureus was inoculated in TSB-YE and incubated at 37 °C with shaking until the late exponential stage, 25 mL of cell culture medium were collected by centrifugation at 8000 rpm for 5 min at 4 °C, and bacteria were washed three times with phosphate-buffered saline (PBS) (Solarbio Technology Co., Ltd., Beijing, China). Then, the cells were resuspended in an equal volume of PBS to a final concentration of 9.5 logCFU/mL in a 50 mL plastic tube. For low-temperature treatment, the suspension was stored at 4 °C in a refrigerator for subsequent determination.

2.3. Viable Cell Enumeration

The total number of colonies was determined weekly for 4 weeks of low-temperature treatment by spreading suitable dilutions of the low-temperature treated cells on TSA-YE plates. Three parallel replicates, one of each sample, were analyzed.

2.4. Nucleic Acid Leakage Analysis

After 1 week of low-temperature treatment, 1 mL of the cell suspension was transferred to a 1.5 mL RNase/DNase-free centrifuge tube. The culture was centrifuged at 8000 rpm for 5 min at 4 °C. Then, the centrifuged supernatant was transferred to a new centrifuge tube by pipettor. Using a NanoDrop 2000 spectrophotometer (Thermo Fisher Scientific Co., Ltd., Wilmington, NC, USA) the optical density of the supernatant was measured at 260 nm, the amount of intracellular nucleic acid leakage was calculated [24]. All operations were performed on ice to minimize nucleic acid degradation.

2.5. Determination of Microscale Malondialdehyde (MDA) and Reduced Glutathione (GSH) Contents, and Superoxide Dismutase (SOD) Activity

One milliliter each of the two strains of low-temperature treated S. aureus suspension was collected into separate centrifuge tubes, centrifuge at 8000 rpm for 5 min at 4 °C, and the supernatant was discarded. The extraction solution was added at a ratio of bacterial number: extraction solution of 1000:1. Then, the bacteria were crushed with a JY99-IIDN ultrasonic device (Xinzhi Biotechnology Co., Ltd., Ningbo, China; ice bath, 200 W, ultrasound 3 s, interval 10 s, and repeat 30 times). The samples were centrifuged at 8000 rpm for 10 min at 4 °C. The supernatant was placed on ice to determine the MDA and GSH contents, as well as the SOD activity using the microscale malondialdehyde (MDA) assay kit, reduced glutathione (GSH) assay kit, and superoxide dismutase (SOD) assay kit (Jiancheng Technology Co., Ltd., Nanjing, China), according to the manufacturer’s recommendations.

2.6. Confocal Laser Scanning Microscopy (CLSM) Observation

One milliliter of the late exponential stage of S. aureus treated with a low temperature for 1 week was centrifuged at 8000 rpm for 10 min and washed 3 times with sterile PBS. S. aureus was incubated with reagents from the Calcein-AM/PI kit at 37 °C for 30 min in the dark prior to CLSM observation [25]. After entering the cell, calcein-AM was hydrolyzed by endogenous esterases in living cells to produce the polar molecule calcein (calcein), which has a strong negative charge and does not penetrate the cell membrane; thus, it is retained in the cell, while calcein emits strong green fluorescence. The nucleic acid red fluorescent dye propidium iodide (PI) does not penetrate the cell membrane of living cells, but only stains dead cells whose cell membrane integrity has been destroyed. Therefore, live cells will emit green fluorescence after staining, while dead cells will emit red fluorescence. According to the manufacturer’s recommendations, a Nikon A1R confocal laser scanning microscope (Nikon, Japan) was used to capture images, and the NIS-Elements Viewer software was used for image analysis.

2.7. Transmission Electron Microscopy (TEM) Observation

Referring to the method reported by Suo et al. [26], 1 mL of S. aureus after 1 week of low-temperature treatment and 1 mL of the late exponential stage of S. aureus bacterial suspensions were washed 3 times with PBS and fixed with 4% (v/v) glutaraldehyde (Fuyu Co., Ltd., Tianjin, China) for 4 h at 4 °C, then washed 4 times with PBS. The samples were then dehydrated in different gradients of acetone (Tianjin Co., Ltd., Tianjin, China) solutions and embedded in an embedding medium (Epon812, Zhongjing Technology Co., Ltd., Beijing, China) for 4 h. Ultrathin sections (EM UC6, Leica Co., Ltd., Solms, Germany) were stained with uranyl acetate and lead citrate (Fuyu Co., Ltd., Tianjin, China) for 10 min and observed using a JEM-1400 transmission electron microscope (EOL Japan Electronics Co., Ltd., Tokyo, Japan).

2.8. RNA-Seq Analysis

Total RNA was extracted from 1 mL of S. aureus after 1 week of low-temperature treatment and 1 mL of the late exponential stage of S. aureus bacterial suspensions using TRIzon reagent (Kangwei Century Biotechnology Co., Ltd., Nanjing, Jiangsu, China), followed by sequencing, transcriptome assembly, and annotation. After constructing a cDNA library, the raw data (raw data) usually contain a small amount of junction contamination and low-quality reads, which must be filtered and rehybridized. The Bowtie2 alignment software [27] was used to compare the clean reads (reads obtained after filtering were completed) obtained from the sequencing of each sample with the reference S. aureus genome (GCF_013307085.1) (https://www.ncbi.nlm.nih.gov/assembly/GCF_013307085.1/ (accessed on 12 July 2021)), and two base mismatches were allowed during the alignment process. Gene expression levels in each sample were analyzed using HTSeq software [28], the expression of each gene was tested for the null hypothesis using a negative binomial distribution statistical model to obtain p values for comparison and differentially expressed genes (DEGs) were screened according to a p value ≤ 0.05 and FC ≥ 2.
GO enrichment analysis was used to identify the main biological functions performed by DEGs [29]. All the differentially expressed genes obtained above were mapped to the Gene Ontology (GO) database (http://www.geneontology.org/, accessed on 12 July 2021). The Kyoto Encyclopedia of Genes and Genomes (KEGG) (https://www.kegg.jp/, accessed on 12 July 2021) was used to predict the pathways of the DEPs. The pathway annotation information corresponding to the differentially expressed genes was obtained.

2.9. Validation of RNA-Seq Results Using qRT–PCR

qRT–PCR was performed to validate the transcript levels identified using RNA-Seq. The primers were designed and validated by Primer-BLAST (https://www.ncbi.nlm.nih.gov/, accessed on 18 October 2021) and synthesized by Shangya Biological Co., Ltd. (Zhengzhou, China); see Table 1 for details. PCR products were amplified and detected using a StepOnePlus instrument (ABI Co., Ltd., Waltham, MA, USA). The following amplification procedure was used: 95 °C, 5 min for the predenaturation step; 95 °C, 10 s for denaturation; 60 °C, 20 s for annealing; 72 °C, 20 s for extension; followed by 40 cycles of denaturation, annealing, and extension. Solubility curves were generated using the default settings of the instrument. The data were quantified using the 2−ΔΔCt method [30] and 16S rDNA served as the internal reference gene.

2.10. Statistical Analysis

All experiments were performed in three parallel replicates to calculate the mean and error (Excel 2019, Microsoft, Albuquerque, NM, USA), and one-way ANOVA (SPSS, IBM Co., Ltd., Armonk, NY, USA) was used for statistical analyses of the significance of differences at the p < 0.05 level. The results were plotted using Origin 8.5 software (OriginLab Co., Ltd., Northampton, MA, USA).

3. Results and Discussion

3.1. Changes in the Number of Viable Cells and Intracellular Nucleic Acid Leakage of S. aureus

The number of viable cells of both S. aureus strains decreased continuously under low-temperature stress (Figure 1A). As shown in the figure, the number of viable BA-26 cells decreased by 6.0 logCFU/mL after 4 weeks of low-temperature treatment, while only a 1.8 logCFU/mL decrease was observed for S. aureus strain BB-11. Based on these results, BB-11 was more resistant to low temperatures than the BA-26 strain.
As shown in Figure 1B, the amount of intracellular material leakage from both strains of S. aureus increased continuously during the low-temperature treatment, with the lowest nucleic acid leakage of 97.1 ng/μL observed for BB-11; however, the amount of nucleic acid leakage was 135.5 ng/μL for BA-26, which was 38.4 ng/μL higher than that of BB-11 (p < 0.05). Therefore, the cell membrane of S. aureus was disrupted and intracellular nucleic acid efflux was increased after low-temperature treatment, while the amount of nucleic acid leakage from BB-11 was less than that from BA-26. Because the BA-26 strain has more apoptosis after long-term low-temperature treatment, it is difficult to carry out biochemical analysis, thus S. aureus after 7 days of low-temperature treatment was selected for follow-up experiments.

3.2. Oxidative Stress in S. aureus

In Figure 2A, the MDA content in both strains of S. aureus increased during the low-temperature treatment, but the MDA content in BB-11 was always lower than that in BA-26. The increasing trend for the MDA content in BB-11 decreased from 4 to 8 days, while the MDA content in BA-26 increased throughout this period, reaching the maximum difference of 0.4 nmol at 8 d. In Figure 2B, the SOD activity of both strains decreased after low-temperature stress, but the SOD activity of BB-11 was higher than BA-26 throughout the 8-day analysis. Changes in the reduced glutathione content in S. aureus are shown in Figure 2C. The reduced glutathione content in both strains increased after a short period of low-temperature treatment; however, the content of reduced glutathione in BB-11 was 7.36 μmol/gprot higher than that in BA-26 on the second day (p < 0.001). However, the reduced glutathione content decreased with the increasing time of low-temperature treatment, except that the content in BB-11 was always significantly higher than that in BA-26 (p < 0.001). Because the SOD activity and reduced glutathione contents were more difficult to measure with the increase in the time of low-temperature treatment, the experimental data are only listed for up to 8 d.

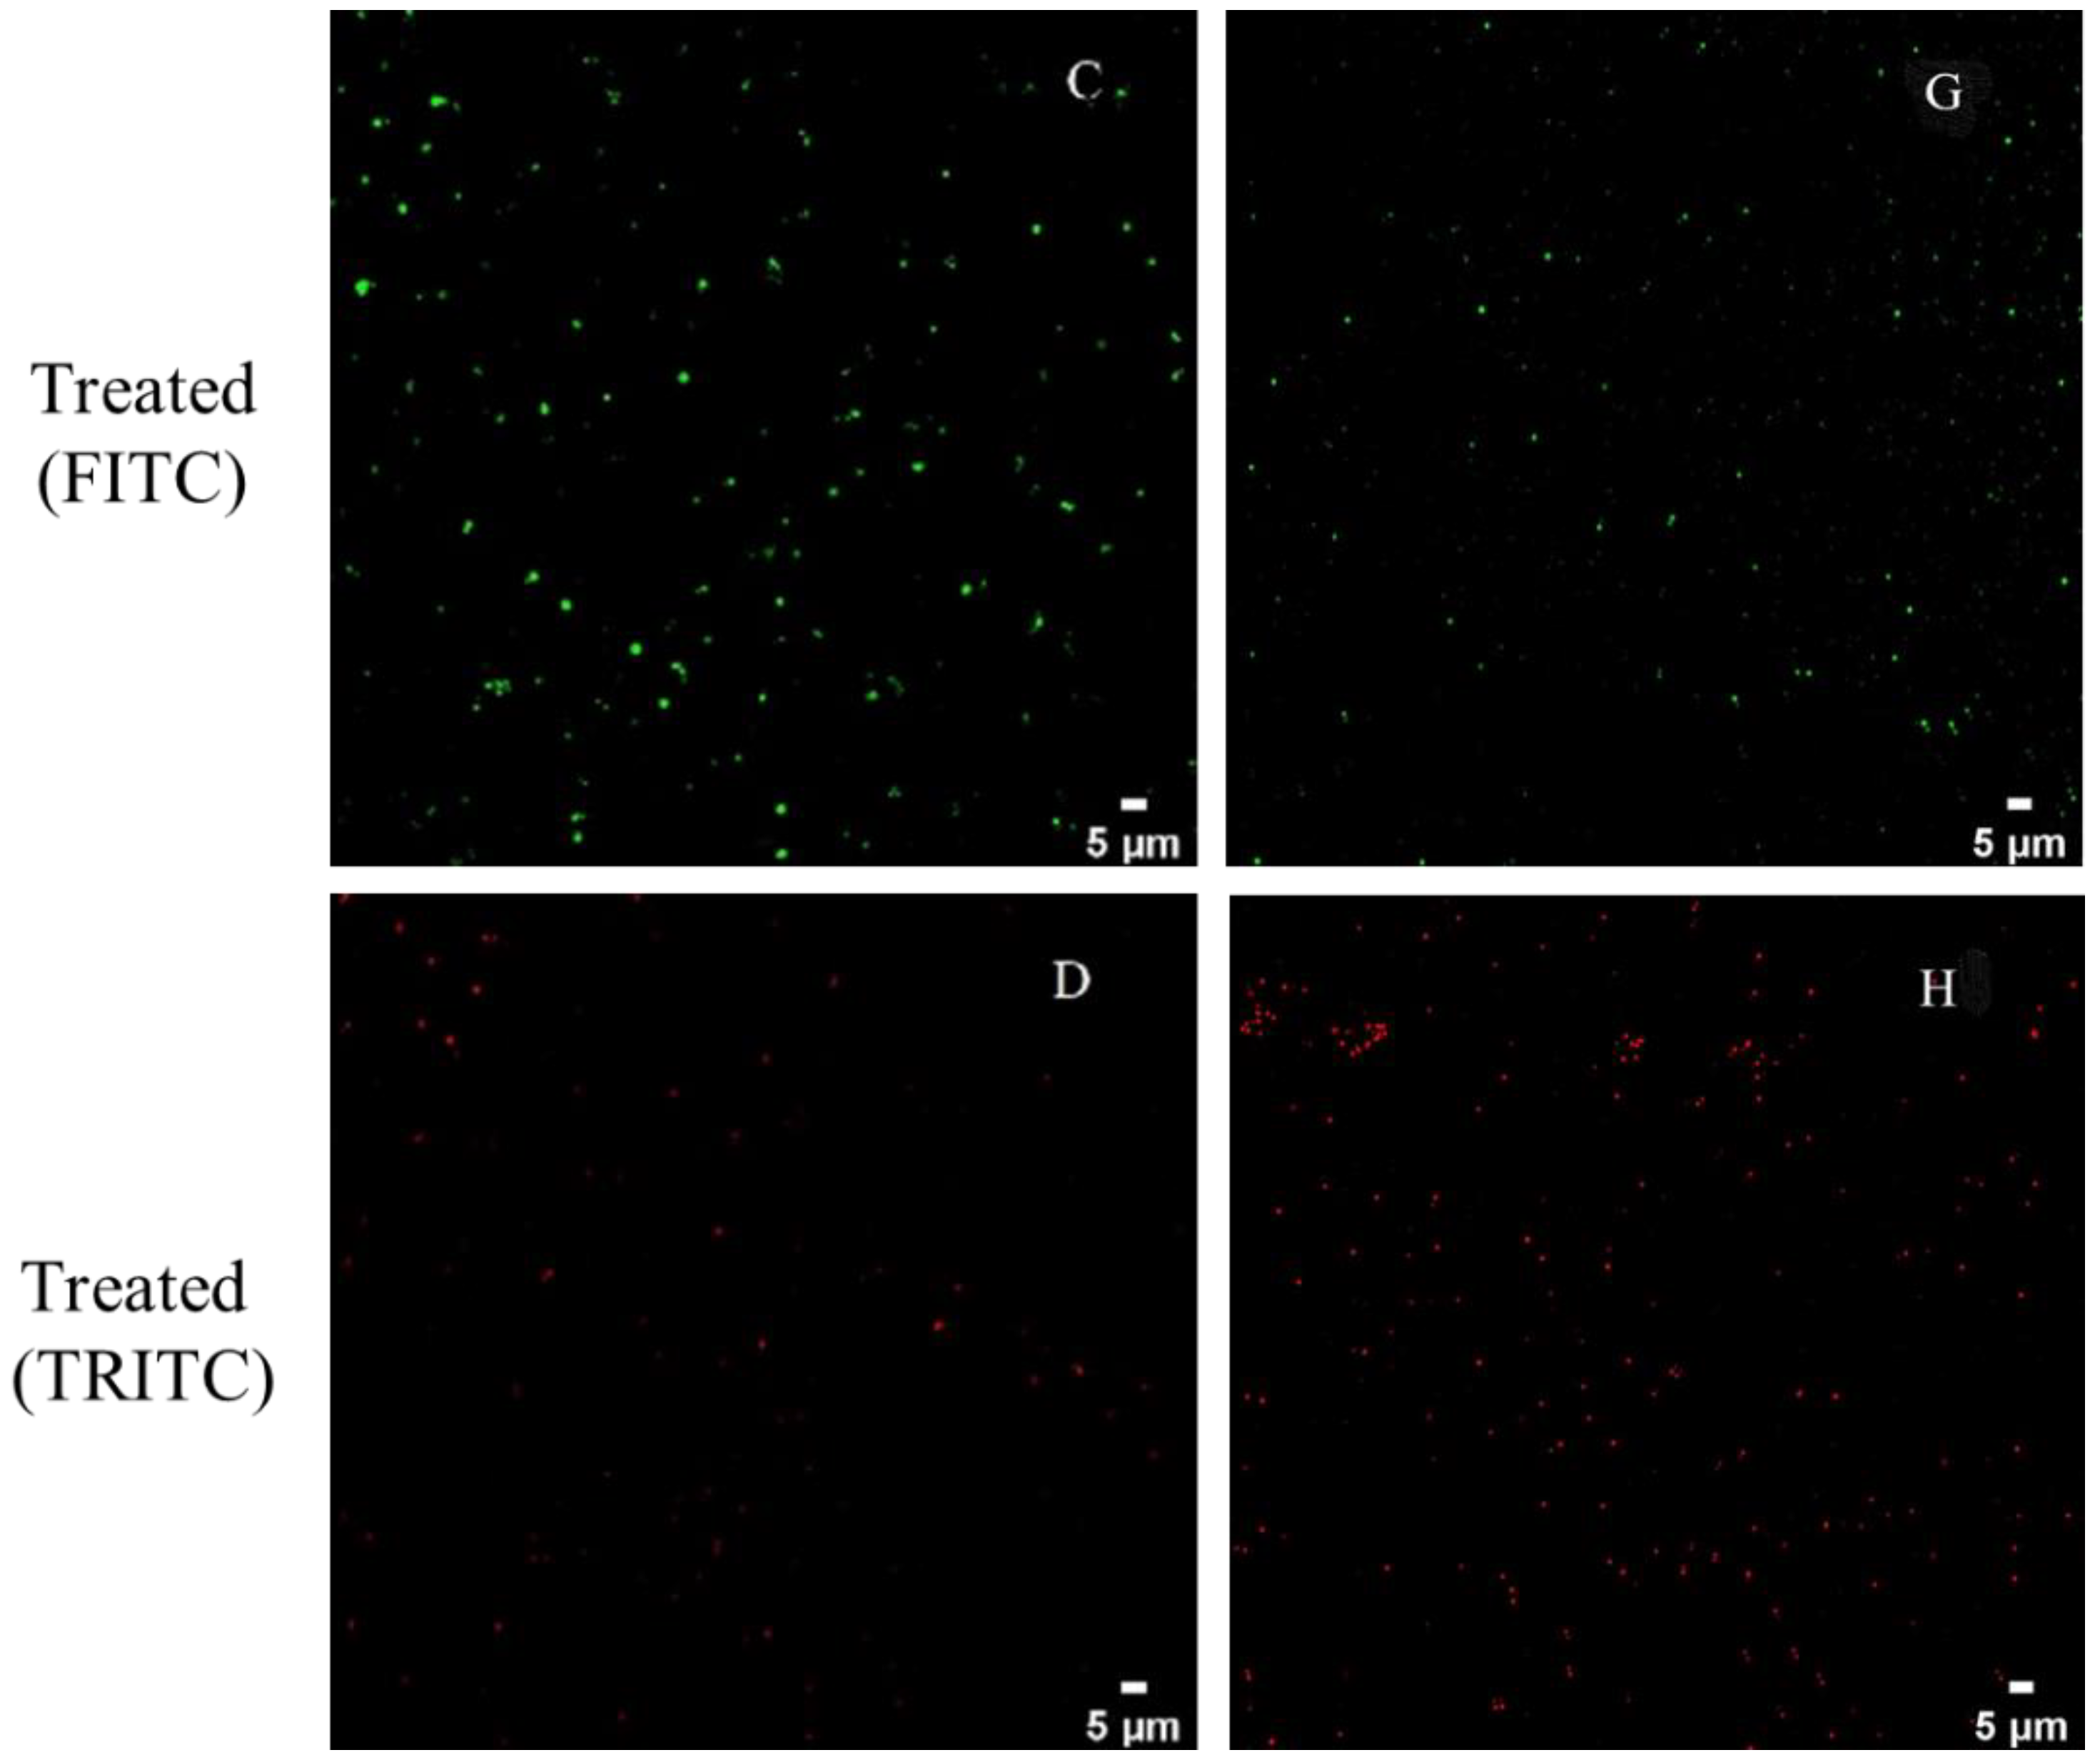
3.3. CLSM Observations

Using fluorescent dyes to stain the cells, as shown in Figure 3, most S. aureus cells in the two control groups were stained green, indicating that the bacteria survived and the cell membranes were intact. However, most BA-26 cells stained red after 1 week of low-temperature treatment and only a small portion was green, indicating that the number of cells with intact membranes was significantly reduced (p < 0.05). In contrast, most of the BB-11 cells were still green after 1 week of low-temperature treatment, and only a small portion of the cells was red. Based on these results, BB-11 still retained its cell membrane integrity after low-temperature treatment, and the membranes of only a few cells lost selective permeability and exhibited red fluorescence; the number of dead cells only increased to a lower extent. After BA-26 underwent low-temperature treatment, most of the cell membranes lost selective permeability and a substantial number of dead cells was observed.

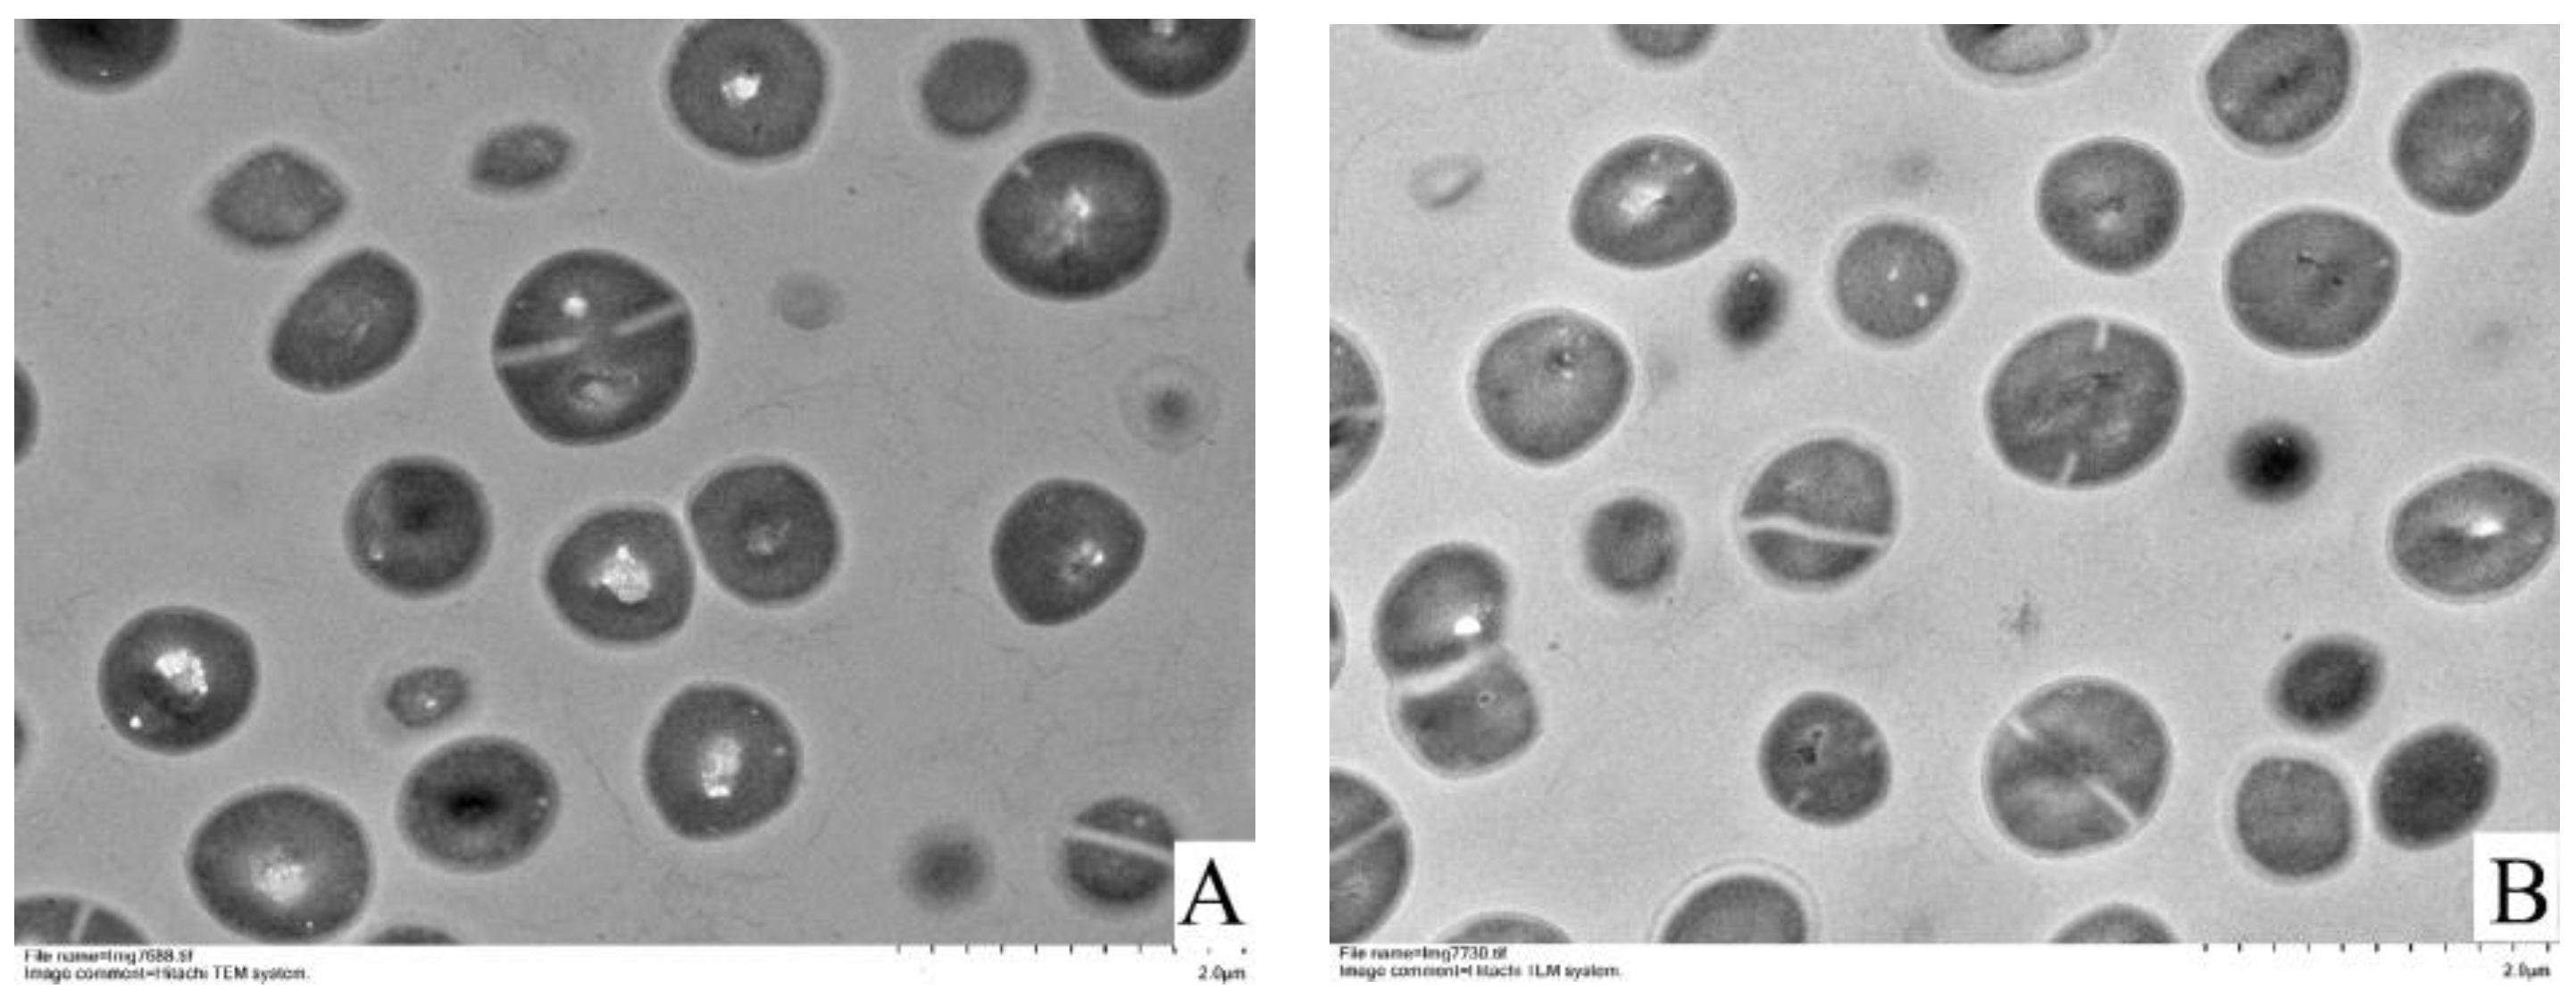
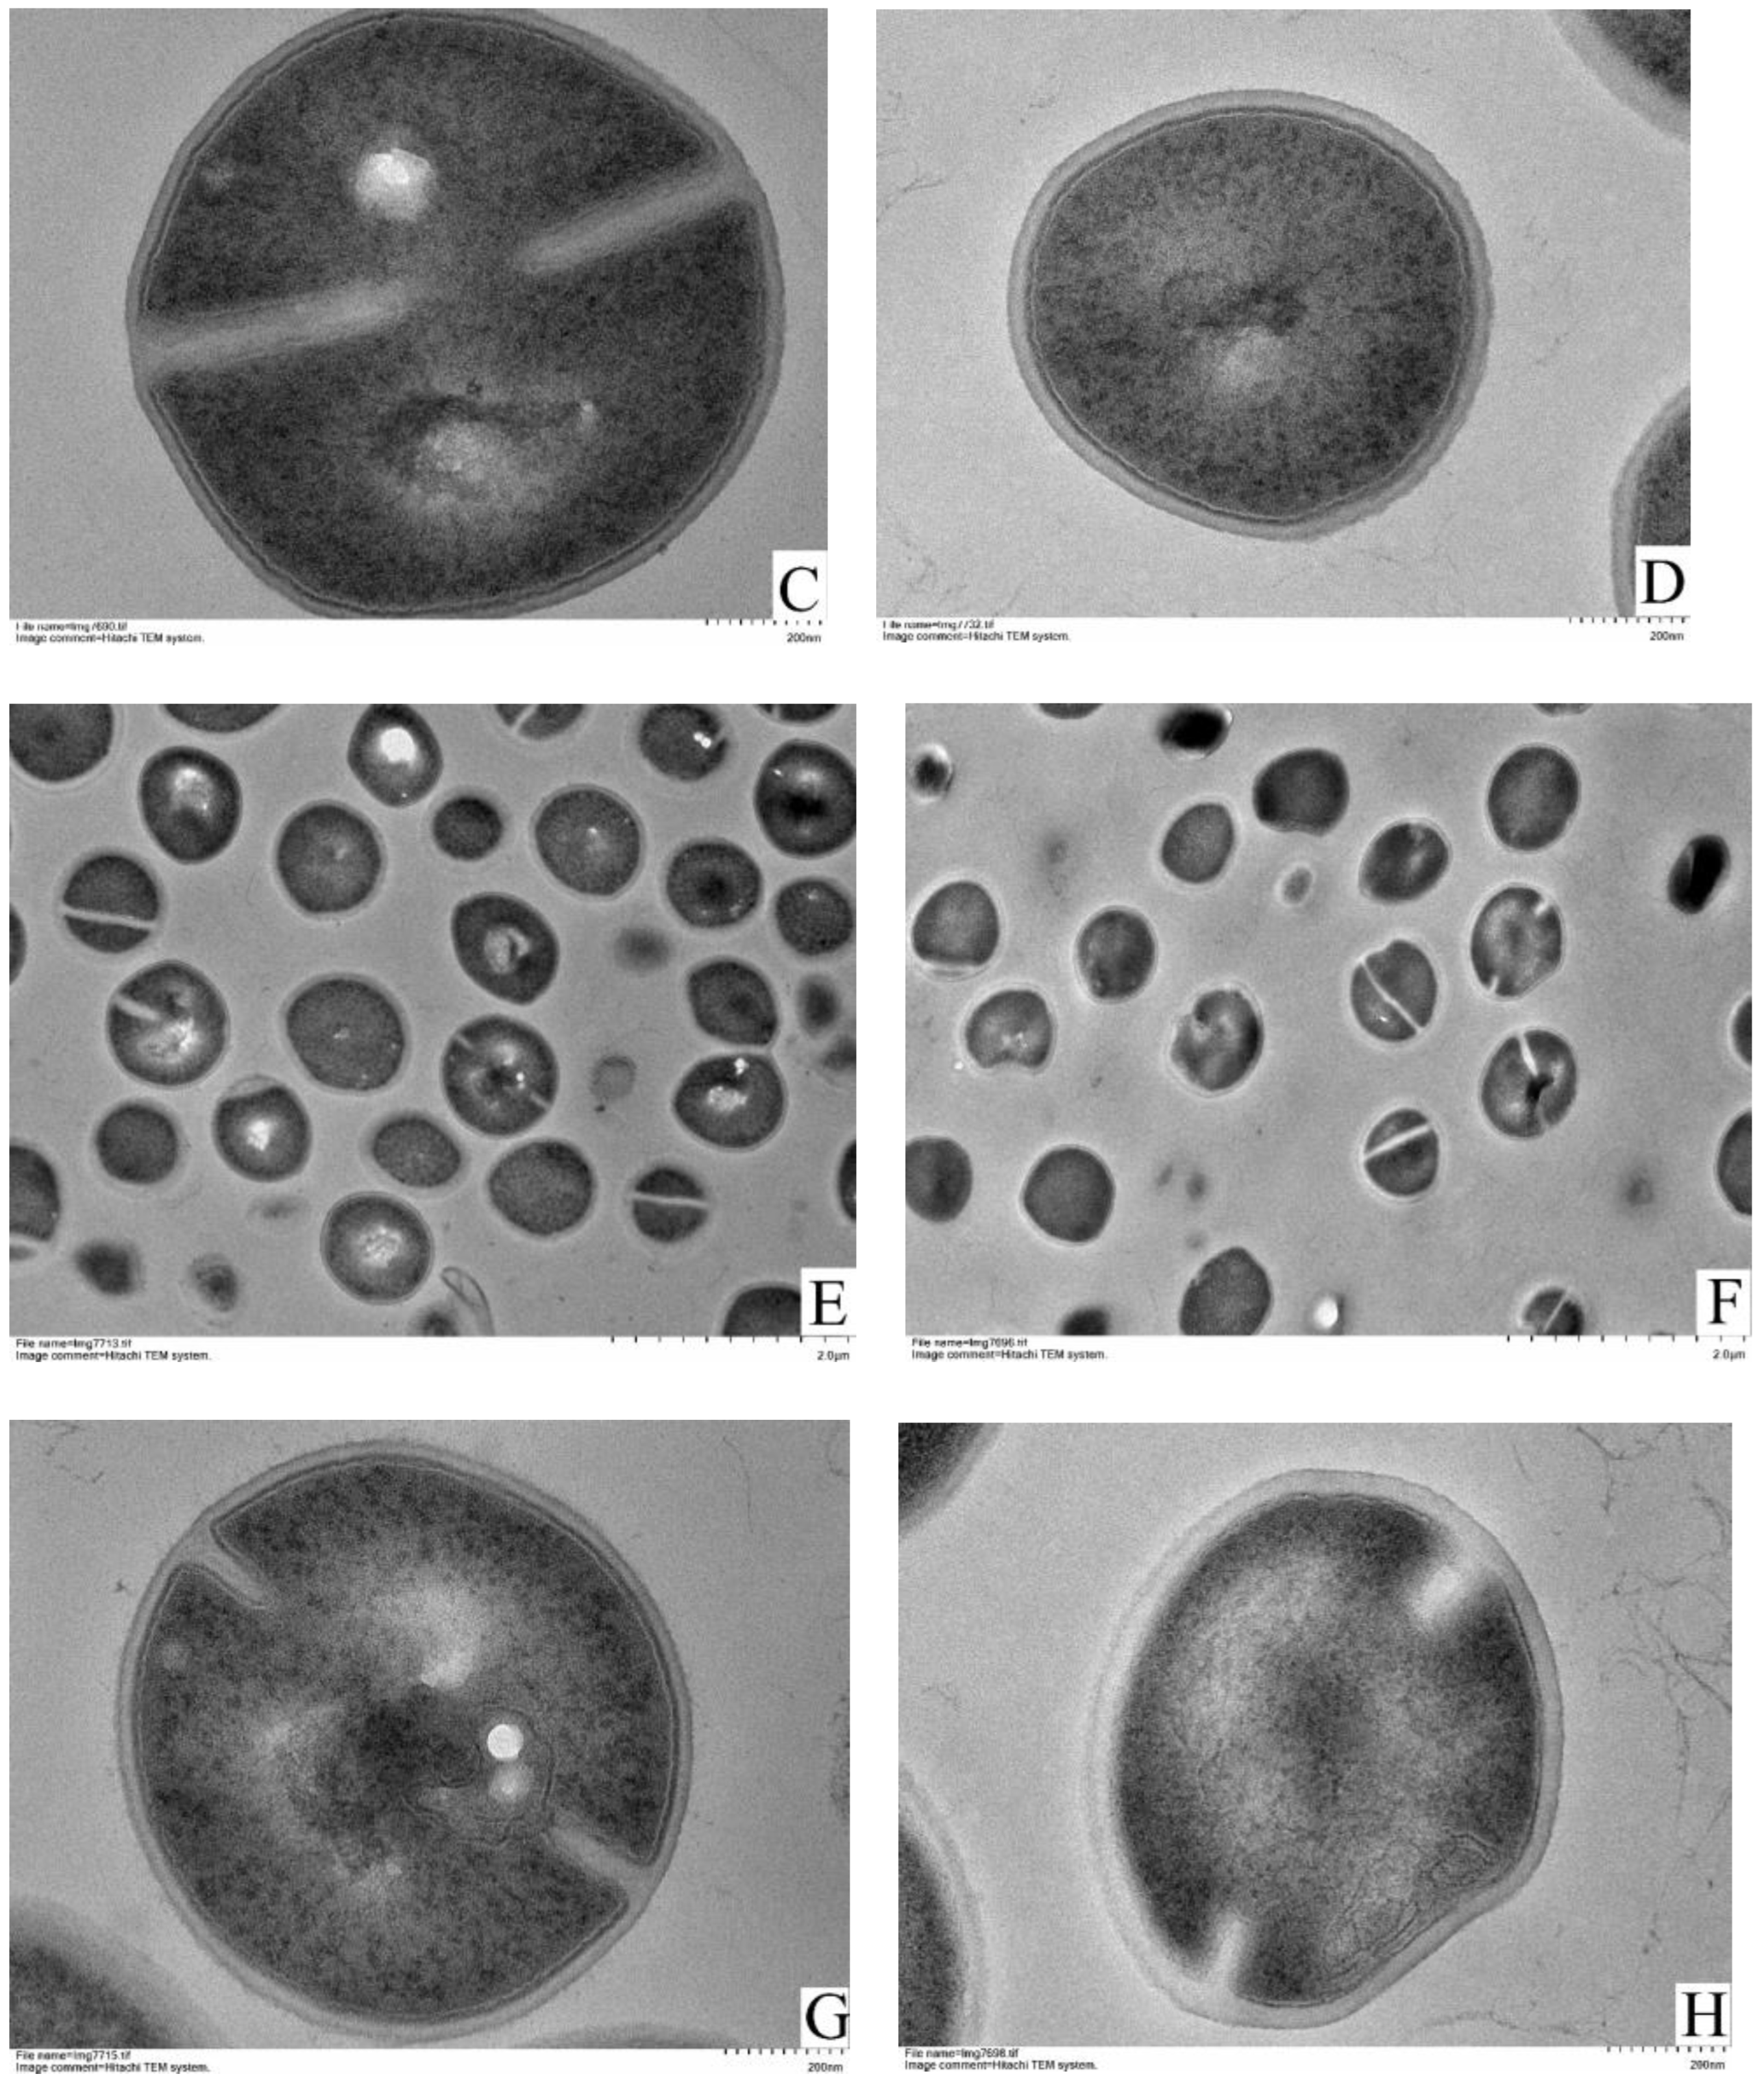
3.4. TEM Observations

As shown in Figure 4, transmission electron microscopy showed that the cell wall and cell membrane were intact. The membrane integrity of BB-11 cells was not different from that of fresh cells, and only a few cells were wrinkled. When BA-26 was exposed to a low temperature, most of the cell profiles were changed, and the number of cells with a crinkled morphology accounted for 35.71% of all cells in the field of view (white arrows indicate cells with more severe cell membrane wrinkling). Therefore, after low-temperature treatment, the BB-11 cell membrane changed to a lesser extent while the BA-26 cell membrane was more wrinkled in a greater number of cells, consistent with the results of intracellular nucleic acid leakage and confocal laser scanning microscopy analyses.

3.5. RNA-Seq Data Processing and Analysis

Utilizing the Illumina sequencing platform, 25,902,410 raw reads were collected for the BB-11 control group, with 25,820,182 clean reads (99.68%) obtained after strict filtration; the BA-26 control group produced a total of 22,096,186 raw reads, and 22,015,042 (99.63%) clean reads were obtained after filtering. The BB-11 low-temperature treatment group produced 24,717,450 raw reads and 24,627,788 clean reads (99.63%); the BA-26 low-temperature treatment group produced 24,585,384 raw reads and 24,436,924 clean reads (99.39%). The Q20 values of the samples were >98%. After further removal of contamination and low-quality sequences, all remaining reads were aligned to the reference transcriptome to map to the existing gene annotations, which contained 2745 genes. A total of 2745 known genes were successfully annotated, and no new genes were identified. All these data indicated that the sequencing quality was sufficiently high for further analysis.

3.6. Differentially Expressed Genes (DGEs) in S. aureus with Different Responses to Low Temperature
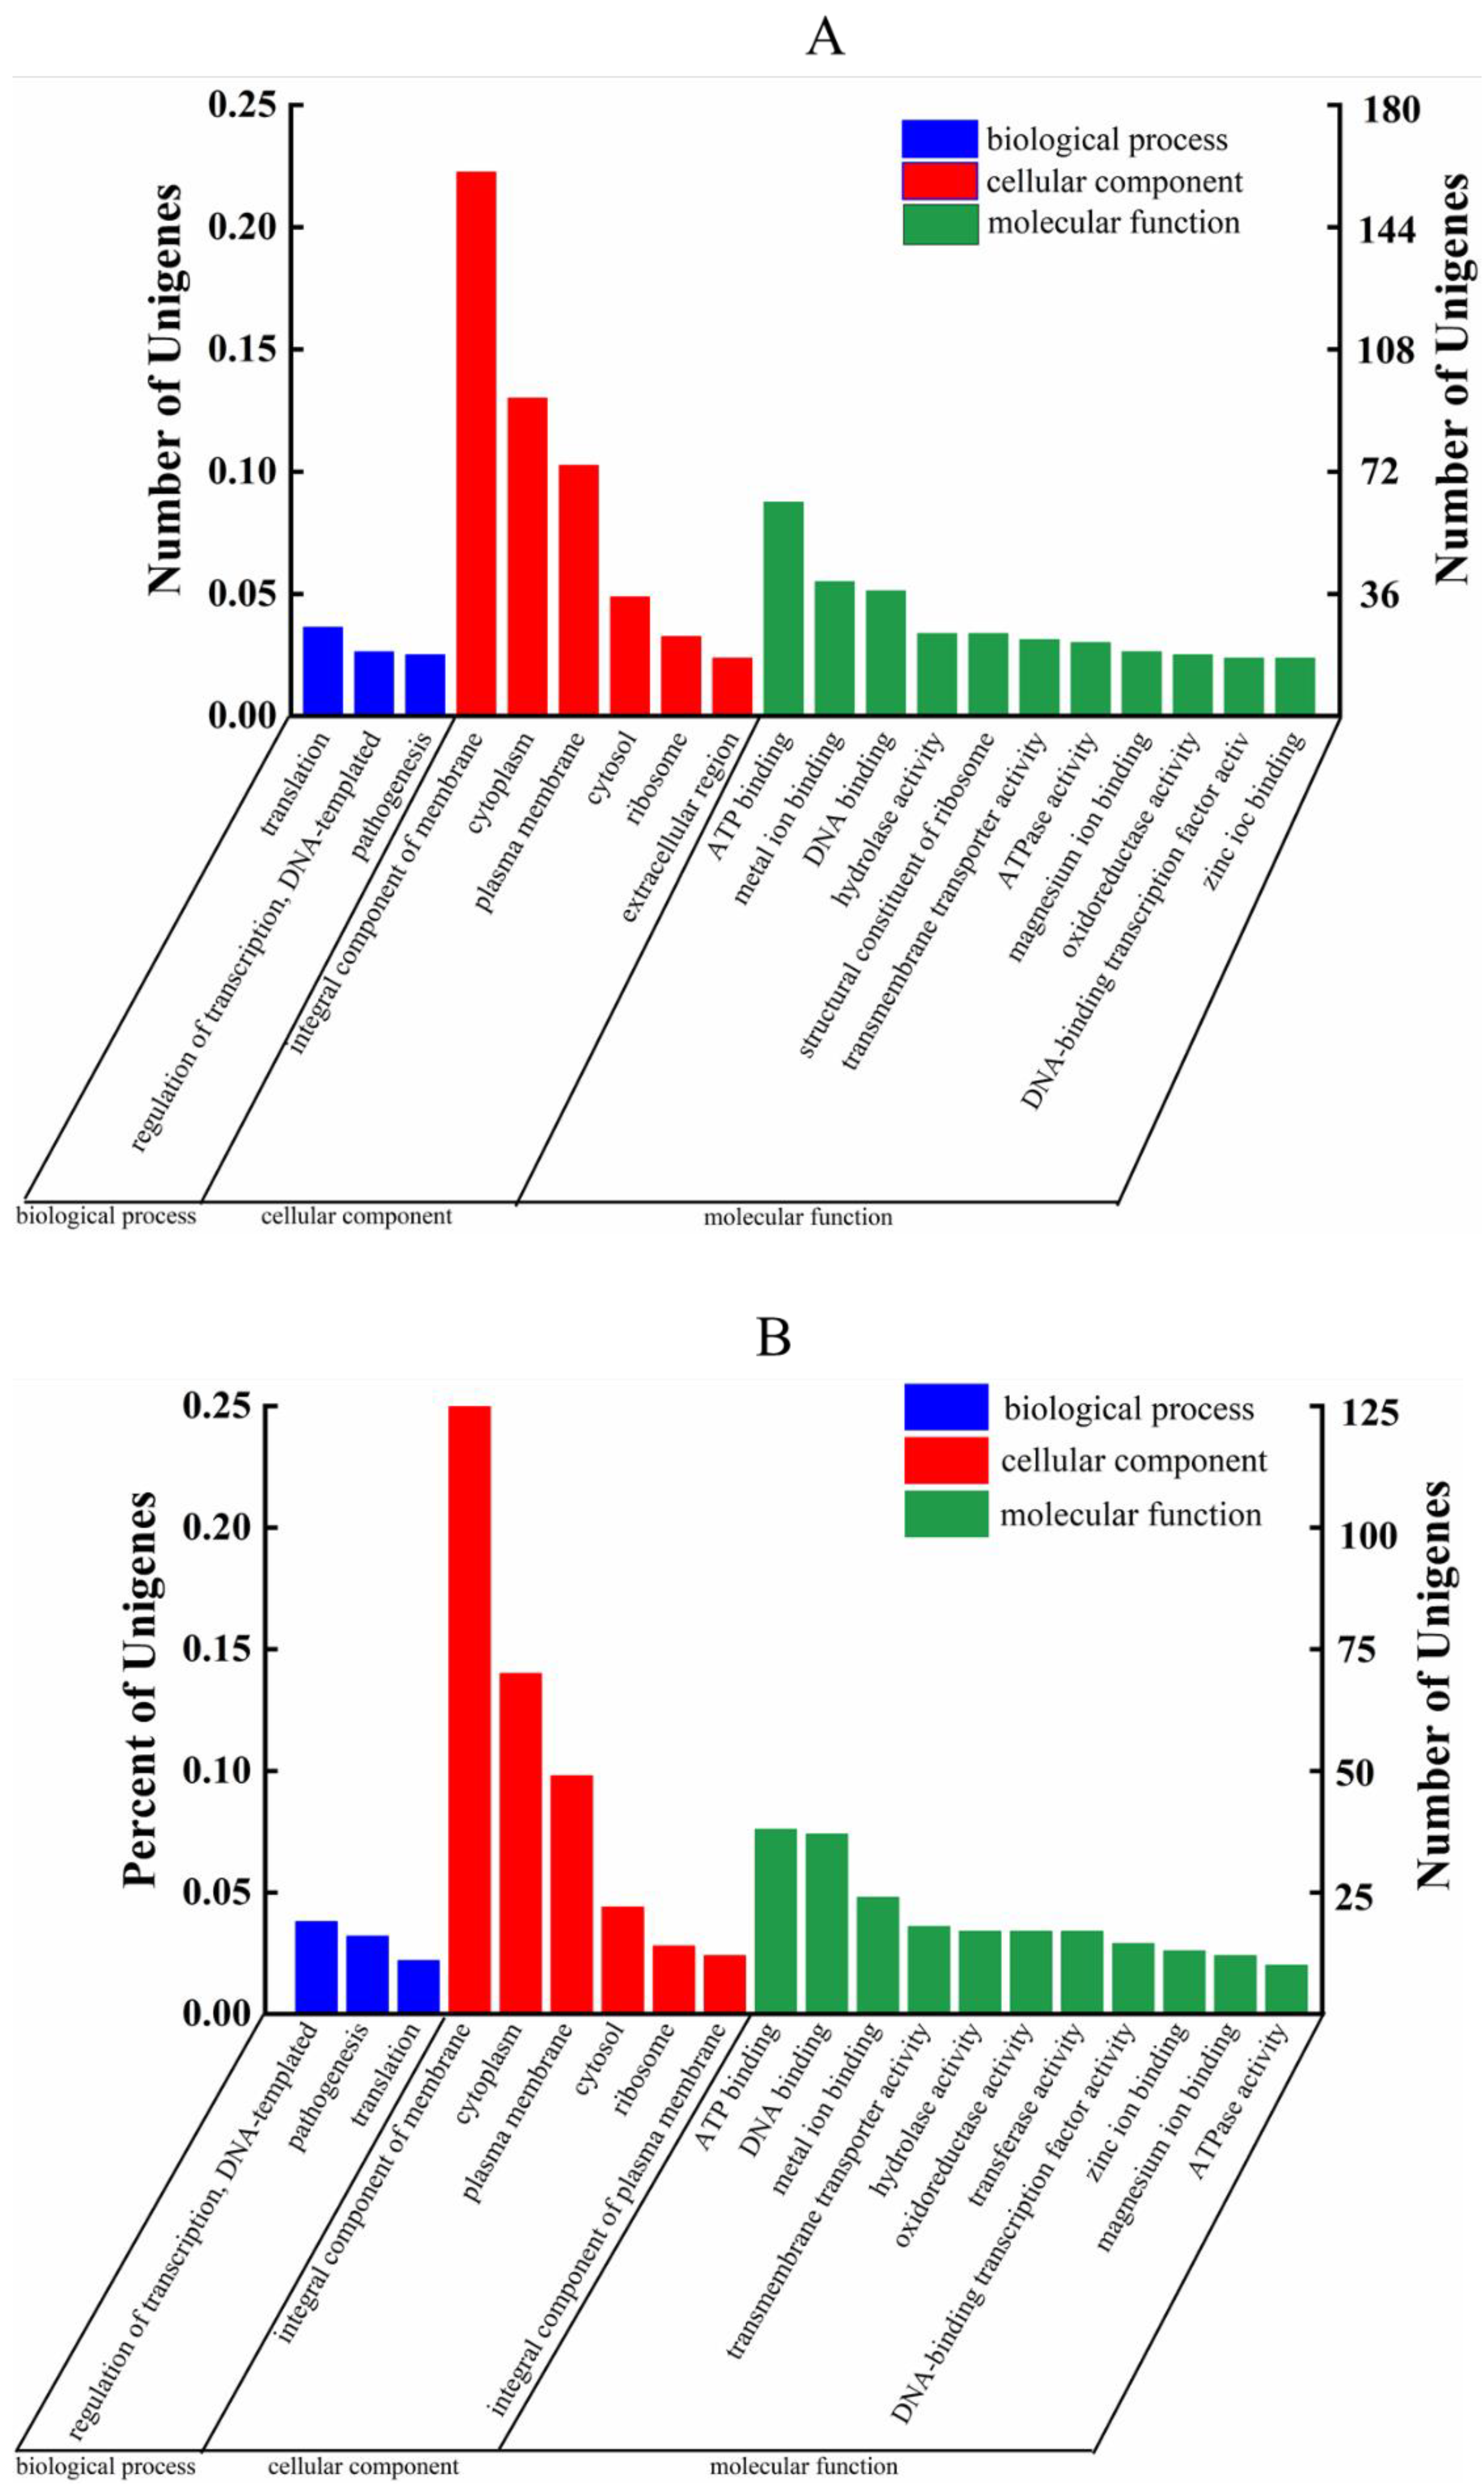
Figure 5 shows the common and uniquely expressed genes in two different S. aureus. Eight hundred and thirty-three genes were significantly differentially expressed in the BB-11 group, of which 424 genes were upregulated and 409 genes were downregulated. Five hundred and twenty-seven genes were significantly differentially expressed in the BA-26 samples, of which 292 genes were upregulated and 235 genes were downregulated. Interestingly, ten genes were upregulated in the BA-26 group but were downregulated in the BB-11 group; only one gene was upregulated in the BB-11 group but downregulated in the BA-26 group.

3.7. GO Analysis

As shown in Figure 6, 70 DEGs were annotated in biological processes, 337 DEGs were annotated in molecular functions and 448 DEGs were annotated in cellular components in the comparison with the BB-11 group. In the comparison with the BA-26 group, 46 DEGs were annotated in biological processes, 219 DEGs were annotated in molecular functions and 294 DEGs were annotated in cellular components.

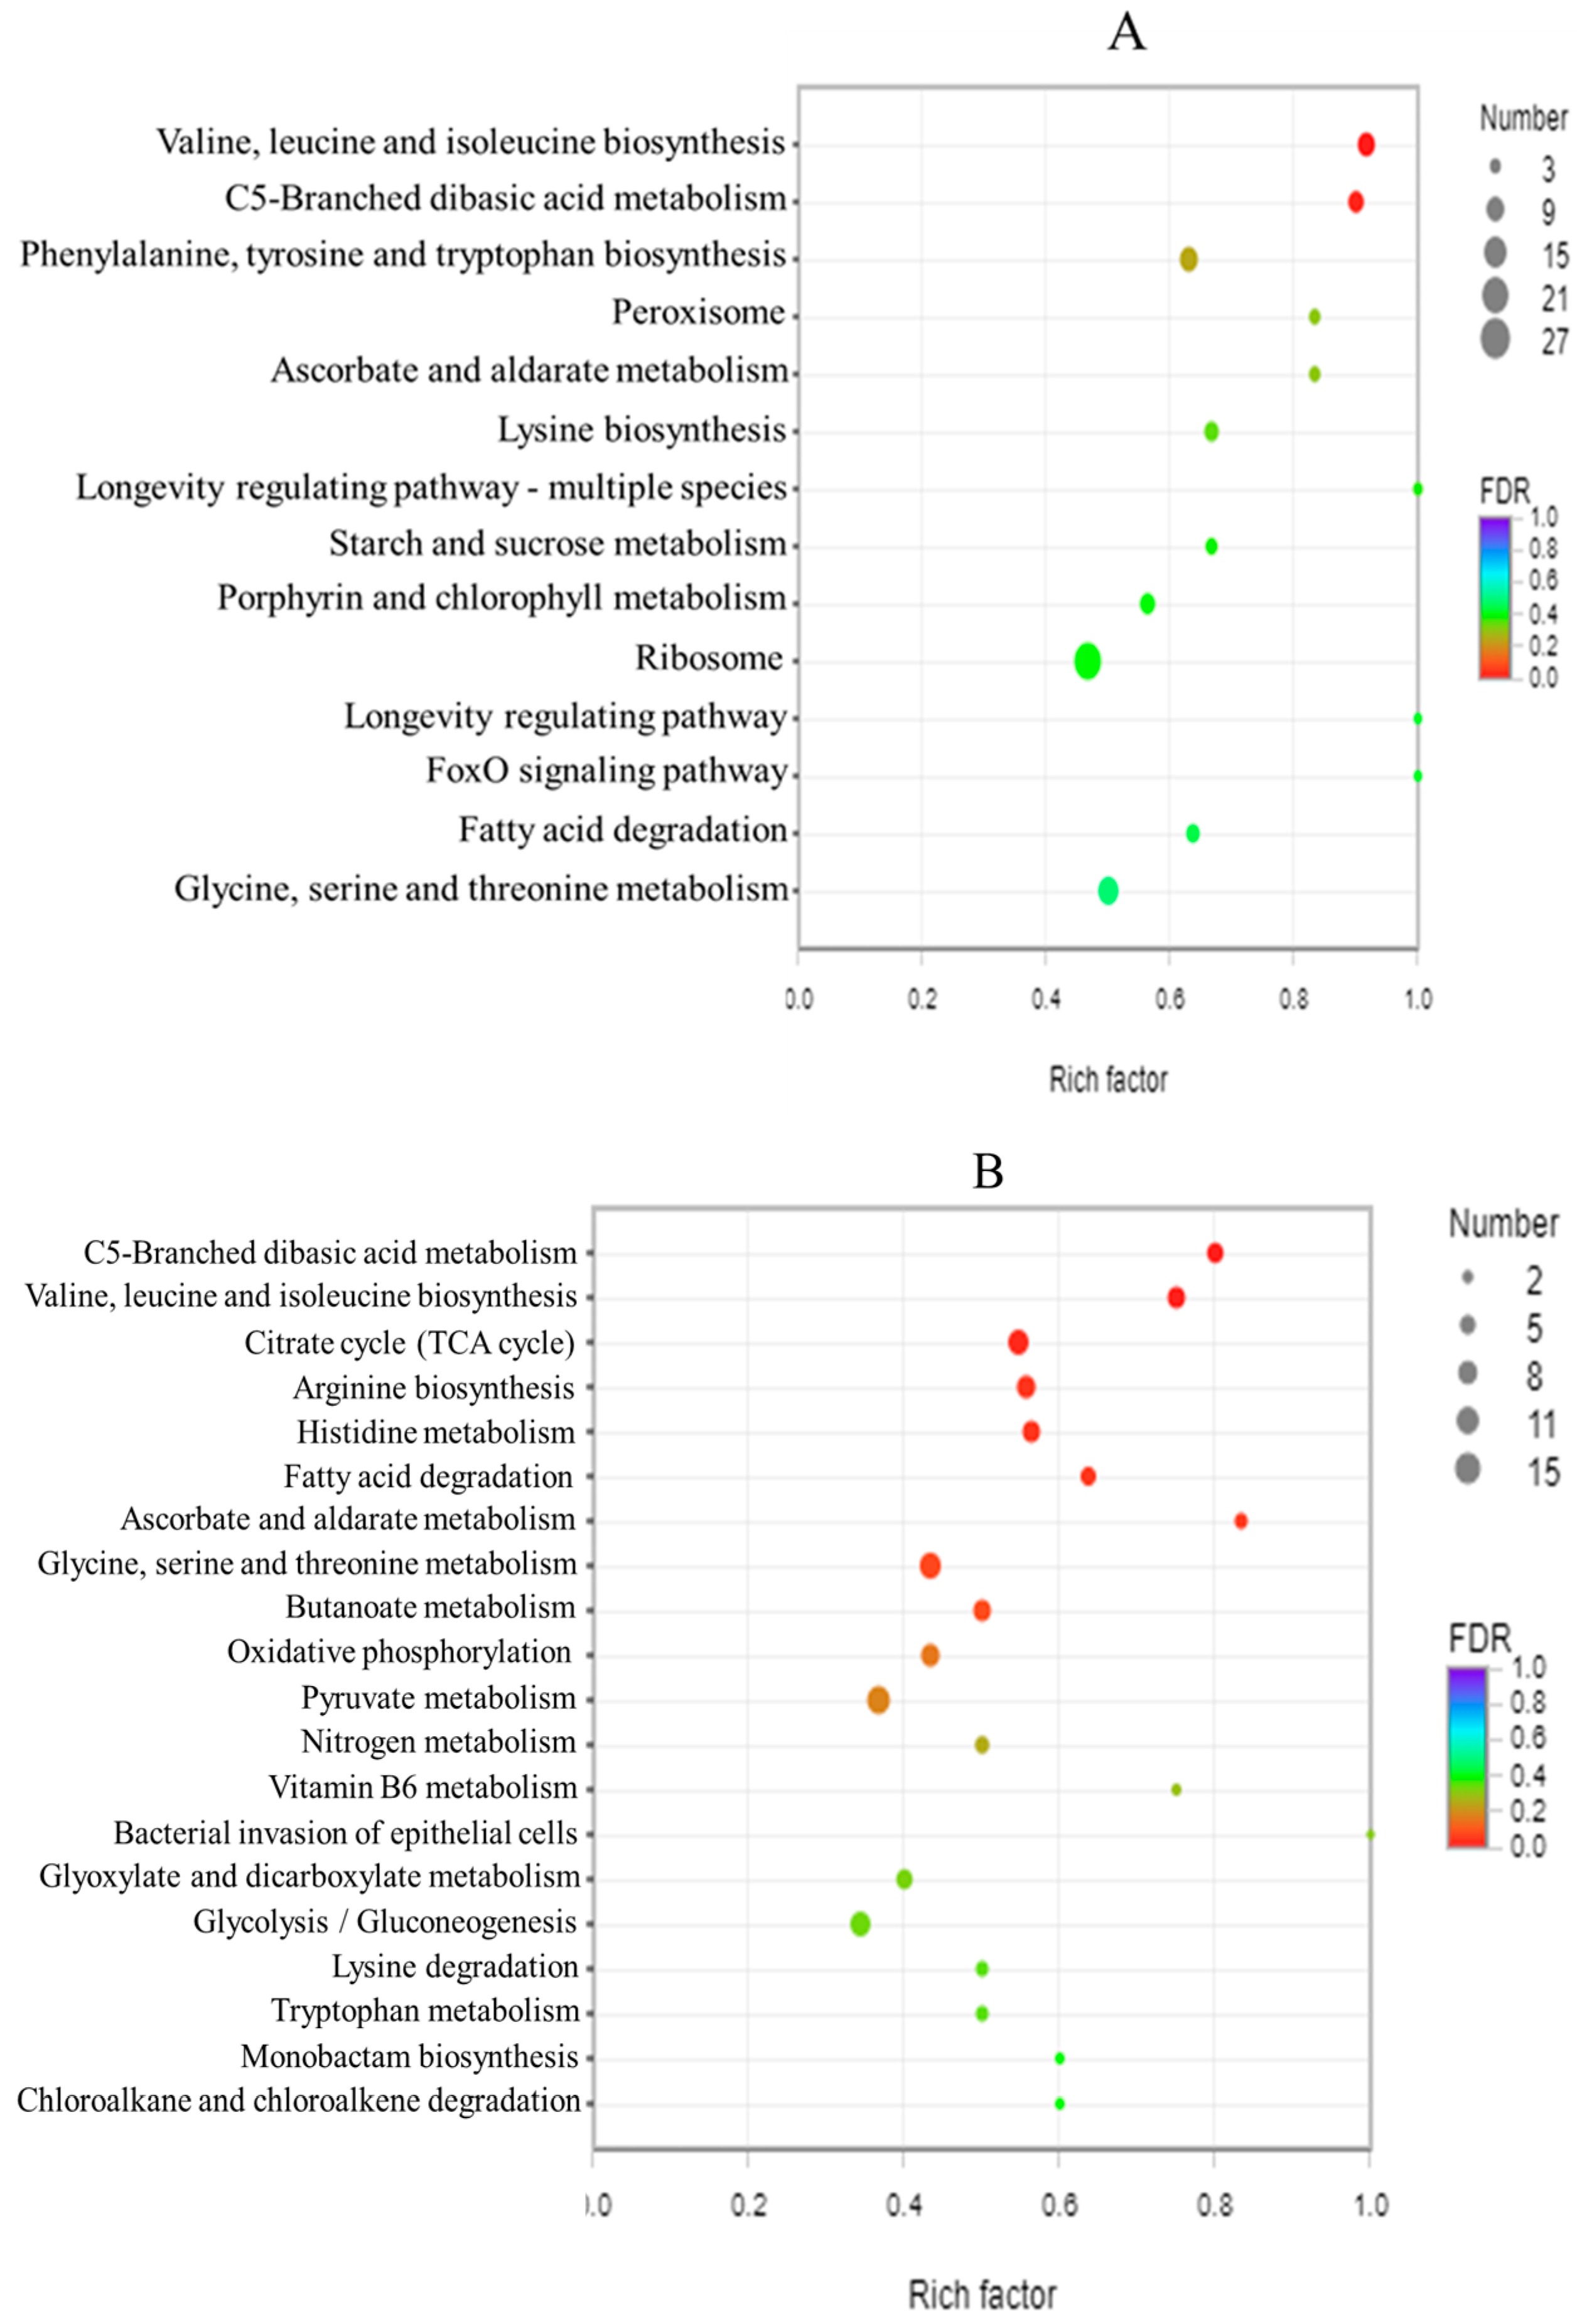
3.8. GO Enrichment Analysis and KEGG Enrichment Analysis

The top 20 functions annotated to enriched GO terms for the differentially expressed genes in two S. aureus strains are shown in Figure 7. The GO enrichment analysis mainly includes three major categories: biological process, cellular component, and molecular function. Sodium ion transport (GO: 0006814) was the dominant biological process observed in the BB-11 group. Cation: cation antiporter activity (GO: 0015491), monovalent cation: proton antiporter activity (GO: 0005451), and acting on NAD(P)H, quinone, or a similar compound as the acceptor (GO: 0016655) were the three dominant molecular functions identified in the BB-11 group. However, in the BA-26 group, two dominant molecular functions were identified, cytochrome-c oxidase activity (GO: 0004129) and heme-copper terminal oxidase activity (GO: 0015002), and one biological process was identified, the arginine catabolic process (GO: 0006527). The GO analysis showed that the DEGs were associated with various processes involving different molecular functions, biological processes, and cellular components.
In Figure 8, according to the KEGG pathway classification results, the most enriched pathways included the longevity regulating pathway (KEGG ID: map04213) and the FoxO signaling pathway (KEGG ID: map04013, KEGG ID: map04068, and KEGG ID: map05016) in the BB-11 group. In the BA-26 group, bacterial invasion of the epithelial cells (KEGG ID: map05100), ascorbate and aldarate metabolism (KEGG ID: map00053), and C5-branched dibasic acid metabolism (KEGG ID: map00660) were the main enriched pathways.

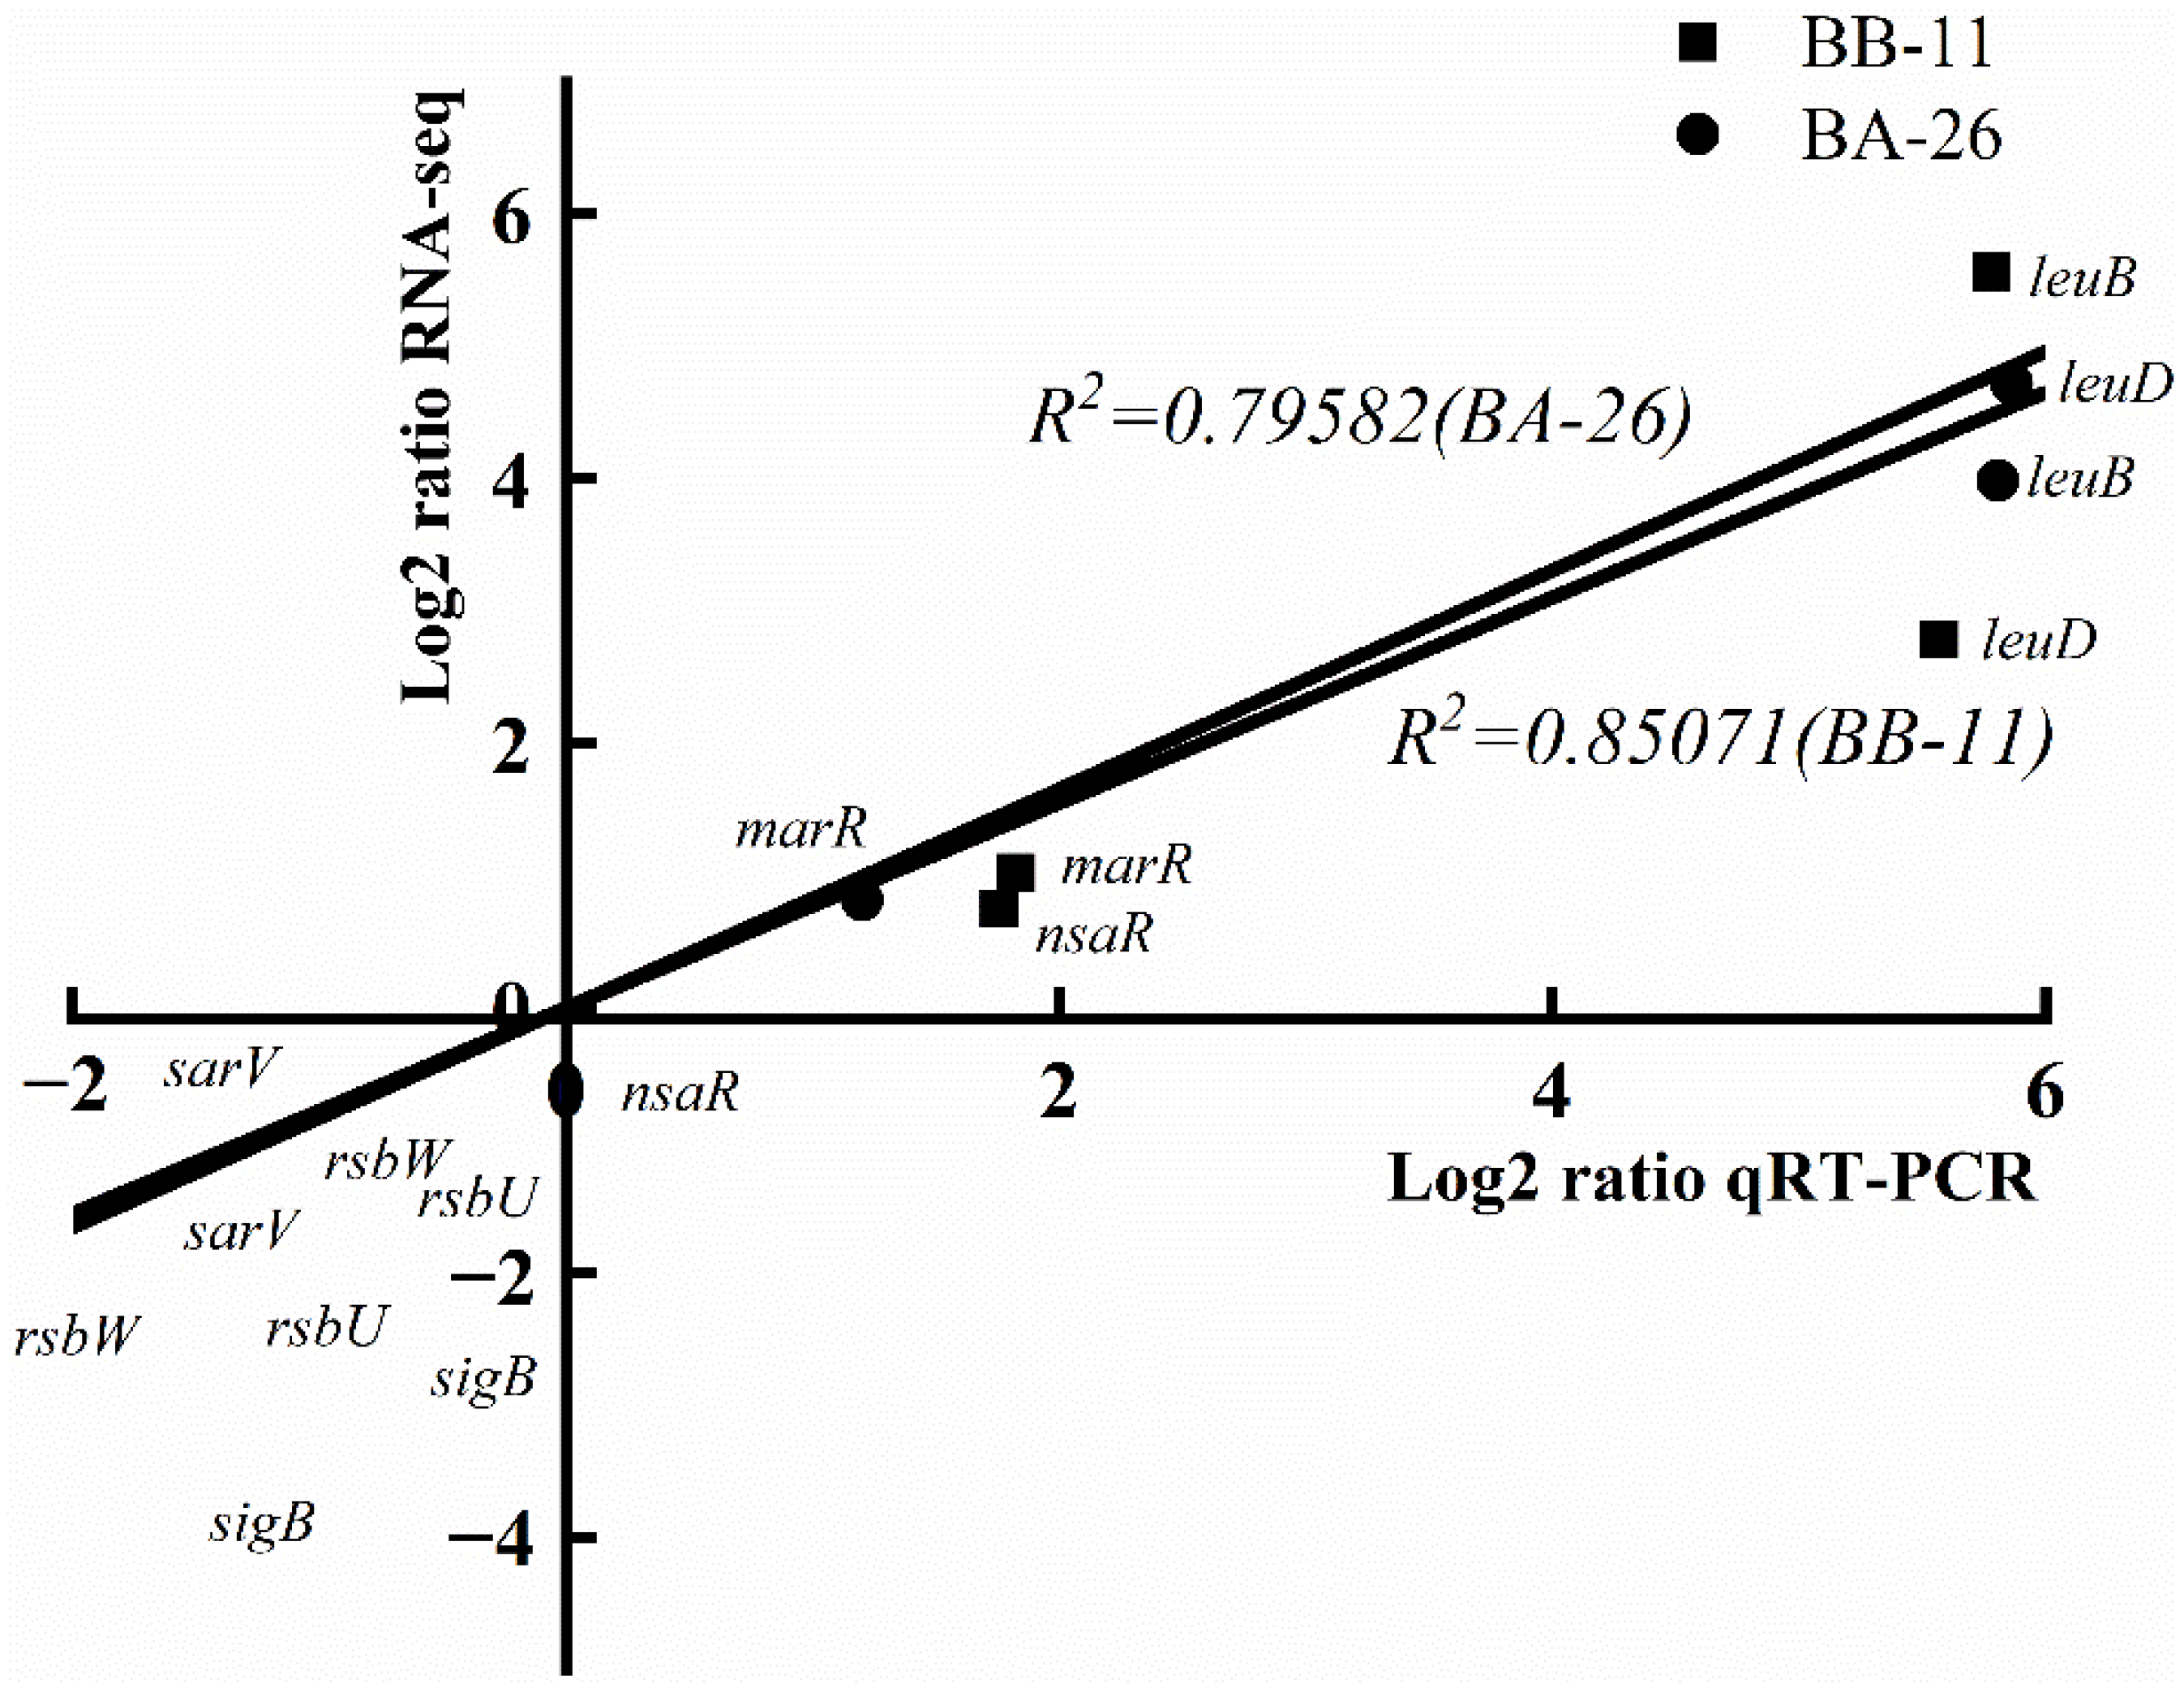
3.9. qRT–PCR Validation

Eight randomly selected genes were verified using qRT–PCR, and the results were compared with the results of RNA-seq to determine the consistency of the two approaches; the results are shown in Figure 9. Moreso, qRT–PCR data correlated well with the RNA-seq data (BB-11 group: R2 = 0.79582, BA-26 group: R2 = 0.85071). Generally, the qRT–PCR data were similar to the RNA-seq analysis of these genes, although the specific fold change values were different.

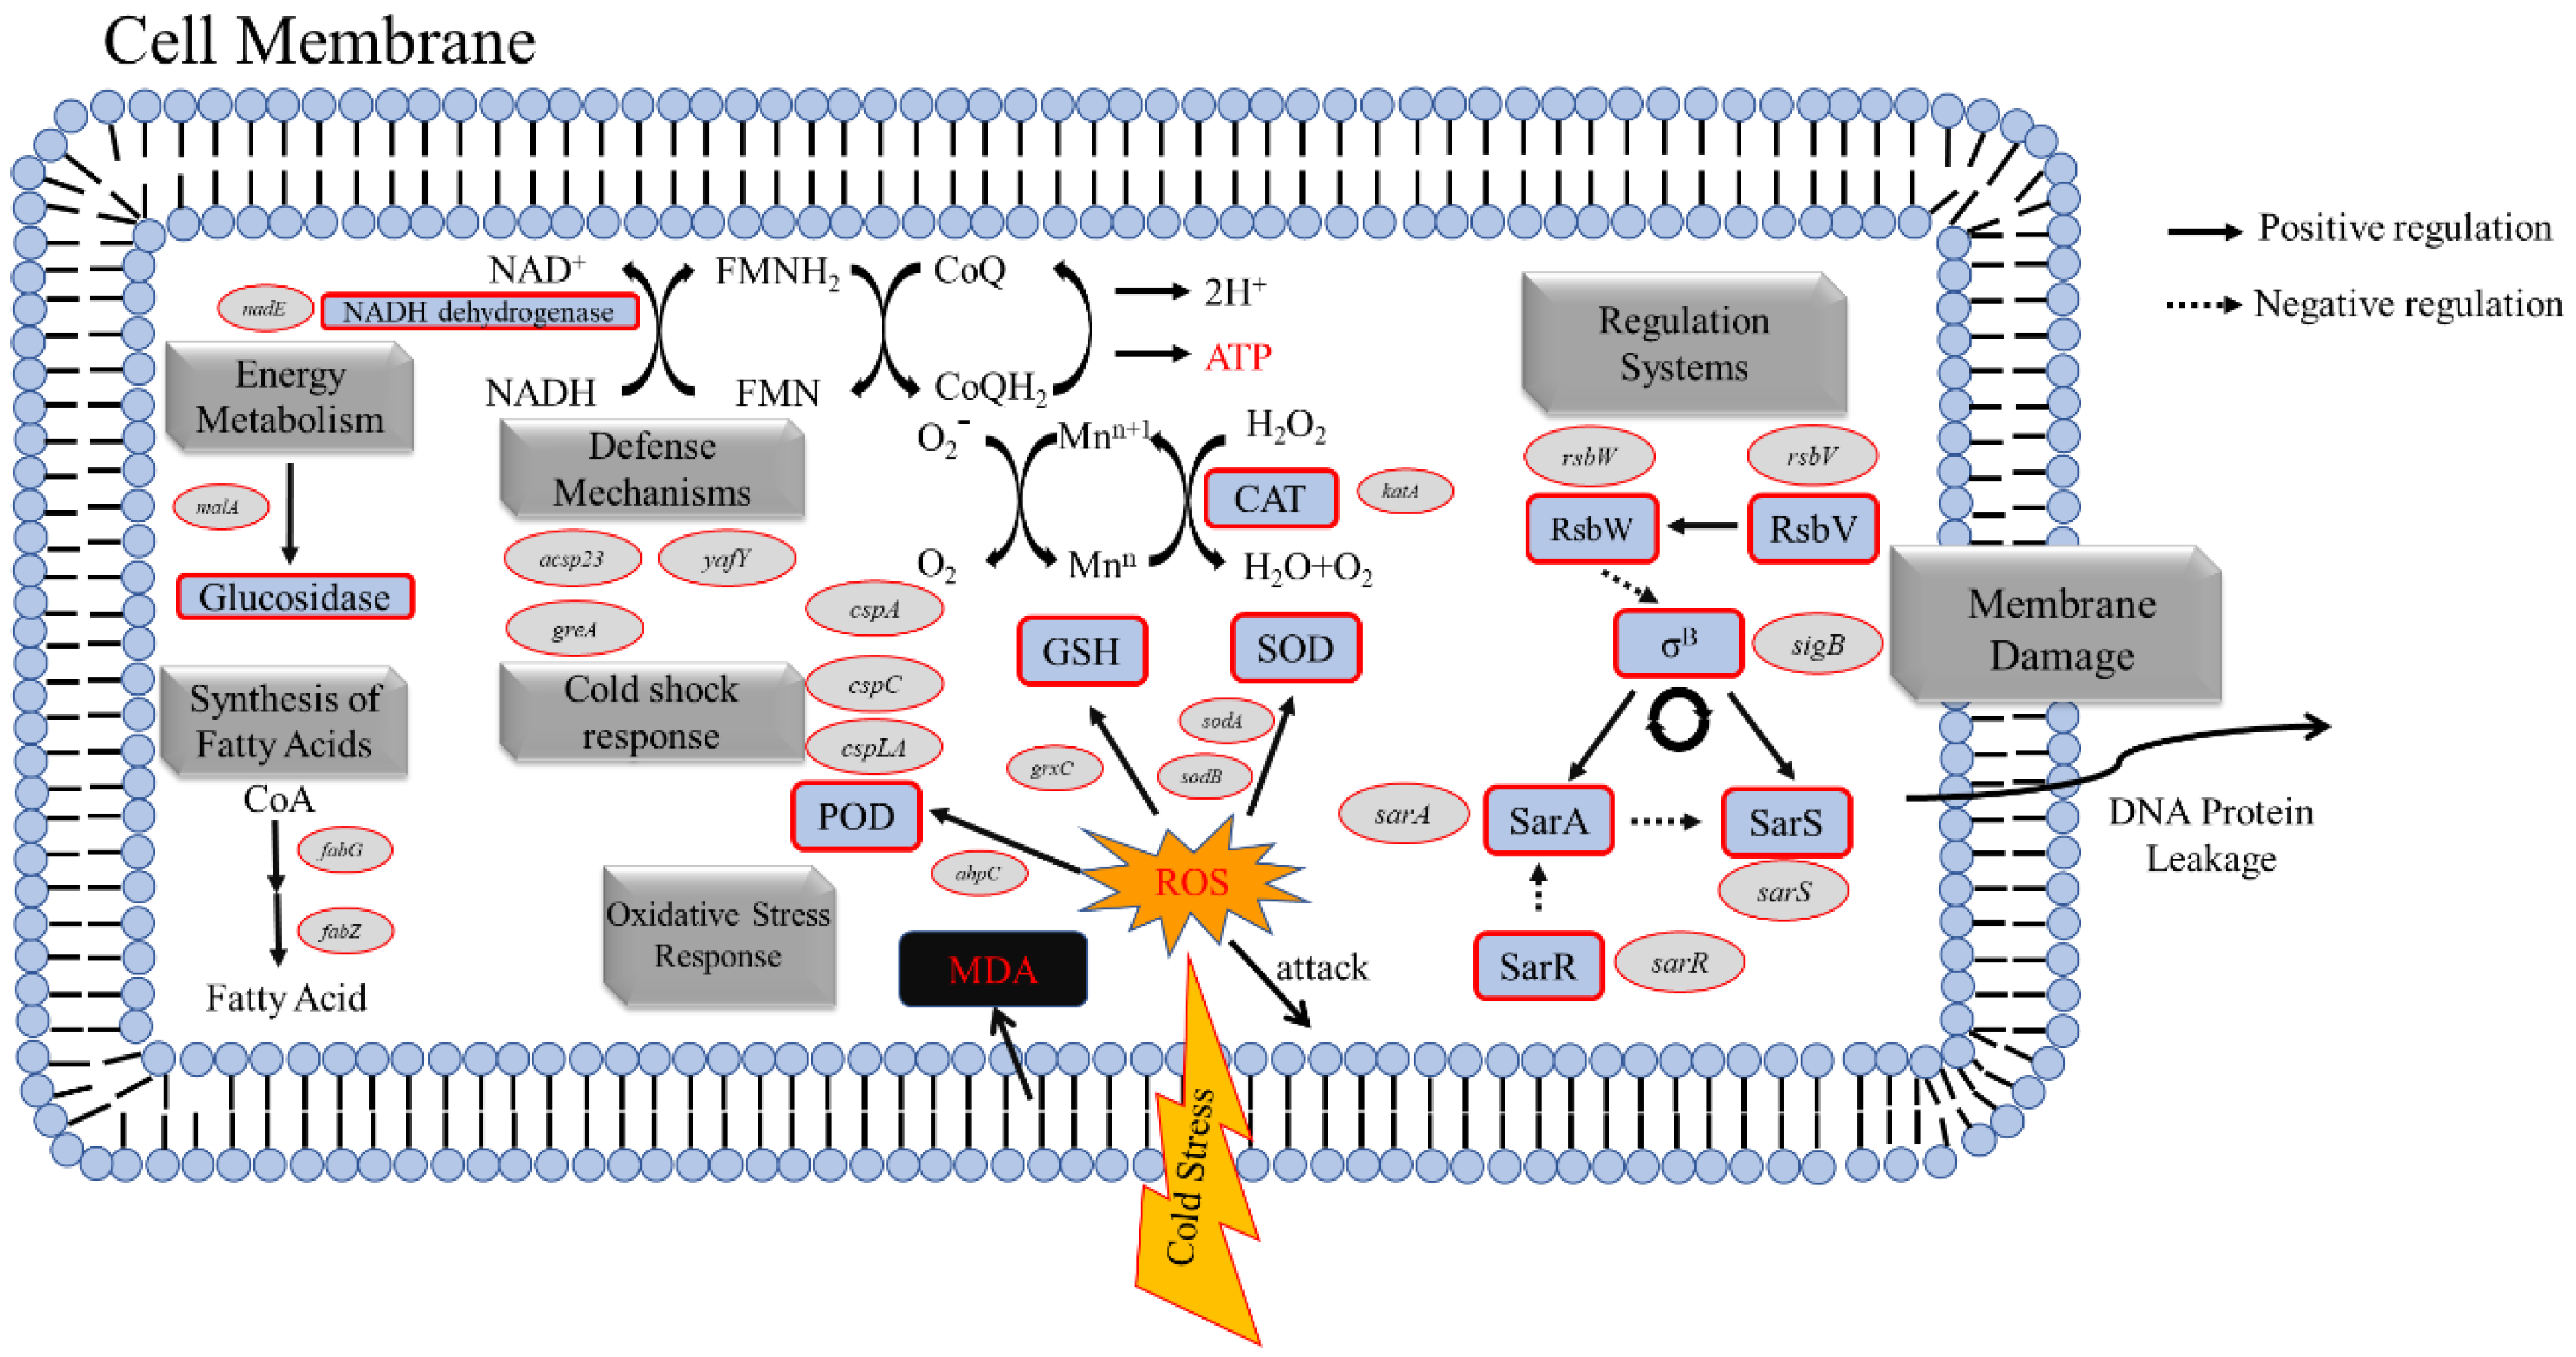
3.10. Differentially Expressed Genes (DEGs) in Response to Low-Temperature Treatment

3.10.1. DEGs Related to Fatty Acid Synthesis in The Cell Membrane of S. aureus

Based on the results of confocal laser scanning microscopy and transmission electron microscopy, the two strains of S. aureus exhibit quite different cell structures. The cell membrane integrity of BB-11 was better than BA-26. Fatty acids are the main components of cell membranes, and bacteria respond to environmental changes by changing the fatty acid composition of cell membranes mainly by altering the expression of related genes in the fatty acid synthase system. The expression levels of fab family genes related to fatty acid synthesis in the cell membrane were quite different between BB-11 and BA-26, as shown in Table 2. The expression level of the fabG gene in BB-11 was significantly higher than that in BA-26 (p < 0.05) at 1.056 and 0.46 log2(FC), respectively; however, the expression of the fabZ gene was downregulated in BB-11 and BA-26 by −2.53 and −0.82 log2(FC), respectively.
The fab family genes are mainly involved in regulating fatty acid synthesis in cell membranes (Figure 10); fabG encodes ketoreductase, which reduces ethyl4-chloro-3-oxobutanoate [31], and fabZ encodes an enoyl-acyl carrier protein reductase with a role in the fatty acid biosynthesis step and completion of the extension step [32]. Through RNA-seq analysis, we found that the transcription of fab family genes in the two strains of S. aureus was substantially altered after low-temperature treatment, and only fabG expression was upregulated in BB-11. The upregulation of fabG expression may contribute to the production and maintenance of cell membranes to provide a lipid supply, similar to the results of previous studies [10,33]. Therefore, low temperatures damage cells membranes, and the upregulation of the fabG gene in BB-11 may repair damaged cell membranes following exposure to a low temperature and resist low-temperature stress to improve the cell membrane structure of BB-11 compared with BA-26.

3.10.2. DEGs Related to Oxidative Stress in S. aureus

After a long period of low-temperature treatment, the antioxidant system may be destroyed, causing an increase in ROS levels in the cell [34]. SOD is an important part of the microbial redox system [35] and an important ROS scavenger for the cell, which plays a key role in the cellular antioxidant system that protects the cell from damage. Reduced glutathione is a widespread antioxidant in organisms, which scavenges free radicals and protects the structure and function of cell membranes [36] Catalase metabolizes hydrogen peroxide into water and oxygen to prevent oxidative damage to cells [37], and increased levels of catalase will reduce lipid peroxidation [38]. Peroxidase is also an oxidoreductase that converts ROS into less harmful products to reduce the damaging effect of hydrogen peroxide on cells [39]. However, MDA is one of the peroxidation products of bacterial lipid membranes [40]—when the oxidative stress response of bacteria is disrupted, the danger of ROS produced by the organism attacking cell membranes is intensified, thus leading to an increase in the lipid peroxide MDA content of S. aureus. The combined actions of these enzymes and antioxidants may constitute the body’s protective mechanism against oxidative stress, which removes excess ROS.
In the analysis of the oxidative stress response (Figure 10) (Table 2), the sodA and sodB genes encoding SOD and Mn/Fe-SOD, respectively, were downregulated in BB-11 and BA-26. The genes (katA, ahpC and gexC) encoding catalase, peroxidase, and glutathione were upregulated 1.19, 1.02 and 1.35 log2(FC), respectively, but were downregulated by 0.71, 0.24 and 0.24 log2(FC) in BA-26, respectively.
Because the low-temperature environment is not the optimal temperature for enzymes in microorganisms, the SOD activity of the two strains showed a decreasing trend. The significant increase in the reduced glutathione content in BB-11 enabled it to scavenge ROS and maintain the integrity of cell membranes. The SOD gene expression level verified the results of the preliminary measurement of SOD activity, and the downregulation of the sodA and sodB genes decreased the SOD enzyme activity in S. aureus under low-temperature treatment. Although BB-11 related genes were downregulated, their enzyme activity was higher than that in BA-26. A potential explanation for this finding is the improved cell membrane integrity that provides a stable internal environment suitable for the activation of the relevant oxidative stress response. With the increase in the low-temperature treatment time, the SOD activity in S. aureus gradually decreased, which might lead to the accumulation of ROS attacking fatty acids in the cell membrane to produce an increase in the MDA content [33]. However, the SOD activity and reduced glutathione content in BB-11 were higher than those in BA-26, and the MDA content was less than that in BA-26. The results were consistent with the RNA-seq data showing that the genes encoding catalase and peroxidase were upregulated, suggesting that changes in the levels of related genes contributed to the stronger oxidative stress defense system in BB-11 than that in BA-26 at low temperatures.

3.10.3. DEGs Related to Energy Metabolism in S. aureus

Among the genes that encode proteins involved in energy metabolism, the NADH dehydrogenase gene (nadE) was upregulated 2.59 log2(FC) in BB-11 compared to BA-26; the malA gene encoding α-glucosidase was upregulated 3.34 log2(FC) in BB-11 but was downregulated −1.39 log2(FC) in BA-26. NADH dehydrogenase is the largest bacterial electron transport complex that transfers electrons directly to the respiratory chain through redox reactions and generates energy for use in cellular processes [41]. Moreso, α-Glucosidase is an exoenzyme widely found in bacteria, and its mode of action is similar to that of glucoamylase on disaccharides, oligosaccharides, and aryl glycosides and produces glucose [42]. According to a previous study, when the cellular energy metabolism system is destroyed, the metabolic rate is decreased, systematic disorders occur and cell survival is affected [43]. Therefore, strain BB-11 may upregulate the expression of genes encoding NADH dehydrogenase and α-glucosidase, stabilize energy metabolism and allow other systems to operate normally. The downregulated expression of the genes encoding NADH dehydrogenase and α-glucosidase in the strain BA-26 may disrupt energy metabolism and induce cell death.

3.10.4. DEGs Related to The Regulatory System of S. aureus

S. aureus senses different environmental factors and adjusts its response to these environmental signals [44]. The sigB (σB) factor is one of the important factors regulating the environmental stress response in bacteria, which is encoded by the sigB gene. The regulation of the σB factor activity is achieved through a “partner-switching mechanism” [45]: when the organism is in a stress-free environment, the RsbW protein (anti-σB factor, encoded by the rsbW gene) phosphorylates the RsbV protein (anti-anti-σB factor, encoded by the rsbV gene), disrupting the binding of RsbV to RsbW, blocking the antagonism of the RsbW protein, and allowing the σB factor to bind to the RsbW protein and inhibit its activity; when the cell is under stress, RsbV is dephosphorylated and binds to RsbW, causing the release of σB to induce a transcription of genes that rely on the σB factor.
The regulation of SarA, another important transcription factor, depends on the control of the σB factor, which regulates mRNA lifetime at the posttranscriptional level to regulate the expression of target genes [46]. Another protein, SarR, with a 51% similarity to the SarA factor inhibits the transcription of the SarA factor [47]. SarA factor negatively regulates SarS protein. SarS protein is a positive regulator of spa transcription, but it is activated by ClpXP protease [48]. The experimental data showed that the expression levels of the sigB gene, rsbW gene, and rsbV gene were significantly reduced after 1 week of low-temperature treatment in both strains of S. aureus, but the expression levels of the sarA gene were significantly upregulated in both strains, indicating that the SarA factor plays a positive role in the resistance of S. aureus to low temperatures.

3.10.5. DEGs Related to The Defense Systems of S. aureus

A stress protein encoded by the asp23 gene is associated with the adaptation of bacterial strains to harsh environments, and deleting the gene from the genome increases the sensitivity of S. aureus [49]. Notably, greA encodes the transcription elongation factor GreA that affects bacterial gene transcription by regulating gene promoters, thereby regulating bacterial environmental adaptation [50]. The endosomal lipoprotein YafY, which is encoded by yafY, strongly induces degP expression, the gene encoding periplasmic protease that is thought to be required for growth under adverse conditions [51]. The RNA-seq data showed that the expression of the asp23, greA, and yafY genes was upregulated 1.02, 1.49, and 1.43 log2(FC), respectively, in BB-11, but were downregulated 0.25, 0.53, and 0.71 log2(FC), respectively, in BA-26. Thus, when BB-11 is located in an unfavorable environment, the cells are protected from external stress by the response of defense systems within the organism, which was elucidated years before by other researchers [49]. Therefore, these genes played an active role in the resistance of strain BB-11 to low-temperature treatment, while these genes did not seem to be helpful in BA-26.

3.10.6. DEGs Related to Cold Shock Stress in S. aureus

After 1 week of low-temperature treatment, both strains of S. aureus exhibited significantly reduced expression of cold-shock proteins. Cold-shock proteins are part of the survival mechanism of microorganisms to adapt to the low-temperature environment, and cold shock reactions have been identified in many microorganisms [15]. CspA was the first cold-shock protein to be discovered, and it increases the expression of proteins related to low-temperature adaptation [52]. An increasing number of research results show that cold-shock proteins are not only involved in the host’s cold shock response but are also necessary for the normal growth of the host. CspC participates in the nutritional starvation stress response of S. aureus and is related to the activity of stable cells [53]. CspLA also protects DNA from damage [6]. Studies have shown that short-term low-temperature treatment upregulates the expression of csp family genes [54]. Our RNA-seq data showed that the expression of csp family genes was downregulated in both S. aureus strains after long-term low-temperature treatment. Nonetheless, csp family genes were downregulated to a greater extent in BA-26 with a weak low-temperature resistance and downregulated to a lesser extent in BB-11 with strong low-temperature resistance. These proteins may be part of an immediate response to cold shock, and once the bacteria are acclimated, these proteins are homeostatically unrelated to 1 week of low-temperature treatment.

4. Conclusions

This study systematically compared the differences in cell surface morphology, intracellular enzyme activity, and gene expression between two strains of S. aureus exposed to low temperatures. After low-temperature treatment, the low-temperature survival of BB-11 is better than that of BA-26, and BB-11 also shows a better cell membrane integrity and in vivo oxidative stress response than BA-26. RNA-seq data verify the upregulation of the expression of cell membrane fatty acid-related genes and oxidative stress-related genes, confirming that the cell membrane integrity and the oxidative stress response of BB-11 were better than those of BA-26. Additionally, energy metabolism and the defense system in BB-11 are also actively involved in the resistance to low temperatures. Therefore, these molecular mechanisms together result in the better survival of BB-11 at low temperatures than BA-26. This study sounds an alarm for the risks posed by stress tolerance of S. aureus in the frozen food industry.

Author Contributions

Conceptualization, investigation, methodology, writing—review and editing, visualization, formal analysis, data curation, funding acquisition, B.S.; investigation, methodology, writing—original draft, visualization, data curation, P.G.; investigation, methodology, data curation, Z.D.; investigation, methodology, data curation, Y.Z.; investigation, methodology, data curation, S.F.; validation, data curation, writing—review and editing, H.F.; methodology, data curation, writing—review and editing, Z.H.; resources, validation, supervision, writing—review and editing, Z.A. All authors have read and agreed to the published version of the manuscript.

Funding

This research was funded by the National Natural Science Foundation of China (31601572), the Natural Science Foundation of Henan Province (222300420455), the Program for Science & Technology Innovation Talents in Universities of Henan Province (22HASTIT034), the Department of Human Resources and Social Security of Henan Province, and the Science and Technology Bureau of Zhengzhou City (2020CXZX0084).

Institutional Review Board Statement

Not applicable.

Informed Consent Statement

Not applicable.

Data Availability Statement

The data presented in this study are openly available in the Sequence Read Archive (SRA) of the National Center for Biotechnology Information Search (NCBI) database under accession code PRJNA818660.

Acknowledgments

We thank Majorbio Co., Ltd., for the technical assistance with the RNA-seq analysis.

Conflicts of Interest

The authors declare no conflict of interest.

References

  1. Zhao, Y.; Xia, D.; Ma, P.; Gao, X.; Kang, W.; Wei, J. Advances in the detection of virulence genes of Staphylococcus aureus originate from food. Food Sci. Hum. Wellness 2020, 9, 40–44. [Google Scholar] [CrossRef]
  2. Liu, J.; Wu, H.; Ao, X.; Hao, H.; Bi, J.; Hou, H.; Zhang, G. Characterization of the Inclusion Complexes of Isothiocyanates with γ-Cyclodextrin for Improvement of Antibacterial Activities against Staphylococcus aureus. Foods 2022, 11, 60. [Google Scholar] [CrossRef]
  3. Jiwon, O.; Hoikyung, K.; Beuchat, L.R.; Ryu, J.-H. Inhibition of Staphylococcus aureus on a laboratory medium and black peppercorns by individual and combinations of essential oil vapors. Food Control 2022, 132, 108487. [Google Scholar]
  4. Zhao, J.; Qian, J.; Zhuang, H.; Luo, J.; Huang, M.; Yan, W.; Zhang, J. Effect of Plasma-Activated Solution Treatment on Cell Biology of Staphylococcus aureus and Quality of Fresh Lettuces. Foods 2021, 10, 2976. [Google Scholar] [CrossRef] [PubMed]
  5. Rajkovic, A.; Jovanovic, J.; Monteiro, S.; Decleer, M.; Andjelkovic, M.; Foubert, A.; Beloglazova, N.; Tsilla, V.; Sas, B.; Madder, A. Detection of toxins involved in foodborne diseases caused by Gram-positive bacteria. Compr. Rev. Food Sci. Food Saf. 2020, 19, 1605–1657. [Google Scholar] [CrossRef]
  6. Saklani, P.; Lekshmi, M.; Nayak, B.B.; Kumar, S. Survival of methicillin-resistant Staphylococcus aureus in fish and shrimp under different storage conditions. J. Food Prot. 2020, 83, 844–848. [Google Scholar] [CrossRef]
  7. Gong, S.; Fei, P.; Sun, Q.; Guo, L.; Jiang, L.; Duo, K.; Bi, X.; Yun, X. Action mode of cranberry anthocyanin on physiological and morphological properties of Staphylococcus aureus and its application in cooked meat. Food Microbiol. 2021, 94, 103632. [Google Scholar] [CrossRef]
  8. Li, Q.; Yu, S.; Han, J.; Wu, J.; You, L.; Shi, X.; Wang, S. Synergistic antibacterial activity and mechanism of action of nisin/carvacrol combination against Staphylococcus aureus and their application in the infecting pasteurized milk. Food Chem. 2022, 1, 132009. [Google Scholar] [CrossRef]
  9. Yoo, J.H.; Baek, K.H.; Heo, Y.S.; Yong, H.I.; Jo, C. Synergistic bactericidal effect of clove oil and encapsulated atmospheric pressure plasma against Escherichia coli O157: H7 and Staphylococcus aureus and its mechanism of action. Food Microbiol. 2021, 93, 103611. [Google Scholar] [CrossRef]
  10. Wang, L.; Zeng, X.; Wang, M.; Brennan, C.S.; Gong, D. Modification of membrane properties and fatty acids biosynthesis-related genes in Escherichia coli and Staphylococcus aureus: Implications for the antibacterial mechanism of naringenin. Biochim. Biophys. Acta (BBA)-Biomembr. 2018, 1860, 481–490. [Google Scholar] [CrossRef]
  11. Zhang, L.; Zhang, M.; Devahastin, S.; Liu, K. Fabrication of curcumin encapsulated in casein-ethyl cellulose complexes and its antibacterial activity when applied in combination with blue LED irradiation. Food Control 2022, 134, 108702. [Google Scholar] [CrossRef]
  12. Vaishampayan, A.; Grohmann, E. Antimicrobials Functioning through ROS-Mediated Mechanisms: Current Insights. Microorganisms 2022, 10, 61. [Google Scholar] [CrossRef] [PubMed]
  13. Shi, Y.; Zhang, R.; Zhu, C.; Xu, M.; Gu, Q.; Ettelaie, R.; Lin, S.; Wang, Y.; Leng, X. Antimicrobial mechanism of alkyl gallates against Escherichia coli and Staphylococcus aureus and its combined effect with electrospun nanofibers on Chinese Taihu icefish preservation. Food Chem. 2021, 346, 128949. [Google Scholar] [CrossRef] [PubMed]
  14. Tuchscherr, L.; Löffler, B.; Proctor, R.A. Persistence of Staphylococcus aureus: Multiple metabolic pathways impact the expression of virulence factors in Small-Colony Variants (SCVs). Front. Microbiol. 2020, 11, 1028. [Google Scholar] [CrossRef] [PubMed]
  15. Savijoki, K.; Miettinen, I.; Nyman, T.A.; Kortesoja, M.; Hanski, L.; Varmanen, P.; Fallarero, A. Growth mode and physiological state of cells prior to biofilm formation affect immune evasion and persistence of Staphylococcus aureus. Microorganisms 2020, 8, 106. [Google Scholar] [CrossRef] [Green Version]
  16. Xiang, Q.; Kang, C.; Zhao, D.; Niu, L.; Liu, X.; Bai, Y. Influence of organic matters on the inactivation efficacy of plasma-activated water against E. coli O157:H7 and S. aureus. Food Control 2019, 99, 28–33. [Google Scholar] [CrossRef]
  17. Saliba, A.E.; Santos, S.C.; Vogel, J. New RNA-seq approaches for the study of bacterial pathogens. Curr. Opin. Microbiol. 2017, 35, 78–87. [Google Scholar] [CrossRef]
  18. Park, J.; Jo, S.; Park, K.; Yu, H.; Bai, J.; Ryu, S.; Chang, P. Transcriptomic analysis of Staphylococcus aureus under the stress condition of antibacterial erythorbyl laurate by RNA sequencing. Food Control 2019, 96, 1–8. [Google Scholar] [CrossRef]
  19. Hingston, P.; Chen, J.; Dhillon, B.K.; Laing, C.; Bertelli, C.; Gannon, V.; Tasara, T.; Allen, K.; Brinkman, F.S.; Truelstrup Hansen, L. Genotypes associated with Listeria monocytogenes isolates displaying impaired or enhanced tolerances to cold, salt, acid, or desiccation stress. Front. Microbiol. 2017, 8, 369. [Google Scholar] [CrossRef] [Green Version]
  20. Haskell, K.J.; Schriever, S.R.; Fonoimoana, K.D.; Haws, B.; Hair, B.B.; Wienclaw, T.M.; Holmstead, J.G.; Barboza, A.B.; Berges, E.T.; Heaton, M.J. Antibiotic resistance is lower in Staphylococcus aureus isolated from antibiotic-free raw meat as compared to conventional raw meat. PLoS ONE 2018, 13, e0206712. [Google Scholar] [CrossRef] [Green Version]
  21. Zhang, L.; Hou, L.; Zhang, S.; Kou, X.; Li, R.; Wang, S. Mechanism of S. aureus ATCC 25923 in response to heat stress under different water activity and heating rates. Food Control 2020, 108, 106837. [Google Scholar] [CrossRef]
  22. Aggarwal, S.; Jena, S.; Panda, S.; Sharma, S.; Dhawan, B.; Nath, G.; Singh, N.; Nayak, K.C.; Singh, D.V. Antibiotic susceptibility, virulence pattern, and typing of Staphylococcus aureus strains isolated from variety of infections in India. Front. Microbiol. 2019, 10, 2763. [Google Scholar] [CrossRef] [PubMed]
  23. Qiao, J.; Zhu, M.; Lu, Z.; Lv, F.; Zhao, H.; Bie, X. The antibiotics resistance mechanism and pathogenicity of cold stressed Staphylococcus aureus. LWT 2020, 126, 109274. [Google Scholar] [CrossRef]
  24. Zeng, J.; Hu, Y.; Jia, T.; Zhang, R.; Su, T.; Sun, J.; Gao, H.; Li, G.; Cao, M.; Song, M. Chemoenzymatic synthesis of sialylated lactuloses and their inhibitory effects on Staphylococcus aureus. PLoS ONE 2018, 13, e0199334. [Google Scholar] [CrossRef] [PubMed] [Green Version]
  25. Bai, J.; Zhong, K.; Wu, Y.; Elena, G.; Gao, H. Antibiofilm activity of shikimic acid against Staphylococcus aureus. Food Control 2019, 95, 327–333. [Google Scholar] [CrossRef]
  26. Suo, B.; Yang, H.; Wang, Y.; Lv, H.; Zhen, L.; Xu, C.; Ai, Z. Comparative Proteomic and Morphological Change Analyses of Staphylococcus aureus During Resuscitation From Prolonged Freezing. Front. Microbiol. 2018, 9, 866–871. [Google Scholar] [CrossRef] [PubMed] [Green Version]
  27. Kim, D.; Ben, L.; Salzberg, S.L. HISAT: A fast spliced aligner with low memory requirements. Nat. Methods 2015, 12, 357–360. [Google Scholar] [CrossRef] [Green Version]
  28. Love, M.I.; Huber, W.; Anders, S. Moderated estimation of fold change and dispersion for RNA-seq data with DESeq2. Genome Biol. 2014, 15, 550. [Google Scholar] [CrossRef] [Green Version]
  29. Young, M.D.; Matthew, J.W.; Smyth, G.K.; Oshlack, A. Gene ontology analysis for RNA-seq: Accounting for selection bias. Genome Biol. 2010, 11, R14. [Google Scholar] [CrossRef] [Green Version]
  30. Livak, K.J.; Schmittgen, T.D. Analysis of relative gene expression data using real-time quantitative PCR and the 2(-Delta Delta C(T)) Method. Methods 2001, 25, 402–408. [Google Scholar] [CrossRef]
  31. Qiu, X.; Choudhry, A.E.; Janson, C.A.; Grooms, M.; Daines, R.A.; Lonsdale, J.T.; Khandekar, S.S. Crystal structure and substrate specificity of the beta-ketoacyl-acyl carrier protein synthase III (FabH) from Staphylococcus aureus. Protein Sci. 2010, 14, 11–20. [Google Scholar]
  32. Qi, M.; Liu, Y.; Shi, S.; Xian, Y.; Liu, Q.; Yan, H.; Zhang, Y.; Yuan, Y. Inhibition mechanism of high voltage prick electrostatic field (HVPEF) on Staphylococcus aureus through ROS-mediated oxidative stress. LWT 2021, 155, 112990. [Google Scholar] [CrossRef]
  33. Han, B.; Han, X.; Ren, M.; You, Y.; Zhan, J.; Huang, W. Antimicrobial Effects of Novel H2O2-Ag+ Complex on Membrane Damage to Staphylococcus aureus, Escherichia coli and Salmonella typhimurium The evaluation of novel H2O2-Ag+ complex. J. Food Prot. 2021, 21, 1–12. [Google Scholar]
  34. Ning, H.; Li, Y.; Tian, Q.; Wang, Z.; Mo, H. The apoptosis of Staphylococcus aureus induced by glycinin basic peptide through ROS oxidative stress response. LWT 2019, 99, 62–68. [Google Scholar] [CrossRef]
  35. Lalaouna, D.; Baude, J.; Wu, Z.; Tomasini, A.; Chicher, J.; Marzi, S.; Vandenesch, F.; Romby, P.; Caldelari, I.; Moreau, K. RsaC sRNA modulates the oxidative stress response of Staphylococcus aureus during manganese starvation. Nucleic Acids Res. 2019, 47, 9871–9887. [Google Scholar] [CrossRef] [PubMed]
  36. Christmas, B.A.F.; Rolfe, M.; Rose, M.; Green, J. Staphylococcus aureus adaptation to aerobic low-redox-potential environments: Implications for an intracellular lifestyle. Microbiology 2019, 165, 21–29. [Google Scholar] [CrossRef] [PubMed]
  37. Queiroux, C.; Bonnet, M.; Saraoui, T.; Delpech, P.; Veisseire, P.; Rifa, E.; Moussard, C.; Gagne, G.; Delbès, C.; Bornes, S. Dialogue between Staphylococcus aureus SA15 and Lactococcus garvieae strains experiencing oxidative stress. BMC Microbiol. 2018, 18, 193. [Google Scholar] [CrossRef]
  38. Ramón-Sierra, J.; Martínez-Guevara, J.L.; Pool-Yam, L.; Magana-Ortiz, D.; Yam-Puc, A.; Ortiz-Vázquez, E. Effects of phenolic and protein extracts from Melipona beecheii honey on pathogenic strains of Escherichia coli and Staphylococcus aureus. Food Sci. Biotechnol. 2020, 29, 1013–1021. [Google Scholar] [CrossRef]
  39. Liu, S.; Li, H.; Hassan, M.M.; Ali, S.; Chen, Q. SERS based artificial peroxidase enzyme regulated multiple signal amplified system for quantitative detection of foodborne pathogens. Food Control 2021, 123, 107733. [Google Scholar] [CrossRef]
  40. Liao, X.; Forghani, F.; Liu, D.; Ding, T. Cumulative damage by nonthermal plasma (NTP) exceeds the defense barrier of multiple antibiotic-resistant Staphylococcus aureus: A key to achieve complete inactivation. Food Qual. Saf. 2021, 5, 127–139. [Google Scholar] [CrossRef]
  41. Pandey, S.; Sahukhal, G.S.; Elasri, M.O. The msaABCR Operon Regulates Persister Formation by Modulating Energy Metabolism in Staphylococcus aureus. Front. Microbiol. 2021, 12, 881. [Google Scholar] [CrossRef] [PubMed]
  42. Lee, S.; Kim, M. Leuconostoc mesenteroides MKSR isolated from kimchi possesses α-glucosidase inhibitory activity, antioxidant activity, and cholesterol-lowering effects. LWT 2019, 116, 108570. [Google Scholar] [CrossRef]
  43. Kang, J.; Jin, W.; Wang, J.; Sun, Y.; Wu, X.; Liu, L. Antibacterial and anti-biofilm activities of peppermint essential oil against Staphylococcus aureus. LWT 2019, 101, 639–645. [Google Scholar] [CrossRef]
  44. Qiu, Y.; Xu, D.; Xia, X.; Zhang, K.; Wang, J. Five major two components systems of Staphylococcus aureus for adaptation in diverse hostile environment. Microb. Pathog. 2021, 28, 105119. [Google Scholar] [CrossRef]
  45. Pannu, M.K.; Hudman, D.A.; Sargentini, N.J.; Singh, V.K. Role of SigB and staphyloxanthin in radiation survival of Staphylococcus aureus. Curr. Microbiol. 2019, 76, 70–77. [Google Scholar] [CrossRef] [PubMed]
  46. Roberts, C.; Anderson, K.L.; Murphy, E.; Projan, S.J. Characterizing the Effect of the Staphylococcus aureus Virulence Factor Regulator, SarA, on Log-Phase mRNA Half-Lives. J. Bacteriol. 2006, 102, 104–118. [Google Scholar] [CrossRef] [PubMed] [Green Version]
  47. Manna, A.C.; Cheung, A.L. Transcriptional regulation of the agr locus and the identification of DNA binding residues of the global regulatory protein SarR in Staphylococcus aureus. Mol. Microbiol. 2010, 60, 1289–1301. [Google Scholar] [CrossRef]
  48. Hsieh, H.Y.; Tseng, C.W.; Stewart, G.C. Regulation of Rot expression in Staphylococcus aureus. J. Bacteriol. 2008, 190, 546–554. [Google Scholar] [CrossRef] [Green Version]
  49. Barros, E.M.; Martin, M.J.; Selleck, E.M.; Lebreton, F.; Sampaio, J.L.M.; Gilmore, M.S. Daptomycin resistance and tolerance due to loss of function in Staphylococcus aureus dsp1 and asp23. Antimicrob. Agents Chemother. 2019, 63, e01542-18. [Google Scholar] [CrossRef] [Green Version]
  50. Shao, L.; Liu, Y.; Zhao, Y.; Zou, B.; Li, X.; Dai, R. Integrated transcriptomic and metabolomic analysis of the global response of Staphylococcus aureus to ohmic heating. Innov. Food Sci. Emerg. Technol. 2021, 74, 102870. [Google Scholar] [CrossRef]
  51. Rochat, T.; Delumeau, O.; Figueroa-Bossi, N.; Noirot, P.; Bossi, L.; Dervyn, E.; Bouloc, P. Tracking the elusive function of Bacillus subtilis Hfq. PLoS ONE 2015, 10, e0124977. [Google Scholar] [CrossRef] [PubMed] [Green Version]
  52. Caballero, C.J.; Menendez-Gil, P.; Catalan-Moreno, A.; Vergara-Irigaray, M.; García, B.; Segura, V.; Irurzun, N.; Villanueva, M.; Ruiz de los Mozos, I.; Solano, C.; et al. The regulon of the RNA chaperone CspA and its auto-regulation in Staphylococcus aureus. Nucleic Acids Res. 2018, 46, 1345–1361. [Google Scholar] [CrossRef] [PubMed] [Green Version]
  53. Catalan-Moreno, A.; Cela, M.; Menendez-Gil, P.; Irurzun, N.; Caballero, C.J.; Caldelari, I.; Toledo-Arana, A. RNA thermoswitches modulate Staphylococcus aureus adaptation to ambient temperatures. Nucleic Acids Res. 2021, 49, 3409–3426. [Google Scholar] [CrossRef] [PubMed]
  54. Alreshidi, M.M.; Dunstan, R.H.; Macdonald, M.M.; Smith, N.D.; Gottfries, J.; Roberts, T.K. Metabolomic and proteomic responses of Staphylococcus aureus to prolonged cold stress. J. Proteom. 2015, 121, 44–55. [Google Scholar] [CrossRef]
Figure 1. Viable cell number growing on TSA-YE plates (A) and intracellular nucleic acid leakage; (B) of S. aureus after low temperature (4 °C) treatment. Error bars represent standard deviations (n = 3).
Foods 11 00996 g001
Figure 2. Effect of low temperature (4 °C) on the malondialdehyde (MDA) content (A), superoxide dismutase activity (SOD) (B) and reduced glutathione (GSH) content (C) in S. aureus. Error bars represent standard deviations (n = 3) (* p < 0.05, ** p < 0.01, and *** p < 0.001).
Foods 11 00996 g002
Figure 3. Confocal laser scanning microscopy images of S. aureus in the late exponential stage and exposed to low temperature (4 °C). (A,E): BB-11 and BA-26 without low temperature treatment; (B,F): merge images with full fluorescence channel of BB-11 and BA-26 after low temperature treatment; (C,G): green fluorescence channel (FITC) images of BB-11 and BA-26 after low temperature treatment; (D,H): red fluorescence channel (TRITC) images of BB-11 and BA-26 after low temperature treatment The green fluorescence (stained with calcein-AM) indicates that the cell membranes remain intact and bacteria are considered live, and the red fluorescence (stained with propidium iodide) indicates the disruption of membranes and bacteria are considered dead. Scale bar = 5 μm for each CLSM image.
Foods 11 00996 g003aFoods 11 00996 g003b
Figure 4. Transmission electron microscopy images of S. aureus in the late exponential stage and exposed to a low temperature (4 °C). White arrows indicate the cells with more severe cell membrane wrinkling. (A,C): The late exponential stage of BB-11; (B,D): the late exponential stage of BA-26. (E,G): BB-11 exposed to a low temperature; (F,H): BA-26 exposed to a low temperature. Scale bar = 2 μm in images shown in (A,B,E,F) (30,000× magnification); scale bar = 200 nm in images shown in (C,D,G,H) (4000× magnification).
Foods 11 00996 g004aFoods 11 00996 g004b
Figure 5. Distribution of differentially expressed genes (DEGs) between samples. DEGs were analyzed with the DEseq2 method, and DEGs were defined based on the following criteria: |log2 (fold change)| ≥ 1.00 and an adjusted p value ≤ 0.05.
Foods 11 00996 g005
Figure 6. GO classification of DEGs in BB-11 (A) and BA-26 (B). The abscissa in the figure represents the secondary GO classification terms, the left ordinate represents the percentage of the total number of genes included in the secondary classification, the right ordinate represents the number of genes in the secondary classification in the comparison, and the three colors indicate the three main categories.
Foods 11 00996 g006
Figure 7. Scatter plots of the top 20 enriched GO terms for DEGs in BB-11 (A) and BA-26 (B). The vertical axis represents the GO term, and the horizontal axis represents the enrichment factor. The size of the dot indicates the number of genes/transcripts enriched in this GO term, and the color of the dot corresponds to different FDR ranges.
Foods 11 00996 g007
Figure 8. Scatter plots of enriched KEGG pathways for DEGs in BB-11 (A) and BA-26 (B). The vertical axis represents the name of the pathway, and the horizontal axis represents the enrichment factor. The size of the point represents the number of genes in this pathway in the gene set, and the color of the point corresponds to different ranges of FDR values.
Foods 11 00996 g008
Figure 9. qRT–PCR validation. The x-axis indicates the log2 fold change obtained using RNA-seq analysis; the y-axis indicates the log2 fold change obtained using qRT–PCR.
Foods 11 00996 g009
Figure 10. The response of S. aureus to a low temperature in vivo includes a cell structure response, oxidative stress response, energy metabolism response, regulation systems, and defense mechanisms. The oval box represents the DEGs, and the dotted arrows represent the various responses that are detrimental to the organism. Arrows indicated the activation, while the blunt-end arrows represented repression.
Foods 11 00996 g010
Table 1. Primers used for qRT–PCR.
GenesPrimerSequence (5′-3′)Product Length (bp)References
leuBleuB-FGGTGCAATCGGTGGACCTAA124this research
leuB-RTAGCGCCTTTGACAACGGTA
leuDleuD-FTGGAAACGCTTGTCTGGTGA211this research
leuD-RGTCGTGAACATGCTGCTTGG
sigBsigB-FTGGAGTGTACATGTTCCGAGAC75this research
sigB-RAGCGGTTAGTTCATCGCTCA
sarVsarV-FTCATCCGTTTCAGAACGCAA141this research
sarV-RTGAAGCTGAAAAGATTAGCGGT
rsbWrsbW-FGCGAAGGTGGCCTAGGTTTA125this research
rsbW-RGCCATTATTTCGCACCTGCT
NsaRNsaR-FGCGCGTCATGTTAACAGCTA273this research
NsaR-RACGATTGCCAAAATTCAAGCAT
MarRMarR-FAATAAGGCCGCAGTAAGCCG166this research
MarR-RGCGCAATATCTGTCATAATCGCA
rsbUrsbU-FGCTGGTCATGAGCCTGGATA171this research
rsbU-RAGCTTCAGTCACACCATCCG
16s rDNA16s rDNA-FCGGTGAATACGTTCYCGG124[17]
16s rDNA-RGGWTACCTTGTTACGACTT
Table 2. Classification of DEGs of S. aureus involved in the response to cold temperature.
Gene IDSymbolS. aureus BB-11p-ValueS. aureus BA-26p-ValueDescription
Fold Change/Log2(FC)Fold Change/Log2(FC)
Fatty acid biosynthesis in membrane
E3306_06220fabG1.0560.0012660.460.0328783-oxoacyl-[acyl-carrier-protein] reductase
E3306_11095fabZ−2.534.61 × 10−13−0.820.0019123-hydroxyacyl-ACP dehydratase FabZ
Oxidative stress
E3306_08020sodA−1.553.61 × 10−6−0.660.002897Superoxide dismutase
E3306_00485sodB−1.521.07 × 10−5−0.730.003111[Mn/Fe]-Superoxide dismutase
E3306_06825katA1.193.74 × 10−40.710.004024Catalase
E3306_13890grxC1.353.60 × 10−40.240.399629Reduced Glutathione
E3306_01835ahpC1.020.0118910.240.223756Peroxidase
Cold shock response
E3306_07190cspA−1.783.08 × 10−8−1.255.58 × 10−6Cold-shock protein (CspA)
E3306_14325cspLA−1.210.063056−3.246.03 × 10−23Cold-shock protein (CspLA)
E3306_04085cspC−0.660.284248−2.278.17 × 10−18Cold-shock protein (CspC)
Energy Metabolism
E3306_02110nadE5.334.47 × 10−642.741.68 × 10−9NADH dehydrogenase
E3306_07745malA3.342.21 × 10−21−1.391.37 × 10−5α-glucosidase
Regulation System
E3306_10900sigB−1.572.20 × 10−8−0.650.001570RNA polymerase sigma factor SigB
E3306_10910rsbV−1.862.20 × 10−12−0.380.120798STAS domain-containing protein(RsbV)
E3306_10905rsbW−1.642.42 × 10−7−1.050.006128anti-sigma B factor RsbW
E3306_03140sarA2.892.40 × 10−192.446.38 × 10−6transcriptional regulator(SarA)
E3306_00370sarS−2.812.99 × 10−20−1.839.22 × 10−4HTH-type transcriptional regulator SarS
E3306_12130sarR0.240.675713−0.490.071711HTH-type transcriptional regulator SarR
Defense Mechanism
E3306_07880asp231.021.26 × 10−40.250.221559Asp23/Gls24 family envelope stress response protein
E3306_08310greA1.491.03 × 10−90.530.048271transcription elongation factor GreA
E3306_12230yafY1.436.30 × 10−50.719.07 × 10−5YafY family transcriptional regulator
Publisher’s Note: MDPI stays neutral with regard to jurisdictional claims in published maps and institutional affiliations.

