
Dynamics and Determinants of the Grain Yield Gap in Major Grain-Producing Areas: A Case Study in Hunan Province, China


1
School of Public Administration, China University of Geosciences (CUG), Wuhan 430074, China
2
Key Laboratory for Research on Rule of Law, Ministry of Natural Resources, Wuhan 430074, China
*
Author to whom correspondence should be addressed.
Foods 2022, 11(8), 1122; https://doi.org/10.3390/foods11081122
Submission received: 11 March 2022
/
Revised: 2 April 2022
/
Accepted: 11 April 2022
/
Published: 13 April 2022
(This article belongs to the Special Issue Integrated Governance Mechanisms for Empowerment and Resilience in International Food Value Chains)
Abstract
:Understanding the dynamics of the grain yield gap (YGAP) and its causative factors is essential for optimizing the layout of grain production and addressing the food crisis, especially in countries with a huge population and less cultivated land, such as China. In the study, a spatial analysis- and machine learning-based framework for YGAP analysis was developed, taking Hunan Province, China, as an application. The results showed that the average YGAP in Hunan Province gradually narrowed from 1990 to 2018, and the YGAPs narrowed in 116 counties. Of which, 26 counties narrowed by more than 4 t ha−1, 58 counties narrowed from 2–4 t ha−1, and 32 counties narrowed within 2 t ha−1. Additionally, we found that the GDP per capita (GDPPC), sunshine hours (SH), per capita annual net income of farmers (PCAI), and rural electricity consumption (REC) play a key role in YGAP change, and the importance of human investment to the YGAP decreased, while socioeconomic environment became the dominant factor that influenced grain production. Comprehensively, the relatively great potential for grain yield growth was generated in sixty-four counties, which are mainly located in the northern, central, and southern Hunan. The findings suggest that it is necessary to consider the trends of economic development in rural areas and population migration in agricultural management. This work provides insights into yield gap dynamics and may contribute to sustainable agricultural management in Hunan Province, China, and other similar regions.
1. Introduction
Grain production capacity and food security have been wide concerns in the era of population boom, climate change, and environmental degradation [1,2,3,4,5]. Many scholars in developed countries have researched the sustainability and resilience of the food system since the 1990s, and it is concluded that a food system gathers all the elements (environment, people, inputs, processes, infrastructures, institutions, etc.) and activities that relate to the production, processing, distribution, preparation, and consumption of food and the outputs of these activities [6,7]. In 2015, zero hunger, which advocates sustainable agricultural development promotion to ensure global food security, was introduced as one of the UN’s sustainable development goals (SDGs) [8,9,10]. However, the food crisis remains and, to a certain extent, has been even worse since 2017 [11]. Affected by global socioeconomic and health events such as the COVID-19 pandemic, food supply chains, trade, and food environments are getting more vulnerable [12,13], and more than 155 million people are suffering from food insecurity [14]. Meanwhile, it is reported that more than 1.3 billion tons of food are thrown away along the entire food supply chain worldwide each year, especially in developed countries. Specifically, in developed countries (1.4 billion people), 670 million tons (Mt) of food is discarded, and less than 630 Mt is discarded in developing countries (6.2 billion people) [15,16,17]. In this context, initiatives to promote a resilient agricultural food system are unprecedentedly advocated [11]. Some scholars stated that the current food system is problematic because of alleged low productivity, especially in developing countries [13]. Indeed, there is a large gap in grain crops between developing and developed countries. For instance, the yield per unit of rice in China is more than 110 kg lower than that of Australia, the yield per unit of wheat is nearly 300 kg lower than that of New Zealand, the yield per unit of corn is only 60% of that of the United States, and the yield per unit of soybean is less than 60% of that in the United States [18]. Therefore, it is necessary to move beyond rehabilitating and increasing agricultural production to addressing the whole food system to link humanitarian assistance and longer-term support to sustainable livelihoods and resilience [6].
The Chinese government and scholars have made efforts to approach high-quality cultivated land and increase the sown area of grain to gain more food [19,20,21]. Policies such as cultivated land balance, land consolidation, and a high standard of basic cultivated land that aim to promote strict cultivated land protection have also been approached [22,23,24]. However, it remains hard work to address cultivated land degradation in both scale and grain production capacity under rapid urbanization and industrialization [25]. Low grain yields in major cereal crops, notably maize, rice, and wheat, have been generally generated in areas suffering from resource and environmental constraints [26,27,28]. Moreover, promoted by the policies addressing the decreasing birth rate, the population growth, and, as a result, the increase in food consumption will be largely increased in the next decades [29,30,31,32]. Food security is a major issue facing Chinese agriculture [20,32,33,34]. Comprehensively, increasing grain productivity without cultivated land expansion is critical to address these problems.
It is noteworthy that initiatives to increase the grain yield in regions that show a large yield gap (YGAP), namely the gap between potential yield (YP) and actual farm yield (YAFM), are advocated. The definition of YGAP was firstly made by De Datta (1981) and has been enriched during the past decades. Concepts related to YGAP, mainly including potential yield (YP), exploitable yield potential (YEP), potential farm yield (YPFM), and actual farm yield (YAFM), have been widely discussed [28,35,36,37,38]. Among these definitions, YP is the maximum yield that can be obtained under the climatic and soil conditions in a specific area. YEP reflects the maximum yield achievable in a test field under superior cultivation management practices. YPFM represents the maximum yield to be obtained at the current cultivation level by the farmer. In contrast, YAFM is the actual yield under the current farming practices [38,39,40]. Generally, production constraints are highly dependent on local management practices and agroecological location [41]. Of which, YP is mainly determined by natural conditions (e.g., light, temperature, water, soil, etc.) and genetic characteristics of crops. While the influence mechanism of YAFM is relatively complex, it is mainly decided by the land use conditions, the inputs of labor, technology, capital, etc. The inputs are conducive to improving the land use conditions, promoting cultivated land quality, and finally enhancing YAFM, while the willingness of farmers to input in agricultural activities is largely determined by the socioeconomic environment [38]. Hence, it can be seen that it is very difficult but crucial to explore the key factors that narrow the yield gap.
In recent years, studies on the YGAP have continuously deepened. The research object has expanded from major grain crops (rice, wheat, and corn) [42,43,44] to potatoes [45], sugarcane [46], rapeseed [47], quinoa [48], cassava [49,50], apples [51], bovine milk [52,53], and cowpeas [54]. While in terms of research method, field surveys, statistical methods, crop simulation models, and remote sensing technology have been integrated to fully utilize the advantages of each method in YGAP research, and insight has been derived through targeted case studies [55,56,57]. All of these have deepened the cognition of yield gap research. However, findings documented in existing literature are variable due to differences in research scales and methods. Specifically, most studies have been conducted at the field, provincial, regional, and national levels [58,59,60,61], ignoring the mesoscale such as the county level. Compared to the latter three scales, the field survey study can achieve more precise data and results. It is helpful to guide agricultural production in practice. Existing literature revealed that cultivation and management measures such as increasing fertilization, irrigation, and planting density have an important contribution to the increase in yield and then narrow the yield gap [62,63,64,65]. However, the field survey method is hard to promote within a large region because of the limits of finances and time. While using remote sensing and statistical data to research YGAP at macro-scales such as provincial, regional, and national, can quickly understand their trends and help strategic decisions making [66,67,68]. For instance, previous studies have revealed that the YGAP is particularly large in developing countries where smallholder farming dominates the agricultural landscape, especially in rainfed systems, suggesting that the increase in grain production in these regions is easier than in other places [53,69,70], but large-scale studies are difficult to guide grain production activities directly. Comprehensively, the YGAP study at the mesoscale is needed. Meanwhile, some studies reported that limiting factors to production are region-specific and depend on socio-economic and agro-ecological location; therefore, it is necessary to understand the primary causes of yield gaps to allow for more effective research and policy efforts aimed at improving grain production capacity [38,41].
Furthermore, considering many policies, such as spatial planning and agricultural industry planning, are implemented at the county level in China, and Deng et al. [20] reported that among the major rice-producing provinces, the greatest opportunity for yield improvement mainly occurs in Hunan, Heilongjiang, and Jiangxi in China. Meanwhile, to the best of our knowledge, a limited number of studies have examined the factors influencing the YGAP, especially from spatial and temporal perspectives at the county level. Hence, to develop a methodology framework from a geographical perspective for regional yield gap analysis and apply it to verify its effectiveness, Hunan Province, which is a major grain-producing base in China, was selected as a study area.
Specifically, we analyzed the spatiotemporal evolution characteristics of crop YGAPs and the corresponding determinants in Hunan Province based on various data (e.g., remote sensing data, meteorological data, and socioeconomic data) and methods (e.g., spatial analysis, spatial statistics, and random forest model). The specific objectives of this study are (a) to better understand the spatiotemporal evolution and clustering characteristics of the YGAP at the county level, (b) to determine the factors influencing the yield gap change (YGC), and (c) to identify areas with a high potential to narrow the YGAP and propose strategies to increase the grain yield. This study provides new insights into the application of YGAP research.
2. Materials and Methods
2.1. Study Area
There are thirteen provinces among the main grain-producing areas of China, including Liaoning, Hebei, Shandong, Jilin, Inner Mongolia, Jiangxi, Hunan, Sichuan, Henan, Hubei, Jiangsu, Anhui, and Heilongjiang (Figure 1a). Hunan, located in Central China and the middle reaches of the Yangtze River, between 108°47′–114°15′ E and 24°38′–30°08′ N, covers an area of 211,800 square kilometers and contains 14 municipalities and 122 counties or districts (Figure 1). It exhibits a humid continental subtropical monsoon climate with suitable agricultural production conditions (e.g., light, heat, and water resources), and is an important rice production base in China. The main grain cropping system in Hunan Province is double cropping with rice (early-season rice and late-season rice) (Figure 1b) [71]; however, an increasing number of farmers have preferred to plant rice in the middle of the two seasons in recent years (Figure 2a). In 2019, the area sown with rice accounted for approximately 90% of the total food crop planting area in Hunan (Figure 2a), and the rice yield reached 26.39 million tons, of which early-season rice accounted for 7.19 million tons, and late-season rice accounted for 8.1 million tons of the total rice yield. The yield per unit area of early-, middle- and late-season rice exceeded 6000 kg ha−1 in 2019 (Figure 2b). In 2020, the grain sown area in Hunan amounted to 4755 thousand hectares, and the total grain production reached 30.15 million tons, accounting for 4.51% of the grain yield in China.
2.2. Data Sources
Land use data with a spatial resolution of 30 m for 1990, 2000, 2010, and 2018 were provided by the RESDC, Chinese Academy of Sciences (http://www.resdc.cn, accessed on 1 December 2019). These data adopt a three-level classification system, which divides land into six primary categories, namely, cultivated land, woodland, grassland, water area, urban and rural construction land, and unused land, and 25 secondary categories, such as paddy fields and dryland areas. The detailed introduction can be seen in reference [72]. DEM data with a spatial resolution of 12.5 m were obtained from the Advanced Land Observing Satellite (ALOS), which is known in Japan as DAICHI and was developed by the Japan Aerospace Exploration Agency (JAXA, https://global.jaxa.jp, accessed on 13 March 2021). The rainfall, air temperature, sunshine hour, and solar radiation intensity data in 1990, 2000, 2010, and 2018 originated from the China Meteorological Data Network Service Centre (http://data.cma.cn, accessed on 13 February 2021) and National Tibetan Plateau Data Center (http://data.tpdc.ac.cn, accessed on 13 February 2021). Socioeconomic data (e.g., grain yield, human population, rural labor, etc.) were obtained from the Hunan Statistical Yearbook and Hunan Rural Statistical Yearbook of the corresponding year. Administrative district data were derived from basic national geodatabases.
2.3. Methods
2.3.1. Framework for YGAP Analysis and Application
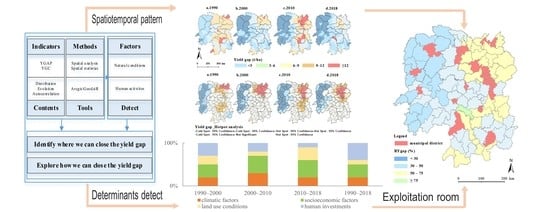
Theoretically, the yield gap is determined not only by natural conditions (e.g., the physical conditions of cultivated land and the climate) but also by human investments, such as irrigated infrastructure, technology, and capital [53,69,73,74,75,76]. The former aspect determines the grain production potential, and the latter aspect determines the actual grain outputs. When the exploitation level of the potential yield is low, the latter factor may be more important than the former factor. However, all the limiting factors vary over time and space, and the same investment does not produce the same benefits over places. Thus, to optimize the pattern and improve the efficiency of grain production, we need to understand some questions, such as how the yield gap changes, which factors determine the changes in the yield gap, and where and how we can close the YGAP. Therefore, a methodology and analysis framework was developed based on a geographic research perspective [77] in this study (Figure 3).
Firstly, the yield gap in each county in 1990, 2000, 2010, and 2018 was calculated. Then, we analyzed the characteristics of yield gap dynamics (e.g., the distribution, clustering, and evolution) with the methods of spatial analysis and spatial statistics. Finally, we selected several indicators that may affect the yield gap and determined the importance of these factors. Therefore, we summarized the variation mechanism of the grain yield gap over the past three decades and examined approaches to identify where we can close the YGAP in the future.
2.3.2. Estimating the YP
The YP represents the maximum yield value achievable of the best cultivar when grown with optimal agronomy and without manageable biotic and abiotic stresses under natural resource and cropping system conditions in the specific area [28]. Methods for estimating the YP are crucial to YGAP research [39,40,78]. Generally, there are three methods for YP estimation, including field experiments, maximum farmer yield determination, and crop model simulation [39,57]. The former two methods are conceptually and operationally simple but exhibit notable experimental data requirements, high experimental costs, and high time costs. The latter method can consider more scenarios and treatments, but precisely quantifying all management measures in actual production is difficult to achieve [59,79,80,81]. Comprehensively, the YP for rice and corn was estimated by step revision model under the restrictions of light, temperature, water, and soil [82,83,84,85,86], which is referenced to the Agro-Ecological Zones modeling framework (AEZ) [87,88].
Considering the double cropping system is the main farming system in grain production in Hunan Province (Figure 1b and Figure 2a) as well that the early-season rice, late-season rice, spring corn, and autumn corn are planted between April and October. Hence, the grain potential yields (i.e., rice, corn) were estimated during their growing period (May to October) [82,83,84,85,86]. Equations (1)–(4) were adopted to calculate the photosynthetic production potential (YQ), light-temperature production potential (YT), climatic production potential (YW), and soil production potential (YS) in each cultivated land pixel, respectively.
According to previous studies [82,83,84,85,86], C is the calorific value of the dry matter in Equation (1), which is set to 4.25 kcal g−1 [82,83,84,85,86,89]. F is the utilization rate of light energy, with a value of 3% [82,83,84,85,86,90]. Q is the total solar radiation in units of kcal cm−2. E is the crop economic coefficient, and its value is generally between 0.35 and 0.5 for most grain crops, such as wheat, rice, and corn [82,83,84,85,86]. Given that rice and corn are the main grain crops in Hunan Province and that the planting area of rice exceeds 90% of the total grain planting area, a value of 0.4 is considered in this study. T in Equation (2) is the average temperature. The f(w) in Equation (3) is the water correction coefficient. Because there is sufficient rainfall in Hunan Province, the rainfall exceeds the amount of evapotranspiration; thus, f(w) is assigned a value of 1 in this study. In Equation (4), f(s) is the soil correction coefficient, and we employed the shared data as calculated based on soil properties, including the elevation, pH, fertility, slope, and soil texture [86].
2.3.3. Calculating YGAP and YGC
In this study, YGAP represents the difference between potential yield (YP) and actual farmer yield (AFM), and it can effectively reflect the future grain production improvement capacity [28,38]. Equations (5) and (6) were adopted to characterize the YGAP in productivity per hectare (t ha−1) and the relative yield gap (RYGAP) at the county level, respectively. Moreover, considering that the variations in the yield gap correspond to the external factors changing over time and space, we calculated the YGC (Equation (7)) in each county and then used it to identify the determinants of YGC in the later analysis.
where and in Equation (5) are the average values of the potential grain yield and actual farmer yield, respectively. RYGAP in Equation (6) is the relative yield gap. and in Equation (7) are the yield gaps at the beginning and end in unit i, respectively, of the period. A positive value of YGC indicates that the yield gap is increasing; in contrast, a negative value demonstrates that the yield gap is closing. It is important to note that all the above indicators are county-level statistics.
2.3.4. Exploring Spatiotemporal Variations of YGAP
To explore the basic features of the YGAP dynamics over time and space, the methods of spatial statistics and spatial autocorrelation were adopted in this study. In particular, spatial autocorrelation analysis can reflect the spatial correlation characteristics via the index [37]. We first conducted a hot spot analysis to identify whether YGAP variations were clustered or dispersed based on their location. In addition, we recognize that the state of geographical events may be closely related to the state of the YGAP variation during historical periods; that is, YGC has a space and time lag effect. Thus, the bivariate spatial correlation method [91,92,93], which is typically considered to be the correlation between one variable and the spatial lag of another variable, was adopted to explore the relationship between the YGCs during different periods.
2.3.5. Investigating Determinants of YGC
The YGAP is determined not only by natural conditions but also by human investments [1,26,28]. That is, climatic factors, land quality, tillage, sowing, fertilization, irrigation, and field management all affect yield gap changes [69,73,74,75,76]. In general, the main factors influencing the potential yield are natural factors, including terrain, soil, climate (e.g., solar radiation, temperature, rainfall, and CO2 in the environment), and genetic crop characteristics [1]. In contrast, the factors largely impacting the actual farm yield are socioeconomic factors, human investments, and market influences, such as agricultural labor, cropping systems, tillage methods, seed quality, fertilization, irrigation, drainage, and local policies [37,94,95,96]. These are the direct factors influencing the crop YGAP. Hence, it is crucial to understand which factors determine the yield gap change (YGC) to further close the YGAP in the future.
The spatial variations in YGAP are significantly correlated with changes in these factors over time and space [26]. Hence, in this study, we adopt the YGC as the dependent variable and choose 27 factors, including climate, topographic, socioeconomic, and human investment factors (Table 1), as independent variables to determine the main influencing factors of the YGAP. It should be noted that the mean values of all variables are statistically significant at the county level.
To better explore the determinants associated with the spatial variation in the YGC, we conducted random forest analysis, a machine learning method that has been widely used to examine the importance of influencing factors and screen the independent variables in modeling studies [77,97]. In this study, it was adopted to detect the relative importance of each impact factor (Table 1) in explaining the YGC at the county level. Considering the idea that the YGC process is dynamic, drivers should also be considered according to their inherent temporal and spatial dynamics. Consequently, we could identify invalid and dominant factors. Additionally, given that data on certain counties are absent, and agriculture is not the main industry in urban areas, the abovementioned places were eliminated. Finally, ninety-five counties were selected to analyze the influencing factors of the YGC. It is worth noting that we employed scores to characterize the importance, and the score value ranged from 0 to 1. The higher the value, the more important the factor is. Moreover, we considered the top ten factors in terms of their importance as the key factors and calculated the percentage according to the category and number of these factors to reflect their contribution to YPC. The higher the percentage is, the greater the influence on the YGC.
3. Results
3.1. Recent YGAP Trends in Hunan Province
3.1.1. Spatiotemporal Pattern of YGAP
From 1990 to 2018, the YGAP in Hunan Province continued to narrow, with the average value changing from 8.57 to 5.84 t ha−1, a decrease of approximately 31.86%. Specifically, the minimum YGAP value did not significantly change after 2000, but the maximum value continued to rise. The maximum value mainly occurred in certain economically well-developed areas no longer producing grain crops, such as Furong District in Changsha city. In 2018, among the 122 counties, there were 25 counties with YGAP values lower than 3 t ha−1, largely in western Hunan. Thirty-eight counties attained YGAP values between 3 and 6 t ha−1, mainly in central and southern Hunan. Forty-three counties exhibited YGAP values between 6 and 9 t ha−1, mostly in northern Hunan. Two counties achieved YGAP values over 12 t ha−1 (Table 2 and Figure 4).
3.1.2. Spatially Heterogeneity of YGC
Figure 5 and Figure 6 represent that YGAP narrowing mainly occurred during the 1990–2000 period, and the YGAPs in 119 counties closed in Hunan Province. The regions where the YGAP narrowed within 2 t ha−1 were largely distributed in Yueyang, Chenzhou, Huaihua, and Xiangxi (Figure 6a), while the regions with a YGC value larger than 2 t ha−1 were mostly in Shaoyang, Hengyang, and Zhuzhou. However, from 2000 to 2010, the yield gap widened in 50 counties, mainly located in eastern Hunan (Changsha, Xiangtan, Zhuzhou) and southern Hunan (Hengyang, Chenzhou). This trend continued to expand, with the YGAP widening in 66 counties from 2010 to 2018, largely located in Changsha, Yueyang, Yiyang, Shaoyang, and Huaihua. However, the overall trends indicated that the YGAP narrowed from 1990 to 2018, and the YGAPs narrowed in 116 counties. Specifically, the YGAPs in 26 counties narrowed by more than 4 t ha−1, that in 58 counties, it narrowed to 2–4 t ha−1, and in 32 counties, it narrowed within 2 t ha−1.
3.2. Agglomeration of YGAP and YGC
3.2.1. Clustering Pattern of the YGAP and YGC
The hot spot analysis results demonstrated that YGAP spatial clustering characteristics were evident in each year, but the changes were highly spatially divergent over time. Specifically, the cold spot areas of YGAP were mainly located in western Hunan (Huaihua, Zhangjiajie, and Xiangxi) each year. The hot spot areas of YGAP largely occurred in Changde, Yueyang, Yiyang, Changsha, and Hengyang (Figure 7). From 1990 to 2000, the cold spot areas of the YGC were mostly located in Shaoyang, Hengyang, and Loudi, while the hot spot areas of the YGC were primarily situated in Yueyang and Chenzhou (Figure 8a). From 2000 to 2010, cold spot areas of the YGC were observed in Yueyang, Changde, and Huaihua, and hot spot areas of the YGC occurred in Changsha, Xiangtan, Zhuzhou, and Hengyang (Figure 8b). From 2010 to 2018, cold spot areas of the YGC were located in Hengyang, whereas hot spot spatial clustering was not obvious (Figure 8c). Overall, from 1990 to 2018, cold spot areas of the YGC were located in the Changsha-Zhuzhou-Xiangtan city agglomeration, and cold spot areas of the YGC were observed in Changde, Loudi, and Shaoyang (Figure 8d).
3.2.2. Spatial Autocorrelation of the YGC during the Different Periods
The value of bivariate global Moran’s I reached −0.152 between periods I and II, and the value of bivariate global Moran’s I was −0.137 between periods II and III, indicating that the YGC attained a weak negative spatial autocorrelation over time. Spatially, the negative values were concentrated in Hengyang, Zhuzhou, Huaihua, Xiangxi, Yueyang, and Changde during the first two periods, whilst concentrated in most counties of western Hunan, southern Hunan, and western Hunan during the last two periods. The positive values were concentrated in Shaoyang, Zhangjiajie, Yiyang, and Changsha during the first two periods and concentrated in Changsha, Yueyang, and Changde during the last two periods (Figure 9a,b).
There were high-high clusters near Changsha city and in southern Chenzhou, indicating that the yield gaps in these locations and surrounding neighborhoods continued to widen (Figure 9c,d). Low-low clusters occurred in Loudi and Shaoyang during the first two periods and around Changde, Yiyang, and Yueyang during the last two periods, which indicates that the yield gaps in these regions were significantly narrowing (Figure 9c,d).
3.3. Determinants of the YGC
Normalized importance scores of the influencing factors are shown in Figure 10. We counted the frequency of the top ten scoring factors during each period, and we found that the most frequent factors included GDP per capita (GDPPC, four times) and sunshine hours (SH, four times), followed by the per capita annual net income of farmers (PCAI, three times) and rural electricity consumption (REC, three times), and finally cultivated land quality level (CLPI), farm labor (FL), power of agricultural machinery per area (PAMPA), rural household population (RSP), slope, solar mediation intensity (SMI), temperature (Temp), and tractor-plowed area (TPA), with a frequency of two. To a certain extent, this reflected that the YGC was greatly influenced by these factors.
The importance of these factors revealed distinct characteristics during the different periods (Figure 10). From a temporal perspective, during the former period, climatic factors and land use conditions were the main factors influencing the YGC, but during the latter period, the YGC was mainly determined by climatic and socioeconomic factors. Throughout the whole study period, socioeconomic factors and human investment variables were relatively important to the YGC. From the perspective of the variable types, among the climatic factors, sunshine hours (SH) and temperature (TEMP) remained the main influencing factors of the YGC, while the impacts of solar mediation intensity (SMI) and precipitation (PREC) on the yield gap were relatively limited. Among the socioeconomic factors, GDP per capita (GDPPC), the per capita annual net income of farmers (PCAI), and farm labor (FL) were comparatively important. Among the land use conditions, the area ratio of paddy fields (RPF), slope, and patch density (PD) were relatively important. Among the human investment variables, rural electricity consumption (REC), the proportion of the area sown with grain crops (PSAGC), and the tractor-plowed area (TPA) were comparatively important (Figure 10). As shown in Figure 11, human investment variables and socioeconomic factors were the major influencing factors of the YGC from 1990 to 2018, followed by climatic factors and land use conditions. The importance of human investment variables decreased while the importance of socioeconomic factors increased. Overall, socioeconomic factors are the dominant determinants of the YGC, especially after 2000, and land use conditions yield relative importance for the YGC.
4. Discussion
According to the existing studies [82,83,84,85,86], the YP is based on a step-by-step revision model involving light, temperature, water, and soil data (Equations (1)–(4)). The accuracy of the estimation method was verified by comparing it with the actual output of the experimental field plot in Taoyuan County, Changde city, Hunan Province [82]. Some scholars further corrected the climate production potential by using soil properties to obtain the Ys [86,98,99]. In recent years, this method has been widely used in studies associated with grain production potential measurement and cultivated land protection in China [72,85,86], implying that the method for estimating potential yield is reliable. Our estimated mean values of YS were approximately 13.53 t ha−1 in 1990 and 11.90 t ha−1 in 2018 in Hunan Province. Compared with other studies, which showed that the average YS of grain crops in double-cropping systems is between 10 t ha−1 and 14 t ha−1 in Hunan Province by using the ESAP model [78] and the GAEZ model [20,71], indicating that our method for estimating potential yield is robust. Second, considering the cropping system is crucial in estimating the YGAP [75,100,101], and double cropping is the main farming system in grain production in Hunan Province (Figure 1b and Figure 2a) [71]. In this study, the estimations of potential yield are under a double-cropping system with rice in paddy fields and corn in drylands. Third, we use the statistical data at the county level as the actual farm yields based on the following considerations. On the one hand, the county is the basic and an important unit of government management in China, and the statistical data can reflect the average level of actual grain yields. This method is consistent with the GYGA website (http://www.Yieldgap.org, accessed on 23 September 2021), which is widely used in national YGAP analysis [20]. On the other hand, despite an increasing number of studies employing remote sensing technology and crop growth models to estimate the actual yields in recent years, it is difficult to obtain high-quality data in 1990 and 2000 to perform this work. Comprehensively, the estimation method for the YGAP in this study is simple and conducive to generalization.
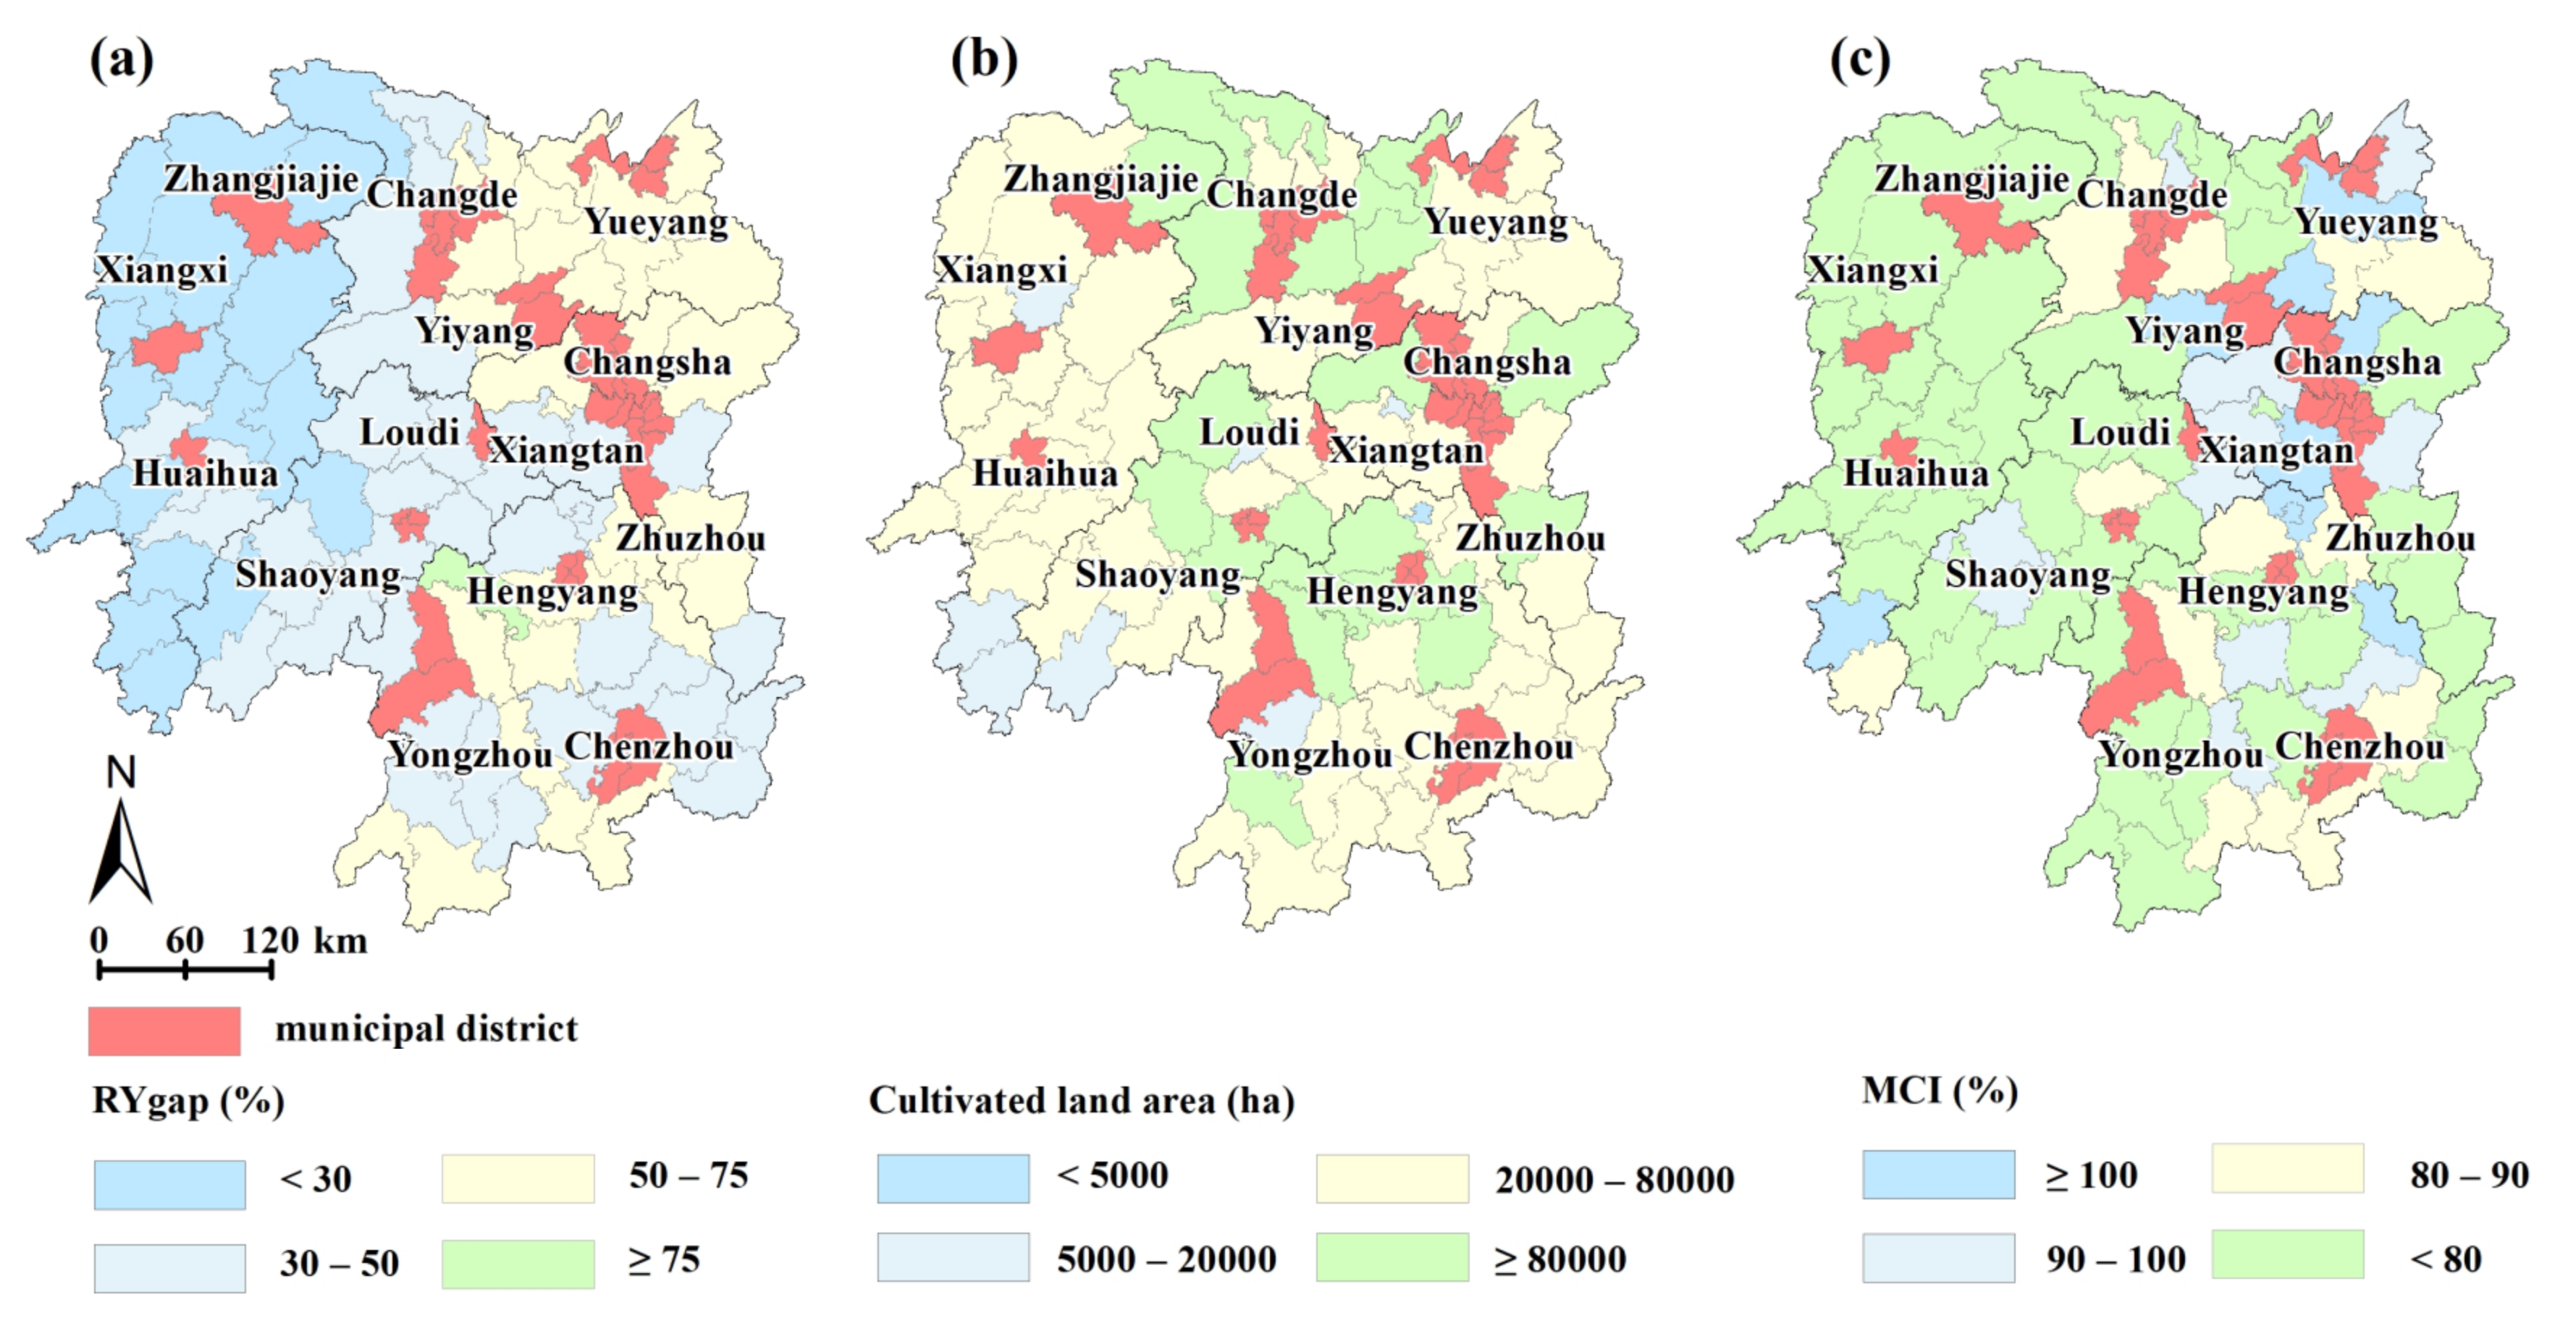
As we know, total grain outputs are closely related to the harvested area and yield per unit area. Existing literature showed that both of them have a larger gap between potential and actual activities in China, especially in the regions such as the middle and lower reaches of the Yangtze River [19,20,102]. Thus, there are two ways to increase food production without cropland expansion. The first one is to improve the cropping intensity [19,103,104,105], another one is to close the yield gap [12]. We found that the yield gap in Hunan Province was 5.84 t ha−1 (49.07% of the potential yield), and the multiple cropping index of grain crops was 0.8 in 2018, indicating that there is a high grain production potential to exploit. This result is consistent with Ye et al. [103], which showed that the arable land intensity of Hunan Province is relatively low. However, this does not mean that all counties in Hunan Province exhibit a high potential. Studies have demonstrated that the attainable yield ranges from approximately 75% to 85% of the potential yield; that is, approximately 15% to 25% of the yield gap cannot be exploited [20,38,39]. Consequently, we should focus on areas where the yield gap is greater than 25% when identifying regions for grain production enhancement. Here we chose a value of 30%. That is, without considering regional planning, socioeconomic, and other factors, 98 counties were identified as important areas where grain production enhancement could be achieved, 34 of which are municipal districts and should be excluded, which suggests that there are 64 counties with much capacity for yield improvement (Figure 12a).
Our results also indicate that the regions located in northern, central, and southern Hunan exhibit great grain production improvement potential by integrating the yield gap (Figure 12a), cultivated land area (Figure 12b), and multiple cropping index of grain crops in 2018 (Figure 12c). These regions possess good natural conditions, the terrain is relatively flat, and it is more suitable to perform large-scale agricultural activities within the context of severe rural labor migration. However, a previous study found that supplementary cultivated land is mainly distributed in northern, southern, and western Hunan [72], indicating that there is an inconsistency in the spatial distributions of supplementary cultivated land and the YGAP, which may result in the low economic efficiency of projects. Other studies reported that the yield gap for early-season rice in Hunan Province is generally higher than that for late-season rice and that the yield gaps are the largest in the northern region for both early- and late-season rice [106]. Consistent with this result, our study also demonstrated that there is much capacity for yield enhancement in northern Hunan, followed by eastern Hunan, southern Hunan, and central Hunan, while western Hunan contains less capacity for yield improvement. Comprehensively, during the implementation of cultivated land protection policies (e.g., the cultivated land balance policy and high-standard farmland construction), these areas should be prioritized to close the yield gap. According to the sown area of grain crops in these 64 counties in 2018, an additional 1.11 million tons of grain can be produced if the actual grain yields can be increased by 5%, which is equivalent to 3.71% of the total grain output in 2018.
As we mentioned before, the yield gap is determined by a combination of natural and socioeconomic conditions, and notable spatial and temporal heterogeneity occurs in the main influencing factors and mechanisms [1,28,38,39]. However, in addition to farm household field management, the macroeconomic environment also has an important impact on the YGC [51,69,76,107]. For example, with rapid urbanization, the economic efficiency of agriculture is low, people prefer to plant other crops to obtain higher economic returns, and rural labor migration and rural aging further result in the abandonment of cultivated land [108]. Therefore, we analyzed the evolution mechanism of the YGC at the county scale, considering not only natural factors but also socioeconomic factors, which are of great significance to guide policy-making related to grain production under real socioeconomic environments.
Previous studies have reported that the potential yield is positively correlated with the total solar radiation, a decrease in radiation leads to a decrease in the potential crop yield, and the potential yield is negatively correlated with the temperature within a certain range [76]. According to the calculation method of the yield gap (Equations (1)–(5)), all the climatic factors attained a positive relationship with the potential yield. However, we found that not all climatic factors played an important role in the YGC. Among these factors, sunshine hours (SH) and temperature (Temp) were relatively more important than other factors in Hunan Province because SH can directly determine the duration of photosynthesis, and temperature can influence the cropping system. This is similar to the results of many other studies [1,109,110]. Deng et al. revealed that the increase in temperature should be synchronized with the increase in water resources [20]. Otherwise, drought may occur, causing a reduction in yield, implying that food production can also be increased by improving irrigation conditions and implementing land consolidation projects of dryland to paddy in places with abundant solar resources and low irrigation ratios, such as southern, central Hunan.
Among the socioeconomic factors, land use conditions, and human investment variables, it seems that field management and human investment variables, such as tractor-plowed area (TPA), area of soil testing and formula fertilization (ASFF), rural electricity consumption (REC), and power of agricultural machinery per area (PAMPA), exert a large impact on the yield gap, but the impact decreases over time. Especially from 2010 to 2018, the yield gap was mainly influenced by macroscopic socioeconomic variables such as the ratio of agricultural GDP (RAGDP) and the per capita annual net income of farmers (PCAI); it appears that with economic development, more and more farmers are unwilling to engage in food production activities [76]. Moreover, during this period, changes in slope imposed a significant effect on the yield gap. According to the data, the average slope value changed from 6.20 to 6.22, which may be caused by the implementation of the cultivated land balance. Specifically, the occurrence of occupied cultivated land is mainly in flat areas, while the slope of supplementary land is relatively large. Additionally, Sun et al. calculated that the correction coefficient of soil is about 0.42 in Hunan Province [86], implying that there is great potential for increasing grain production by improving the cultivated land quality.
Overall, some shortages remain in this study, and further work is needed. Firstly, the potential yield is the ideal yield and is almost impossible to achieve, and the exploitable yield potential is more instructive for agricultural production. However, due to the absence of historical data, it is difficult to estimate the exploitable yield potential for each year. Hence, we calculated the land potential productivity with the step-by-step light, temperature, water, and soil revision model instead. Indeed, the value of the estimated potential yield is relatively larger than that of the available yield, but this does not affect the overall distribution pattern of the yield gap. Secondly, other studies have adopted remote sensing to estimate actual farm yield values [66], which may be more accurate than the use of statistical data. Thirdly, we analyzed the importance of each factor rather than exploring their spatiotemporal influence mechanisms on the YGC, which may limit the applicability of our results on a spatial scale.
Despite these limitations, the systematic methodological framework developed in this study provides a new perspective aimed at coupling the yield gap, determinants, and land use. Related analysis methods could be applied to support cultivated land utilization. In the future, to improve the applicability of the research results, further optimization of the estimation method of the exploitable yield potential and the actual farm yield is needed. In addition, considering only the yield gap to identify regions is insufficient. For instance, certain areas exhibit an irreversible trend of nonagricultural production and nongrain planting due to urbanization, and the yield gap in these regions is inevitably gradually expanding (e.g., Furong district), but these regions cannot be considered for grain production enhancement. Therefore, it is necessary to integrate land resources, population migration, and regional economic development trends under different scenarios to comprehensively identify regions where grain production could be improved and develop a plan for sustainable cultivated land use, agricultural investment, etc. [111,112].
5. Conclusions
In this study, we established a framework applicable to YGAP research and preliminarily implemented the framework. Specifically, we employed a step-by-step revision model involving light, temperature, water, and soil data to assess the potential yield, obtained the actual farm yield based on socioeconomic statistics, and then adopted spatial analysis and spatial statistics methods to evaluate the spatiotemporal evolution and clustering characteristics of the YGAP at the county level in Hunan Province, which is a major grain production region. Finally, the random forest model was adopted to investigate the key influencing factors of the YGC. Based on these analyses, we determined the possible grain yield improvement capacity in Hunan. The proposed framework for YGAP research exhibits good application prospects, and these application schemes could optimize the interaction between natural conditions, the social environment, and management practices. Once popularized, these applications could provide the potential to enhance the allocation of funds for farmland consolidation and could increase the grain yield.
Our results revealed that the YGAP in Hunan Province continued to narrow from 1990 to 2018, and the average value changed from 8.57 t ha−1 (63.36% of the potential yield in 1990) to 5.84 t ha−1 (49.07% of the potential yield in 2018), indicating that there exists a high grain production potential to exploit. From the perspective of dynamics, there is large spatial heterogeneity in the variation of YGCs. Specifically, the YGAPs in 116 counties have narrowed. Of which, 26 counties narrowed by more than 4 t ha−1, 58 counties narrowed from 2–4 t ha−1, and 32 counties narrowed within 2 t ha−1.
Additionally, Our results found that during the former period, climatic factors and land use conditions were the main factors influencing the YGC, but during the latter period, the YGC was mainly determined by climatic and socioeconomic factors. Overall, the GDP per capita (GDPPC), sunshine hours (SH), per capita annual net income of farmers (PCAI), and rural electricity consumption (REC) play a key role in YGCs, reflecting that socioeconomic factors are becoming increasingly important for grain production.
Notably, YGAP analysis can identify the corresponding distribution for yield improvement purposes. However, considering only the YGAP to identify regions is insufficient because agricultural production is also influenced by other factors. Integrating the trends of land use, population migration, and regional development strategies when formulating policies related to grain production and agricultural investment is needed. Therefore, considering the yield gap, cultivated land resources, multiple cropping index, and development orientation, the 64 identified counties, which are mainly located in northern, central, and southern Hunan and have a yield gap greater than 30%, constitute the major areas for grain production enhancement. Our findings offer important scientific value to better understand the law and mechanism of the YGC in Hunan Province and support the decision-making process involving cultivated land use.
Author Contributions
Conceptualization, S.H. and D.Y.; data curation, D.Y., C.X. and P.R.; formal analysis, D.Y., L.T. and C.X.; funding acquisition, S.H.; methodology, D.Y., L.T. and C.X.; project administration, S.H.; software, D.Y., C.X. and P.R.; supervision, S.H. and L.T.; validation, D.Y., S.H. and L.T.; visualization, D.Y., C.X. and P.R.; writing—original draft, D.Y.; writing—review & editing, S.H., L.T., D.Y. and C.X. All authors have read and agreed to the published version of the manuscript.
Funding
This work was funded by the major projects of the National Social Science Fund (18ZDA053) of China.
Institutional Review Board Statement
Not applicable.
Informed Consent Statement
Not applicable.
Data Availability Statement
Data is contained within the article.
Acknowledgments
The authors would like to thank Peng Zhang at Chang’an University and Zongnan Hu at China University of Geosciences, Wuhan, for their assistance with data processing. Gratitude is also due to the anonymous reviewers for their comments that have greatly improved this article from its original form.
Conflicts of Interest
The authors declare no conflict of interest.
References
- Lobell, D.B.; Schlenker, W.; Costa-Roberts, J. Climate Trends and Global Crop Production Since 1980. Science 2011, 333, 616. [Google Scholar] [CrossRef] [PubMed] [Green Version]
- Fischer, R.A.; Connor, D.J. Issues for cropping and agricultural science in the next 20 years. Field Crop. Res. 2018, 222, 121–142. [Google Scholar] [CrossRef]
- Springmann, M.; Clark, M.; Mason-D’Croz, D.; Wiebe, K.; Bodirsky, B.L.; Lassaletta, L.; de Vries, W.; Vermeulen, S.J.; Herrero, M.; Carlson, K.M.; et al. Options for keeping the food system within environmental limits. Nature 2018, 562, 519–525. [Google Scholar] [CrossRef] [PubMed]
- Fujimori, S.; Hasegawa, T.; Krey, V.; Riahi, K.; Bertram, C.; Bodirsky, B.L.; Bosetti, V.; Callen, J.; Després, J.; Doelman, J.; et al. A multi-model assessment of food security implications of climate change mitigation. Nat. Sustain. 2019, 2, 386–396. [Google Scholar] [CrossRef] [Green Version]
- Gu, B. Four steps to food security for swelling cities. Nature 2019, 566, 31–33. [Google Scholar] [CrossRef]
- El Bilali, H.; Strassner, C.; Ben Hassen, T. Sustainable Agri-Food Systems: Environment, Economy, Society, and Policy. Sustainability 2021, 13, 6260. [Google Scholar] [CrossRef]
- Jensen, P.D.; Orfila, C. Mapping the production-consumption gap of an urban food system: An empirical case study of food security and resilience. Food Secur. 2021, 13, 551–570. [Google Scholar] [CrossRef]
- Dogliotti, S.; Garcia, M.C.; Peluffo, S.; Dieste, J.P.; Pedemonte, A.J.; Bacigalupe, G.F.; Scarlato, M.; Alliaume, F.; Alvarez, J.; Chiappe, M.; et al. Co-innovation of family farm systems: A systems approach to sustainable agriculture. Agric. Syst. 2014, 126, 76–86. [Google Scholar] [CrossRef]
- Piñeiro, V.; Arias, J.; Dürr, J.; Elverdin, P.; Ibáñez, A.M.; Kinengyere, A.; Opazo, C.M.; Owoo, N.; Page, J.R.; Prager, S.D.; et al. A scoping review on incentives for adoption of sustainable agricultural practices and their outcomes. Nat. Sustain. 2020, 3, 809–820. [Google Scholar] [CrossRef]
- Zhou, W.; Duan, F. Closing crop yield and efficiency gaps for food security and sustainable agriculture. J. Integr. Agric. 2021, 20, 343–348. [Google Scholar] [CrossRef]
- Global Network against Food Crises (GNAFC). 2021 Global Report on Food Crises. 2021. Available online: https://www.wfp.org/publications/global-report-food-crises-2021 (accessed on 14 July 2021).
- Fan, S.; Teng, P.; Ping, C.; Smith, G.; Copeland, L. Food system resilience and COVID-19–Lessons from the Asian experience. Glob. Food Secur. 2021, 28, 100501. [Google Scholar] [CrossRef]
- Meyer, M.A. The role of resilience in food system studies in low- and middle-income countries. Glob. Food Secur. 2020, 24, 100356. [Google Scholar] [CrossRef]
- Zhan, Y.; Chen, K. Building resilient food system amidst COVID-19: Responses and lessons from China. Agric. Syst. 2021, 190, 103102. [Google Scholar] [CrossRef]
- Amicarelli, V.; Bux, C. Food waste measurement toward a fair, healthy and environmental-friendly food system: A critical review. Br. Food J. 2020, 123, 2907–2935. [Google Scholar] [CrossRef]
- International Food Policy Research Institute (IFPRI). 2019 Global Food Policy Report; International Food Policy Research Institute: Washington, DC, USA, 2019. [Google Scholar] [CrossRef]
- FAO. The State of Food and Agriculture 2019. In Moving forward on Food Loss and Waste Reduction; Food and Agriculture Organization of the United States: Rome, Italy, 2019. [Google Scholar]
- Zhang, H. Establish a Policy System to Develop Agricultural Science and Technology, 2022. Available online: https://www.caas.cn/xwzx/yw/318630.html (accessed on 30 March 2022). (In Chinese).
- Wu, W.; Yu, Q.; You, L.; Chen, K.; Tang, H.; Liu, J. Global cropping intensity gaps: Increasing food production without cropland expansion. Land Use Policy 2018, 76, 515–525. [Google Scholar] [CrossRef]
- Deng, N.; Grassini, P.; Yang, H.; Huang, J.; Cassman, K.G.; Peng, S. Closing yield gaps for rice self-sufficiency in China. Nat. Commun. 2019, 10, 1725. [Google Scholar] [CrossRef] [Green Version]
- Piao, S.; Ciais, P.; Huang, Y.; Shen, Z.; Peng, S.; Li, J.; Zhou, L.; Liu, H.; Ma, Y.; Ding, Y.; et al. The impacts of climate change on water resources and agriculture in China. Nature 2010, 467, 43–51. [Google Scholar] [CrossRef]
- Long, H.; Zou, J. Grain production driven by variations in farmland use in China: An analysis of security patterns. J. Resour. Ecol. 2010, 1, 60–67. [Google Scholar] [CrossRef]
- Liu, X.; Zhao, C.; Song, W. Review of the evolution of cultivated land protection policies in the period following China’s reform and liberalization. Land Use Policy 2017, 67, 660–669. [Google Scholar] [CrossRef]
- Du, X.; Zhang, X.; Jin, X. Assessing the effectiveness of land consolidation for improving agricultural productivity in China. Land Use Policy 2018, 70, 360–367. [Google Scholar] [CrossRef]
- Zhou, Y.; Li, X.; Liu, Y. Cultivated land protection and rational use in China. Land Use Policy 2021, 106, 105454. [Google Scholar] [CrossRef]
- Ray, D.K.; Ramankutty, N.; Mueller, N.D.; West, P.C.; Foley, J.A. Recent patterns of crop yield growth and stagnation. Nat. Commun. 2012, 3, 1293. [Google Scholar] [CrossRef] [Green Version]
- Meng, Q.; Hou, P.; Wu, L.; Chen, X.; Cui, Z.; Zhang, F. Understanding production potentials and yield gaps in intensive maize production in China. Field Crop. Res. 2013, 143, 91–97. [Google Scholar] [CrossRef] [Green Version]
- Fischer, R.A. Definitions and determination of crop yield, yield gaps, and of rates of change. Field Crop. Res. 2015, 182, 9–18. [Google Scholar] [CrossRef]
- Haddad, L.; Hawkes, C.; Waage, J.; Webb, P.; Godfray, C.; Toulmin, C. Food Systems and Diets: Facing the Challenges of the 21st Century; Global Panel on Agriculture and Food Systems for Nutrition: London, UK, 2016. [Google Scholar]
- Lombardi, G.V.; Parrini, S.; Atzori, R.; Stefani, G.; Liu, G. Sustainable agriculture, food security and diet diversity. The case study of tuscany, Italy. Ecol. Model. 2021, 458, 109702. [Google Scholar] [CrossRef]
- Renard, D.; Tilman, D. National food production stabilized by crop diversity. Nature 2019, 571, 257–260. [Google Scholar] [CrossRef]
- Niu, Y.; Xie, G.; Xiao, Y.; Liu, J.; Wang, Y.; Luo, Q.; Zou, H.; Gan, S.; Qin, K.; Huang, M. Spatiotemporal Patterns and Determinants of Grain Self-Sufficiency in China. Foods 2021, 10, 747. [Google Scholar] [CrossRef] [PubMed]
- Wang, J.; Zhang, Z.; Liu, Y. Spatial shifts in grain production increases in China and implications for food security. Land Use Policy 2018, 74, 204–213. [Google Scholar] [CrossRef]
- He, G.; Zhao, Y.; Wang, L.; Jian, S.; Zhu, Y. China’s food security challenge: Effects of food habit changes on requirements for arable land and water. J. Clean Prod. 2019, 229, 739–750. [Google Scholar] [CrossRef]
- Fresco, L.O. Issues in farming systems research. Neth. J. Agric. Sci. 1984, 32, 253–261. [Google Scholar] [CrossRef]
- de Bie, C.A.J.M. Comparative Performance an Analysis of Agro-Ecosystems; Wageningen Agricultural University: Wageningen, The Netherlands, 2000. [Google Scholar]
- Lobell, D.B.; Ortiz-Monasterio, J.I. Regional importance of crop yield constraints: Linking simulation models and geostatistics to interpret spatial patterns. Ecol. Model. 2006, 196, 173–182. [Google Scholar] [CrossRef]
- Lobell, D.B.; Cassman, K.G.; Field, C.B. Crop Yield Gaps: Their Importance, Magnitudes, and Causes. Annu. Rev. Environ. Resour. 2009, 34, 179–204. [Google Scholar] [CrossRef] [Green Version]
- van Ittersum, M.K.; Cassman, K.G. Yield gap analysis—Rationale, methods and applications—Introduction to the Special Issue. Field Crop. Res. 2013, 143, 1–3. [Google Scholar] [CrossRef] [Green Version]
- van Ittersum, M.K.; Cassman, K.G.; Grassini, P.; Wolf, J.; Tittonell, P.; Hochman, Z. Yield gap analysis with local to global relevance—A review. Field Crop. Res. 2013, 143, 4–17. [Google Scholar] [CrossRef] [Green Version]
- Eash, L.; Fonte, S.J.; Sonder, K.; Honsdorf, N.; Schmidt, A.; Govaerts, B.; Verhulst, N. Factors contributing to maize and bean yield gaps in Central America vary with site and agroecological conditions. J. Agric. Sci. 2019, 157, 300–317. [Google Scholar] [CrossRef] [Green Version]
- Nhamo, N.; Rodenburg, J.; Zenna, N.; Makombe, G.; Luzi-Kihupi, A. Narrowing the rice yield gap in East and Southern Africa: Using and adapting existing technologies. Agric. Syst. 2014, 131, 45–55. [Google Scholar] [CrossRef]
- Senapati, N.; Semenov, M.A. Large genetic yield potential and genetic yield gap estimated for wheat in Europe. Glob. Food Sec. 2020, 24, 100340. [Google Scholar] [CrossRef]
- Stuart, A.M.; Pame, A.R.P.; Silva, J.V.; Dikitanan, R.C.; Rutsaert, P.; Malabayabas, A.J.B.; Lampayan, R.M.; Radanielson, A.M.; Singleton, G.R. Yield gaps in rice-based farming systems: Insights from local studies and prospects for future analysis. Field Crop. Res. 2016, 194, 43–56. [Google Scholar] [CrossRef] [Green Version]
- van Vugt, D.; Franke, A.C. Exploring the yield gap of orange-fleshed sweet potato varieties on smallholder farmers’ fields in Malawi. Field Crop. Res. 2018, 221, 245–256. [Google Scholar] [CrossRef]
- Zu, Q.; Mi, C.; Liu, D.; He, L.; Kuang, Z.; Fang, Q.; Ramp, D.; Li, L.; Wang, B.; Chen, Y.; et al. Spatio-temporal distribution of sugarcane potential yields and yield gaps in Southern China. Eur. J. Agron. 2018, 92, 72–83. [Google Scholar] [CrossRef]
- Zhang, Z.; Lu, J.; Cong, R.; Ren, T.; Li, X. Evaluating agroclimatic constraints and yield gaps for winter oilseed rape (Brassica napus L.)-A case study. Sci. Rep. 2017, 7, 7852. [Google Scholar] [CrossRef] [Green Version]
- Geerts, S.; Raes, D.; Garcia, M.; Taboada, C.; Miranda, R.; Cusicanqui, J.; Mhizha, T.; Vacher, J. Modeling the potential for closing quinoa yield gaps under varying water availability in the Bolivian Altiplano. Agric. Water Manag. 2009, 96, 1652–1658. [Google Scholar] [CrossRef]
- Adiele, J.G.; Schut, A.G.T.; van den Beuken, R.P.M.; Ezui, K.S.; Pypers, P.; Ano, A.O.; Egesi, C.N.; Giller, K.E. Towards closing cassava yield gap in West Africa: Agronomic efficiency and storage root yield responses to NPK fertilizers. Field Crop. Res. 2020, 253, 107820. [Google Scholar] [CrossRef]
- Visses, F.D.; Sentelhas, P.C.; Pereira, A.B. Yield gap of cassava crop as a measure of food security-an example for the main Brazilian producing regions. Food Secur. 2018, 10, 1191–1202. [Google Scholar] [CrossRef]
- Zhang, D.; Wang, C.; Li, X.; Yang, X.; Zhao, L.; Xia, S. Correlation of production constraints with the yield gap of apple cropping systems in Luochuan County, China. J. Integr. Agric. 2019, 18, 1714–1725. [Google Scholar] [CrossRef]
- Mayberry, D.; Ash, A.; Prestwidge, D.; Godde, C.M.; Henderson, B.; Duncan, A.; Blummel, M.; Reddy, Y.R.; Herrero, M. Yield gap analyses to estimate attainable bovine milk yields and evaluate options to increase production in Ethiopia and India. Agric. Syst. 2017, 155, 43–51. [Google Scholar] [CrossRef]
- Mayberry, D.; Ash, A.; Prestwidge, D.; Herrero, M. Closing yield gaps in smallholder goat production systems in Ethiopia and India. Livest. Sci. 2018, 214, 238–244. [Google Scholar] [CrossRef]
- Souza, P.; Farias, V.D.D.; Pinto, J.V.N.; Nunes, H.; Souza, E.B.D.; Fraisse, C.W. Yield gap in cowpea plants as function of water deficits during reproductive stage. Rev. Bras. Eng. Agric. Ambient. 2020, 24, 372–378. [Google Scholar] [CrossRef]
- Deines, J.M.; Patel, R.; Liang, S.Z.; Dado, W.; Lobell, D.B. A million kernels of truth: Insights into scalable satellite maize yield mapping and yield gap analysis from an extensive ground dataset in the US Corn. Remote Sens. Environ. 2021, 253, 112174. [Google Scholar] [CrossRef]
- Wang, J.; Zhang, J.; Bai, Y.; Zhang, S.; Yang, S.; Yao, F. Integrating remote sensing-based process model with environmental zonation scheme to estimate rice yield gap in Northeast China. Field Crop. Res. 2020, 246, 107682. [Google Scholar] [CrossRef]
- Rattalino Edreira, J.I.; Andrade, J.F.; Cassman, K.G.; van Ittersum, M.K.; van Loon, M.P.; Grassini, P. Spatial frameworks for robust estimation of yield gaps. Nat. Food 2021, 2, 773–779. [Google Scholar] [CrossRef]
- Boling, A.A.; Tuong, T.P.; van Keulen, H.; Bouman, B.A.M.; Suganda, H.; Spiertz, J.H.J. Yield gap of rainfed rice in farmers’ fields in Central Java, Indonesia. Agric. Syst. 2010, 103, 307–315. [Google Scholar] [CrossRef]
- Yang, X.; Liu, Z. Advances in Research on Crop Yield Gaps. Sci. Agric. Sin. 2014, 47, 2731–2741. (In Chinese) [Google Scholar] [CrossRef]
- Zhao, Y.; Chen, X.; Cui, Z.; Lobell, D.B. Using satellite remote sensing to understand maize yield gaps in the North China Plain. Field Crop. Res. 2015, 183, 31–42. [Google Scholar] [CrossRef]
- Lawes, R.; Chen, C.; Whish, J.; Meier, E.; Ouzman, J.; Gobbett, D.; Vadakattu, G.; Ota, N.; van Rees, H. Applying more nitrogen is not always sufficient to address dryland wheat yield gaps in Australia. Field Crop. Res. 2021, 262, 108033. [Google Scholar] [CrossRef]
- Egli, D.B. Comparison of corn and soybean yields in the United States: Historical trends and future prospects. Agron. J. 2008, 100, S79–S88. [Google Scholar] [CrossRef] [Green Version]
- Bryan, B.A.; King, D.; Zhao, G. Influence of management and environment on Australian wheat: Information for sustainable intensification and closing yield gaps. Environ. Res. Lett. 2014, 9, 044005. [Google Scholar] [CrossRef]
- Guo, Y.; Chen, M.; Pan, J.; Shang, Y.; Wu, X.; Cui, Z. Increasing soil organic carbon sequestration while closing the yield gap in Chinese wheat production. Land Degrad. Dev. 2021, 32, 1274–1286. [Google Scholar] [CrossRef]
- Tseng, M.-C.; Roel, Á.; Macedo, I.; Marella, M.; Terra, J.; Zorrilla, G.; Pittelkow, C.M. Field-level factors for closing yield gaps in high-yielding rice systems of Uruguay. Field Crop. Res. 2021, 264, 108097. [Google Scholar] [CrossRef]
- Dehkordi, P.A.; Nehbandani, A.; Hassanpour-bourkheili, S.; Kamkar, B. Yield Gap Analysis Using Remote Sensing and Modelling Approaches: Wheat in the Northwest of Iran. Int. J. Plant Prod. 2020, 14, 443–452. [Google Scholar] [CrossRef]
- Djurfeldt, G.; Hall, O.; Jirstrom, M.; Bustos, M.A.; Holmquist, B.; Nasrin, S. Using panel survey and remote sensing data to explain yield gaps for maize in sub-Saharan Africa. J. Land Use Sci. 2018, 13, 344–357. [Google Scholar] [CrossRef] [Green Version]
- Silva, J.V.; Reidsma, P.; Laborte, A.G.; van Ittersum, M.K. Explaining rice yields and yield gaps in Central Luzon, Philippines: An application of stochastic frontier analysis and crop modelling. Eur. J. Agron. 2017, 82, 223–241. [Google Scholar] [CrossRef]
- Zhang, W.; Cao, G.; Li, X.; Zhang, H.; Wang, C.; Liu, Q.; Chen, X.; Cui, Z.; Shen, J.; Jiang, R.; et al. Closing yield gaps in China by empowering smallholder farmers. Nature 2016, 537, 671–674. [Google Scholar] [CrossRef]
- Debnath, S.; Mishra, A.; Mailapalli, D.R.; Raghuwanshi, N.S. Identifying most promising agronomic adaptation strategies to close rainfed rice yield gap in future: A model-based assessment. J. Water Clim. Change 2021, 12, 2854–2874. [Google Scholar] [CrossRef]
- Liu, L.; Chen, X.; Xu, X.; Wang, Y.; Li, S.; Fu, Y. Changes in production potential in China in response to climate change from 1960 to 2010. Adv. Meteorol. 2014, 2014, 640320. [Google Scholar] [CrossRef]
- Yu, D.; Hu, S.; Tong, L.; Xia, C. Spatiotemporal Dynamics of Cultivated Land and Its Influences on Grain Production Potential in Hunan Province, China. Land 2020, 9, 510. [Google Scholar] [CrossRef]
- Andrea, M.C.D.; Boote, K.J.; Sentelhas, P.C.; Romanelli, T.L. Variability and limitations of maize production in Brazil: Potential yield, water-limited yield and yield gaps. Agric. Syst. 2018, 165, 264–273. [Google Scholar] [CrossRef]
- Bai, H.; Wang, J.; Fang, Q.; Yin, H. Modeling the sensitivity of wheat yield and yield gap to temperature change with two contrasting methods in the North China Plain. Clim. Chang. 2019, 156, 589–607. [Google Scholar] [CrossRef]
- Khaliq, T.; Gaydon, D.S.; Ahmad, M.U.D.; Cheema, M.J.M.; Gull, U. Analyzing crop yield gaps and their causes using cropping systems modelling-A case study of the Punjab rice-wheat system, Pakistan. Field Crop. Res. 2019, 232, 119–130. [Google Scholar] [CrossRef]
- Zhang, H.; Tao, F.L.; Zhou, G.S. Potential yields, yield gaps, and optimal agronomic management practices for rice production systems in different regions of China. Agric. Syst. 2019, 171, 100–112. [Google Scholar] [CrossRef]
- Zhang, P.; Hu, S.; Li, W.; Zhang, C.; Qu, S. Modeling fine-scale residential land price distribution: An experimental study using open data and machine learning. Appl. Geogr. 2019, 129, 102442. [Google Scholar] [CrossRef]
- Jin, G.; Li, Z.; Deng, X.; Yang, J.; Chen, D.; Li, W. An analysis of spatiotemporal patterns in Chinese agricultural productivity between 2004 and 2014. Ecol. Indic. 2019, 105, 591–600. [Google Scholar] [CrossRef]
- Beza , E.; Silva, J.V.; Kooistra, L.; Reidsma, P. Review of yield gap explaining factors and opportunities for alternative data collection approaches. Eur. J. Agron. 2017, 82, 206–222. [Google Scholar] [CrossRef]
- Licker, R.; Johnston, M.; Foley, J.A.; Barford, C.; Kucharik, C.J.; Monfreda, C.; Ramankutty, N. Mind the gap: How do climate and agricultural management explain the ‘yield gap’ of croplands around the world? Glob. Ecol. Biogeogr. 2010, 19, 769–782. [Google Scholar] [CrossRef]
- Mengistu, S.B.; Mulder, H.A.; Benzie, J.A.H.; Komen, H. A systematic literature review of the major factors causing yield gap by affecting growth, feed conversion ratio and survival in Nile tilapia (Oreochromis niloticus). Rev. Aquac. 2010, 12, 524–541. [Google Scholar] [CrossRef] [Green Version]
- Deng, G.; Feng, X. Light and temperature resources and climate production potential. Resour. Sci. 1980, 4, 11–16. (In Chinese) [Google Scholar]
- Huang, P.-W. Environmental factors and the potential agricultural productivity of China: An analysis of sunlight, temperature, and soil moisture. In The Environment: Chinese and American Views; Methuen: New York, NY, USA, 1981; pp. 45–70. [Google Scholar]
- Hou, G.; Liu, Y. Climate production potential and its zoning in China. Resour. Sci. 1985, 3, 52–59. (In Chinese) [Google Scholar]
- Yang, X.; Cheng, C.; Li, Y. Effect of cropland occupation and supplement on light-temperature potential productivity in China from 2000 to 2008. Chin. Geogr. Sci. 2010, 20, 536–544. [Google Scholar] [CrossRef] [Green Version]
- Sun, W.; Guo, C.; Zhu, Y. Average Soil Potential Productivity of Hunan Province, China, 1981–2010. Acta Geogr. Sin. 2020, 69, 90–94. [Google Scholar] [CrossRef]
- FAO. Reports of the agro-ecological zones project. In World Soil Resources Report; FAO: Rome, Italy, 1979; p. 48. [Google Scholar]
- Fischer, G.; Nachtergaele, F.; Prieler, S.; Van Velthuizen, H.; Verelst, L.; Wiberg, D. Global Agro-Ecological Zones Assessment for Agriculture (GAEZ 2008); IIASA: Laxenburg, Austria; FAO: Rome, Italy, 2008. [Google Scholar]
- Albritton, E.C. Standard values in nutrition and metabolism. LWW 1955, 79, 80. [Google Scholar]
- Chu, C. Some characteristic features of Chinese climate and their effects on crop production. Acta Geogr. Sin. 1964, 30, 1–13. (In Chinese) [Google Scholar]
- Lee, S.I. Developing a bivariate spatial association measure: An integration of Pearson’s r and Moran’s I. J. Geogr. Syst. 2001, 3, 369–385. [Google Scholar] [CrossRef]
- Anselin, L.; Syabri, I.; Smirnov, O. Visualizing Multivariate Spatial Correlation with Dynamically Linked Windows; University of California Santa Barbara Cd Rom: Santa Barbara, CA, USA, 2002. [Google Scholar]
- Bone, C.; Wulder, M.A.; White, J.C.; Robertson, C.; Nelson, T.A. A GIS-based risk rating of forest insect outbreaks using aerial overview surveys and the local Local Moran’s I statistic. Appl. Geogr. 2013, 40, 161–170. [Google Scholar] [CrossRef]
- Neumann, K.; Verburg, P.H.; Stehfest, E.; Müller, C. The yield gap of global grain production: A spatial analysis. Agric. Syst. 2010, 103, 316–326. [Google Scholar] [CrossRef]
- Jiang, G.; Zhang, R.; Ma, W.; Zhou, D.; Wang, X.; He, X. Cultivated land productivity potential improvement in land consolidation schemes in Shenyang, China: Assessment and policy implications. Land Use Policy 2017, 68, 80–88. [Google Scholar] [CrossRef]
- Jain, M.; Singh, B.; Srivastava, A.A.K.; Malik, R.K.; McDonald, A.J.; Lobell, D.B. Using satellite data to identify the causes of and potential solutions for yield gaps in India’s Wheat Belt. Environ. Res. Lett. 2017, 12, 094011. [Google Scholar] [CrossRef]
- Liaw, A.; Wiener, M. Classification and regression by random Forest. R News 2002, 2, 18–22. [Google Scholar]
- Feng, Z.; Yang, Y.; Zhang, J.; Wang, X. A GIS-Based Study on the Grain Productivity and Potential Yield Increase at Multi-levels in China. J. Nat. Resour. 2007, 22, 747–756. (In Chinese) [Google Scholar] [CrossRef]
- Deng, X.; Gibson, J.; Wang, P. Management of trade-offs between cultivated land conversions and land productivity in Shandong province. J. Clean. Prod. 2017, 142, 767–774. [Google Scholar] [CrossRef]
- Hochman, Z.; Gobbett, D.; Holzworth, D.; McClelland, T.; van Rees, H.; Marinoni, O.; Garcia, J.N.; Horan, H. Quantifying yield gaps in rainfed cropping systems: A case study of wheat in Australia. Field Crop. Res. 2013, 136, 85–96. [Google Scholar] [CrossRef]
- Guilpart, N.; Grassini, P.; Sadras, V.O.; Timsina, J.; Cassman, K.G. Estimating yield gaps at the cropping system level. Field Crop. Res. 2017, 206, 21–32. [Google Scholar] [CrossRef]
- Yu, Q.; Wu, W.; You, L.; Zhu, T.; van Vliet, J.; Verburg, P.H.; Liu, Z.; Li, Z.; Yang, P.; Zhou, Q.; et al. Assessing the harvested area gap in China. Agric. Syst. 2017, 153, 212–220. [Google Scholar] [CrossRef]
- Ye, S.; Song, C.; Shen, S.; Gao, P.; Zhu, D. Spatial pattern of arable land-use intensity in china. Land Use Policy 2020, 99, 104845. [Google Scholar] [CrossRef]
- Ray, D.K.; Foley, J.A. Increasing global crop harvest frequency: Recent trends and future directions. Environ. Res. Lett. 2013, 8, 044041. [Google Scholar] [CrossRef]
- Gou, F.; Yin, W.; Hong, Y.; van der Werf, W.; Chai, Q.; Heerink, N.; van Ittersum, M.K. On yield gaps and yield gains in intercropping: Opportunities for increasing grain production in northwest China. Agric. Syst. 2017, 151, 96–105. [Google Scholar] [CrossRef]
- Guo, E.; Yang, X.; Wang, X.; Zhang, T.; Huang, W.; Liu, Z.; Tao, L. Spatial-Temporal Distribution of Double Cropping Rice’s Yield Gap in Hunan Province. Sci. Agric. Sin. 2017, 50, 399–412. (In Chinese) [Google Scholar] [CrossRef]
- Zhang, T.; Yang, X.; Wang, H.; Li, Y.; Ye, Q. Climatic and technological ceilings for Chinese rice stagnation based on yield gaps and yield trend pattern analysis. Glob. Chang. Biol. 2014, 20, 1289–1298. [Google Scholar] [CrossRef]
- Liao, L.; Long, H.; Gao, X.; Ma, E. Effects of land use transitions and rural aging on agricultural production in China’s farming area: A perspective from changing labor employing quantity in the planting industry. Land Use Policy 2019, 88, 104152. [Google Scholar] [CrossRef]
- Chen, F.; Sushil, P.; Shijun, D. Changing rice cropping patterns: Evidence from the Yangtze River Valley, China. Outlook Agric. 2013, 42, 109–115. [Google Scholar] [CrossRef]
- Deng, N.; Ling, X.; Sun, Y.; Zhang, C.; Fahad, S.; Peng, S.; Cui, K.; Nie, L.; Huang, J. Influence of temperature and solar radiation on grain yield and quality in irrigated rice system. Eur. J. Agron. 2015, 64, 37–46. [Google Scholar] [CrossRef]
- Liu, Y. Introduction to land use and rural sustainability in China. Land Use Policy 2018, 74, 1–4. [Google Scholar] [CrossRef]
- Long, H.; Zhang, Y.; Tu, S. Rural vitalization in China: A perspective of land consolidation. J. Geogr. Sci. 2019, 29, 517–530. [Google Scholar] [CrossRef] [Green Version]
Figure 1.
The location (a) and the cropping systems of Hunan Province (b).
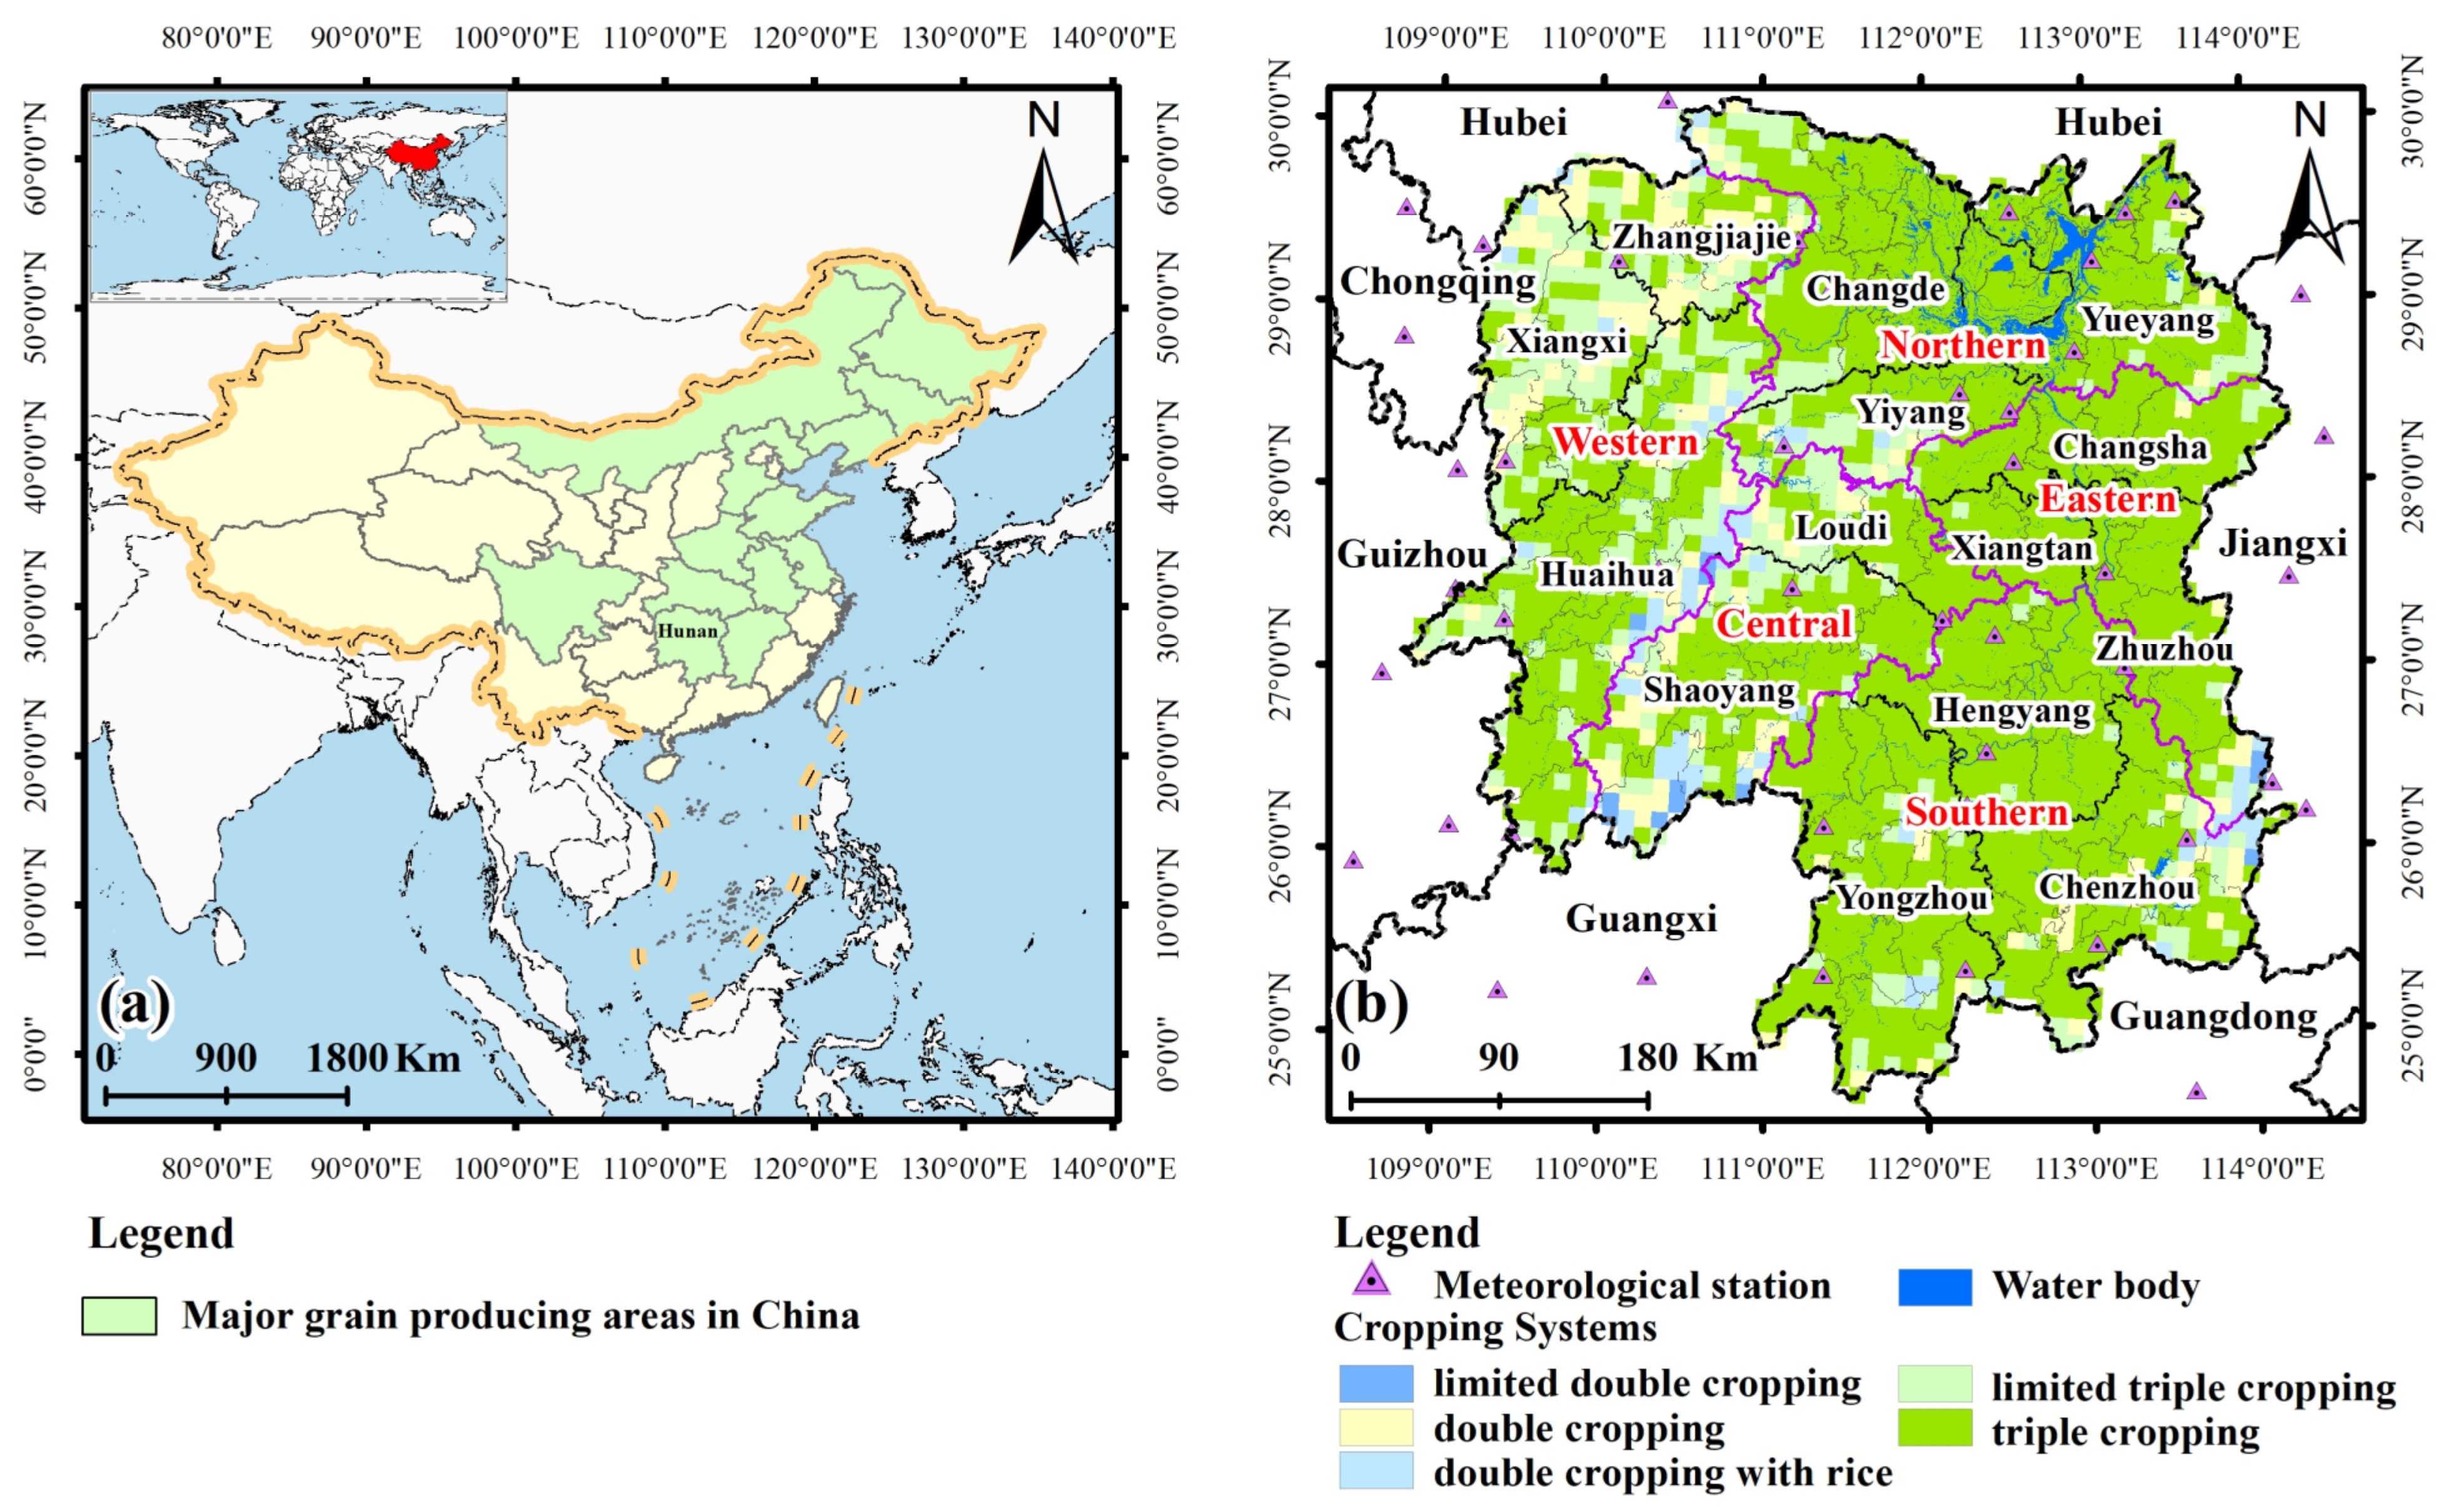
Figure 2.
Sown area (a) and yield (b) of the crops planted in Hunan Province, China during 1949–2019.
Figure 2.
Sown area (a) and yield (b) of the crops planted in Hunan Province, China during 1949–2019.
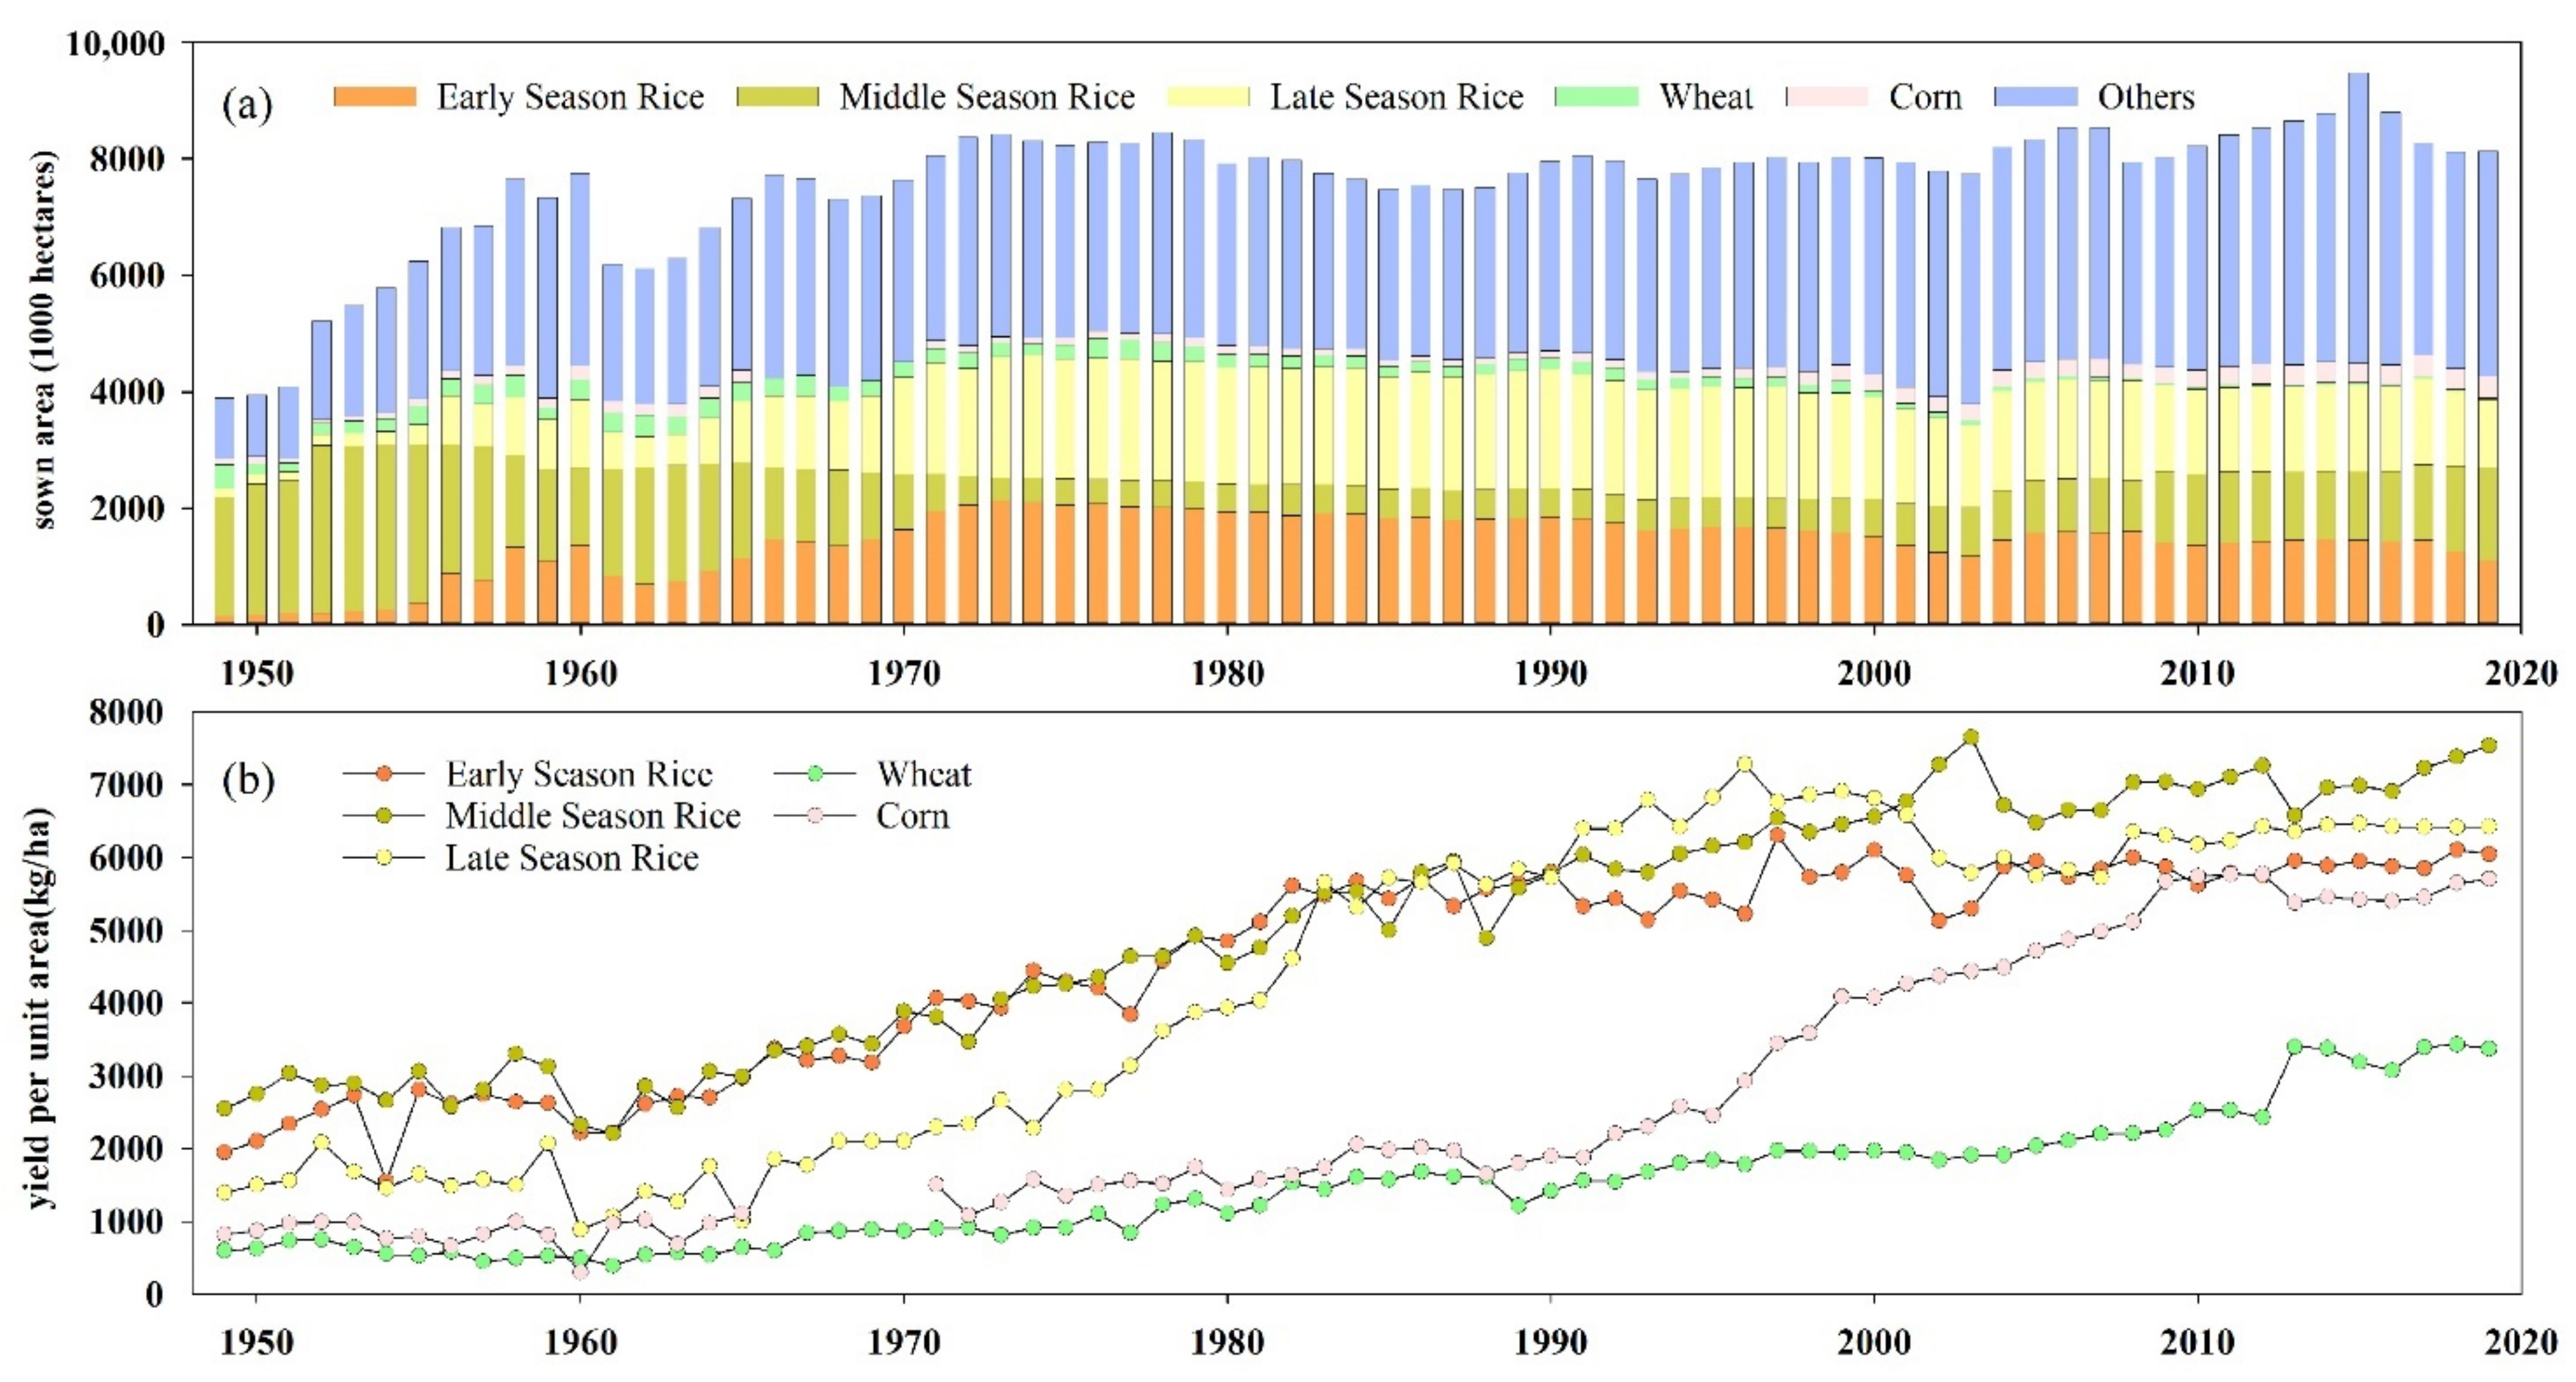
Figure 3.
The overall methodological framework for yield gap analysis.

Figure 4.
Spatiotemporal variation of YGAP in Hunan Province from 1990 to 2018. (a–d) refer to the yield gaps of each county in 1990, 2000, 2010, and 2018, respectively.
Figure 4.
Spatiotemporal variation of YGAP in Hunan Province from 1990 to 2018. (a–d) refer to the yield gaps of each county in 1990, 2000, 2010, and 2018, respectively.
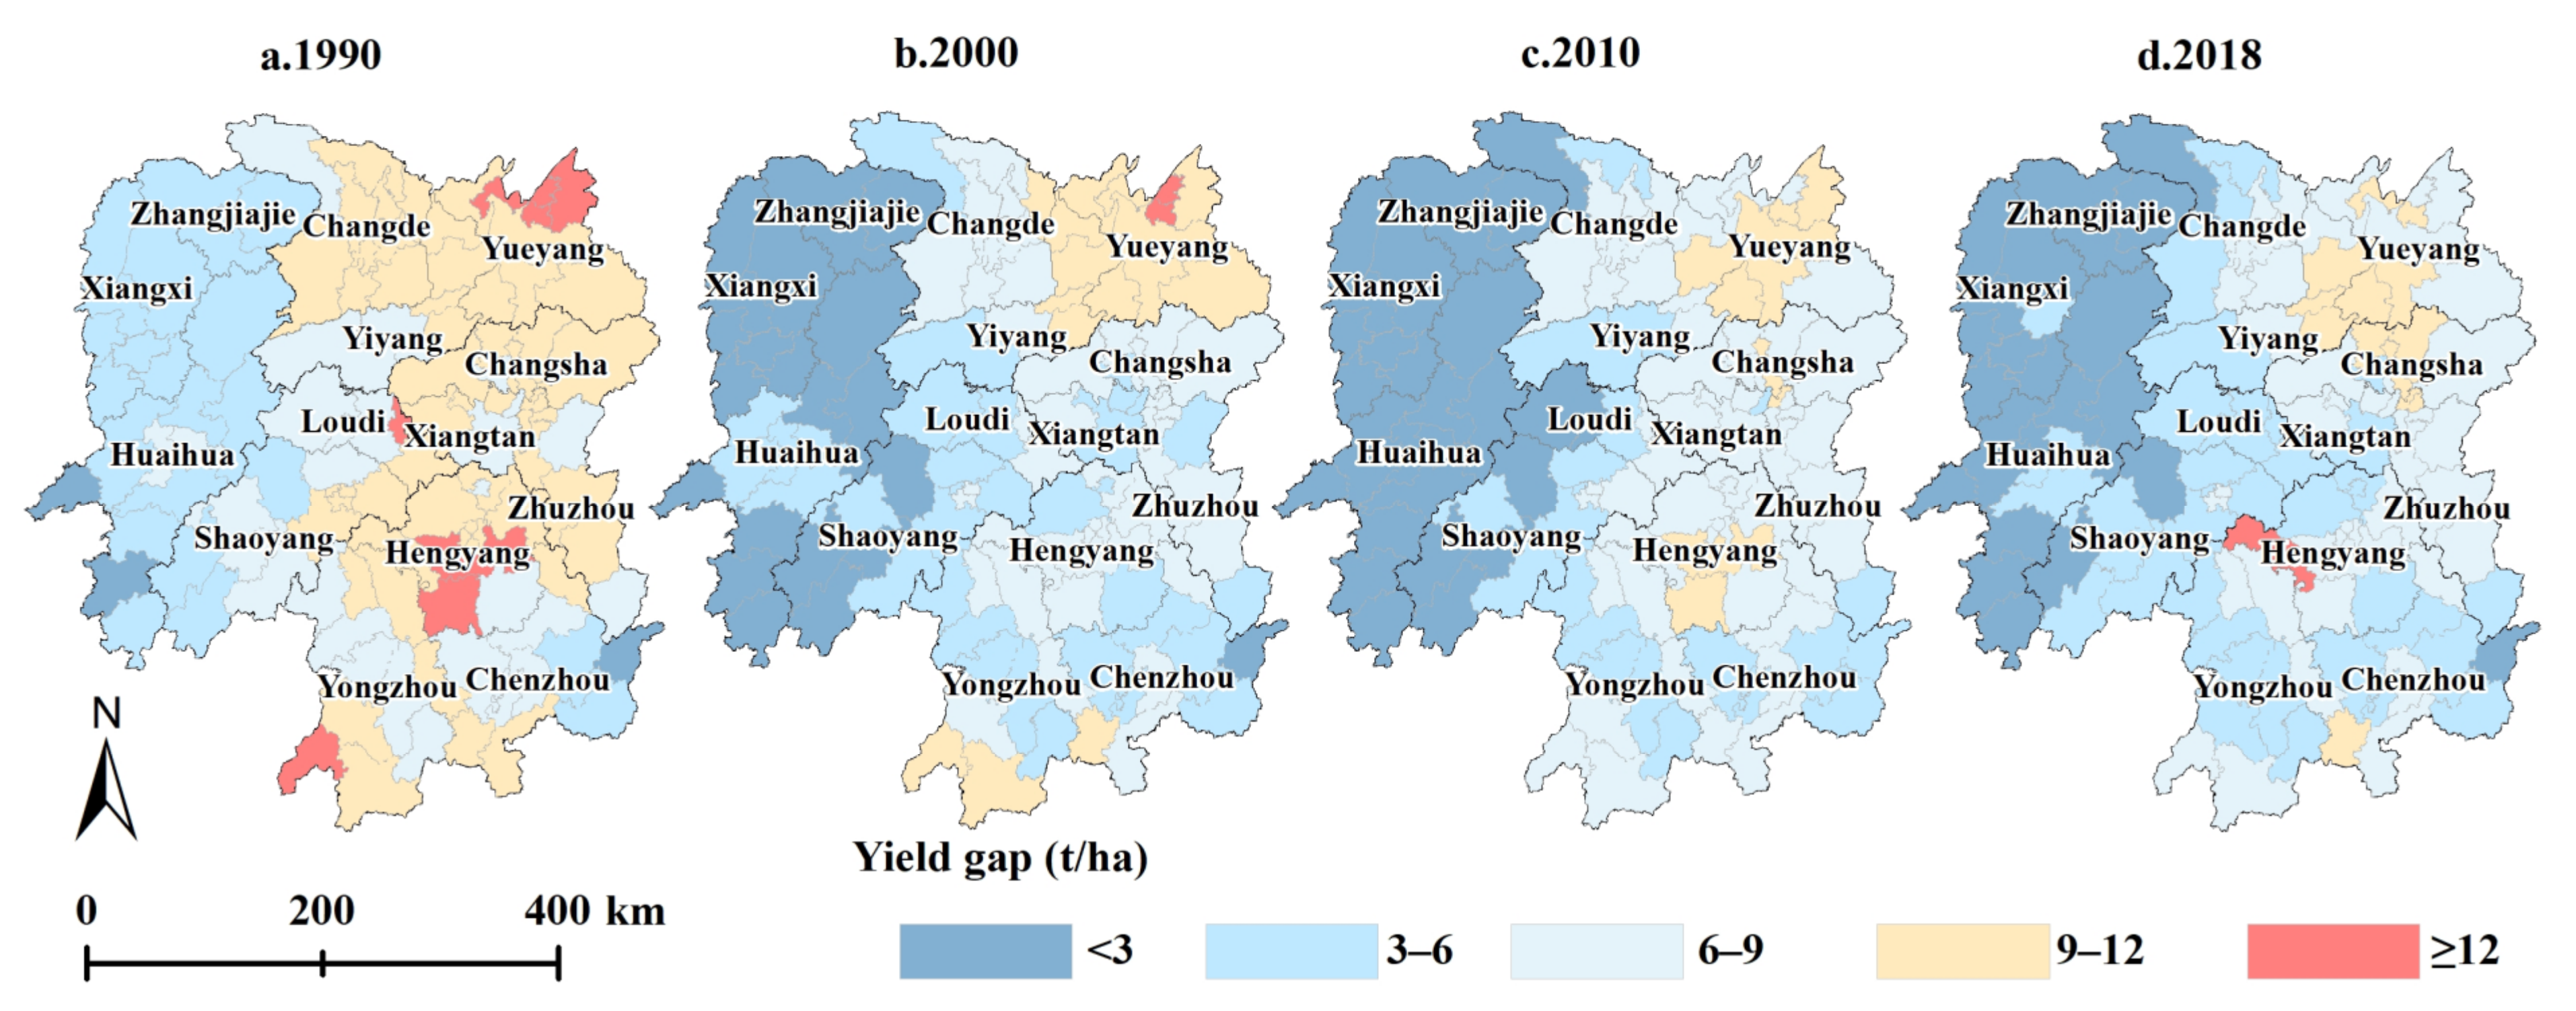
Figure 5.
Statistical information on the YGC in Hunan Province from 1990 to 2018. (a) shows basic information on the YGC during the different periods, and (b) shows the proportion of the number of counties based on the obtained YGC values. In (b), during the periods from 1990–2000, 2000–2010, and 2010–2018, the YGC values were classified as L1 (<−3), L2 (−3 to −2), L3 (−2 to −1), L4 (−1 to 0), L5 (0–1), and L6 (≥1). From 1990 to 2018, the YGC values were classified as L1 (<−6), L2 (−6 to −4), L3 (−4 to −2), L4 (−2 to 0), L5 (0–2), and L6 (≥2).
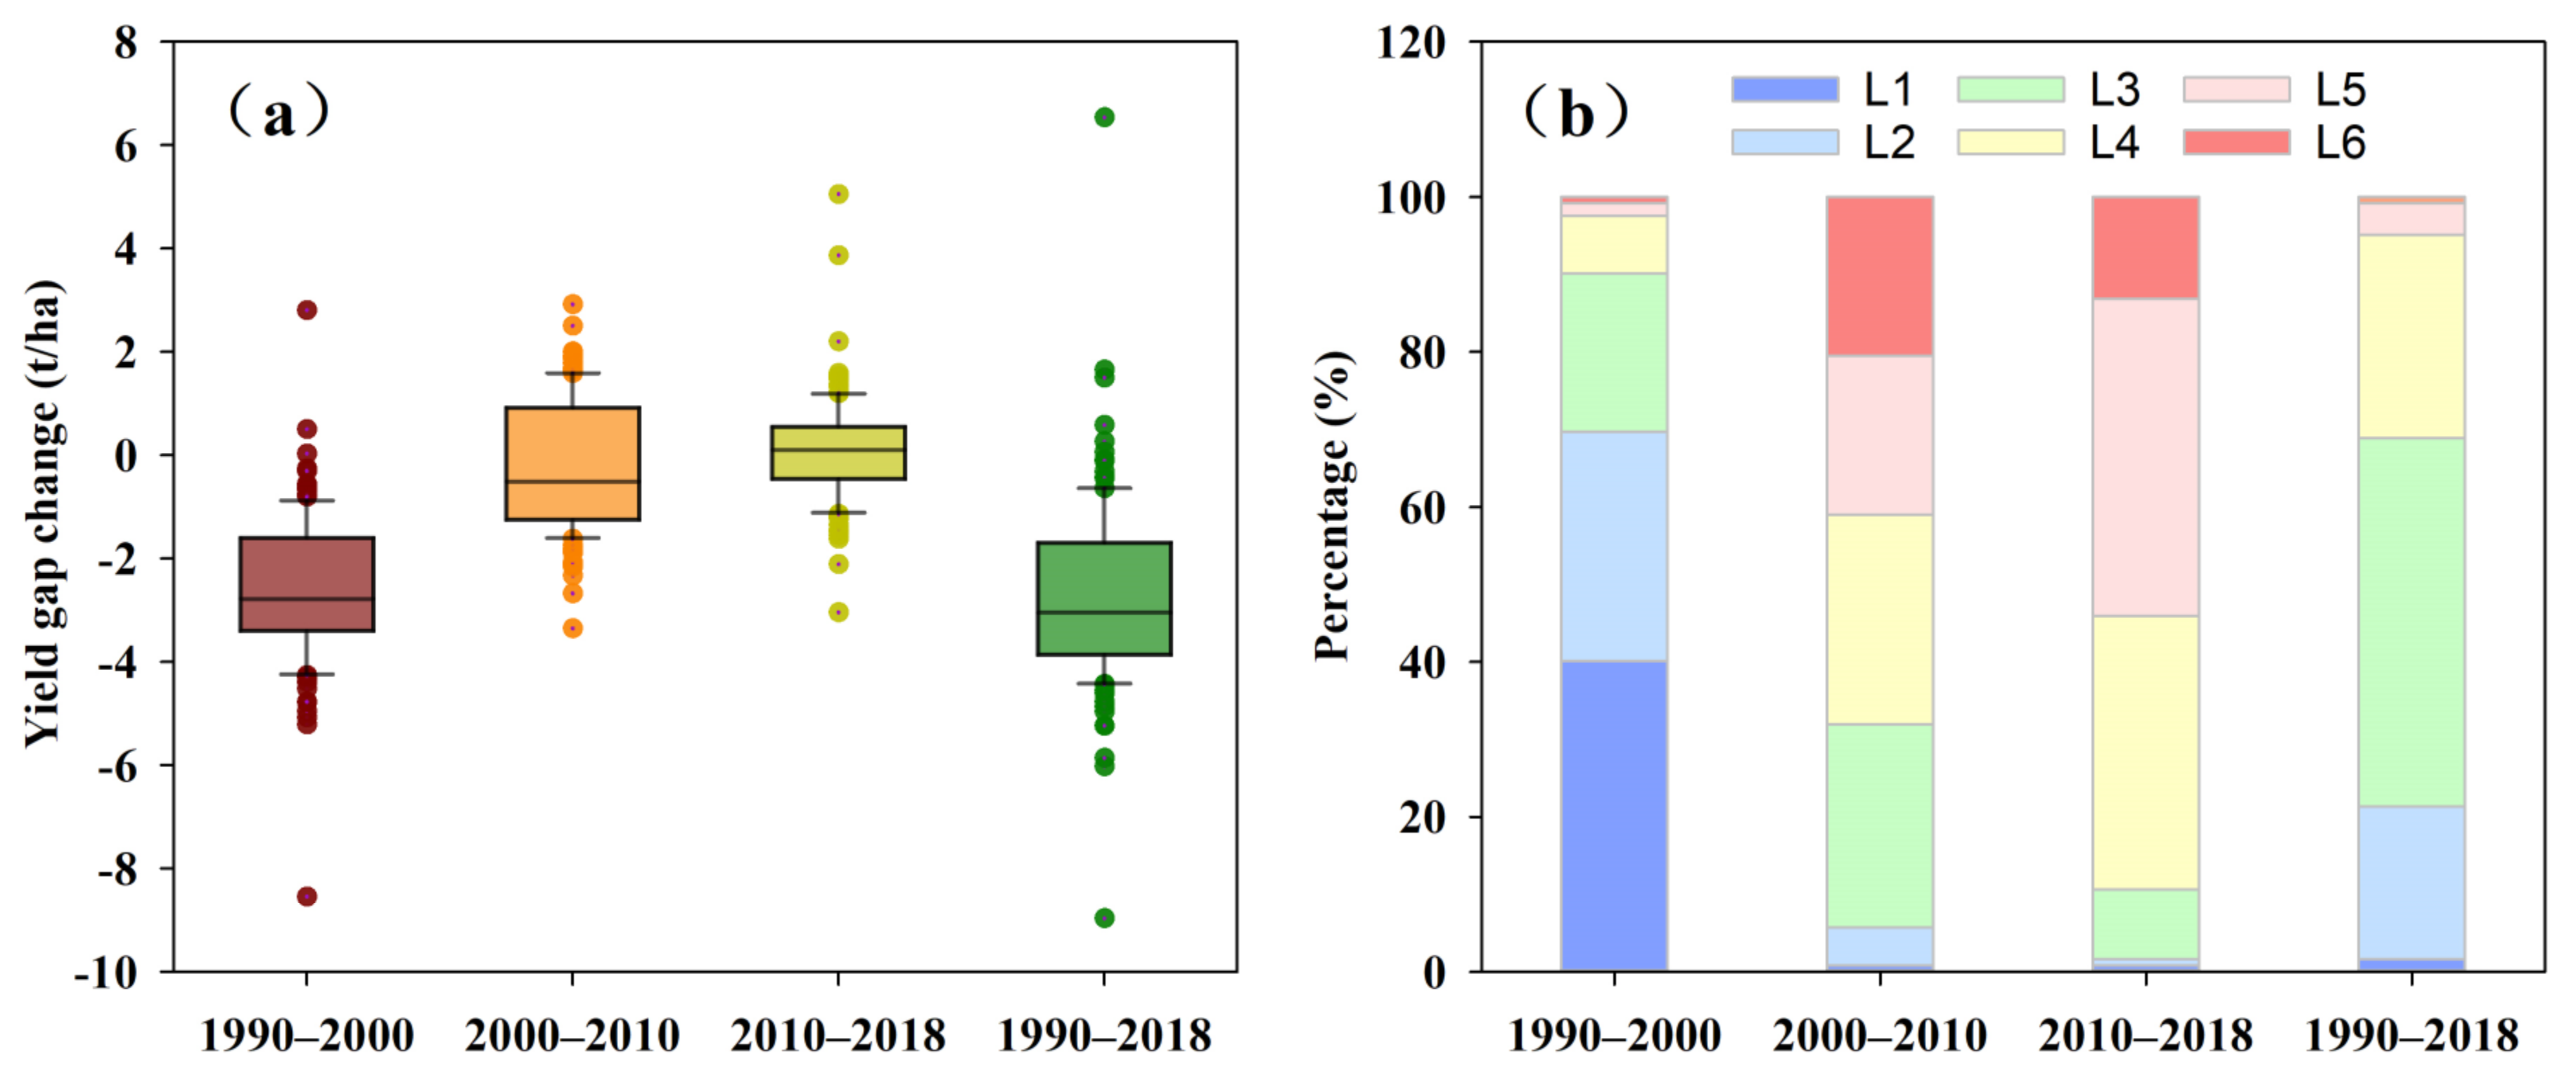
Figure 6.
Spatial variation in the YGCs in Hunan Province during the different periods. (a–d) refer to the yield gap changes of each county during the periods of 1990–2000, 2000–2010, 2010–2018, and 1990–2018, respectively.
Figure 6.
Spatial variation in the YGCs in Hunan Province during the different periods. (a–d) refer to the yield gap changes of each county during the periods of 1990–2000, 2000–2010, 2010–2018, and 1990–2018, respectively.
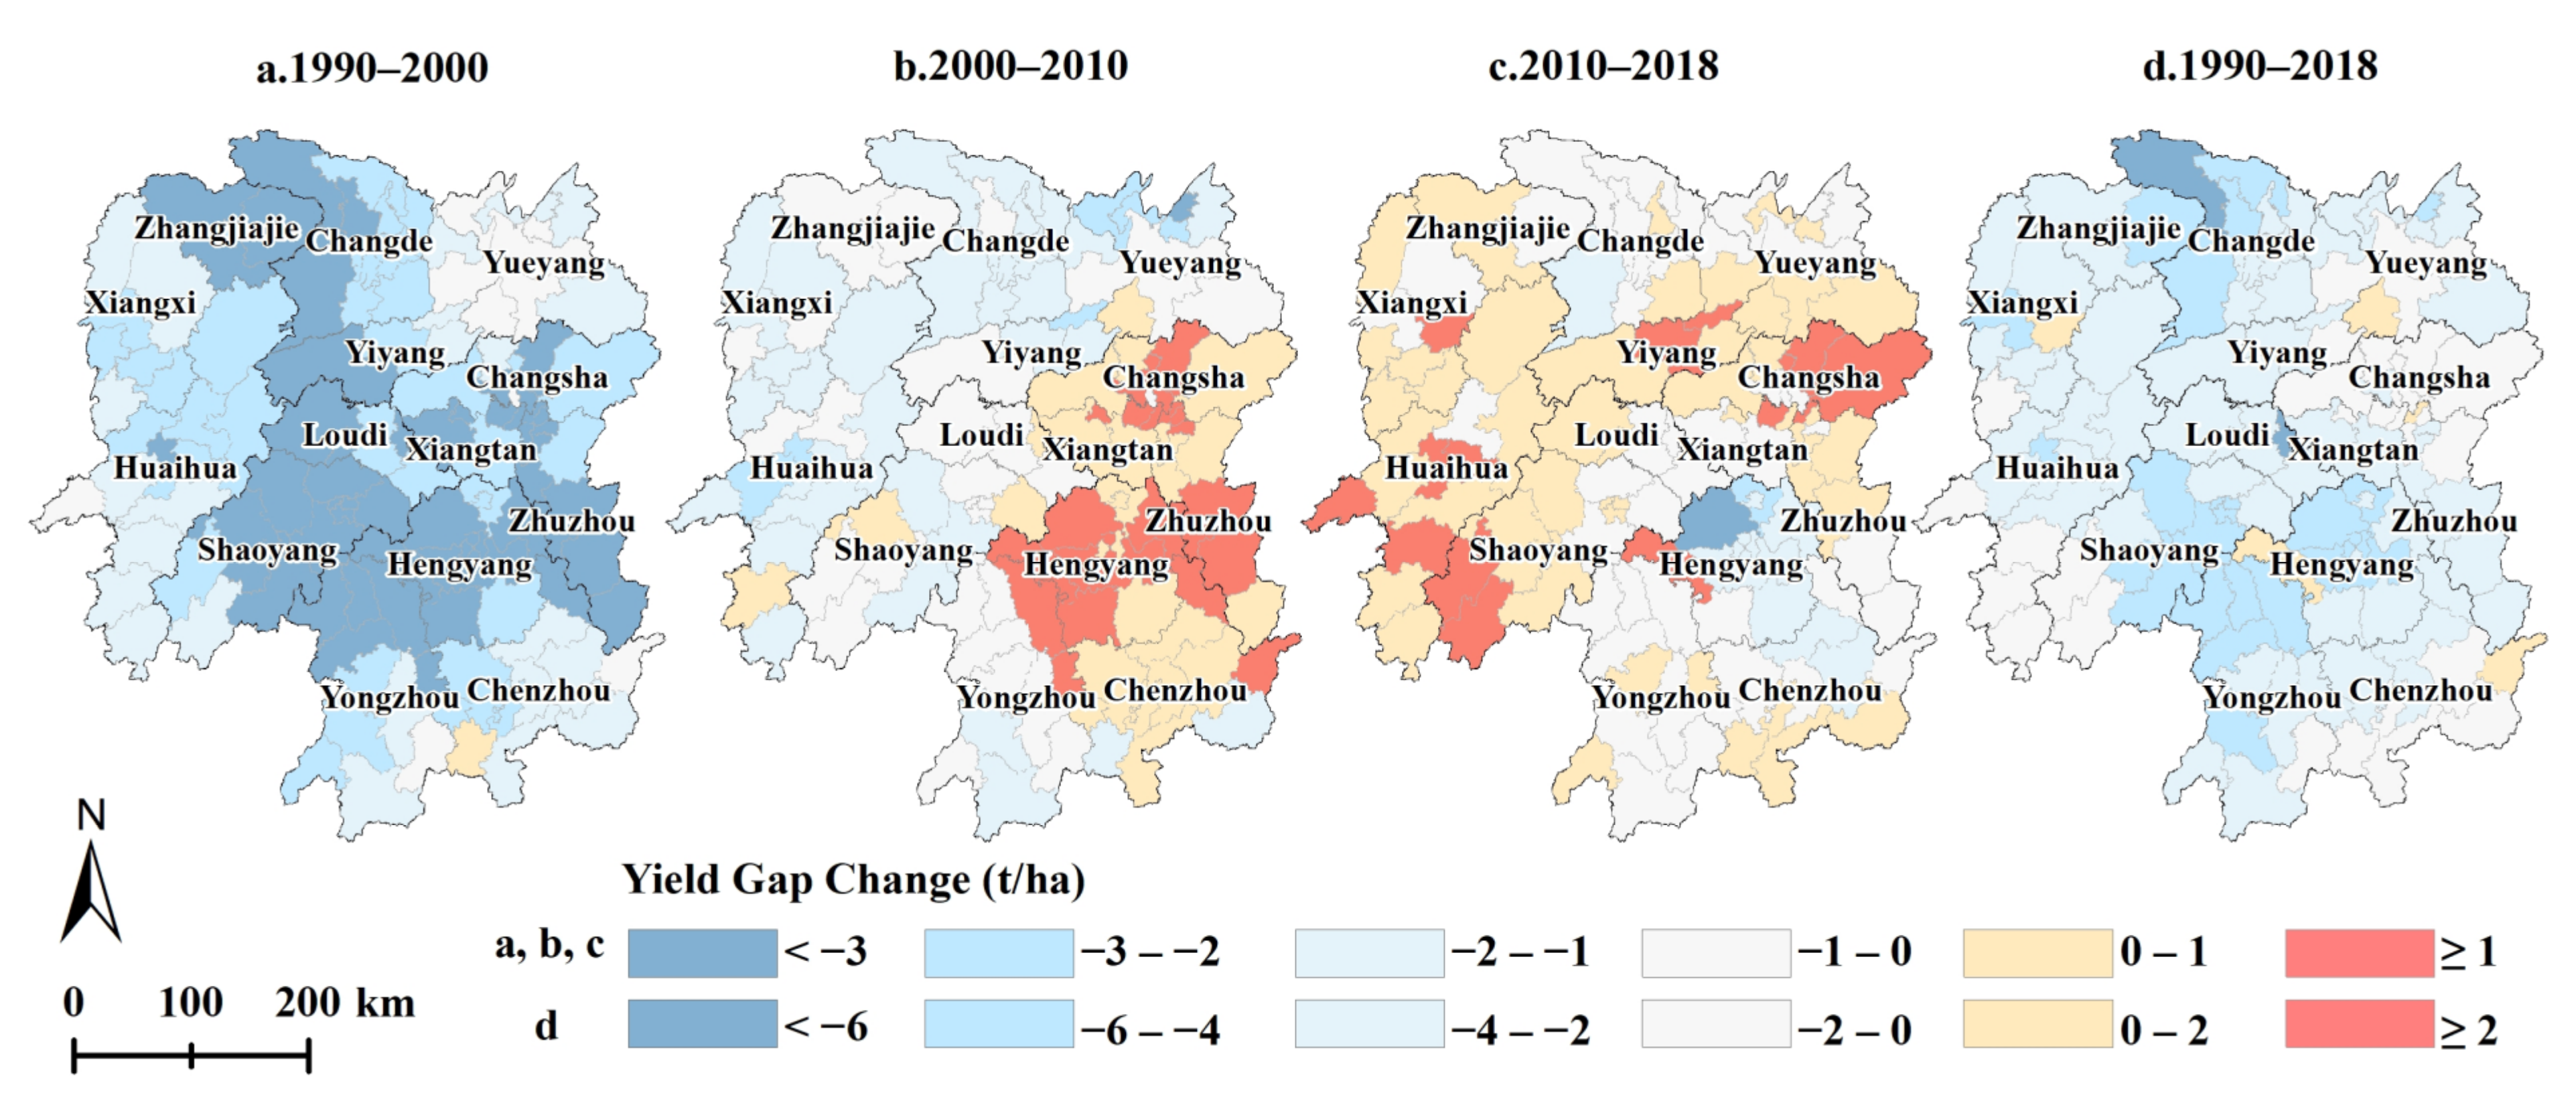
Figure 7.
Spatial agglomeration characteristics of YGAPs in Hunan Province from 1990 to 2018. (a–d) are the spatial cluster maps of the YGAPs in 1990, 2000, 2010 and 2018, respectively.
Figure 7.
Spatial agglomeration characteristics of YGAPs in Hunan Province from 1990 to 2018. (a–d) are the spatial cluster maps of the YGAPs in 1990, 2000, 2010 and 2018, respectively.
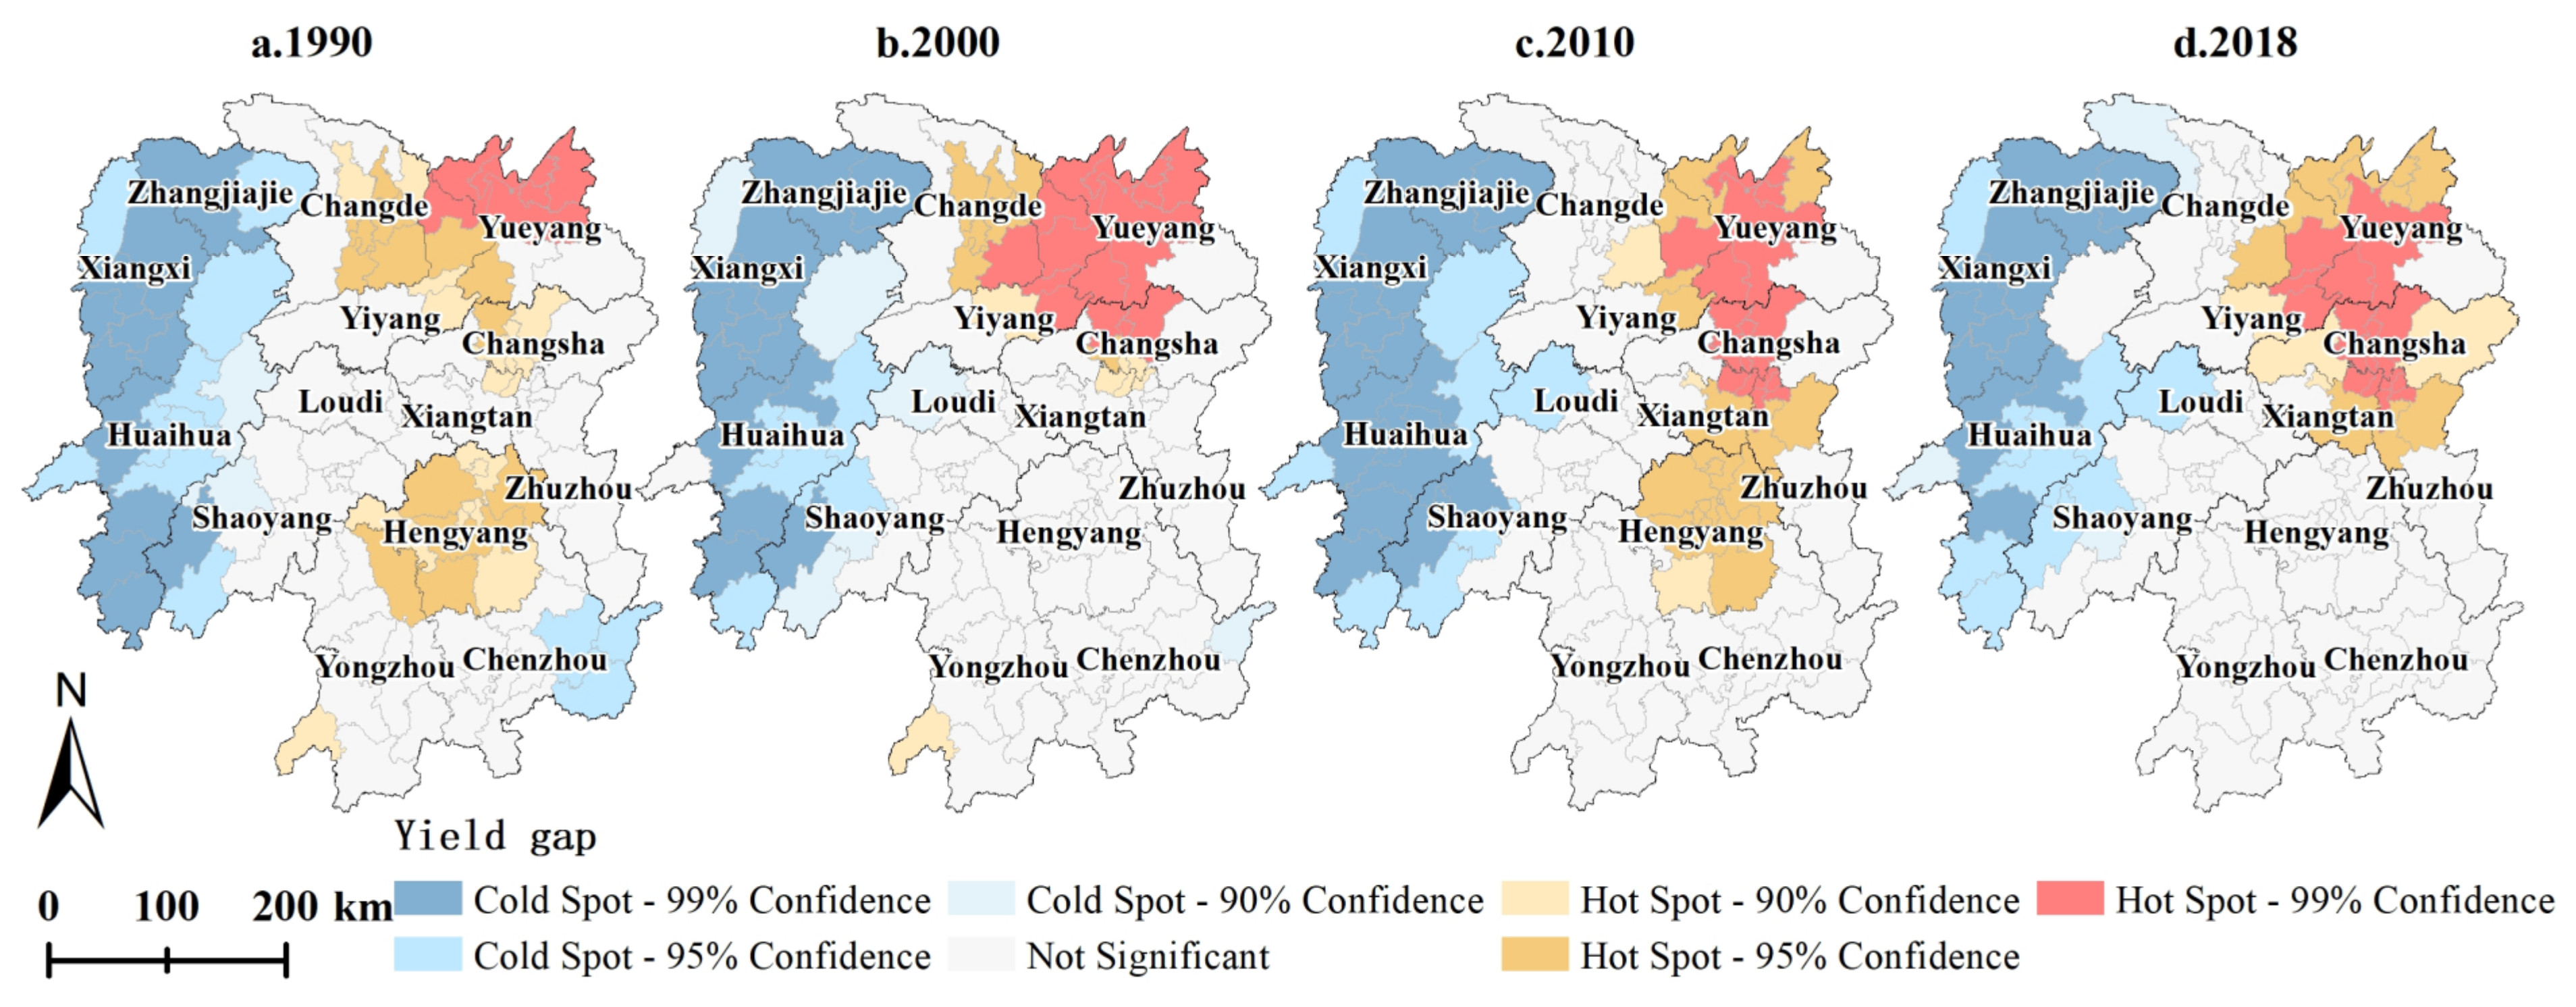
Figure 8.
Spatial agglomeration characteristics of the YGC in Hunan Province from 1990 to 2018. (a–d) are the spatial cluster maps of the YGCs during the periods of 1990–2000, 2000–2010, 2010–2018 and 1990–2018, respectively.
Figure 8.
Spatial agglomeration characteristics of the YGC in Hunan Province from 1990 to 2018. (a–d) are the spatial cluster maps of the YGCs during the periods of 1990–2000, 2000–2010, 2010–2018 and 1990–2018, respectively.
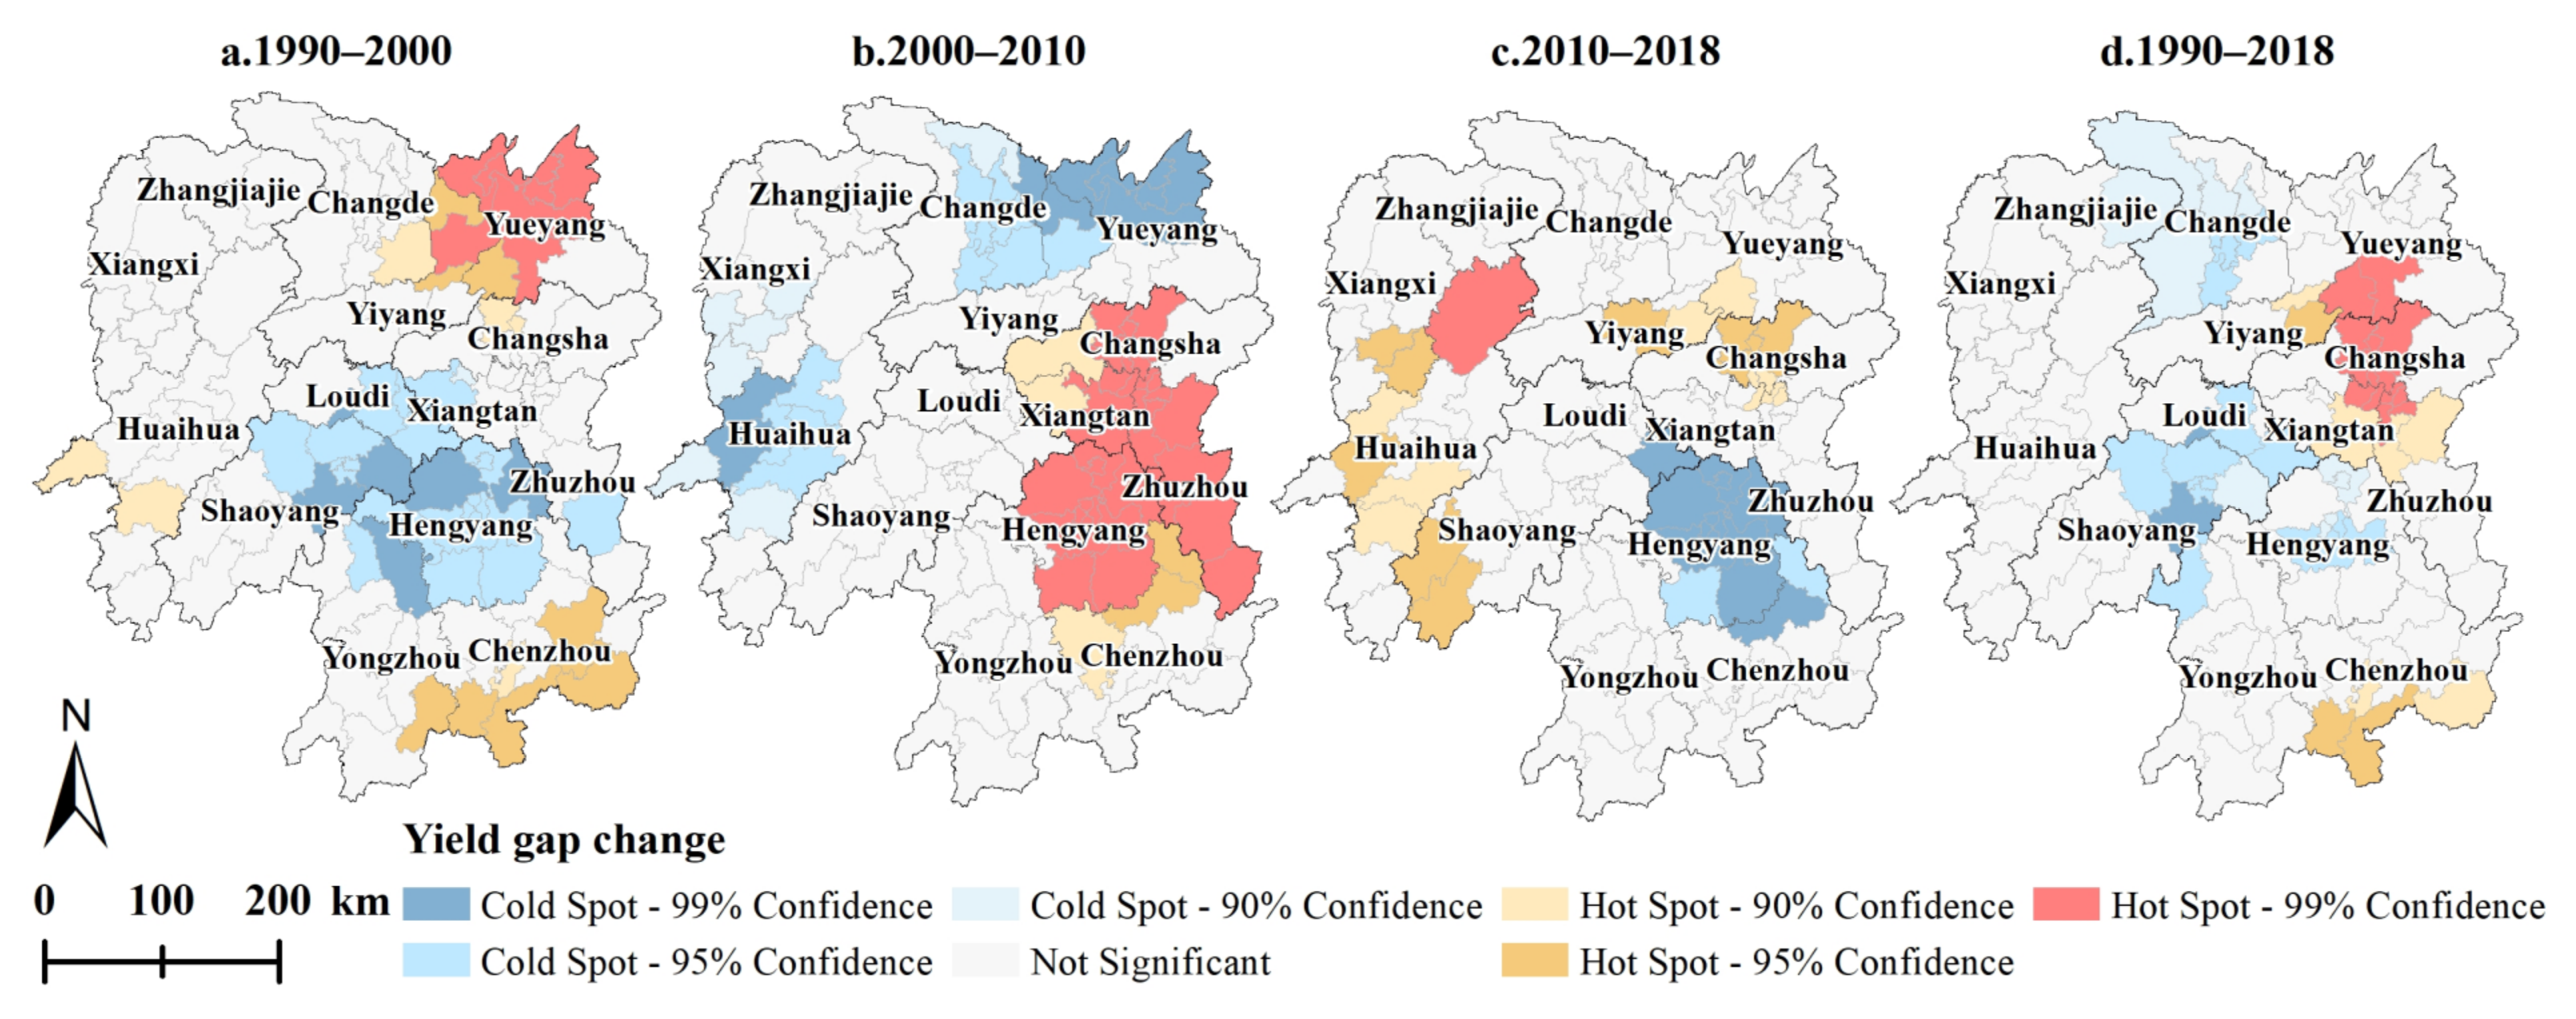
Figure 9.
Spatial variation in bivariate local Moran’s I values of the YGC (a,b) and the corresponding local indicators of spatial association (LISA) cluster map of the YGC (c,d). Period I refers to 1990–2000, period II refers to 2000–2010, and period III refers to 2010–2018.
Figure 9.
Spatial variation in bivariate local Moran’s I values of the YGC (a,b) and the corresponding local indicators of spatial association (LISA) cluster map of the YGC (c,d). Period I refers to 1990–2000, period II refers to 2000–2010, and period III refers to 2010–2018.
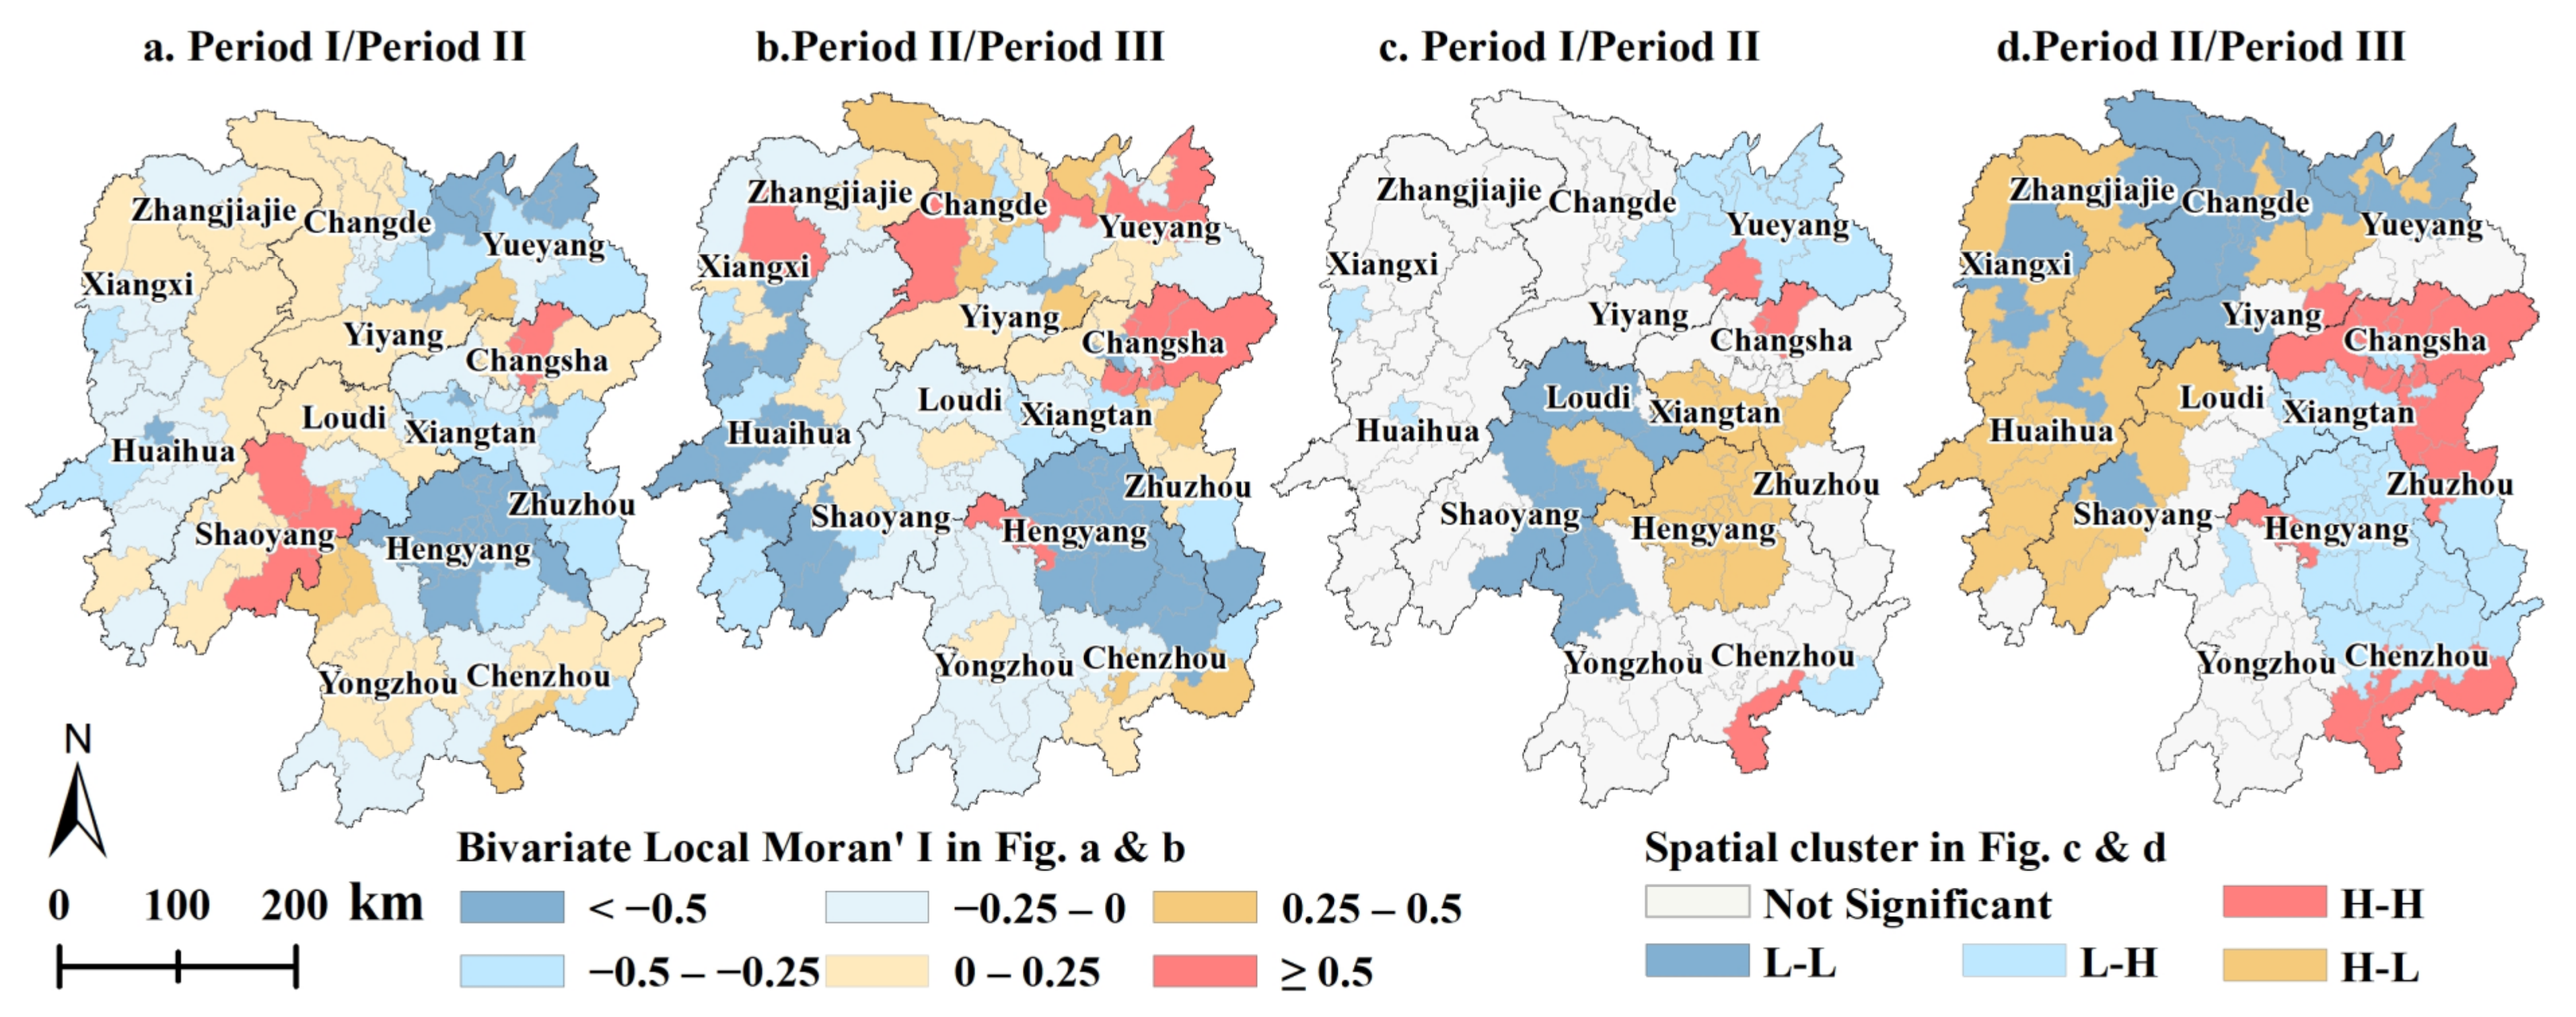
Figure 10.
Importance of the influence factors for YGC during the different periods. (a–d) are the relatively scores of each variable to yield gap change during the periods of 1990–2000, 2000–2010, 2010–2018 and 1990–2018, respectively.
Figure 10.
Importance of the influence factors for YGC during the different periods. (a–d) are the relatively scores of each variable to yield gap change during the periods of 1990–2000, 2000–2010, 2010–2018 and 1990–2018, respectively.
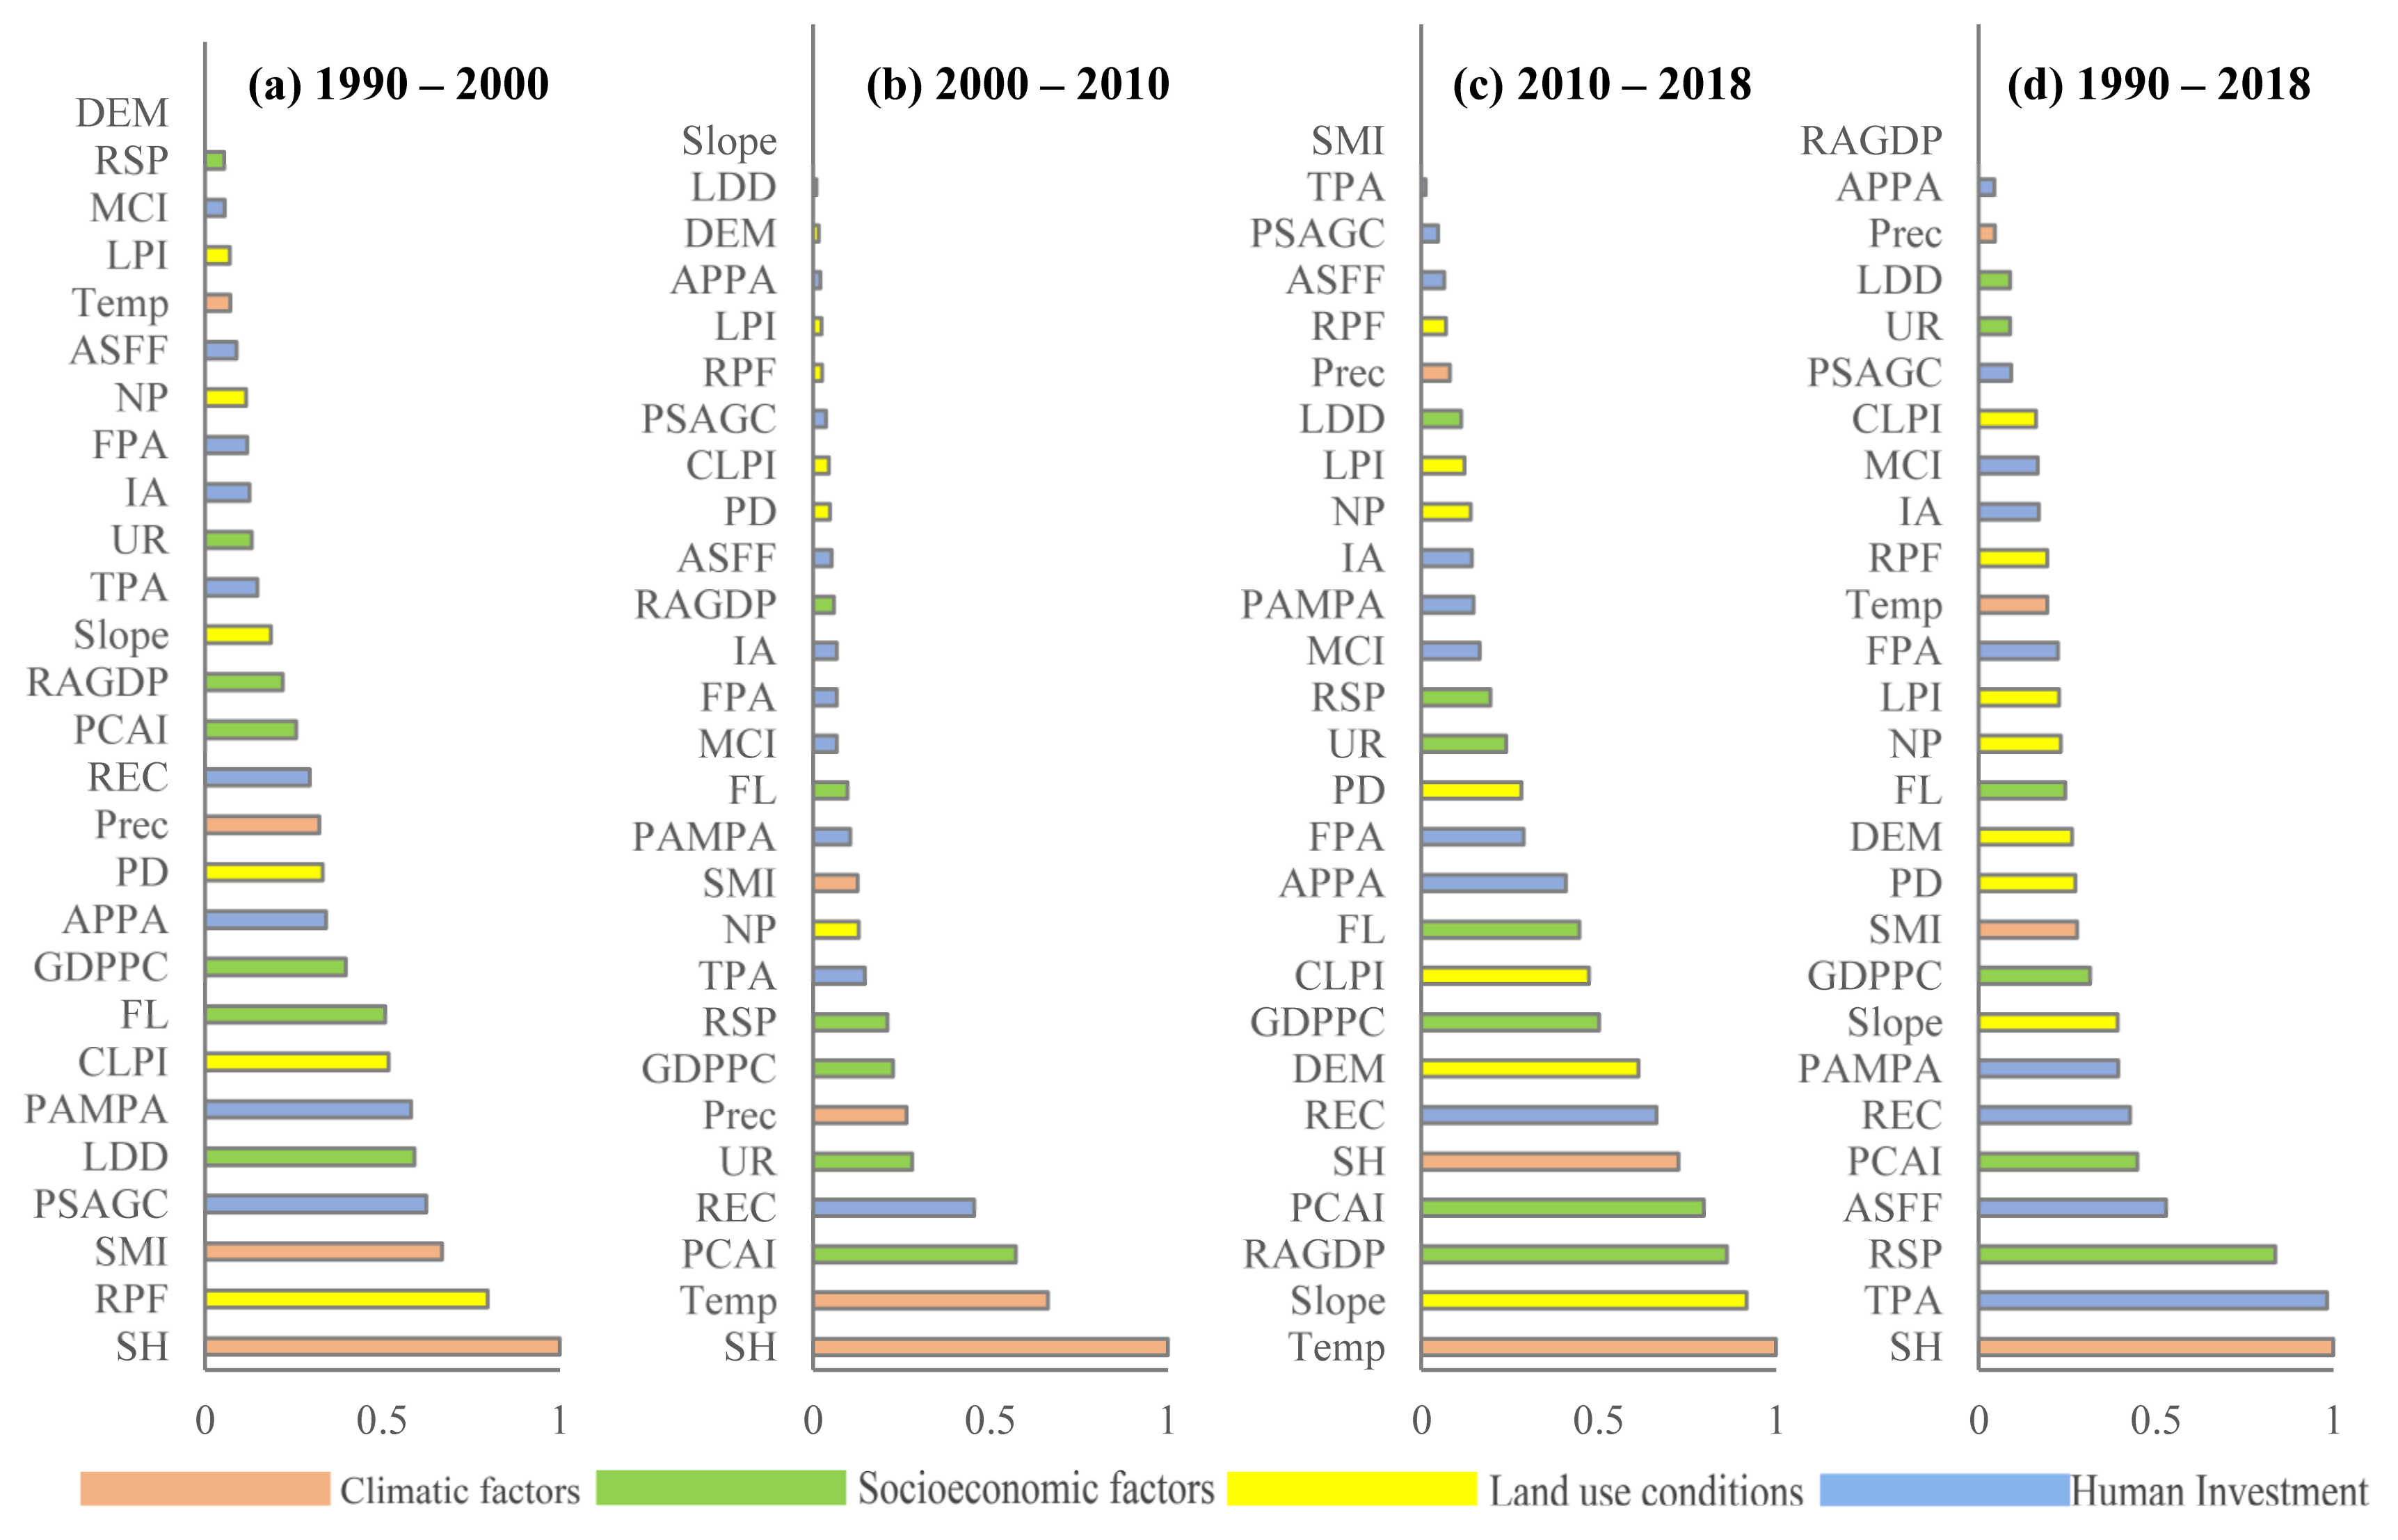
Figure 11.
Contribution of the key factors influencing the YGC between 1990 and 2018.
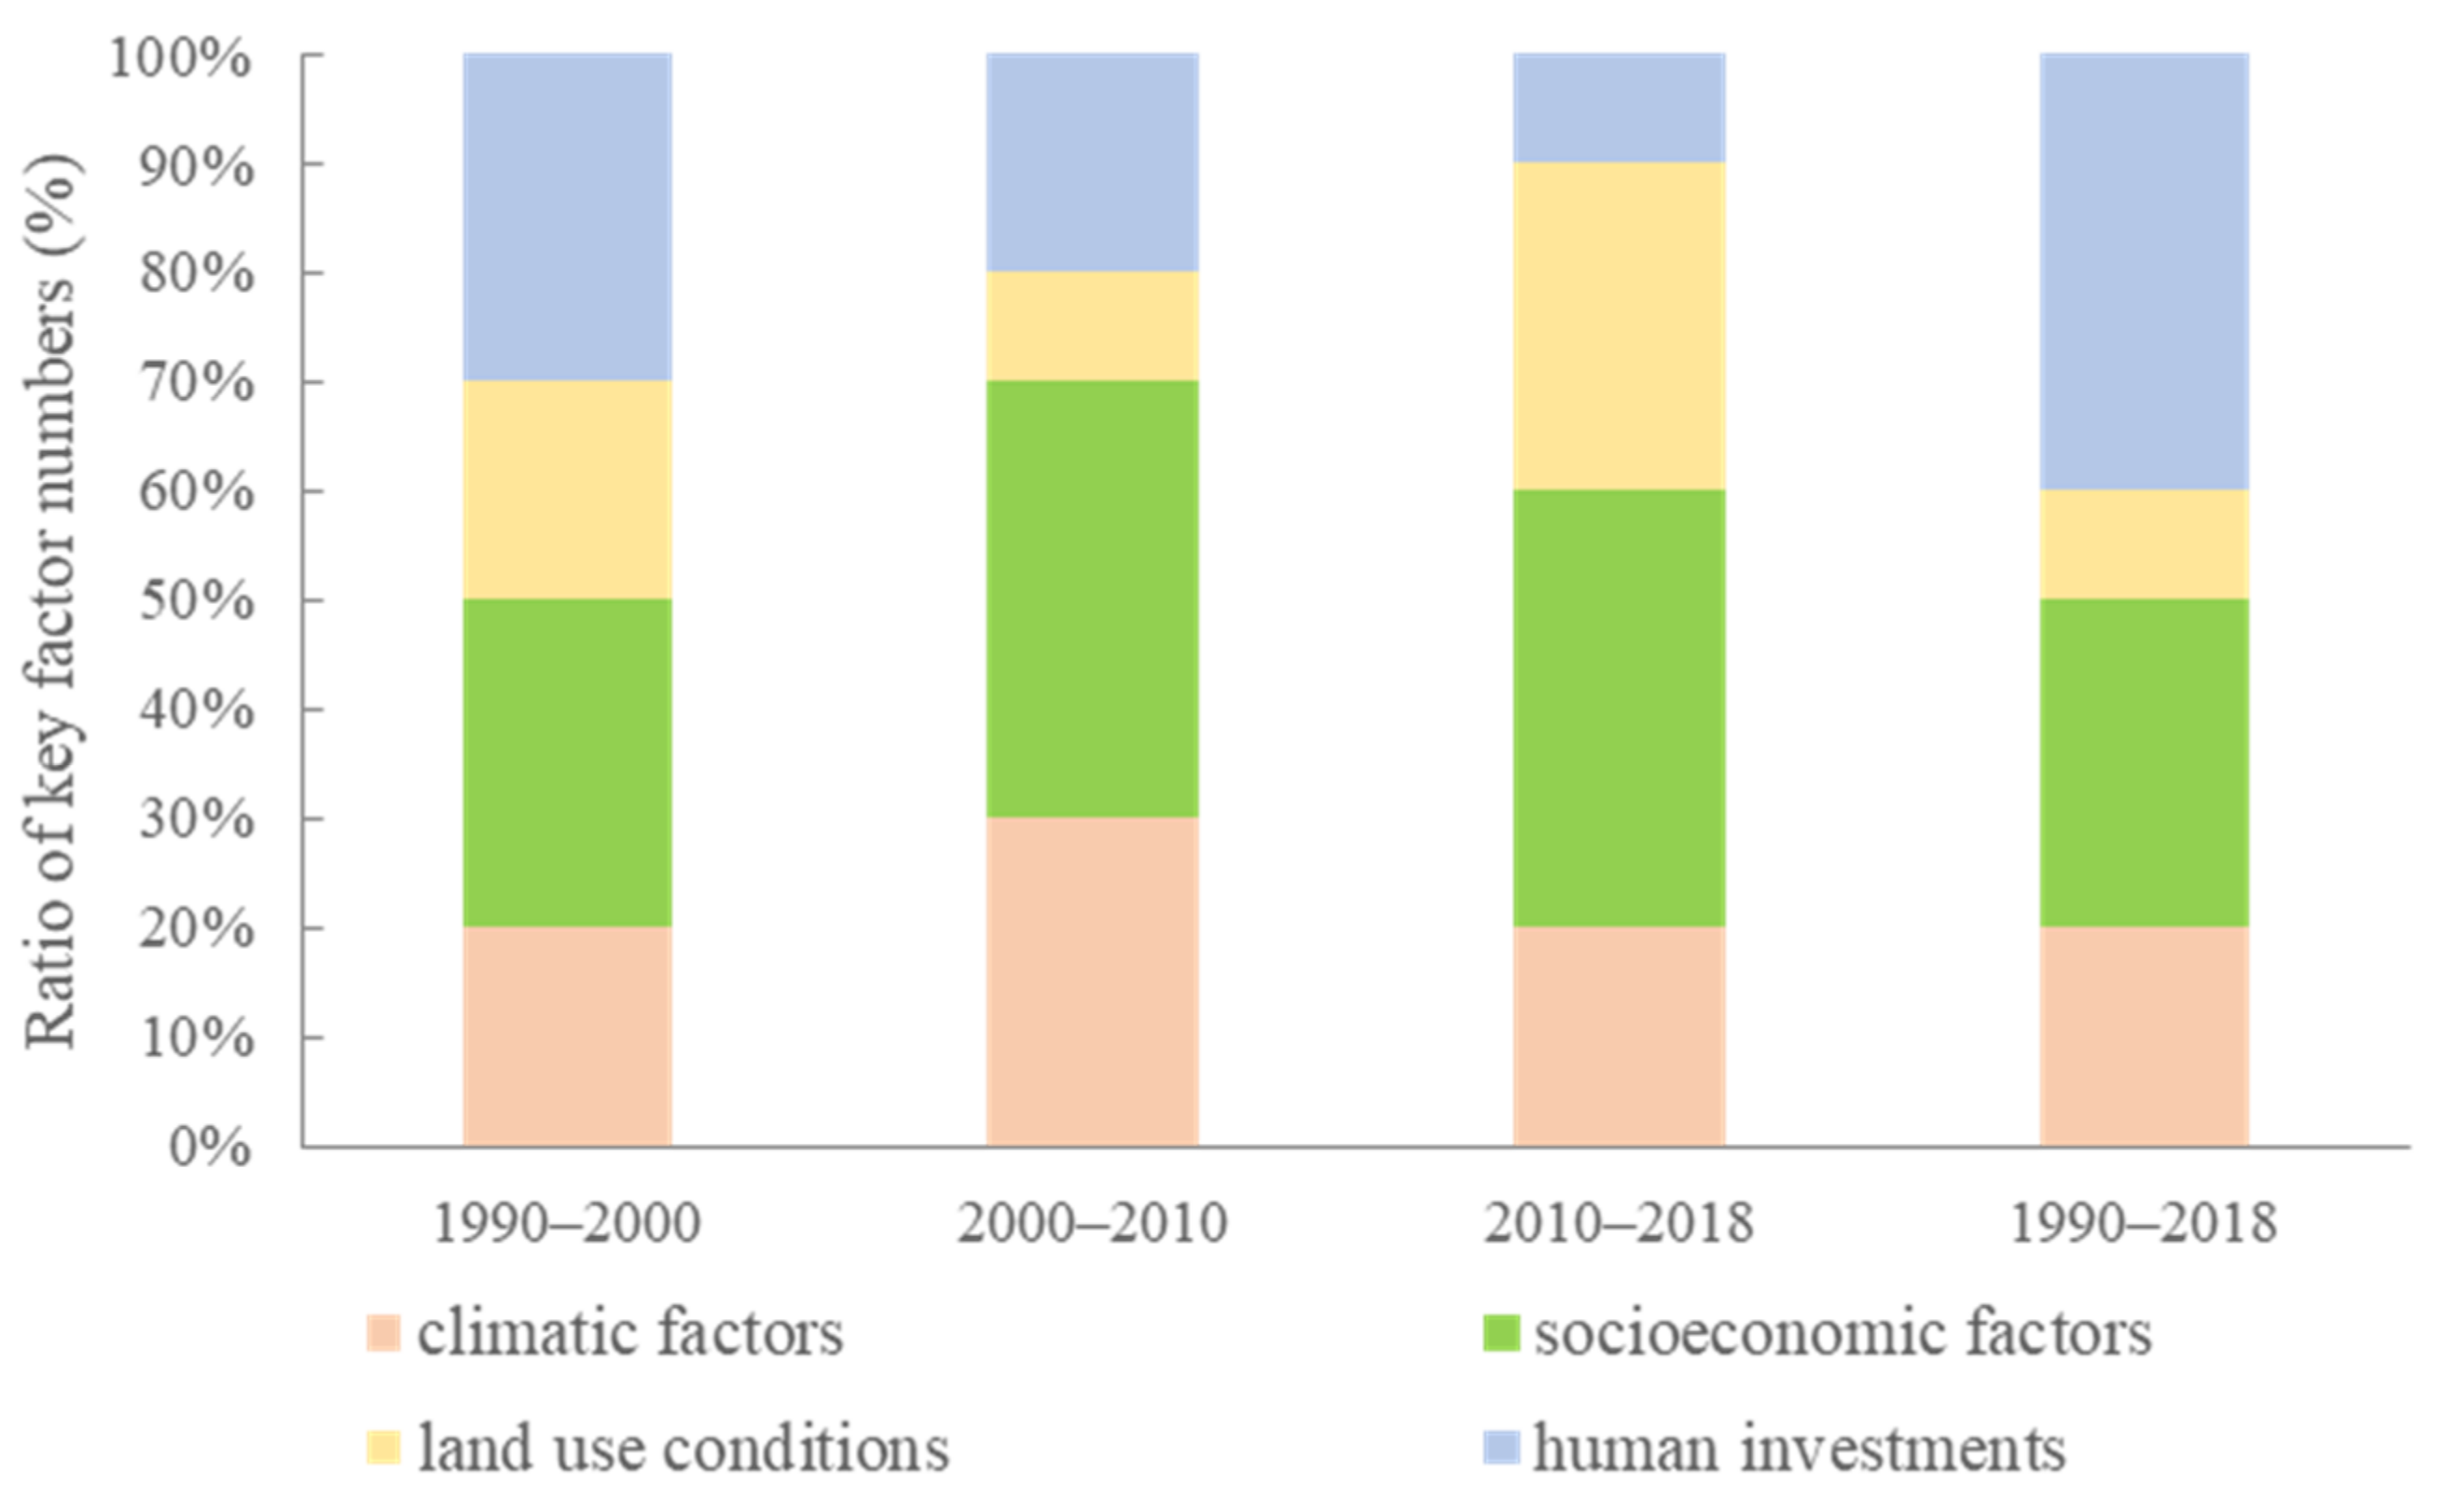
Figure 12.
Capacity for potential yield (a), cultivated land area (b) exploitation, and multiple cropping index of grain crops (c) in 2018.
Figure 12.
Capacity for potential yield (a), cultivated land area (b) exploitation, and multiple cropping index of grain crops (c) in 2018.

Table 1.
Description of the variables.
| Variable Category | Variables | Units | Data Sources |
|---|---|---|---|
| Dependent variable | Yield gap change (YGC) | tons per hectare | Calculated with Equation (7) |
| Climatic factors | Sunshine hours (SH) | hours | China Meteorological Data Service Centre (http://data.cma.cn, accessed on 13 February 2021) and National Tibetan Plateau Data Center (http://data.tpdc.ac.cn, accessed on 13 February 2021) |
| Solar mediation intensity (SMI) | watt per kilometers | ||
| Temperature (Temp) | °C | ||
| Precipitation (Prec) | mm | ||
| Socioeconomic factors | Rural household population (RSP) | ten thousand people | Hunan Provincial Bureau of Statistics |
| Land development degree (LDD) | % | Resource and Environmental Science Data Center (RESDC) | |
| Population urbanization rate (UR) | % | Hunan Provincial Bureau of Statistics | |
| Farm labor (FL) | ten thousand people | Hunan Provincial Bureau of Statistics | |
| Gross domestic product (GDP) per capita (GDPPC) | CNY per capita | Hunan Provincial Bureau of Statistics | |
| Ratio of the agricultural GDP (RAGDP) | % | Hunan Provincial Bureau of Statistics | |
| Per capita annual net income of farmers (PCAI) | RMB per capita | Hunan Provincial Bureau of Statistics | |
| Land use conditions | Elevation of cultivated land (DEM) | m | Advanced Land Observing Satellite-1 (ALOS), Japan Aerospace Exploration Agency |
| Slope of cultivated land (Slope) | degree | ALOS, Japan Aerospace Exploration Agency | |
| Area ratio of paddy fields (RPF) | % | Chinese Academy of Sciences | |
| Number of patches (NP) | – | Chinese Academy of Sciences | |
| Patch density (PD) | number per hectare | Chinese Academy of Sciences | |
| Largest patch index (LPI) | – | Chinese Academy of Sciences | |
| Cultivated land quality level (CLPL) | level | Department of Natural Resources of Hunan | |
| Human investment | Proportion of the sown area of grain crops (PSAGC) | % | Hunan Provincial Bureau of Statistics |
| Multiple cropping index of grain crops (MCI) | % | Hunan Provincial Bureau of Statistics | |
| Agricultural practitioners per area (APPA) | person per hectare | Hunan Provincial Bureau of Statistics | |
| Rural electricity consumption (REC) | ten thousand watt | Hunan Provincial Bureau of Statistics | |
| Amount of fertilizer per area (FPA) | tons per hectare | Hunan Provincial Bureau of Statistics | |
| Tractor-plowed area (TPA) | ha | Hunan Provincial Bureau of Statistics | |
| Irrigated area (IA) | ha | Hunan Provincial Bureau of Statistics | |
| Power of agricultural machinery per area (PAMPA) | kilowatt per hectare | Hunan Provincial Bureau of Statistics | |
| Area of soil testing and formula fertilization (ASFF) | hectare | Hunan Provincial Bureau of Statistics |
Note: all indicators are obtained or calculated from the corresponding data of 1990, 2000, 2010, and 2018.
Table 2.
Statistical information on YGAP in Hunan Province from 1990 to 2018.
| Year | YGAP (t ha−1) | <3 t ha−1 | 3–6 t ha−1 | 6–9 t ha−1 | 9–12 t ha−1 | ≥12 t ha−1 | |||||||
|---|---|---|---|---|---|---|---|---|---|---|---|---|---|
| Maximum | Minimum | Mean | Number | Ratio | Number | Ratio | Number | Ratio | Number | Ratio | Number | Ratio | |
| 1990 | 14.82 | 1.63 | 8.57 | 3 | 2.46% | 25 | 20.49% | 28 | 22.95% | 58 | 47.54% | 8 | 6.56% |
| 2000 | 13.54 | 0.11 | 5.95 | 23 | 18.85% | 37 | 30.33% | 43 | 35.25% | 16 | 13.11% | 3 | 2.46% |
| 2010 | 15.06 | 0.24 | 5.74 | 31 | 25.41% | 21 | 17.21% | 56 | 45.90% | 13 | 10.66% | 1 | 0.82% |
| 2018 | 17.28 | 0.15 | 5.84 | 25 | 20.49% | 38 | 31.14% | 43 | 35.25% | 14 | 11.48% | 2 | 1.64% |
Publisher’s Note: MDPI stays neutral with regard to jurisdictional claims in published maps and institutional affiliations. |
© 2022 by the authors. Licensee MDPI, Basel, Switzerland. This article is an open access article distributed under the terms and conditions of the Creative Commons Attribution (CC BY) license (https://creativecommons.org/licenses/by/4.0/).
Share and Cite
MDPI and ACS Style
Yu, D.; Hu, S.; Tong, L.; Xia, C.; Ran, P. Dynamics and Determinants of the Grain Yield Gap in Major Grain-Producing Areas: A Case Study in Hunan Province, China. Foods 2022, 11, 1122. https://doi.org/10.3390/foods11081122
AMA Style
Yu D, Hu S, Tong L, Xia C, Ran P. Dynamics and Determinants of the Grain Yield Gap in Major Grain-Producing Areas: A Case Study in Hunan Province, China. Foods. 2022; 11(8):1122. https://doi.org/10.3390/foods11081122
Chicago/Turabian StyleYu, De, Shougeng Hu, Luyi Tong, Cong Xia, and Penglai Ran. 2022. "Dynamics and Determinants of the Grain Yield Gap in Major Grain-Producing Areas: A Case Study in Hunan Province, China" Foods 11, no. 8: 1122. https://doi.org/10.3390/foods11081122
Note that from the first issue of 2016, this journal uses article numbers instead of page numbers. See further details here.