

Multiscale Structural Insight into Dairy Products and Plant-Based Alternatives by Scattering and Imaging Techniques

 , , and
Abstract
:1. Introduction
2. Materials and Methods
2.1. ESEM
2.2. SAXS
3. Results and Discussion
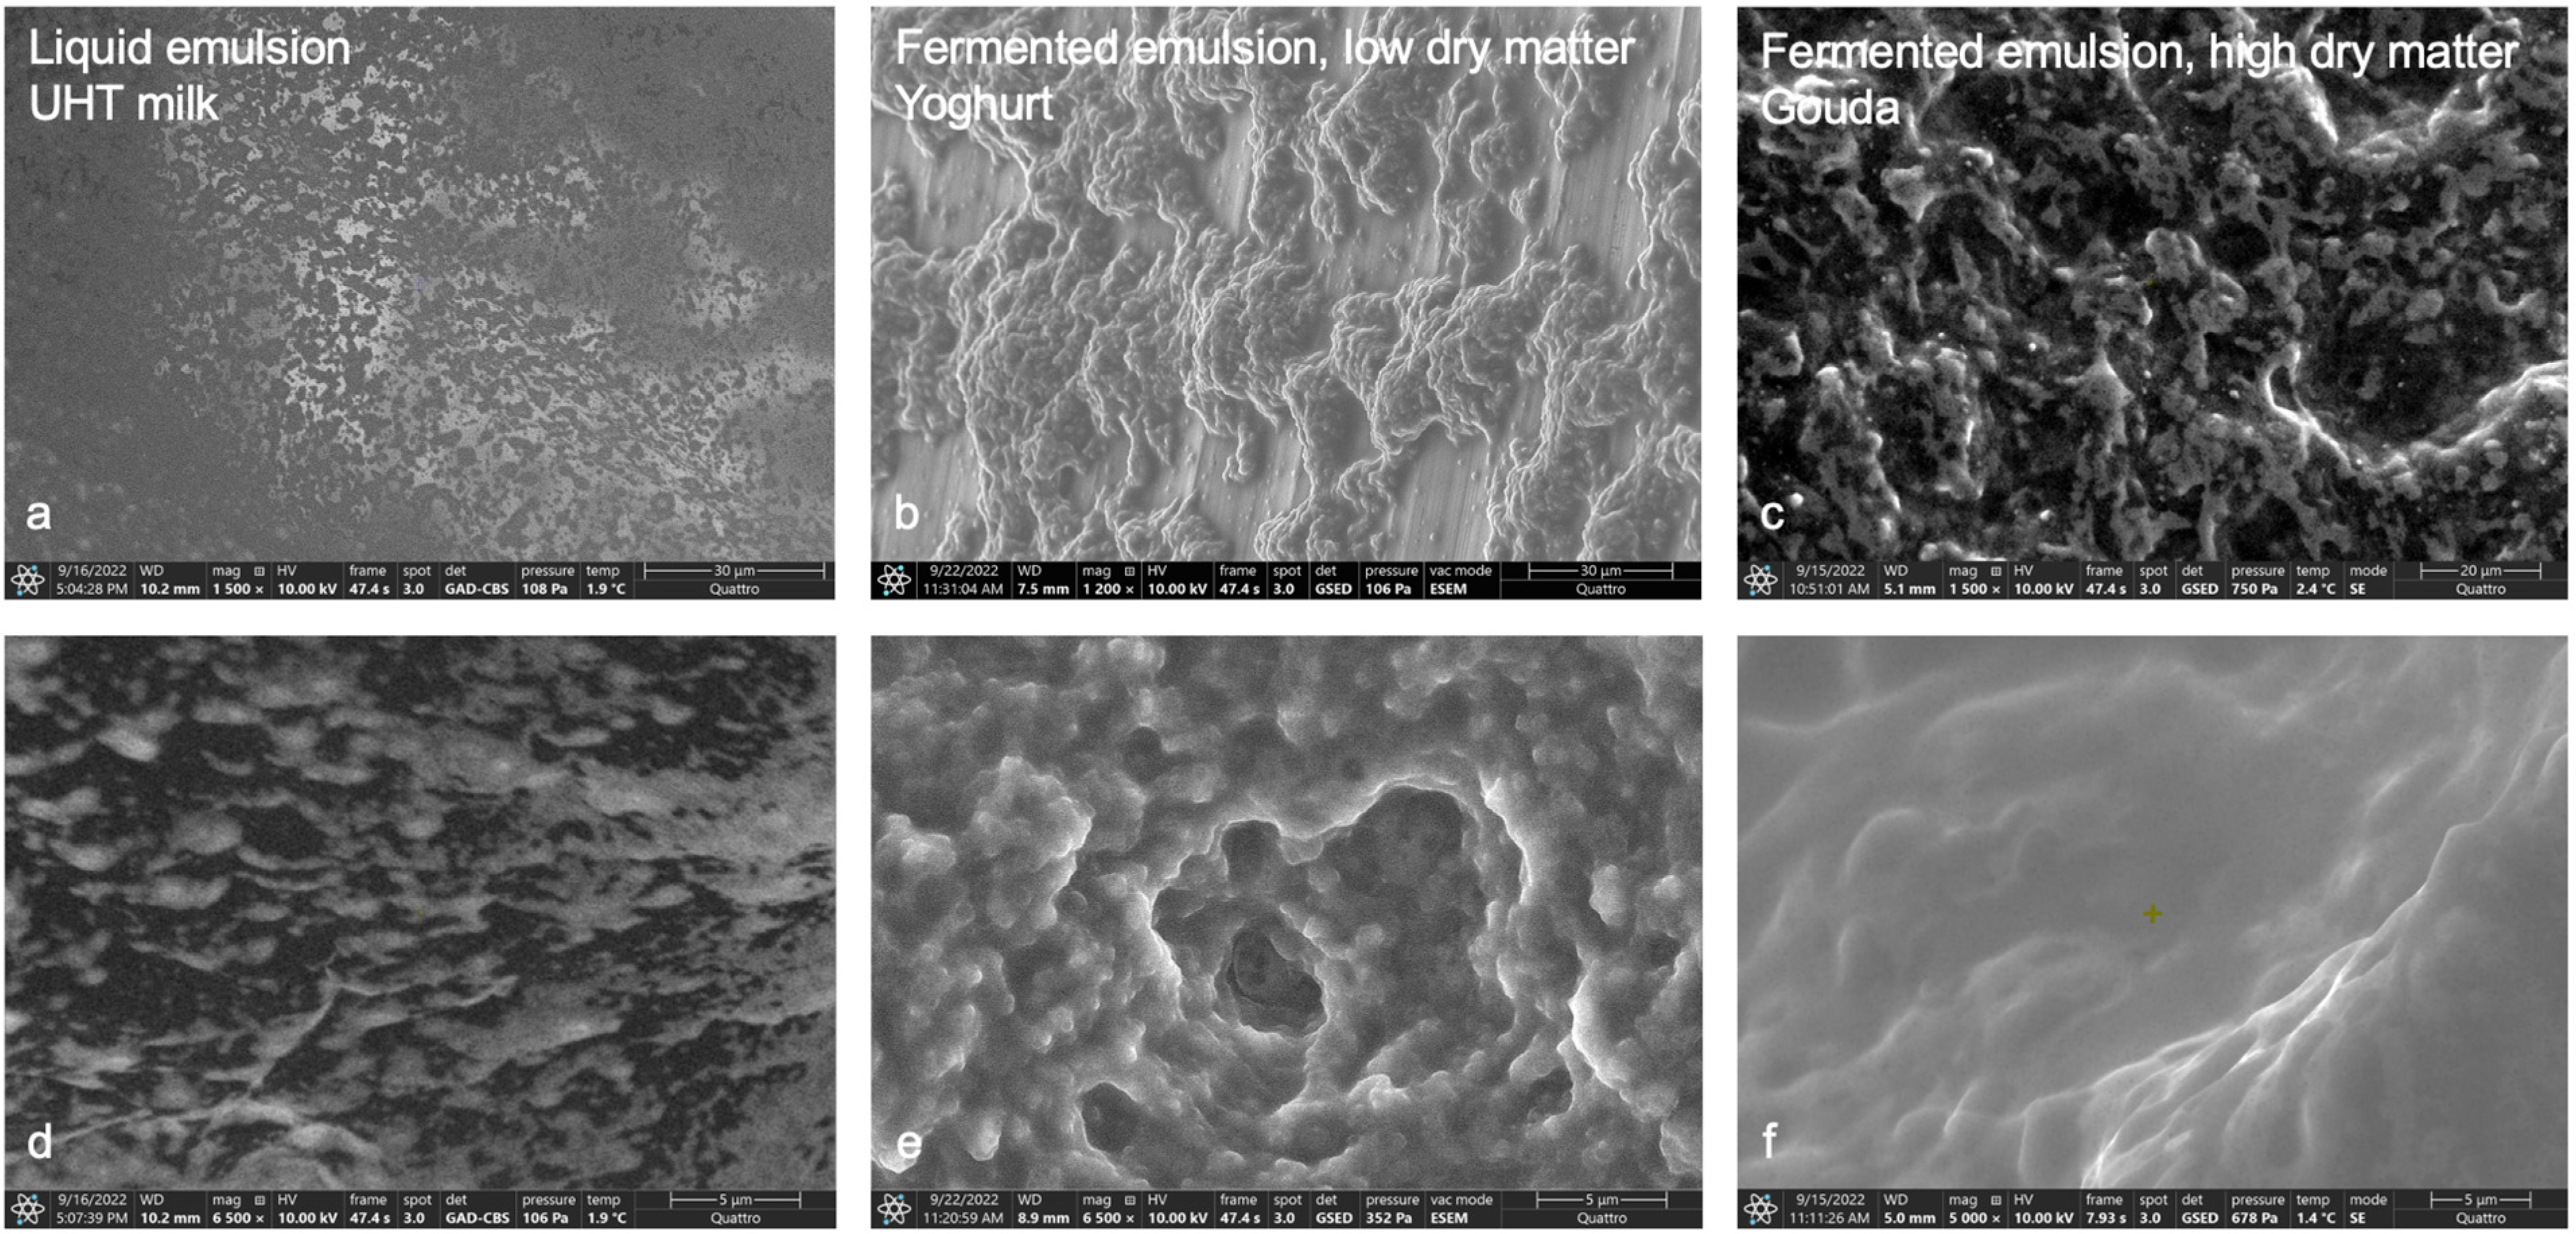
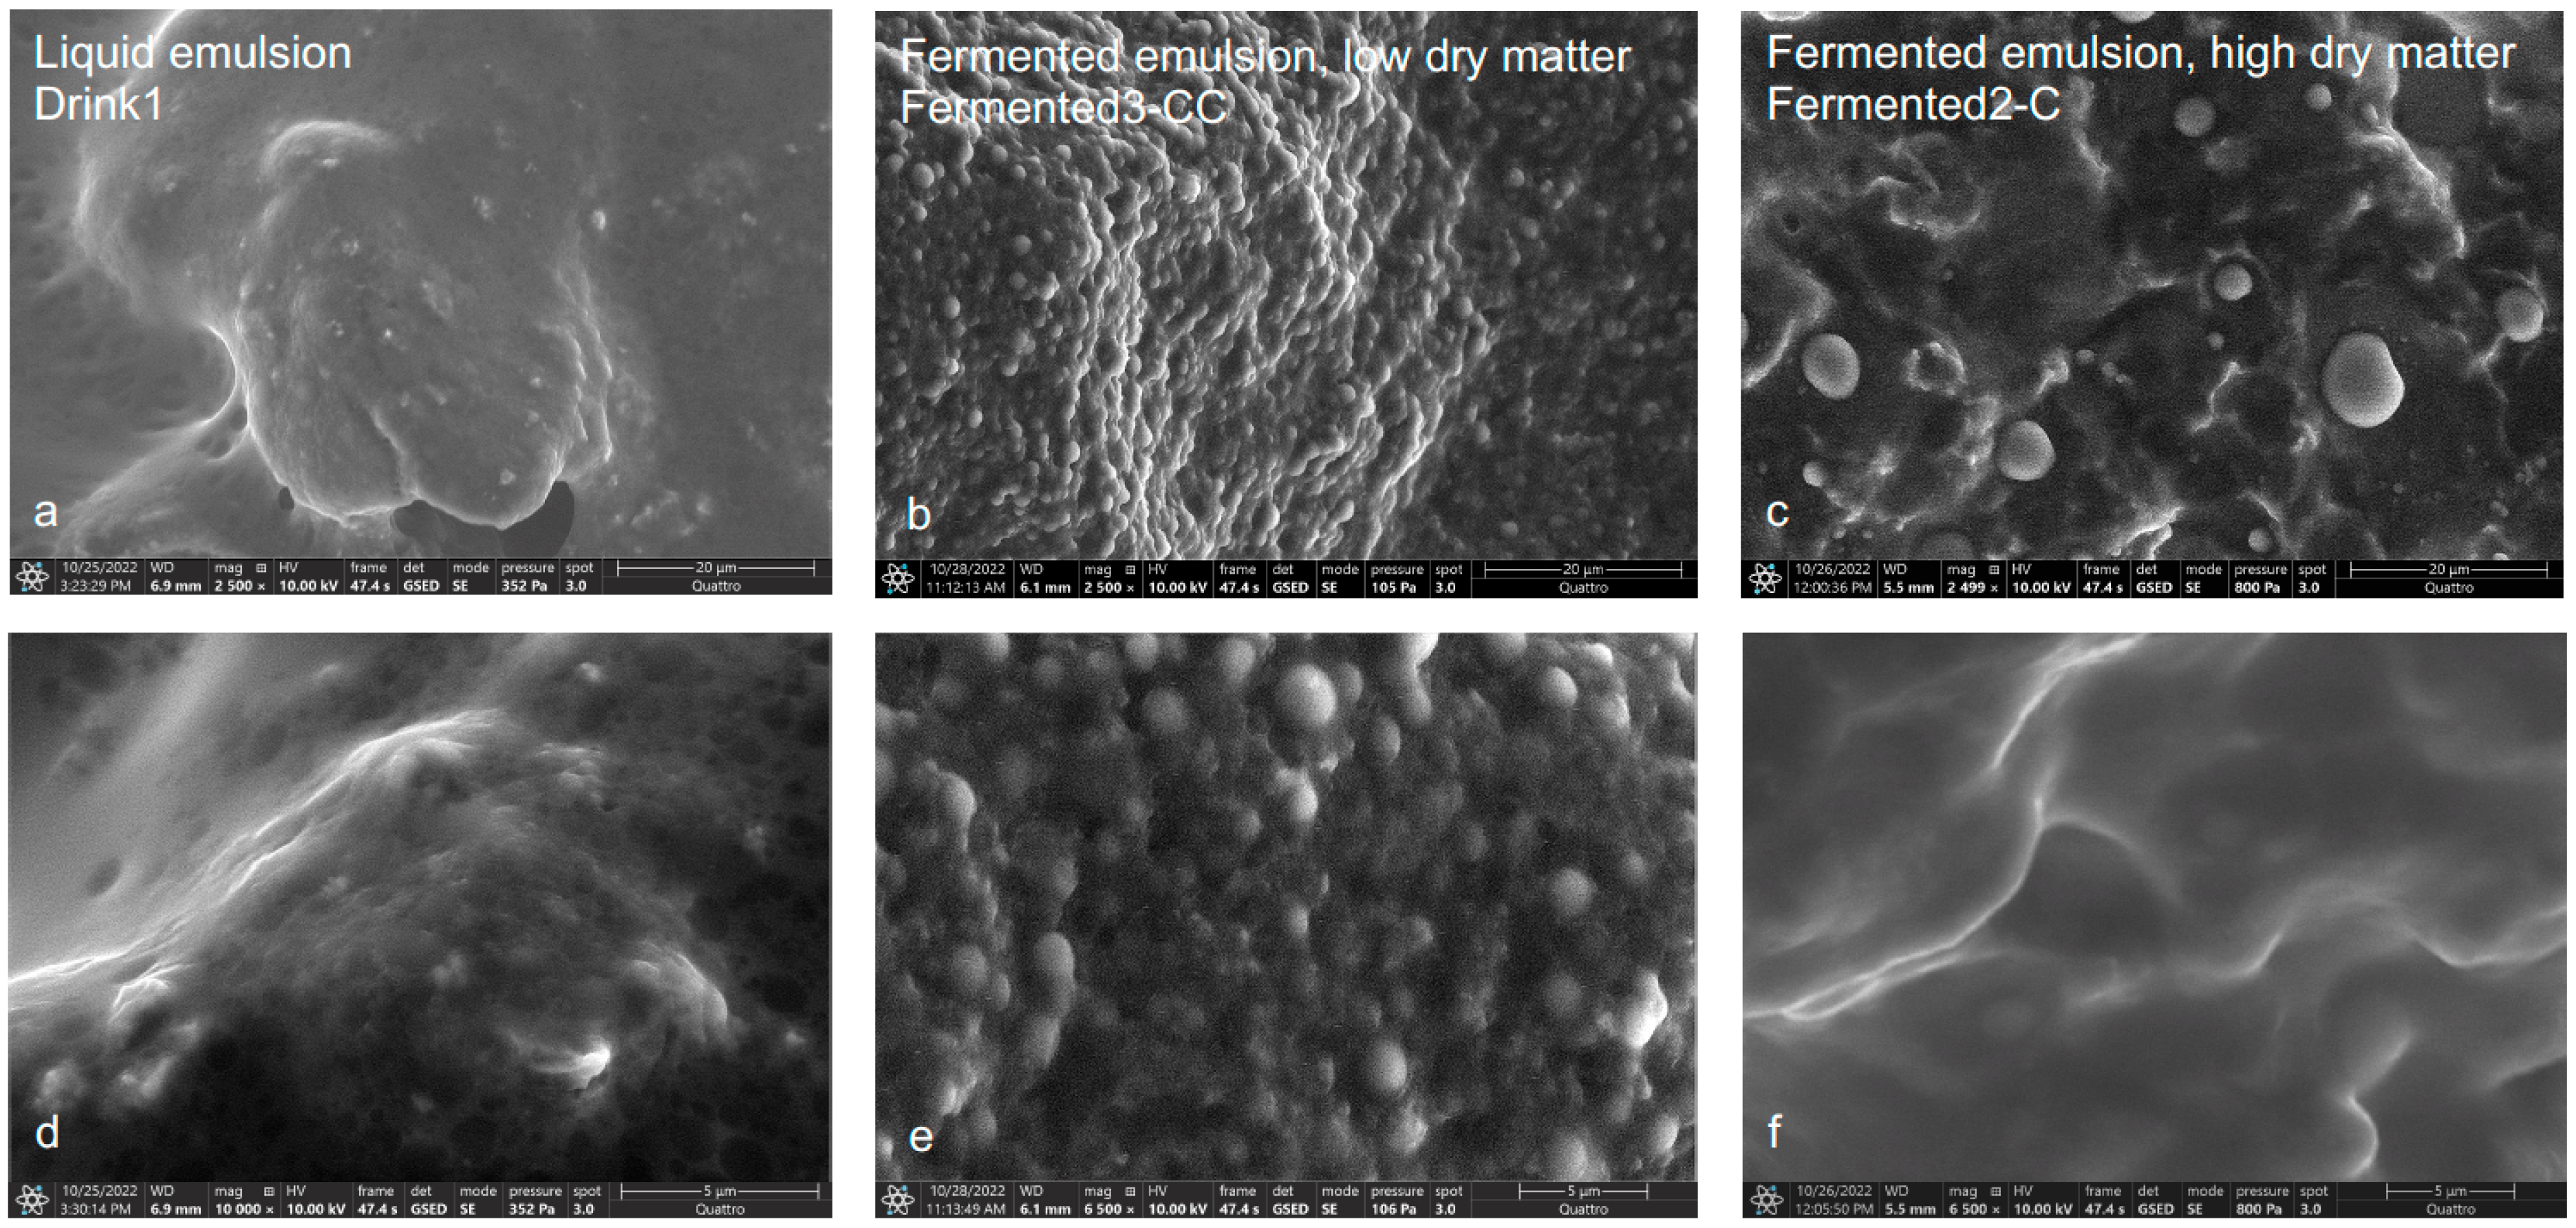
3.1. ESEM
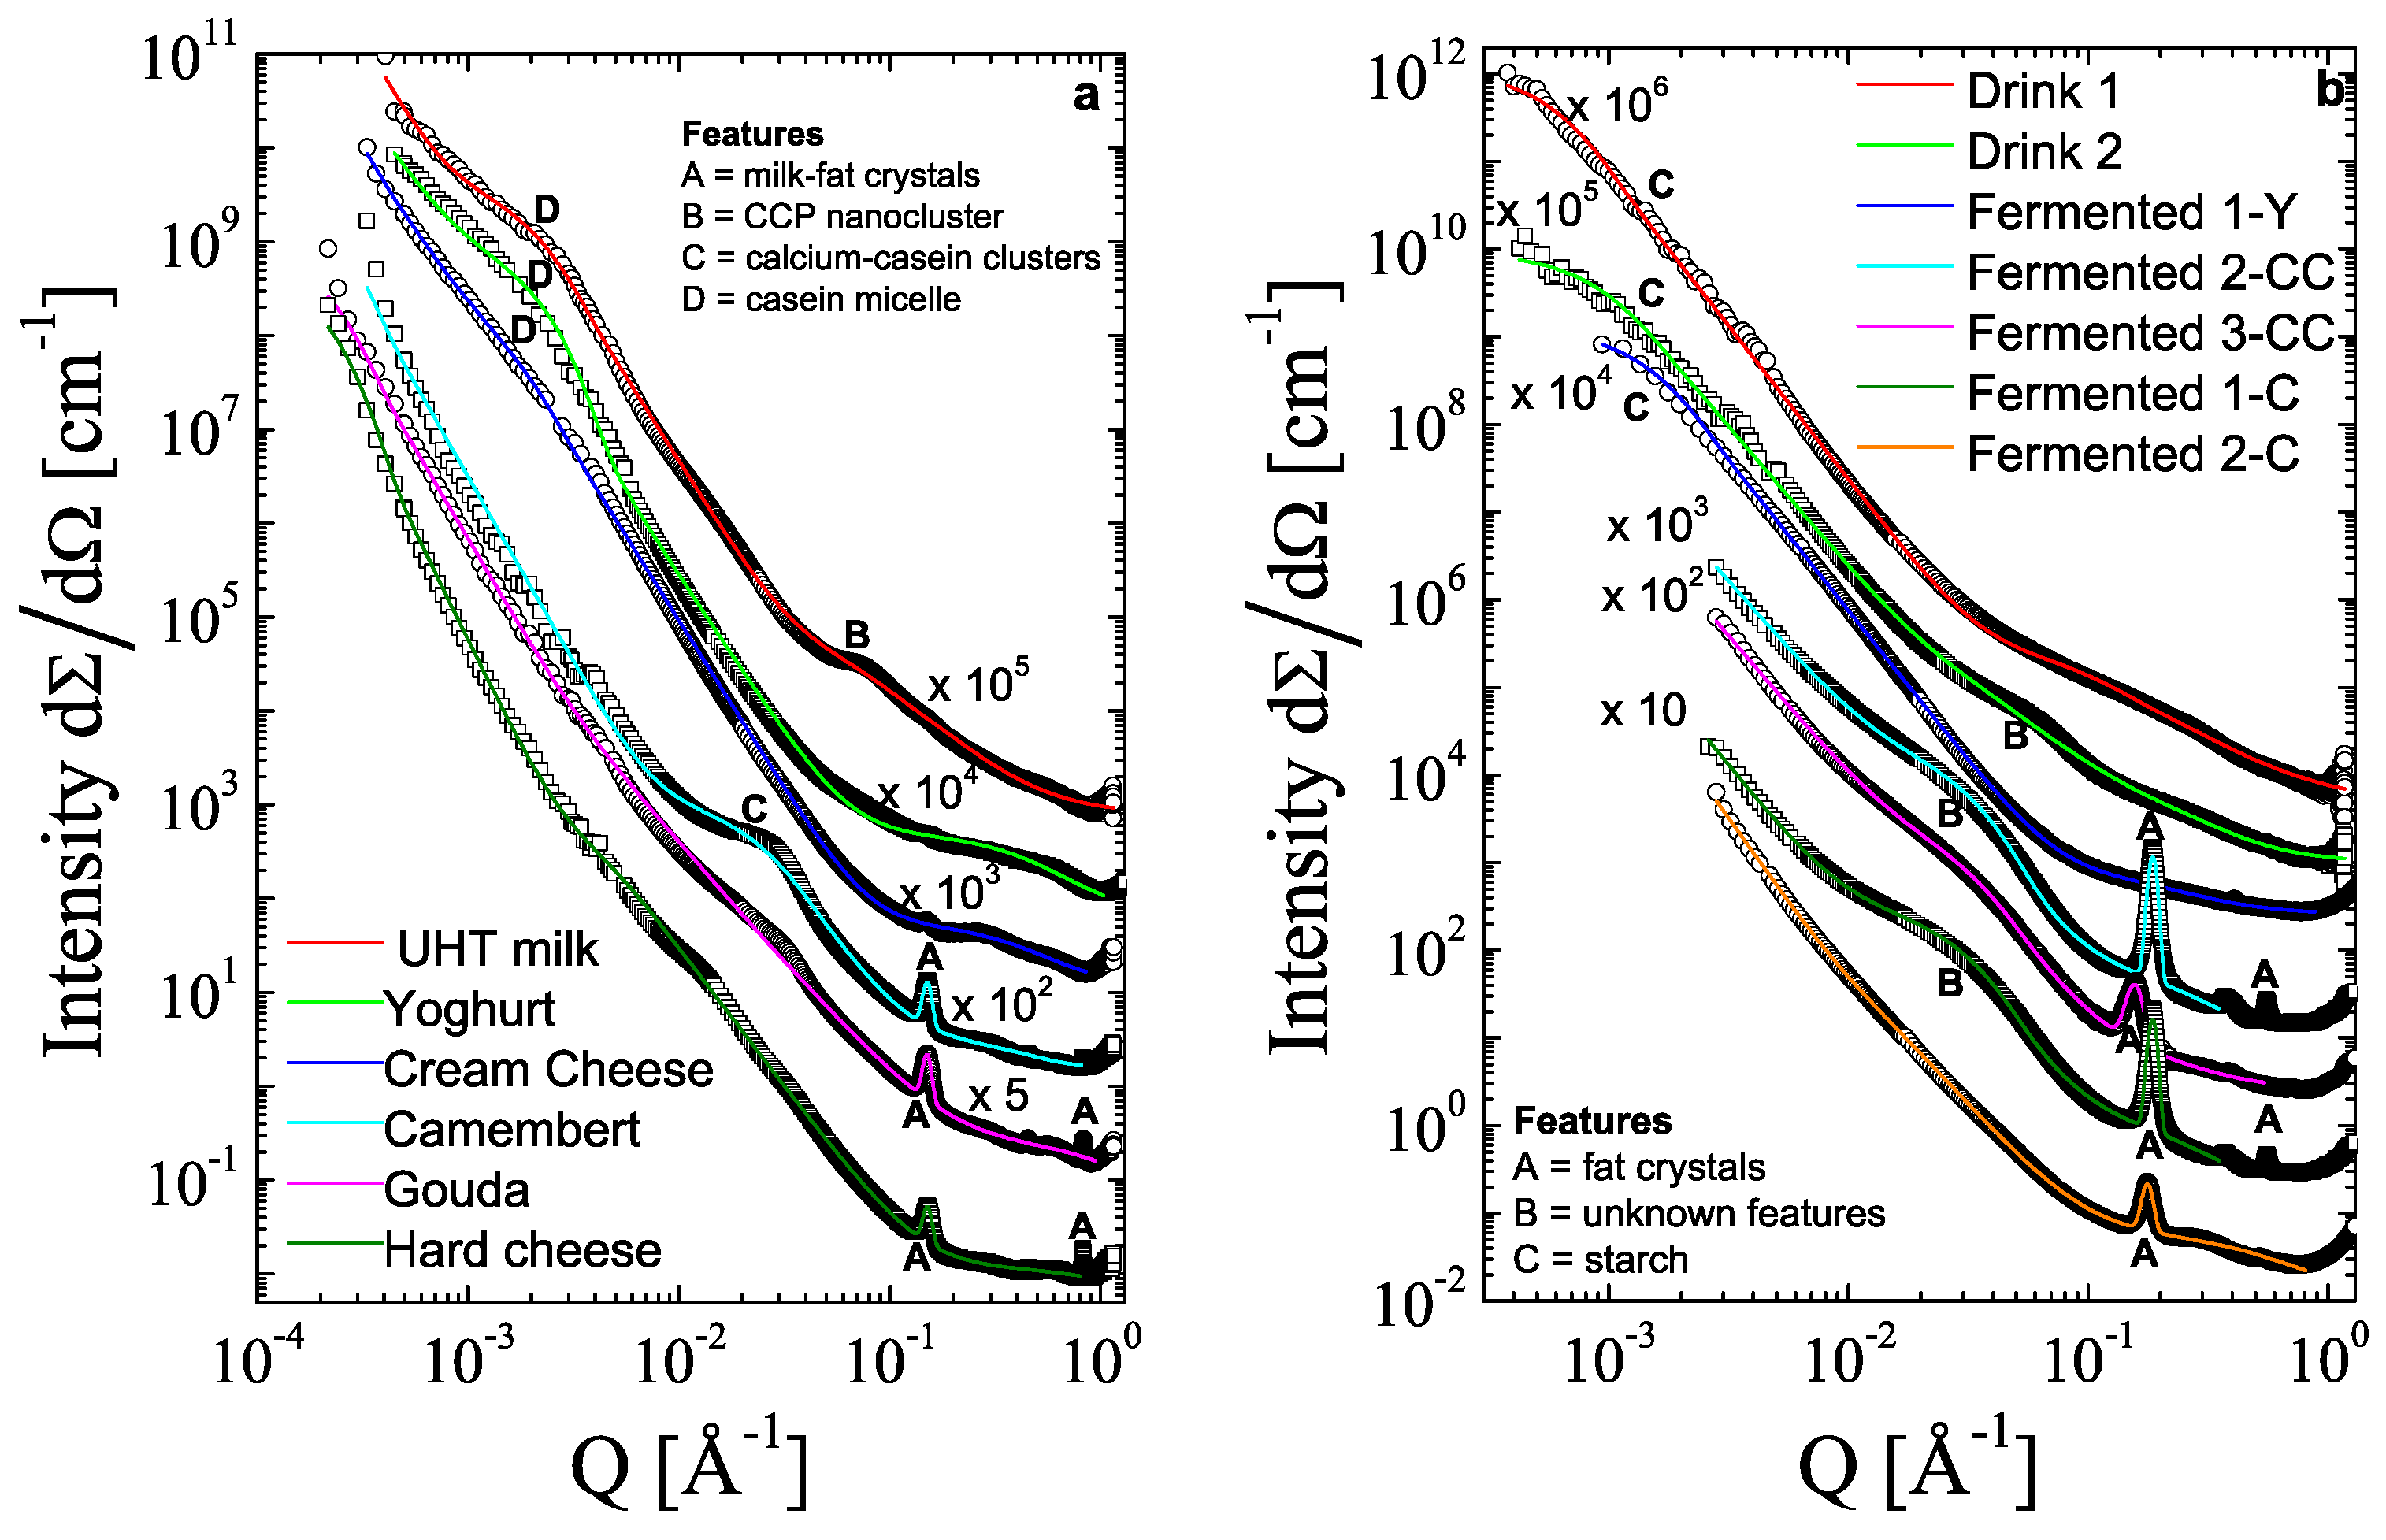
3.2. SAXS
4. Conclusions
Author Contributions
Funding
Data Availability Statement
Conflicts of Interest
References
- Fischer, P.; Windhab, E.J. Rheology of Food Materials. Curr. Opin. Colloid Interface Sci. 2011, 16, 36–40. [Google Scholar] [CrossRef]
- Mezger, T.G. The Rheology Handbook. For Users of Rotational and Oscillatory Rheometers, 4th ed.; Vincentz Network: Hanover, Germany, 2014; ISBN 9783866306509. [Google Scholar]
- Lawless, H.; Hildegarde, H. Sensory Evaluation of Food Flavors: Principles and Practices; Springer: New York, NY, USA, 2010; ISBN 978-1-4419-6487-8. [Google Scholar]
- Gilbert, E.P. Small-Angle X-ray and Neutron Scattering in Food Colloids. Curr. Opin. Colloid Interface Sci. 2019, 42, 55–72. [Google Scholar] [CrossRef]
- de Kruif, C.G. Casein Micelle Interactions. Int. Dairy J. 1999, 9, 183–188. [Google Scholar] [CrossRef]
- de Kruif, C.G. The Structure of Casein Micelles: A Review of Small-Angle Scattering Data. J. Appl. Crystallogr. 2014, 47, 1479–1489. [Google Scholar] [CrossRef]
- De Kruif, C.G.; Huppertz, T.; Urban, V.S.; Petukhov, A.V. Casein Micelles and Their Internal Structure. Adv. Colloid Interface Sci. 2012, 171–172, 36–52. [Google Scholar] [CrossRef]
- Ingham, B.; Erlangga, G.D.; Smialowska, A.; Kirby, N.M.; Wang, C.; Matia-Merino, L.; Haverkamp, R.G.; Carr, A.J. Solving the Mystery of the Internal Structure of Casein Micelles. Soft Matter 2015, 11, 2723–2725. [Google Scholar] [CrossRef]
- Ingham, B.; Smialowska, A.; Erlangga, G.D.; Matia-Merino, L.; Kirby, N.M.; Wang, C.; Haverkamp, R.G.; Carr, A.J. Revisiting the Interpretation of Casein Micelle SAXS Data. Soft Matter 2016, 12, 6937–6953. [Google Scholar] [CrossRef]
- Day, L.; Raynes, J.K.; Leis, A.; Liu, L.H.; Williams, R.P.W. Probing the Internal and External Micelle Structures of Differently Sized Casein Micelles from Individual Cows Milk by Dynamic Light and Small-Angle X-ray Scattering. Food Hydrocoll. 2017, 69, 150–163. [Google Scholar] [CrossRef]
- Lopez, C.; Cauty, C.; Guyomarc’h, F. Organization of Lipids in Milks, Infant Milk Formulas and Various Dairy Products: Role of Technological Processes and Potential Impacts. Dairy Sci. Technol. 2015, 95, 863–893. [Google Scholar] [CrossRef]
- Lopez, C.; Bourgaux, C.; Lesieur, P.; Ollivon, M. Coupling of Time-Resolved Synchrotron X-ray Diffraction and DSC to Elucidate the Crystallisation Properties and Polymorphism of Triglycerides in Milk Fat Globules. Dairy Sci. Technol. 2007, 87, 459–480. [Google Scholar] [CrossRef]
- Lopez, C.; Bourgaux, C.; Lesieur, P.; Bernadou, S.; Keller, G.; Ollivon, M. Thermal and Structural Behavior of Milk Fat 3. Influence of Cooling Rate and Droplet Size on Cream Crystallization. J. Colloid Interface Sci. 2002, 254, 64–78. [Google Scholar] [CrossRef] [PubMed]
- Kim, Y.; Valsecchi, J.; Oh, O.; Kim, J.; Lee, S.W.; Boue, F.; Lutton, E.; Busi, M.; Garvey, C.; Strobl, M. Quantitative Neutron Dark-Field Imaging of Milk: A Feasibility Study. Appl. Sci. 2022, 12, 833. [Google Scholar] [CrossRef]
- Smith, G.N.; Brok, E.; Christiansen, M.V.; Ahrné, L. Casein Micelles in Milk as Sticky Spheres. Soft Matter 2020, 16, 9955–9963. [Google Scholar] [CrossRef] [PubMed]
- Ingham, B.; Smialowska, A.; Kirby, N.M.; Wang, C.; Carr, A.J. A Structural Comparison of Casein Micelles in Cow, Goat and Sheep Milk Using X-Ray Scattering. Soft Matter 2018, 14, 3336–3343. [Google Scholar] [CrossRef]
- Li, Z.; Yang, Z.; Otter, D.; Rehm, C.; Li, N.; Zhou, P.; Hemar, Y. Rheological and Structural Properties of Coagulated Milks Reconstituted in D2O: Comparison between Rennet and a Tamarillo Enzyme (Tamarillin). Food Hydrocoll. 2018, 79, 170–178. [Google Scholar] [CrossRef]
- Sodini, I.; Lucas, A.; Tissier, J.P.; Corrieu, G. Physical Properties and Microstructure of Yoghurts Supplemented with Milk Protein Hydrolysates. Int. Dairy J. 2005, 15, 29–35. [Google Scholar] [CrossRef]
- Krzeminski, A.; Großhable, K.; Hinrichs, J. Structural Properties of Stirred Yoghurt as Influenced by Whey Proteins. LWT-Food Sci. Technol. 2011, 44, 2134–2140. [Google Scholar] [CrossRef]
- Castaneda, N.; Lee, Y. Microstructure of a Model Fresh Cheese and Bioaccessibility of Vitamin D3 Using in Vitro Digestion. Gels 2019, 5, 16. [Google Scholar] [CrossRef]
- El-Bakry, M.; Sheehan, J. Analysing Cheese Microstructure: A Review of Recent Developments. J. Food Eng. 2014, 125, 84–96. [Google Scholar] [CrossRef]
- Brückner-Gühmann, M.; Vasil’eva, E.; Culetu, A.; Duta, D.; Sozer, N.; Drusch, S. Oat Protein Concentrate as Alternative Ingredient for Non-Dairy Yoghurt-Type Product. J. Sci. Food Agric. 2019, 99, 5852–5857. [Google Scholar] [CrossRef]
- Brückner-Gühmann, M.; Kratzsch, A.; Sozer, N.; Drusch, S. Oat Protein as Plant-Derived Gelling Agent: Properties and Potential of Modification. Future Foods 2021, 4, 100053. [Google Scholar] [CrossRef]
- Klost, M.; Brzeski, C.; Drusch, S. Effect of Protein Aggregation on Rheological Properties of Pea Protein Gels. Food Hydrocoll. 2020, 108, 106036. [Google Scholar] [CrossRef]
- Ayyash, M.M.; Sherkat, F.; Francis, P.; Williams, R.; Shah, N.P. The Effect of Sodium Chloride Substitution with Potassium Chloride on Texture Profile and Microstructure of Halloumi Cheese. J. Dairy Sci. 2011, 94, 37–42. [Google Scholar] [CrossRef] [PubMed]
- Noronha, N.; Duggan, E.; Ziegler, G.R.; O’Riordan, E.D.; O’Sullivan, M. Comparison of Microscopy Techniques for the Examination of the Microstructure of Starch-Containing Imitation Cheeses. Food Res. Int. 2008, 41, 472–479. [Google Scholar] [CrossRef]
- Monga, A.; Dev, M.J.; Singhal, R.S. Cottage Cheese from Blends of Fresh Green Peas (Pisum Sativum L.) and Dairy Milk (PEaneer): Preparation, Characterization, and Sensory Evaluation. LWT 2022, 160, 113263. [Google Scholar] [CrossRef]
- Beaucage, G. Small-Angle Scattering from Polymeric Mass Fractals of Arbitrary Mass-Fractal Dimension. J. Appl. Crystallogr. 1996, 29, 134–146. [Google Scholar] [CrossRef]
- Sarkar, A.; Dickinson, E. Sustainable Food-Grade Pickering Emulsions Stabilized by Plant-Based Particles. Curr. Opin. Colloid Interface Sci. 2020, 49, 69–81. [Google Scholar] [CrossRef]
- Michel, S.E.S.; Scheermeijer, R.; Ambühl, M.; Fernandez Farres, I. Novel Plant-Based Cream Cheese: A Tribology Perspective. J. Food Eng. 2022, 335, 111172. [Google Scholar] [CrossRef]
- Grossmann, L.; McClements, D.J. The Science of Plant-Based Foods: Approaches to Create Nutritious and Sustainable Plant-Based Cheese Analogs. Trends Food Sci. Technol. 2021, 118, 207–229. [Google Scholar] [CrossRef]
- Roos, Y.H.; Drusch, S. (Eds.) Phase Transitions in Foods, 2nd ed.; Academic Press: Oxford, UK, 2016; ISBN 978-0-12-408086-7. [Google Scholar]
- Frick, B.; Richter, D.; Ritter, C.L. Structural Changes near the Glass Transition-Neutron Diffraction on a Simple Polymer. Europhys. Lett. 1989, 9, 557. [Google Scholar] [CrossRef]
- Gillies, G. Predictions of the Shear Modulus of Cheese, a Soft Matter Approach. Appl. Rheol. 2019, 29, 58–68. [Google Scholar] [CrossRef]
- Olakanmi, S.; Karunakaran, C.; Jayas, D. Applications of X-Ray Micro-Computed Tomography and Small-Angle X-Ray Scattering Techniques in Food Systems: A Concise Review. J. Food Eng. 2023, 342, 111355. [Google Scholar] [CrossRef]
- Klose, C.; Arendt, E.K. Proteins in Oats; Their Synthesis and Changes during Germination: A Review. Crit. Rev. Food Sci. Nutr. 2012, 52, 629–639. [Google Scholar] [CrossRef] [PubMed]
- Kinsella, J.E. Functional Properties of Soy Proteins. J. Am. Oil Chem. Soc. 1979, 56, 242–258. [Google Scholar] [CrossRef]
- Miyagawa, Y.; Shintani, K.; Katsuki, K.; Nakagawa, K.; Adachi, S. Thermal and Structural Changes of Rapeseed Oil during Isothermal Storage at Low Temperature. Food Struct. 2017, 11, 8–15. [Google Scholar] [CrossRef]
- Meng, X.; Pan, Q.; Ding, Y.; Jiang, L. Rapid Determination of Phospholipid Content of Vegetable Oils by FTIR Spectroscopy Combined with Partial Least-Square Regression. Food Chem. 2014, 147, 272–278. [Google Scholar] [CrossRef] [PubMed]

| Category | Product | Fat (%), of Which Is Saturated | Carbohydrates (%), of Which Is Sugar | Protein (%) | Salt (%) |
|---|---|---|---|---|---|
| Liquid emulsion | UHT milk | 3.5, 2.4 | 4.8, 4.8 | 3.3 | 0.1 |
| Fermented emulsion, low dry matter | Yogurt | 3.5, 2.4 | 5.1, 5.1 | 4.4 | 0.2 |
| Cream cheese | 17.0, 11.0 | 3.0, 3.0 | 8.5 | 0.3 | |
| Fermented emulsion, high dry matter | Camembert | 32.0, 22.0 | 0.5, 0.5 | 17.0 | 1.4 |
| Gouda | 28.0, 18.8 | 0.5, 0.5 | 23.5 | 1.5 | |
| Hard cheese | 29.7, 19.6 | 0.0, 0.0 | 32.4 | 1.6 | |
| Liquid emulsion | Drink 1 | 3.5, 0.4 | 5.7, 0.0 | 0.7 | 0.1 |
| Drink 2 | 3.0, 0.3 | 7.1, 3.4 | 1.1 | 0.1 | |
| Fermented emulsion, low dry matter | Fermented 1-Y | 1.9, 0.4 | 3.4, 1.0 | 3.8 | 0.3 |
| Fermented 2-CC | 23.0, 21.0 | 8.0, 0.0 | 0.0 | 1.2 | |
| Fermented 3-CC | 20.0, 8.0 | 9.8, 3.6 | 3.2 | 0.7 | |
| Fermented emulsion, high dry matter | Fermented 1-C | 29.0, 26.0 | 11.0, 0.0 | 0.0 | 1.7 |
| Fermented 2-C | 19.0, 17.0 | 24.0, 0.5 | 0.5 | 1.9 |
| Product | Size 1 [nm] | Exponent | Size 2 [nm] | Exponent | Size 3 [nm] | Exponent | Size 4 (Periodic) [nm] |
|---|---|---|---|---|---|---|---|
| UHT milk | >1000 | 4 fix | 96 ± 1.7 | 3.59 ± 0.01 | 2.34 ± 0.07 | 1.99 ± 0.02 | -- |
| Yogurt | >1000 | 3.33 ± 0.01 | 95.1 ± 1.6 | 5.23 ± 0.01 | 0.37 ± 0.04 | 1.9 ± 1.0 | -- |
| Cream cheese | >1000 | 3.50 ± 0.02 | 123 ± 4 | 3.71 ± 0.05 | 0.39 ± 0.01 | 2.4 ± 0.3 | -- |
| Camembert | >1000 | 4 fix | 7.7 ± 0.1 | 3.17 ± 0.03 | 0.39 ± 0.02 | large | 4.18 ± 0.01 |
| Gouda | >1000 | 3.82 ± 0.01 | 40 ± 3 | 2.39 ± 0.01 | 0.15 ± 0.03 | large | 4.19 ± 0.01 |
| Hard cheese | >1000 | 4.59 ± 0.01 | 40.4 ± 0.9 | 2.93 ± 0.01 | 0.17 ± 0.17 | small | 4.17 ± 0.01 |
| Drink 1 | 321 ± 8 | 3.51 ± 0.01 | 1.68 ± 0.05 | 1.72 ± 0.03 | -- | -- | -- |
| Drink 2 | 197 ± 4 | 3.22 ± 0.02 | 4.8 ± 0.5 | 2.3 ± 0.2 | 0.61 ± 0.06 | 2.5 ± 0.2 | -- |
| Fermented1-Y | 130 ± 1 | 3.44 ± 0.01 | -- | -- | 0.71 ± 0.01 | 2.2 ± 0.1 | 4.03 ± 0.01 |
| Fermented2-CC | >100 | 3.10 ± 0.06 | 6.4 ± 0.1 | 4.2 ± 0.1 | 0.66 ± 0.06 | 2 fix | 3.38 ± 0.01 |
| Fermented3-CC | >100 | 3.22 ± 0.02 | 6.39 ± 0.06 | 3.62 ± 0.02 | 0.71 ± 0.04 | 2 fix | 4.03 ± 0.01 |
| Fermented1-C | >100 | 3.40 ± 0.06 | 6.6 ± 0.1 | 3.74 ± 0.04 | 0.72 ± 0.06 | 2 fix | 3.39 ± 0.01 |
| Fermented2-C | >100 | 3.89 ± 0.05 | 13.3 ± 0.7 | 2.79 ± 0.02 | 0.311 ± 0.003 | 2 fix | 3.55 ± 0.01 |
Disclaimer/Publisher’s Note: The statements, opinions and data contained in all publications are solely those of the individual author(s) and contributor(s) and not of MDPI and/or the editor(s). MDPI and/or the editor(s) disclaim responsibility for any injury to people or property resulting from any ideas, methods, instructions or products referred to in the content. |
© 2023 by the authors. Licensee MDPI, Basel, Switzerland. This article is an open access article distributed under the terms and conditions of the Creative Commons Attribution (CC BY) license (https://creativecommons.org/licenses/by/4.0/).
Share and Cite
Heiden-Hecht, T.; Wu, B.; Appavou, M.-S.; Förster, S.; Frielinghaus, H.; Holderer, O. Multiscale Structural Insight into Dairy Products and Plant-Based Alternatives by Scattering and Imaging Techniques. Foods 2023, 12, 2021. https://doi.org/10.3390/foods12102021
Heiden-Hecht T, Wu B, Appavou M-S, Förster S, Frielinghaus H, Holderer O. Multiscale Structural Insight into Dairy Products and Plant-Based Alternatives by Scattering and Imaging Techniques. Foods. 2023; 12(10):2021. https://doi.org/10.3390/foods12102021
Chicago/Turabian StyleHeiden-Hecht, Theresia, Baohu Wu, Marie-Sousai Appavou, Stephan Förster, Henrich Frielinghaus, and Olaf Holderer. 2023. "Multiscale Structural Insight into Dairy Products and Plant-Based Alternatives by Scattering and Imaging Techniques" Foods 12, no. 10: 2021. https://doi.org/10.3390/foods12102021