
Dynamic Changes in the Microbial Composition and Spoilage Characteristics of Refrigerated Large Yellow Croaker (Larimichthys crocea) during Storage

 , , ,
, , ,
Abstract
:1. Introduction
2. Materials and Methods
2.1. Sample Treatment
2.2. Determination of TVC
2.3. Determination of TVB-N
2.4. Determination of TBARS
2.5. 16S rDNA Sequencing
2.6. Spoilage Ability Determination
2.7. Data Processing and Analysis
3. Results and Discussion
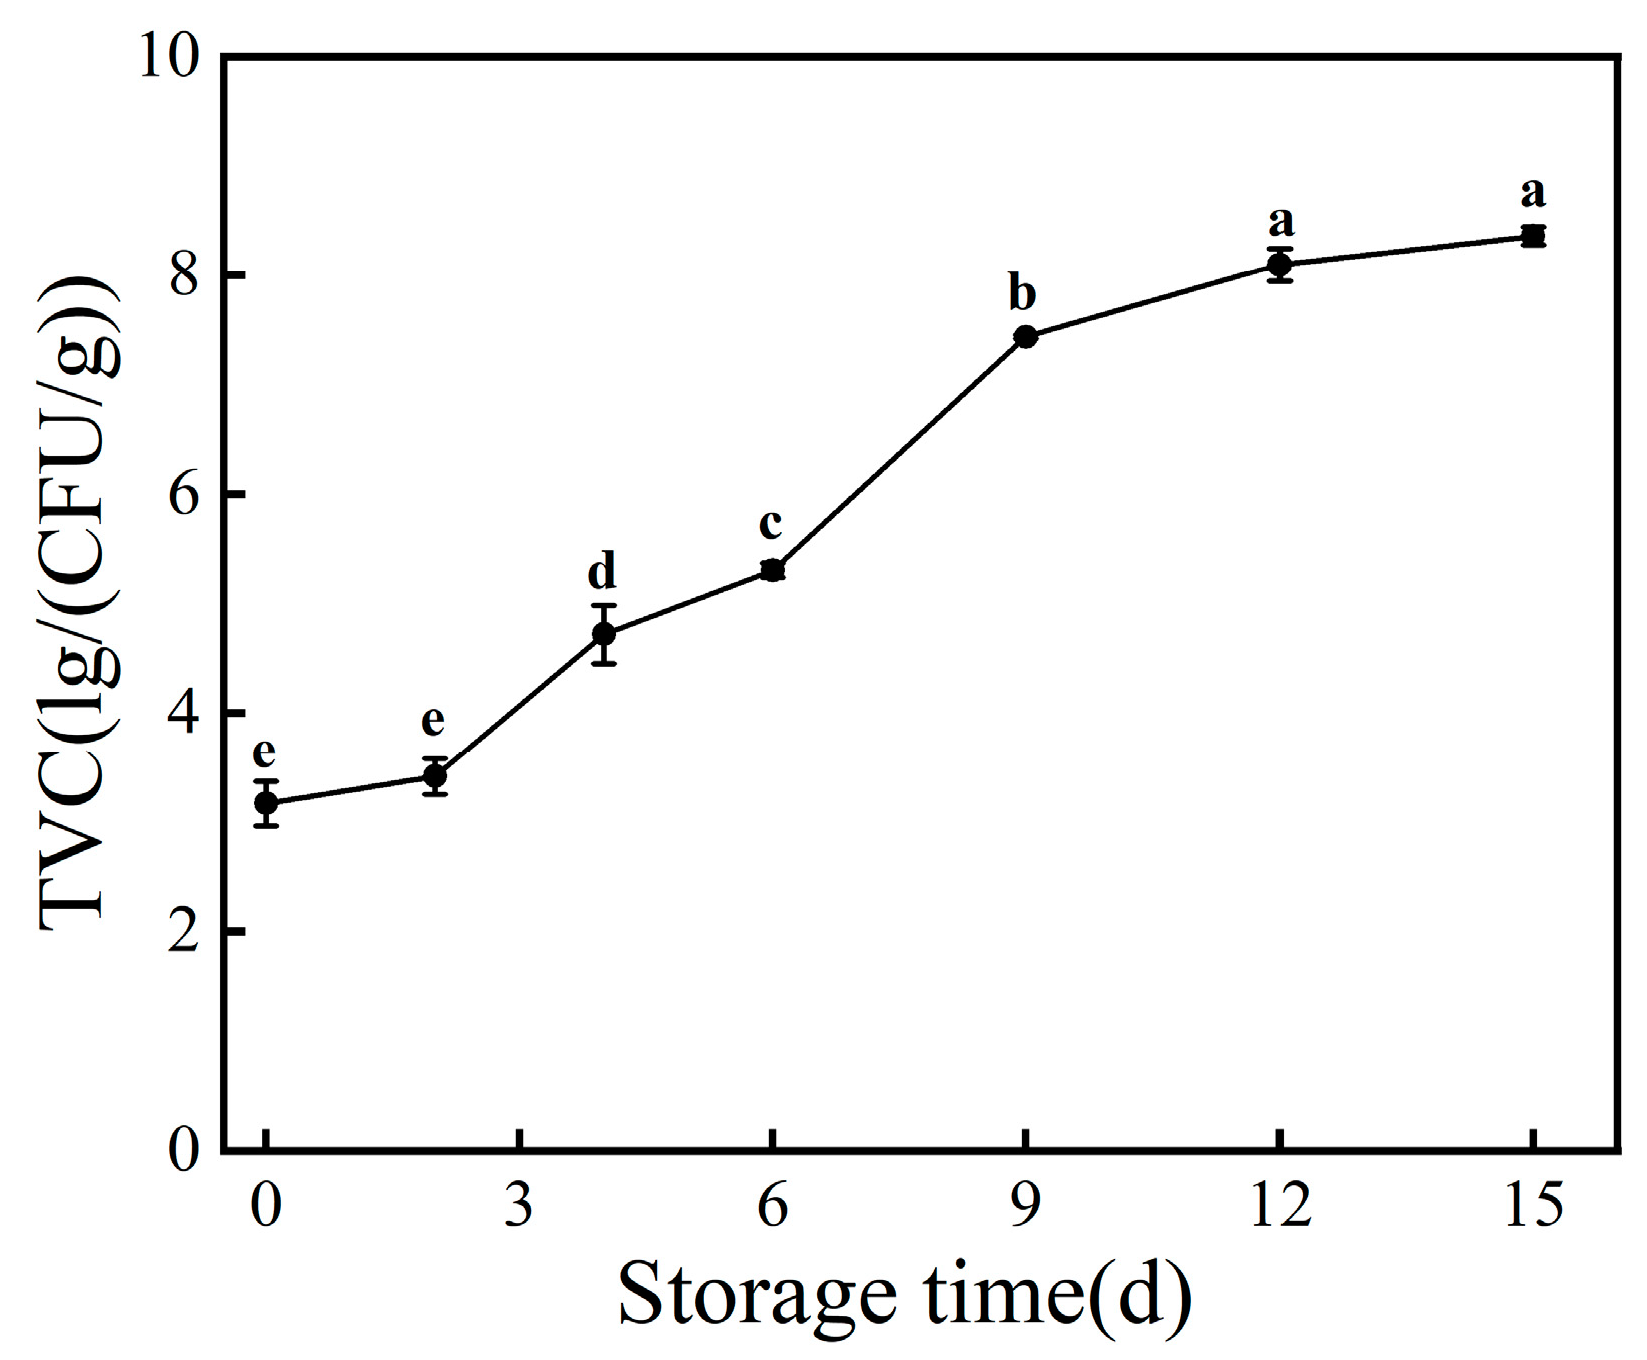
3.1. TVC Value
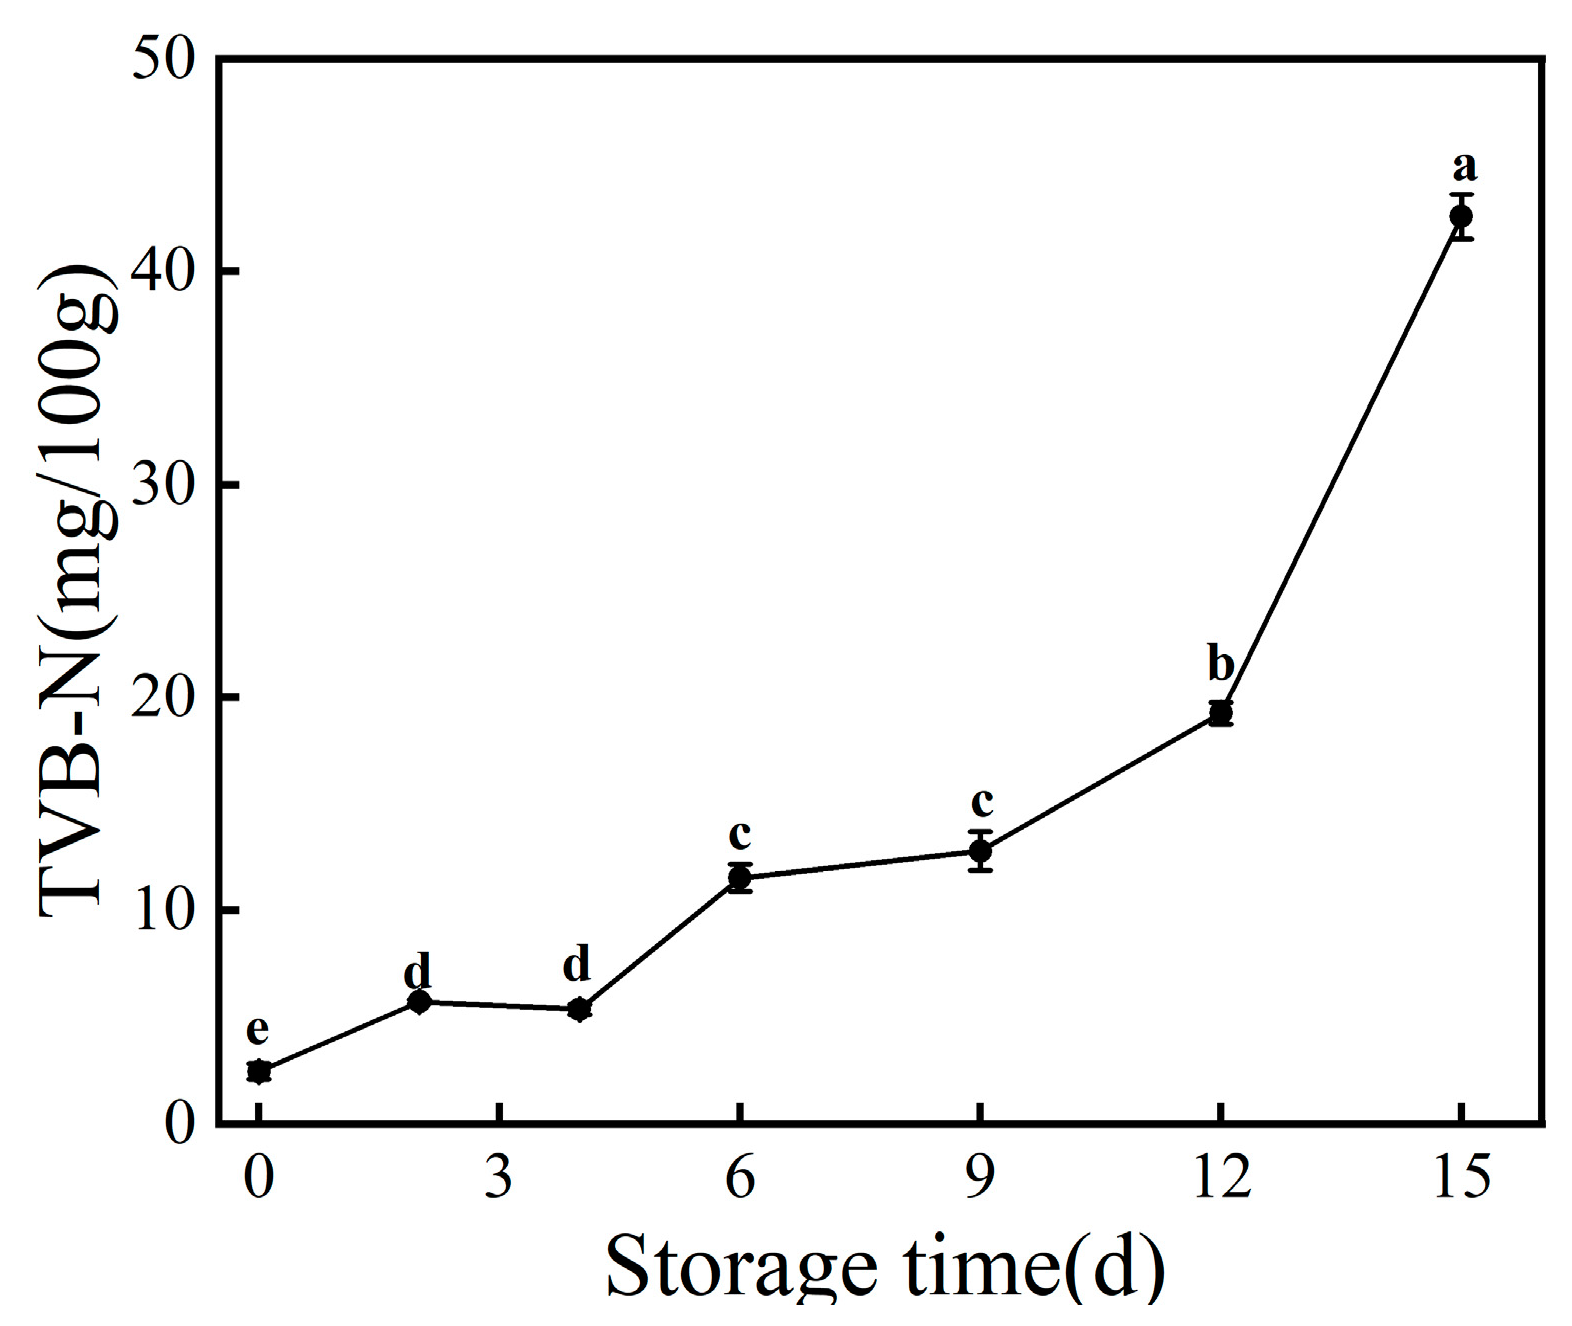
3.2. TVB-N Value
3.3. TBARS Value
3.4. OTU Clustering Analysis
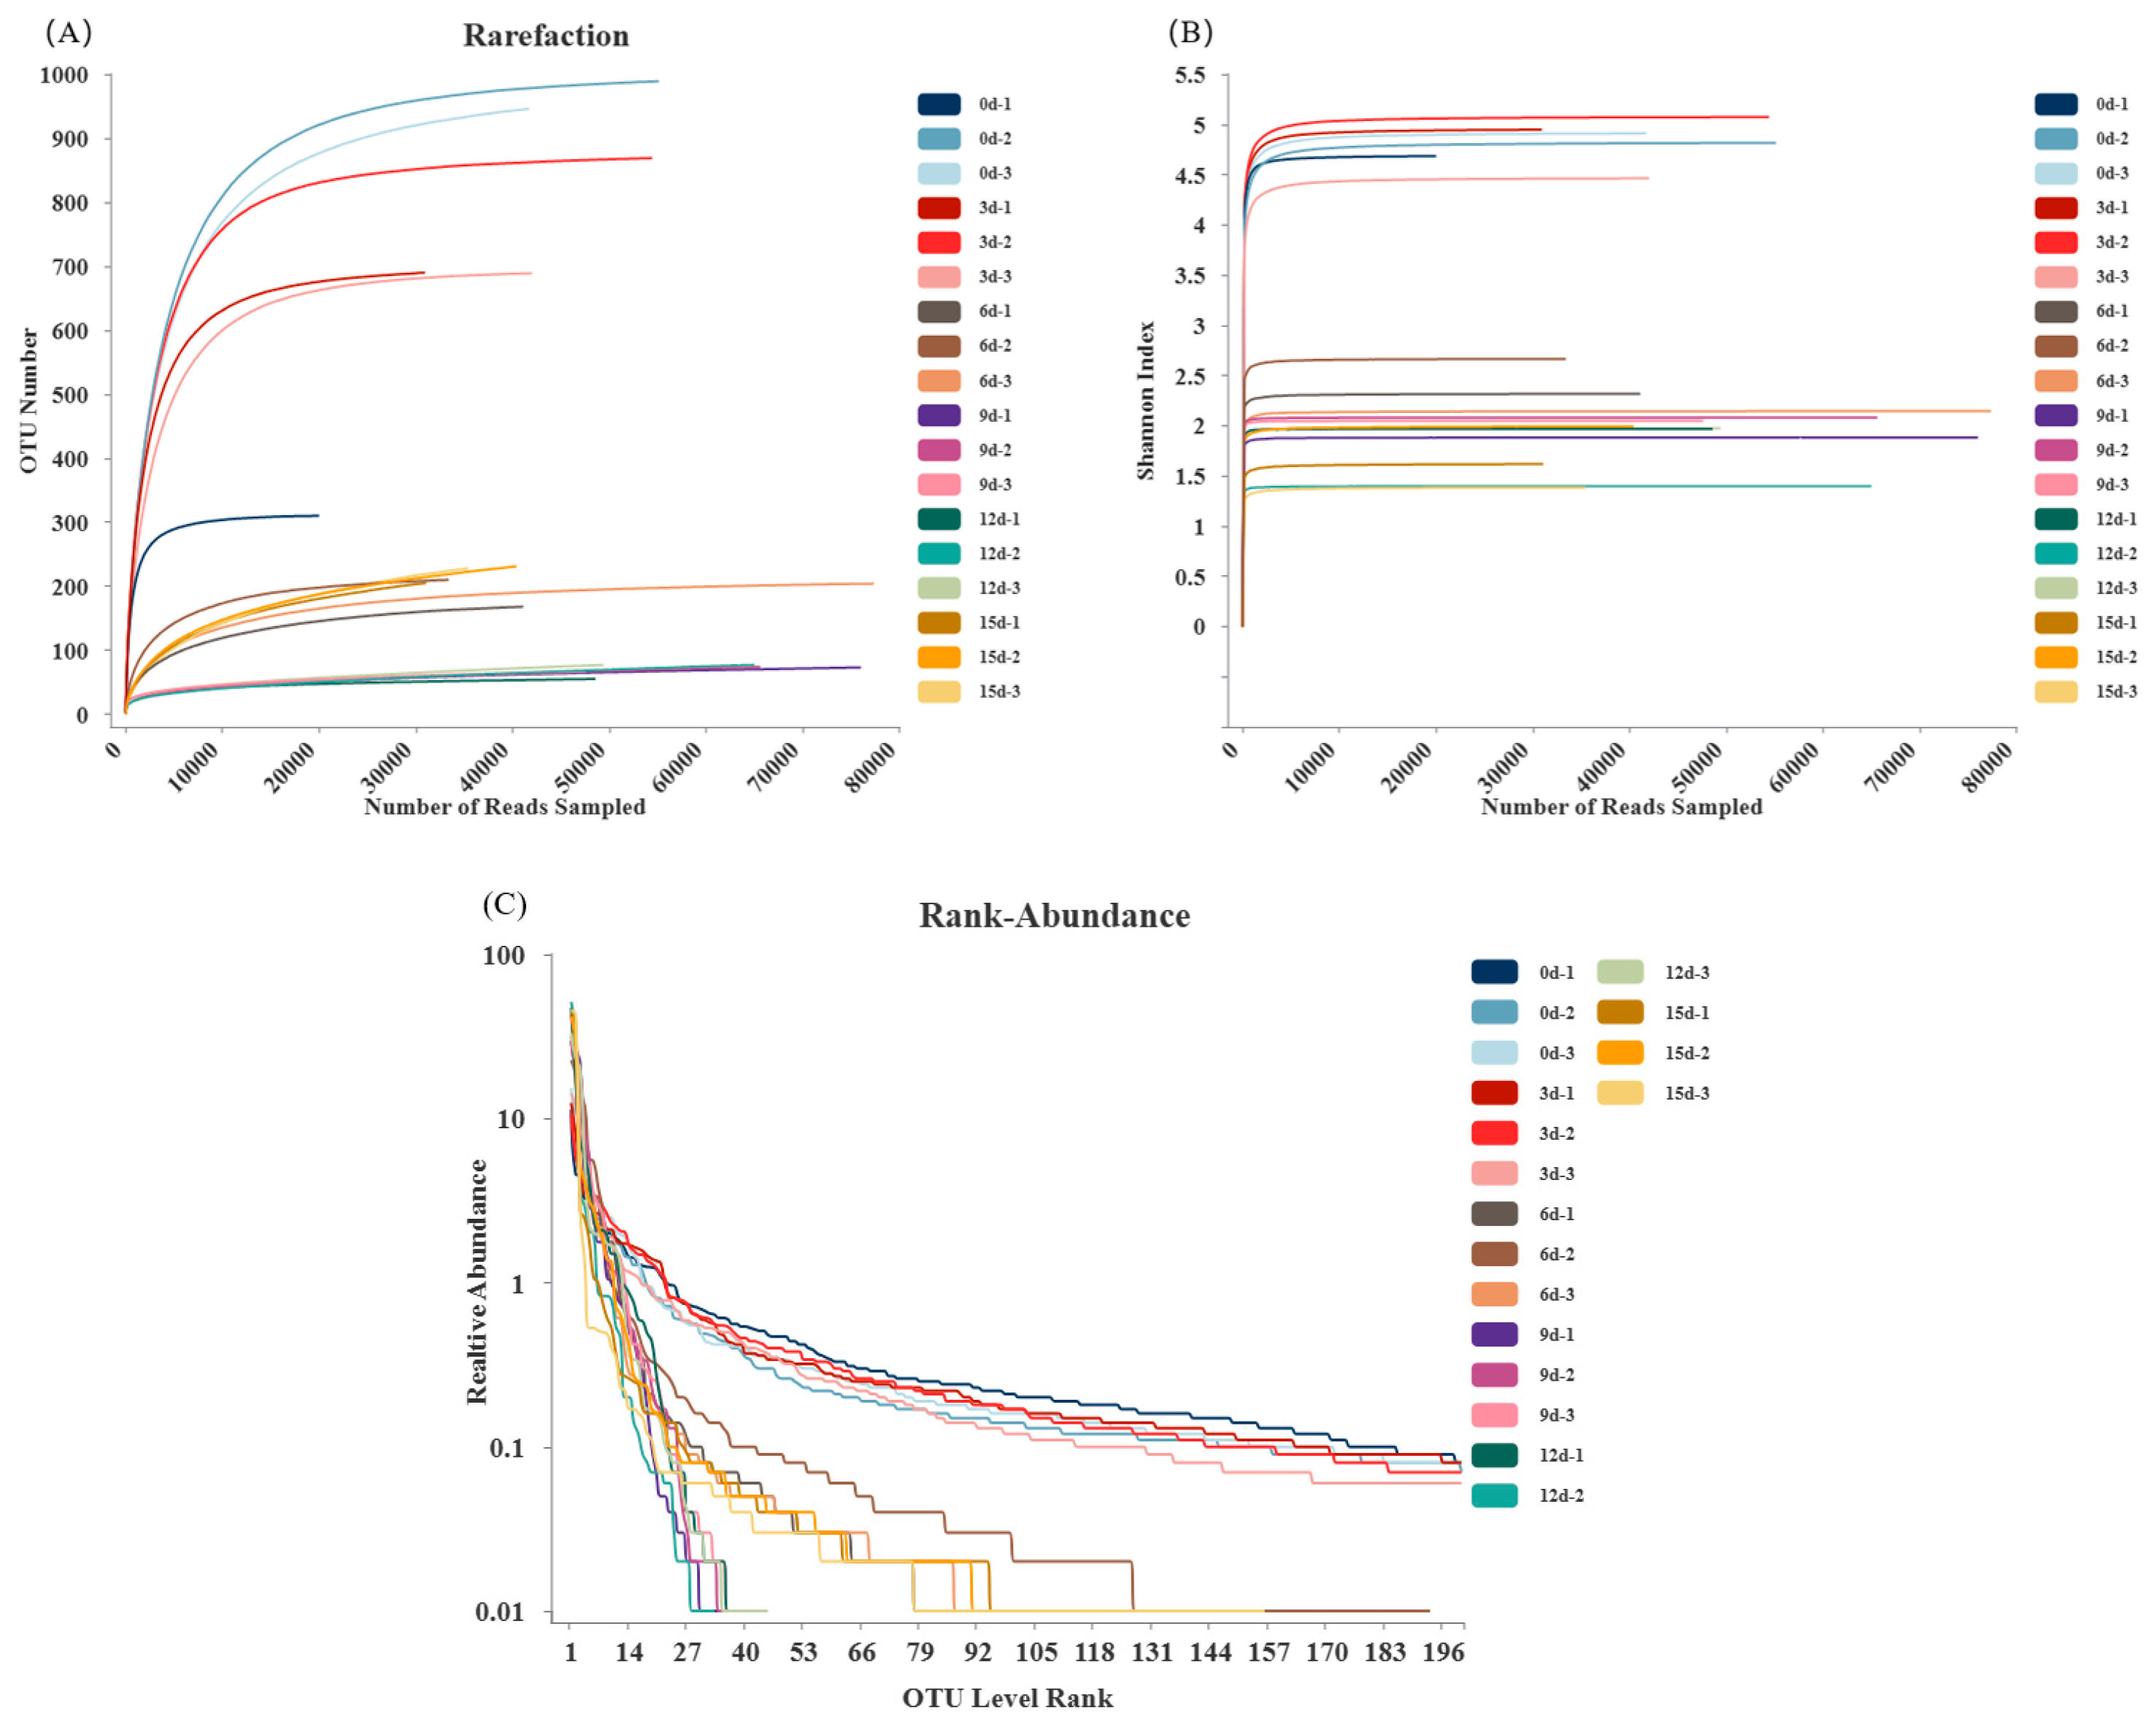
3.5. α-Diversity Analysis
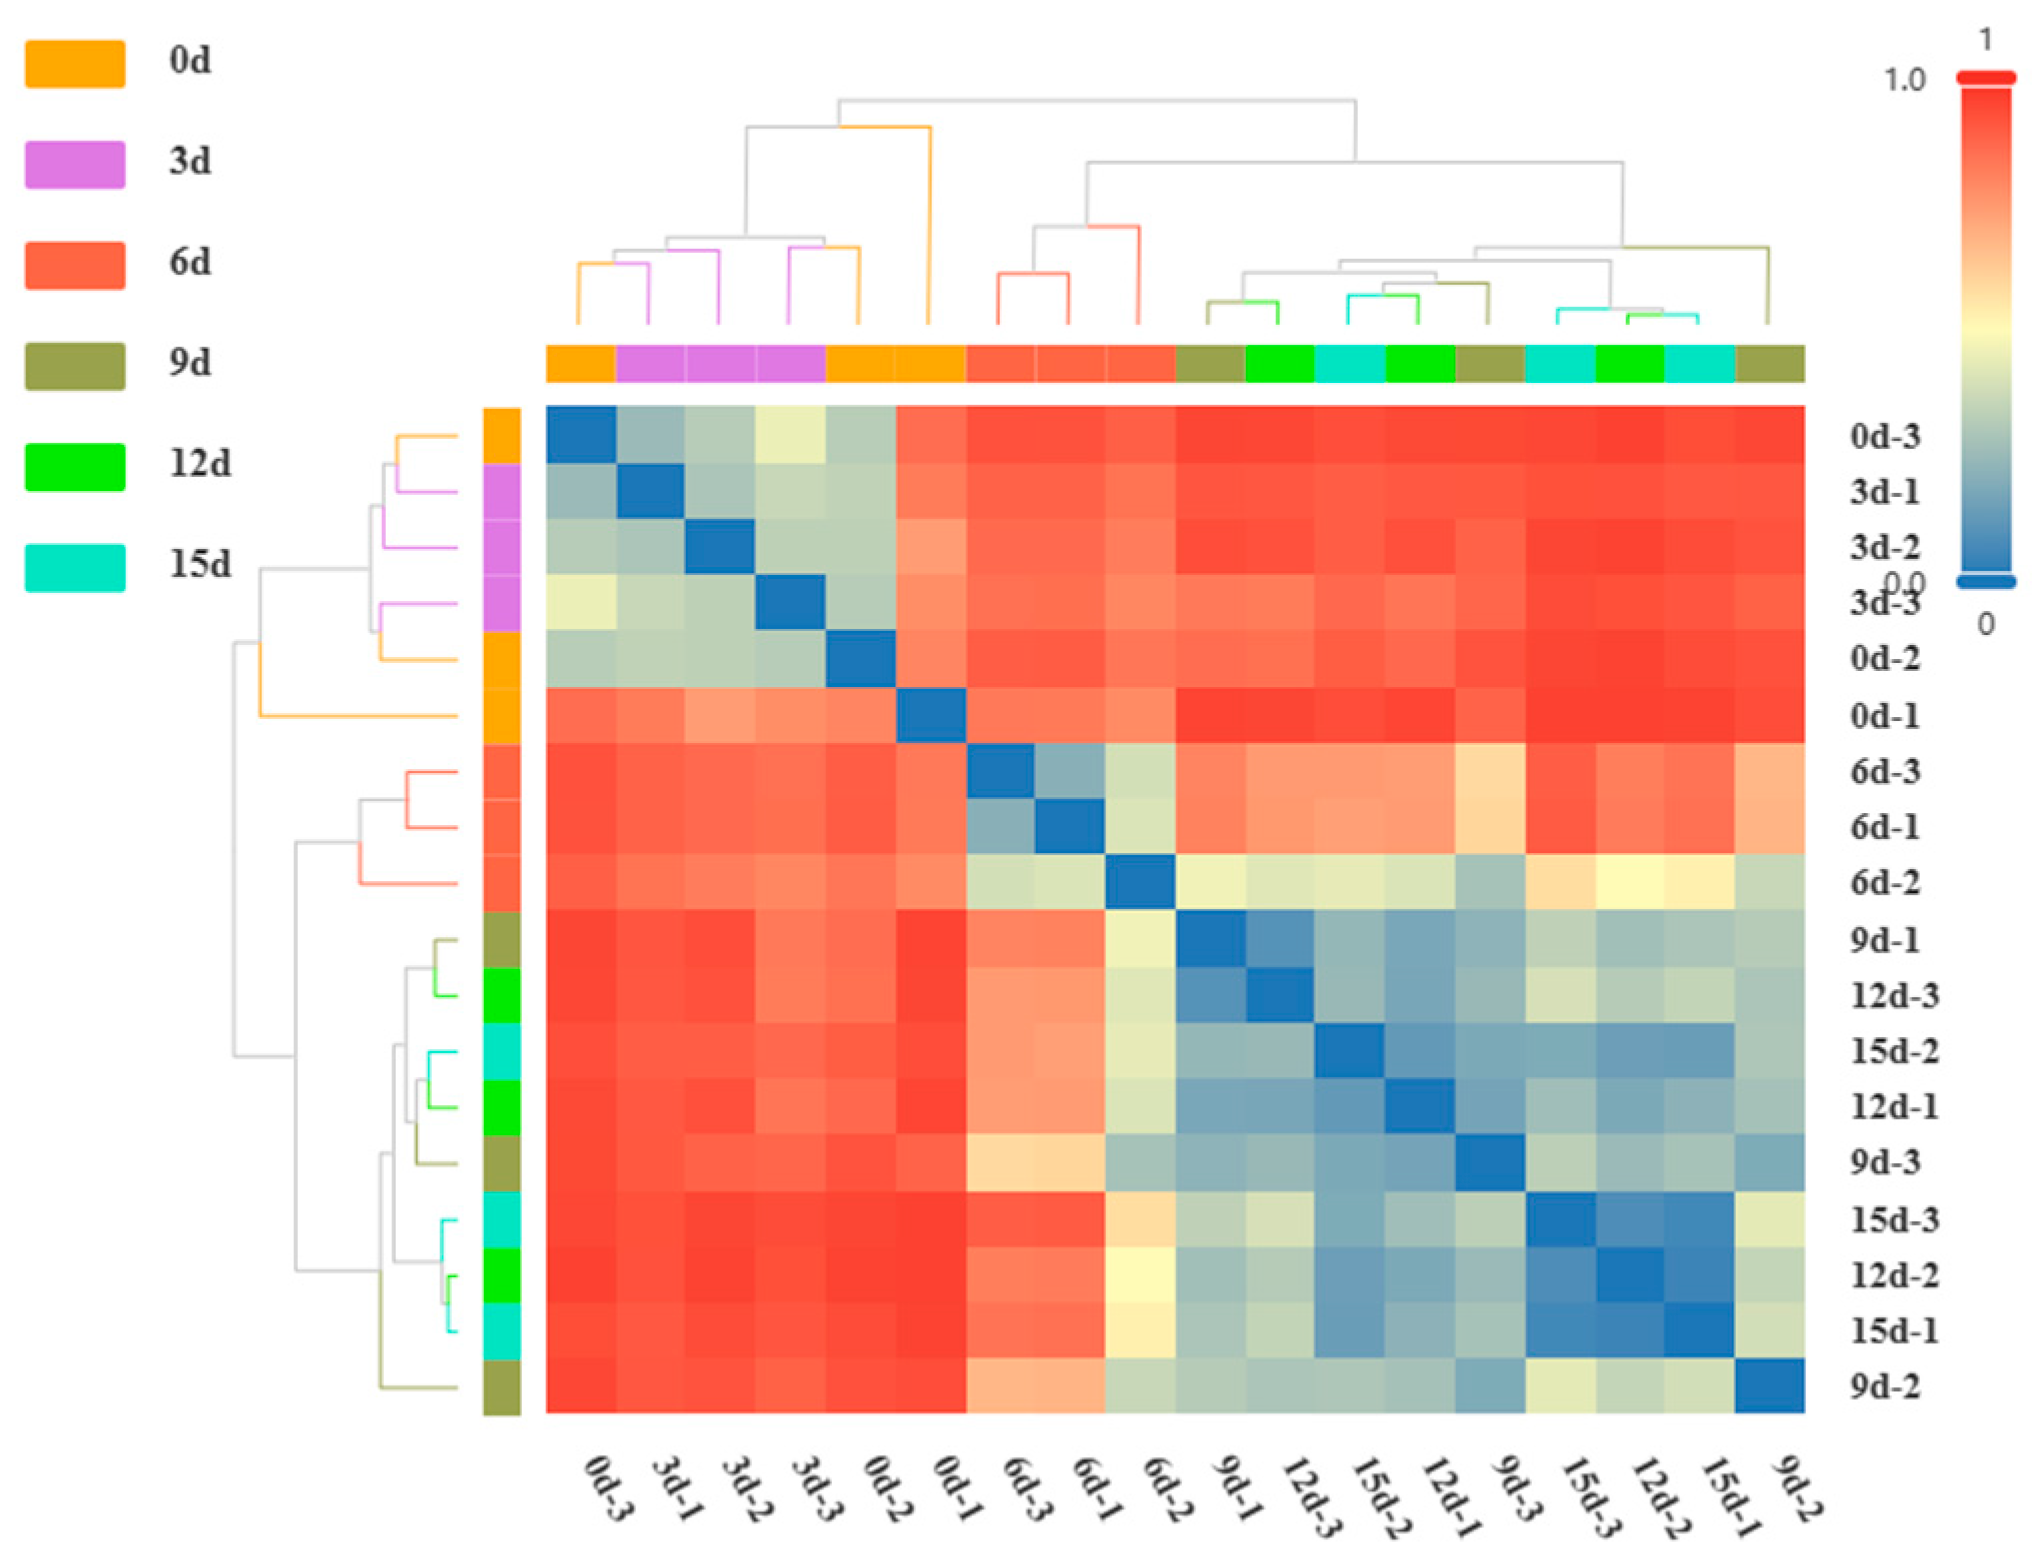
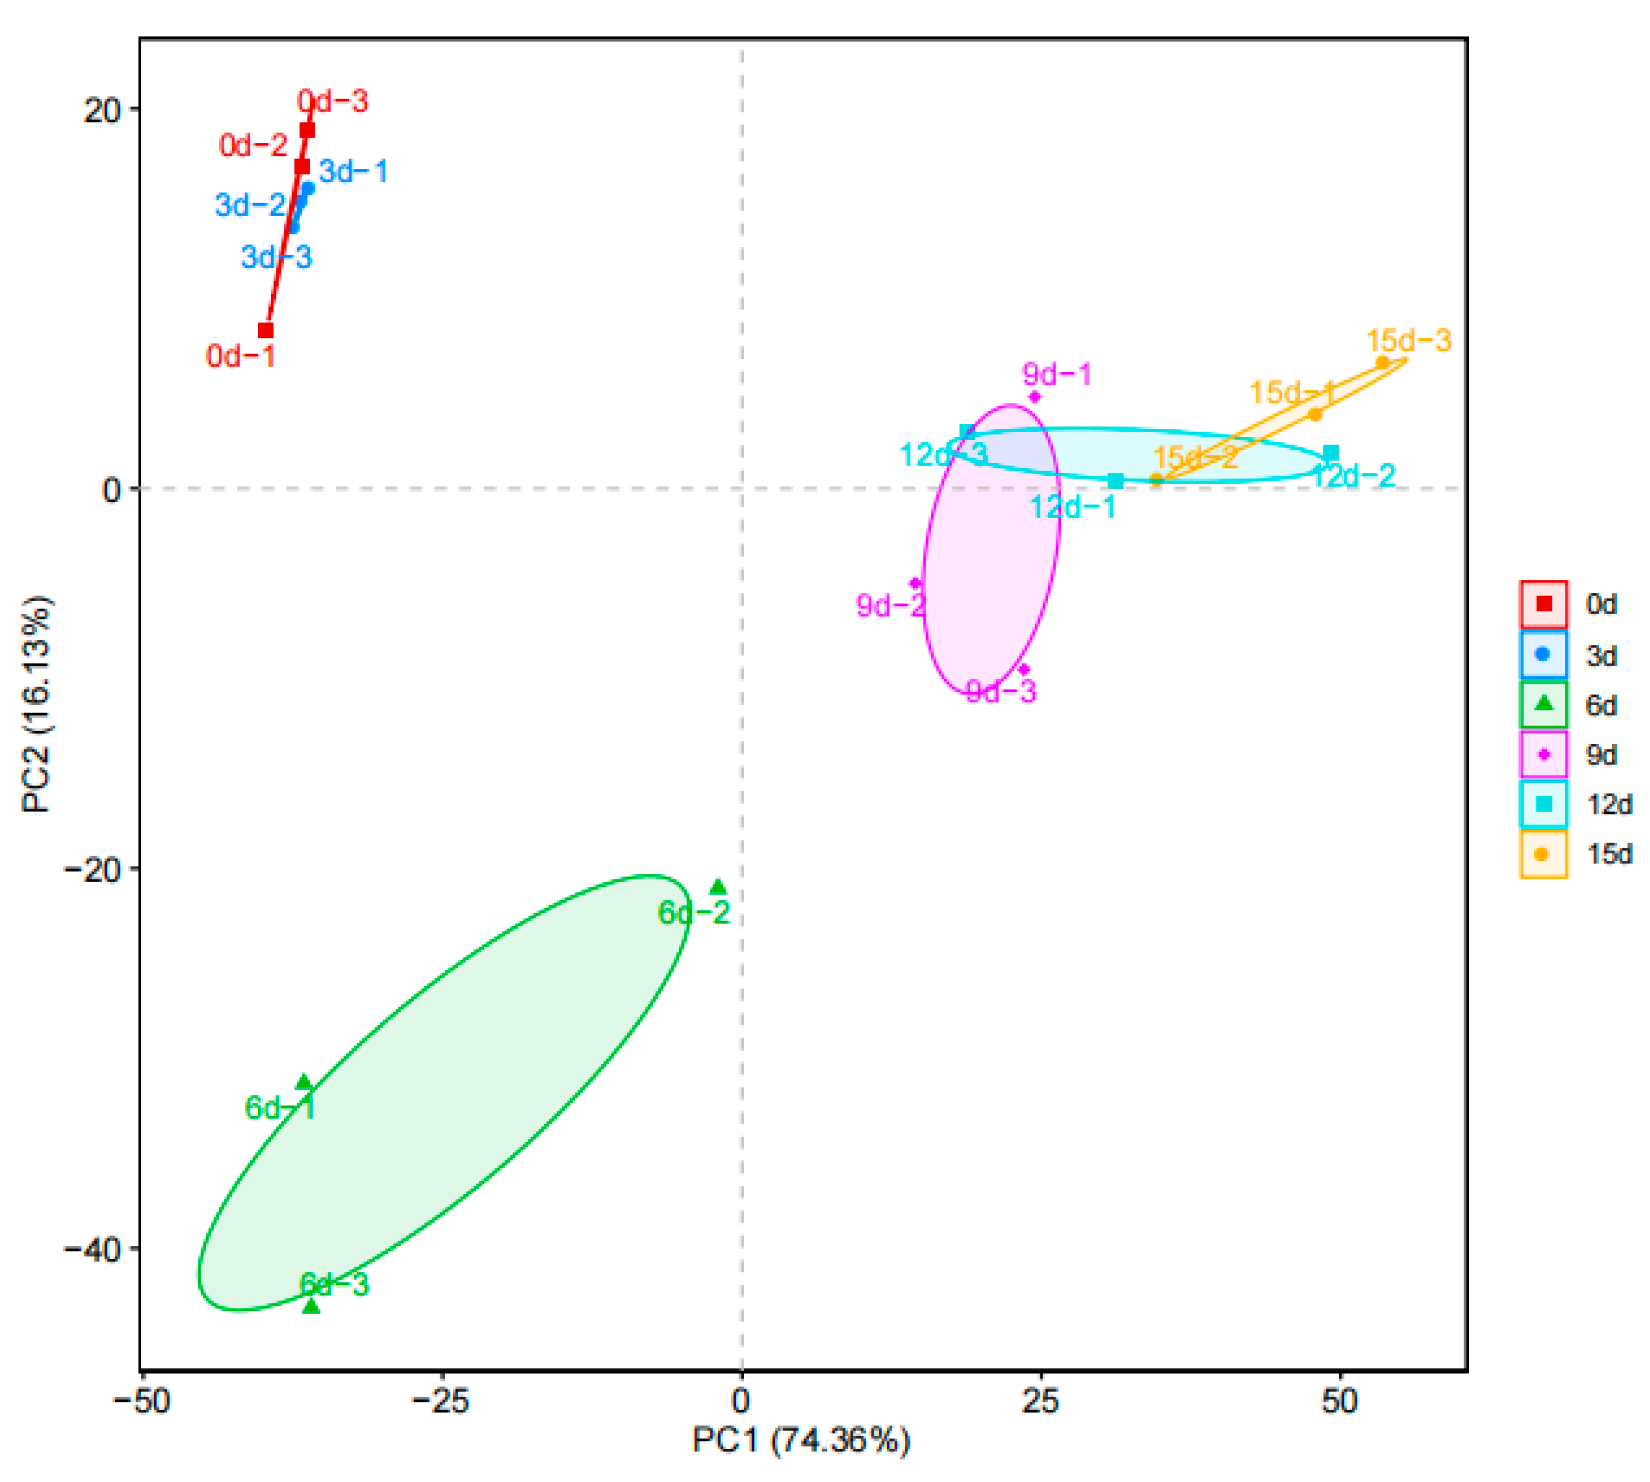
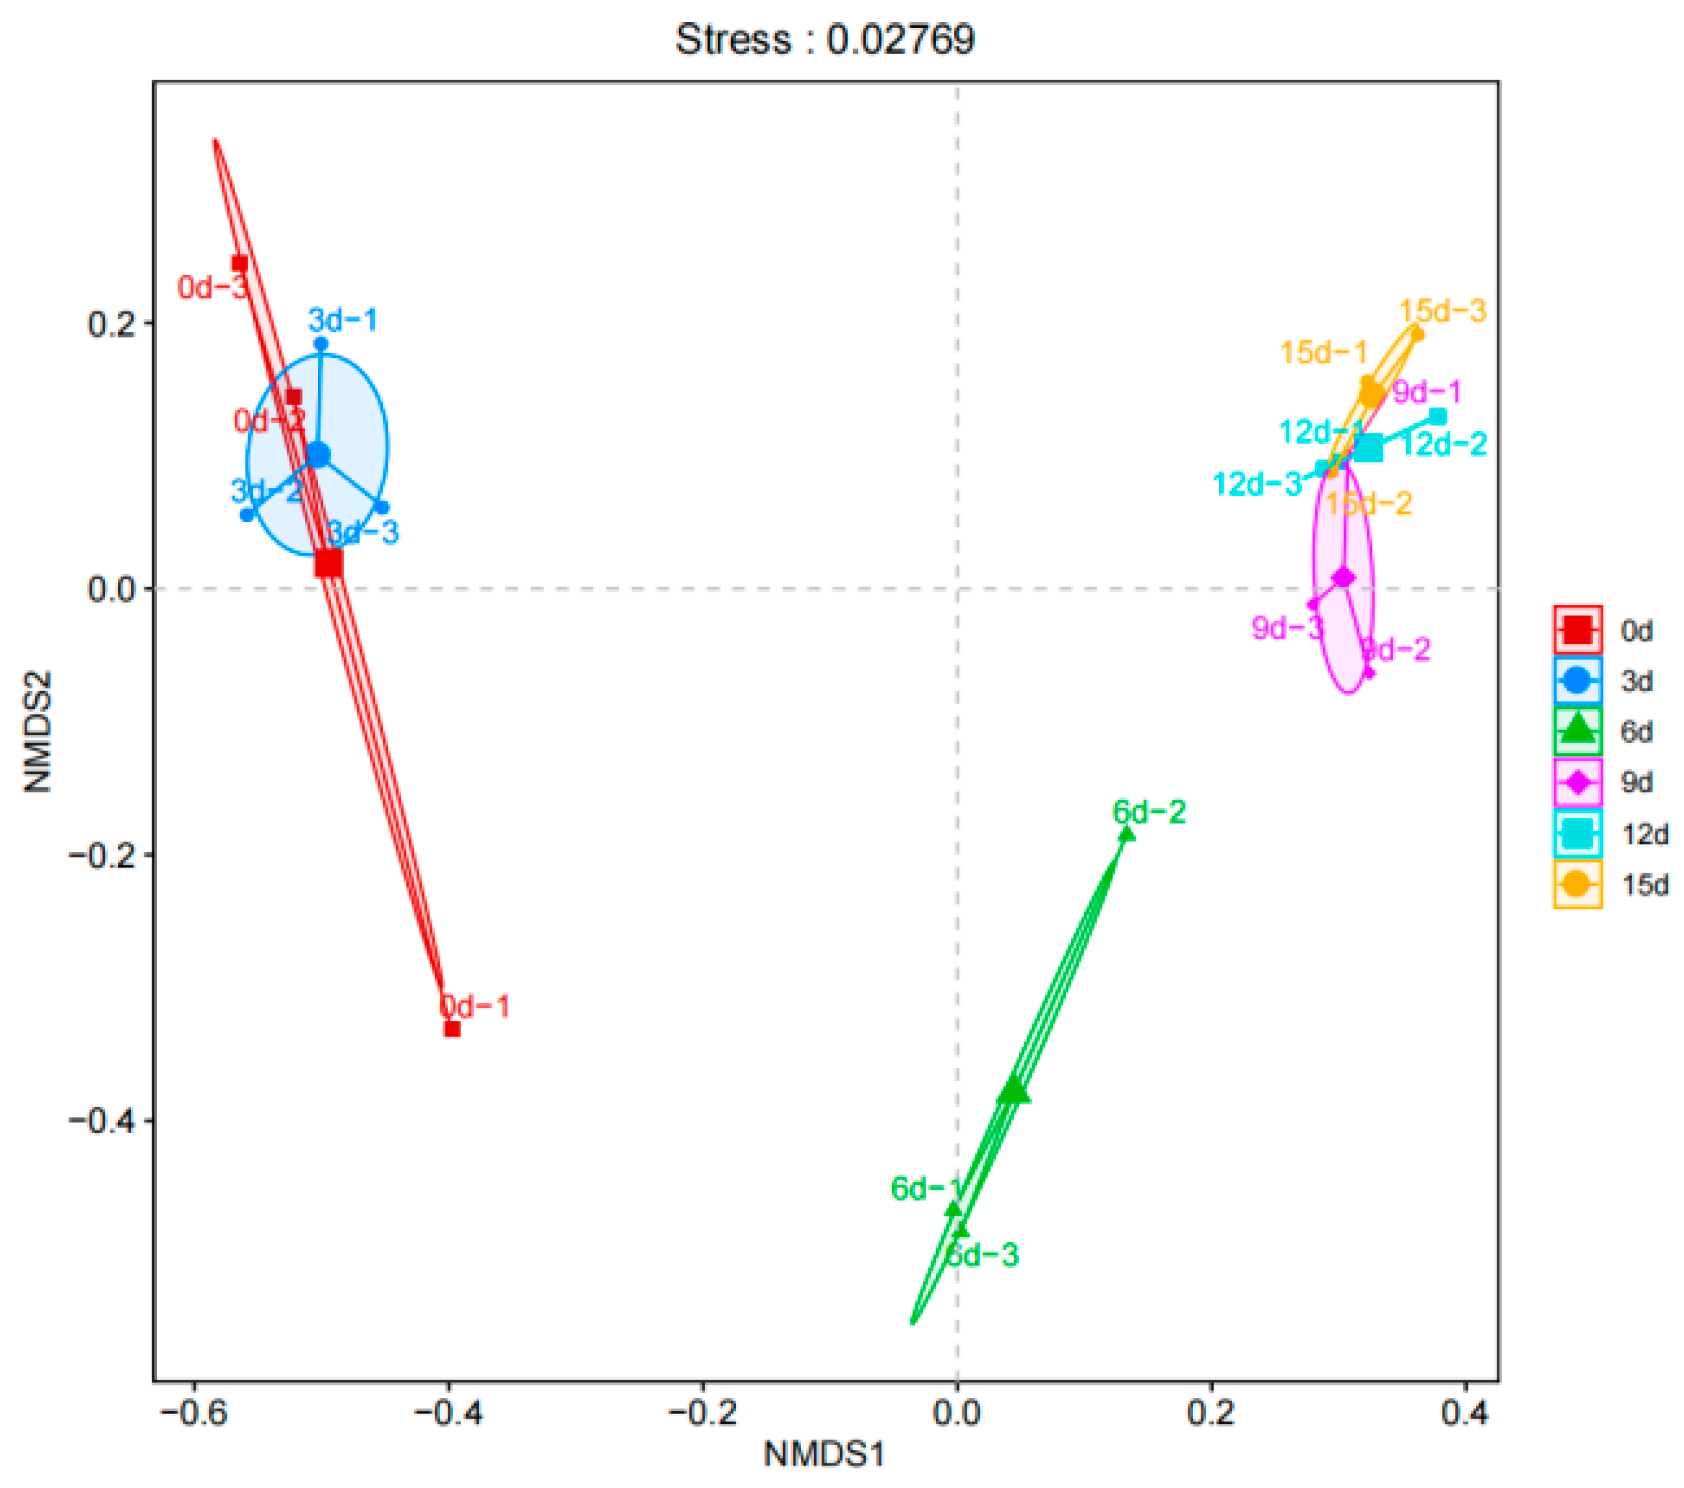
3.6. β-Diversity Analysis
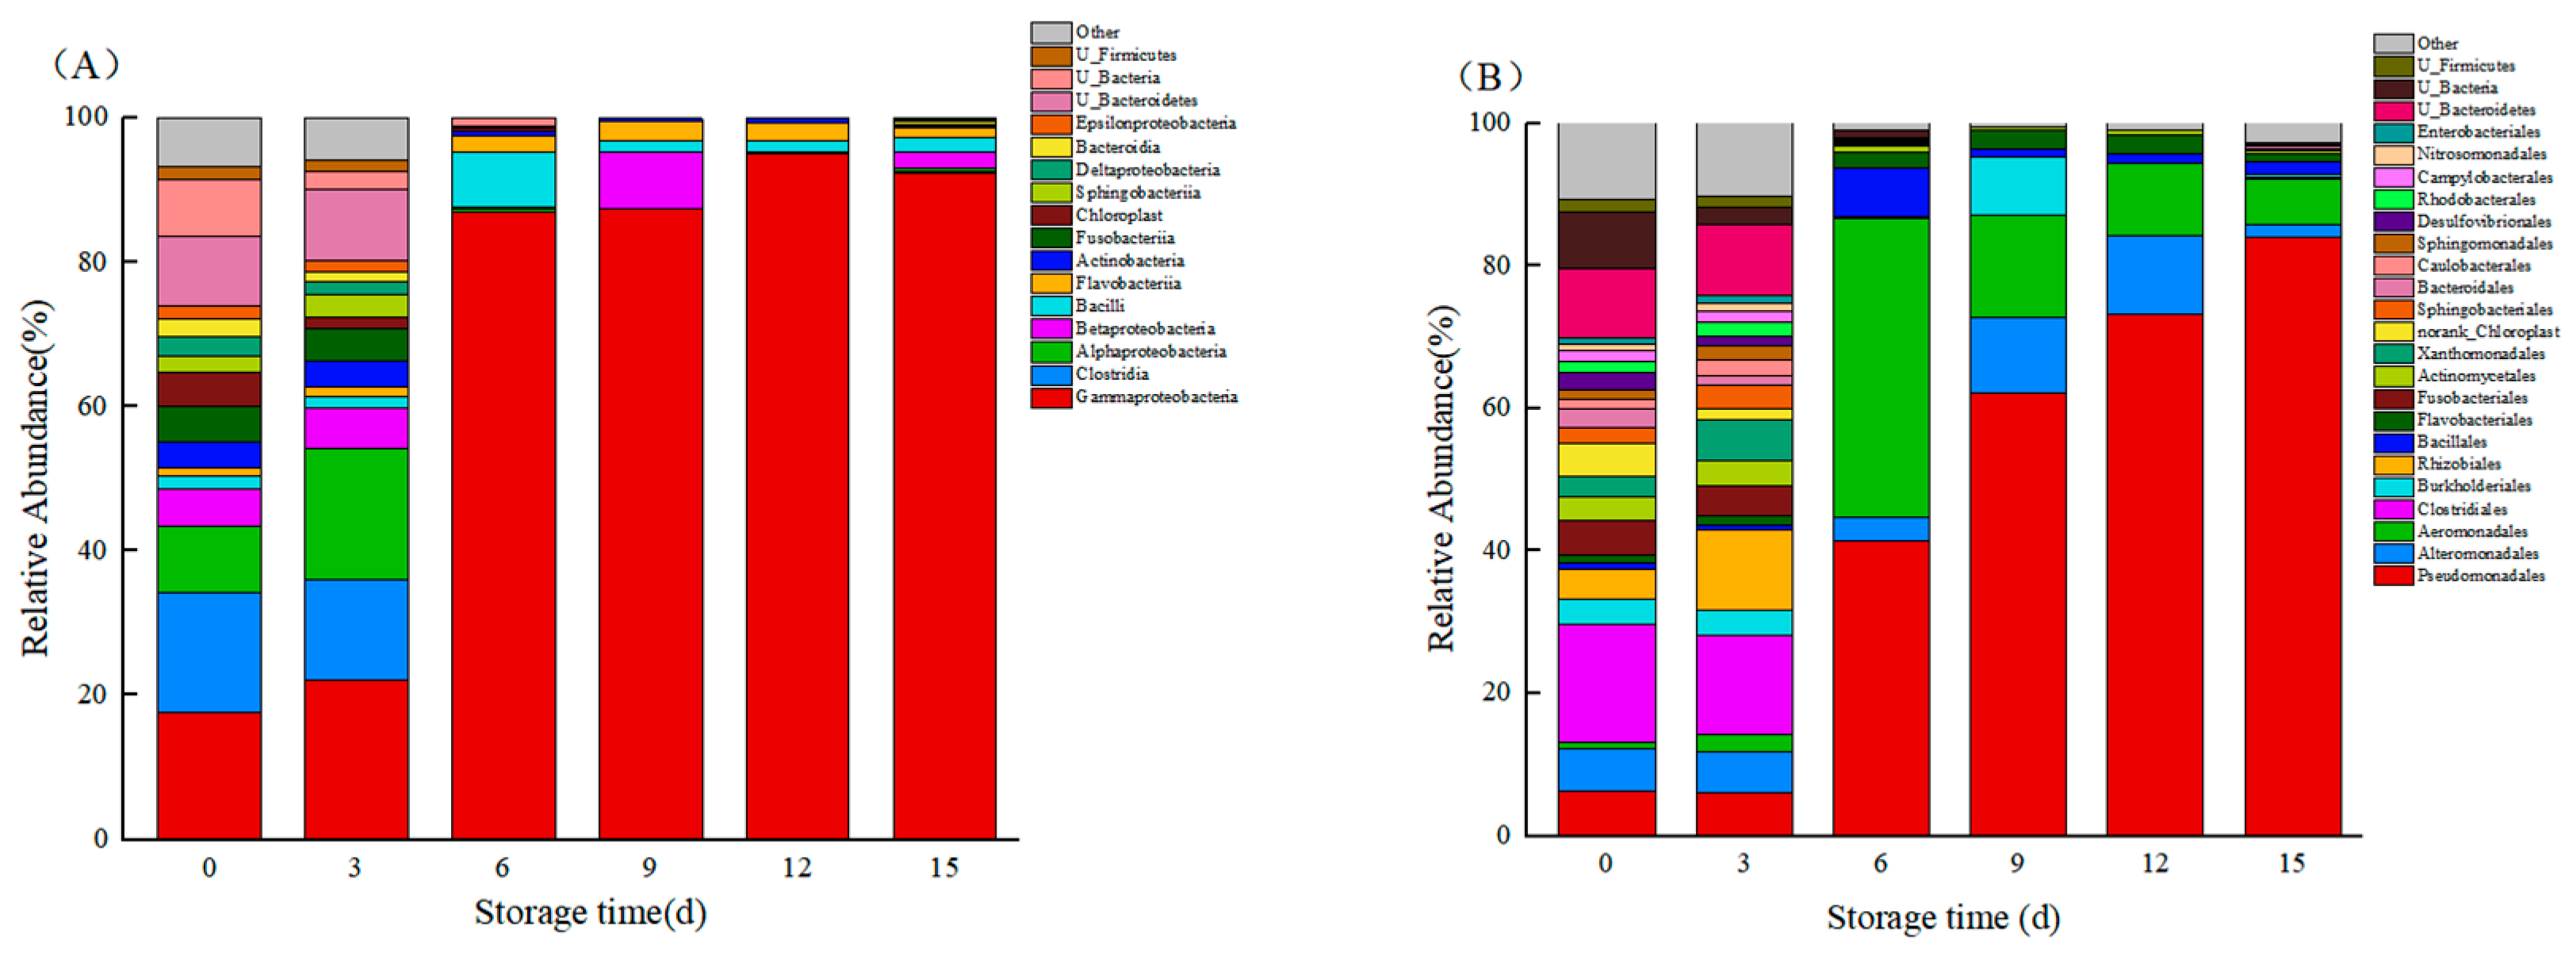
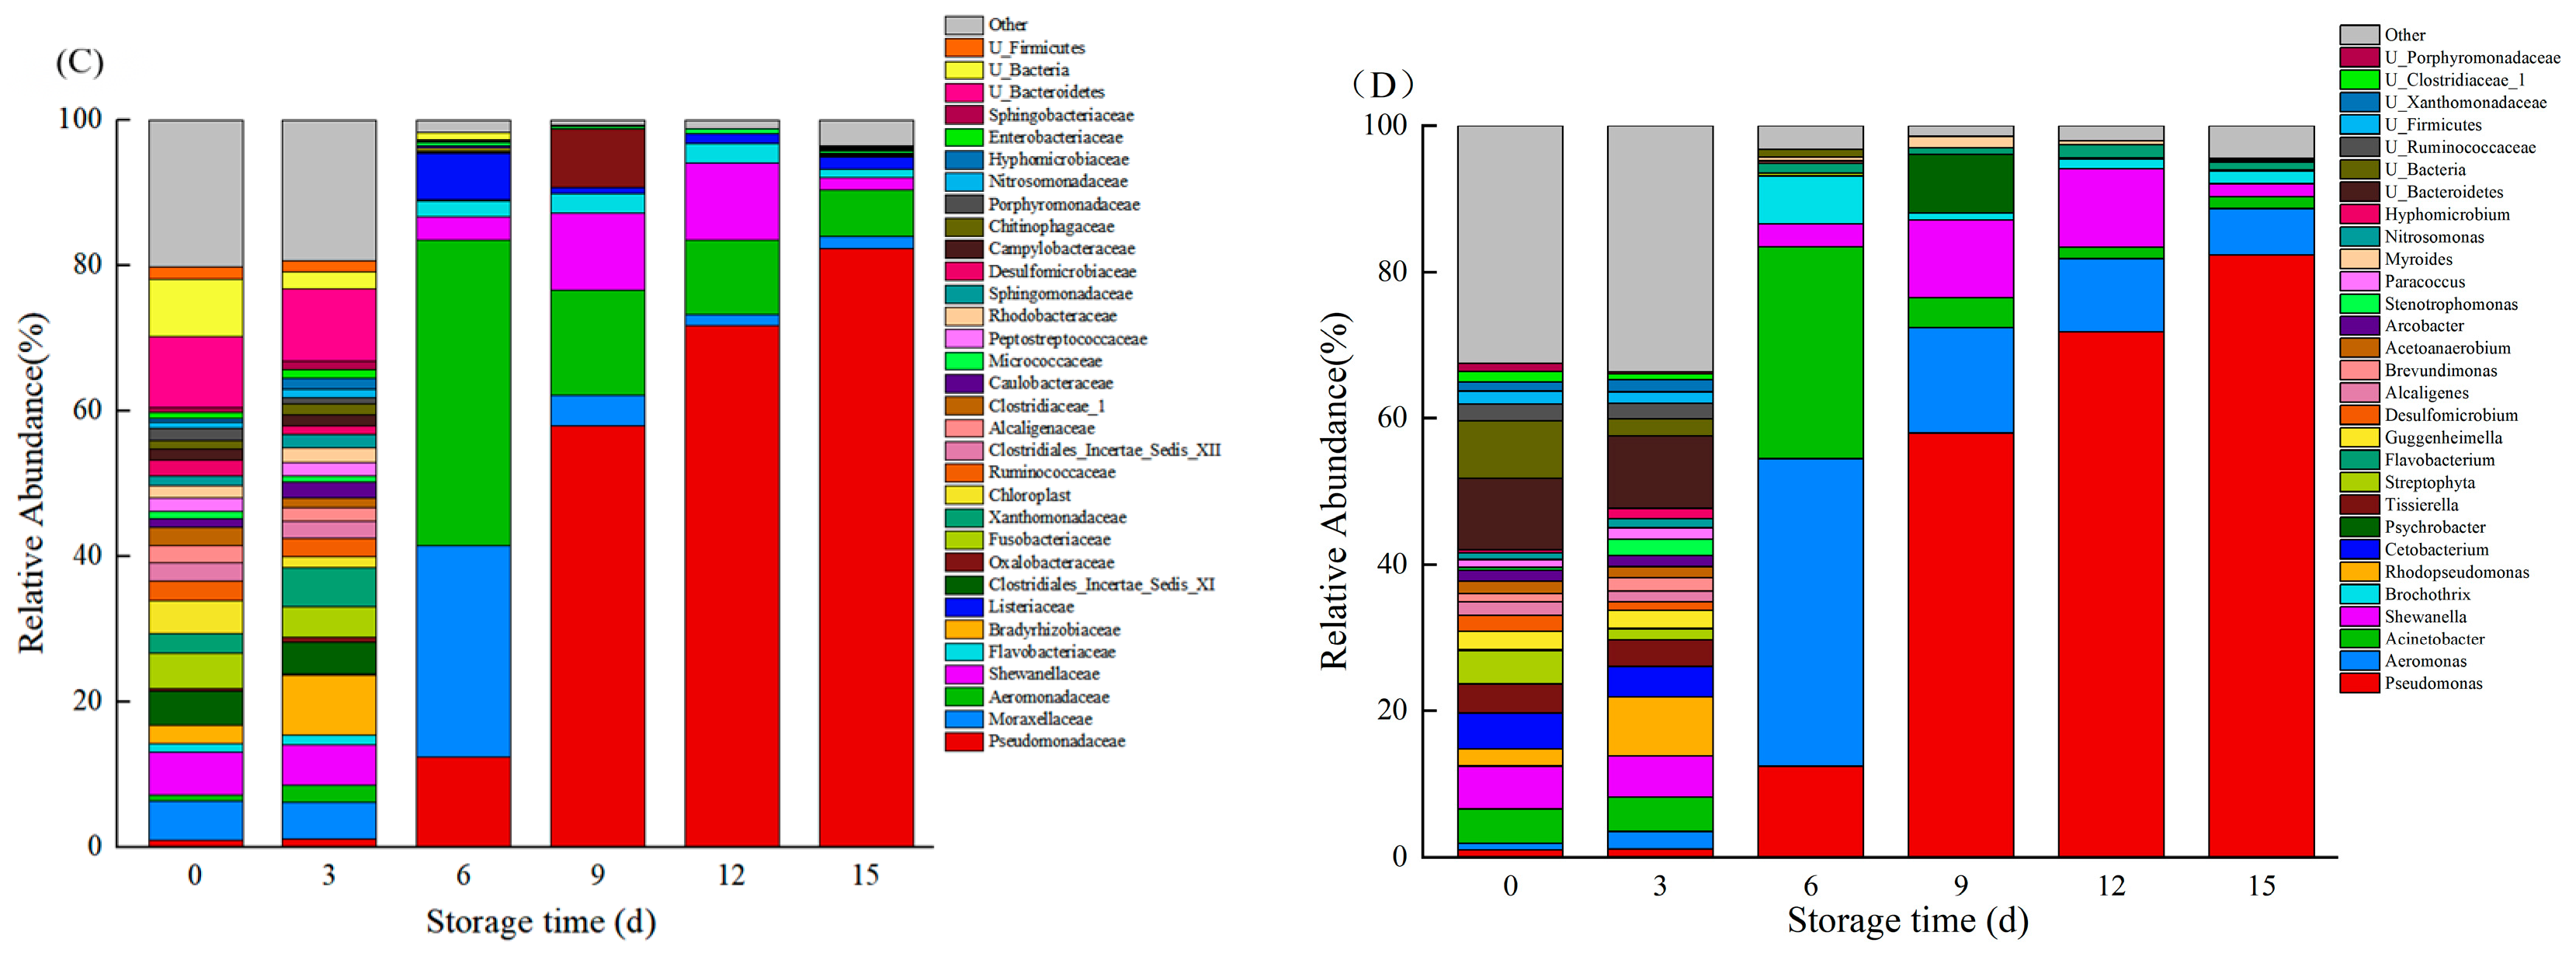
3.7. Species Composition
3.8. Relative Abundance of Bacteria
3.9. Species Identification
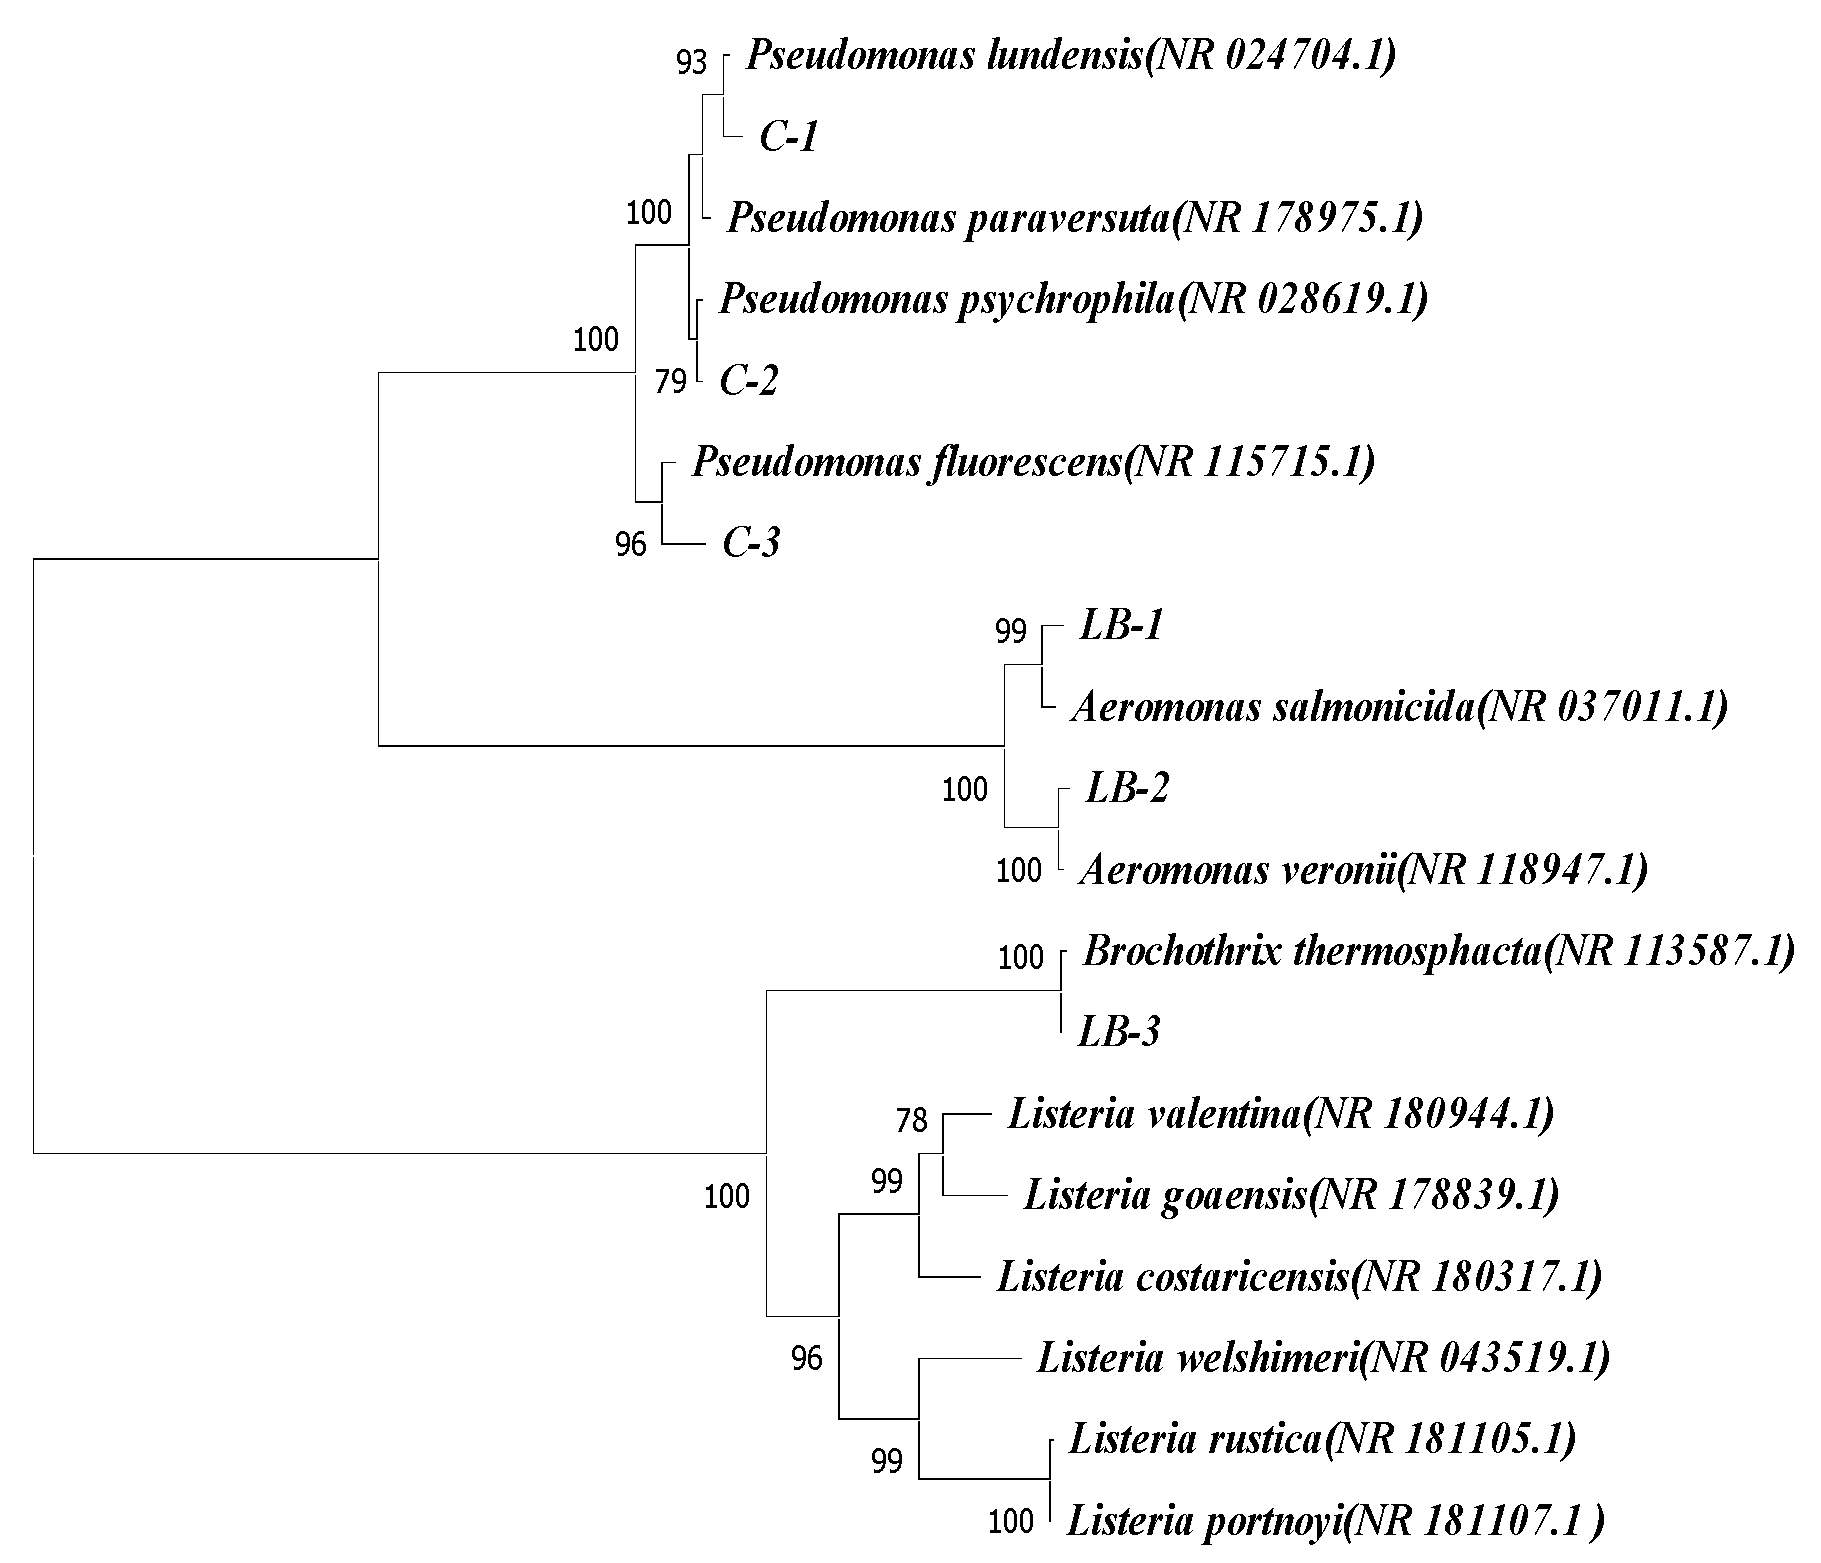
3.9.1. PCR Amplification and Species Identification Results
3.9.2. Quantitative Analysis of Corruption-Causing Capacity
4. Conclusions
Author Contributions
Funding
Data Availability Statement
Acknowledgments
Conflicts of Interest
References
- Mao, J.; Fu, J.; Zhu, Z.; Jin, D.; Shen, S.; Yuan, Y.; Chen, Y. Impact of KCl and ultrasound on the structural properties of myofibrillar proteins in low sodium semi-dried large yellow croaker (Pseudosciaena crocea). LWT-Food Sci. Technol. 2023, 178, 114604. [Google Scholar] [CrossRef]
- Perez-Won, M.; Lemus-Mondaca, R.; Herrera-Lavados, C.; Reyes, J.E.; Roco, T.; Palma-Acevedo, A.; Tabilo-Munizaga, G.; Aubourg, S.P. Combined Treatments of High Hydrostatic Pressure and CO2 in Coho Salmon (Oncorhynchus kisutch): Effects on Enzyme Inactivation, Physicochemical Properties, and Microbial Shelf Life. Foods 2020, 9, 273. [Google Scholar] [CrossRef]
- Skirnisdottir, S.; Knobloch, S.; Lauzon, H.L.; Olafsdottir, A.; Steinthorsson, P.; Bergsten, P.; Marteinsson, V.U. Impact of onboard chitosan treatment of whole cod (Gadus morhua) on the shelf life and spoilage bacteria of loins stored superchilled under different atmospheres. Food Microbiol. 2021, 97, 103723. [Google Scholar] [CrossRef] [PubMed]
- Zhuang, S.; Tian, L.; Liu, Y.; Wang, L.; Hong, H.; Luo, Y. Amino acid degradation and related quality changes caused by common spoilage bacteria in chill-stored grass carp (Ctenopharyngodon idella). Food Chem. 2023, 399, 133989. [Google Scholar] [CrossRef]
- Choi, J.; Osatuke, A.C.; Erich, G.; Stevens, K.; Hwang, M.S.; Al Rwahnih, M.; Fuchs, M. High-Throughput Sequencing Reveals Tobacco and Tomato Ringspot Viruses in Pawpaw. Plants 2022, 11, 3565. [Google Scholar] [CrossRef]
- Hong, Y.W.; Ban, G.-H.; Bae, D.; Kim, S.A. Microbial investigation of aquacultured olive flounder (Paralichthys olivaceus) from farm to table based on high-throughput sequencing. Int. J. Food Microbiol. 2023, 389, 110111. [Google Scholar] [CrossRef]
- Si, Y.; Wen, J.; Xu, Y.; Roengjit, P.; Wang, H. Rapid pathogen discovery in diseased turbot (Scophthalmus maximus) using 16S rRNA high throughput sequencing. Aquac. Rep. 2021, 21, 100835. [Google Scholar] [CrossRef]
- Zhao, D.; Hu, J.; Chen, W. Analysis of the relationship between microorganisms and flavour development in dry-cured grass carp by high-throughput sequencing, volatile flavour analysis and metabolomics. Food Chem. 2022, 368, 130889. [Google Scholar] [CrossRef]
- El-Liethy, M.A.; Hemdan, B.A.; El-Taweel, G.E. New insights for tracking bacterial community structures in industrial wastewater from textile factories to surface water using phenotypic, 16S rRNA isolates identifications and high-throughput sequencing. Acta Trop. 2023, 238, 106806. [Google Scholar] [CrossRef]
- Song, M.; Wang, J.; Wang, Y.; Hu, R.; Wang, L.; Guo, Z.; Jiang, Z.; Liang, Z. Response mechanism of meiofaunal communities to multi-type of artificial reef habitats from the perspective of high-throughput sequencing technology. Sci. Total Environ. 2023, 863, 160927. [Google Scholar] [CrossRef]
- Song, F.; Owczarek-Lipska, M.; Ahmels, T.; Book, M.; Aisenbrey, S.; Menghini, M.; Barthelmes, D.; Schrader, S.; Spital, G.; Neidhardt, J. High-Throughput Sequencing to Identify Mutations Associated with Retinal Dystrophies. Genes 2021, 12, 1269. [Google Scholar] [CrossRef]
- Ye, M.; Li, X.; Chen, L.; Mo, S.; Liu, J.; Huang, T.; Luo, F.; Zhang, J. A High-Throughput Sequencing Data-Based Classifier Reveals the Metabolic Heterogeneity of Hepatocellular Carcinoma. Cancers 2023, 15, 592. [Google Scholar] [CrossRef]
- Liu, X.; Li, D.; Li, K.; Luo, Y. Monitoring bacterial communities in ε-Polylysine-treated bighead carp (Aristichthys nobilis) fillets using culture-dependent and culture-independent techniques. Food Microbiol. 2018, 76, 257–266. [Google Scholar] [CrossRef] [PubMed]
- White, R.A., III; Callister, S.J.; Moore, R.J.; Baker, E.S.; Jansson, J.K. The past, present and future of microbiome analyses. Nat. Protoc. 2016, 11, 4–8. [Google Scholar] [CrossRef]
- Syropoulou, F.; Anagnostopoulos, D.A.; Parlapani, F.F.; Karamani, E.; Stamatiou, A.; Tzokas, K.; Nychas, G.-J.E.; Boziaris, I.S. Microbiota Succession of Whole and Filleted European Sea Bass (Dicentrarchus labrax) during Storage under Aerobic and MAP Conditions via 16S rRNA Gene High-Throughput Sequencing Approach. Microorganisms 2022, 10, 1870. [Google Scholar] [CrossRef]
- Sun, X.; Qi, X.; Han, Y.; Guo, Z.; Cui, C.; Lin, C. Characteristics of changes in volatile organic compounds and microbial communities during the storage of pickles. Food Chem. 2023, 409, 135285. [Google Scholar] [CrossRef]
- GB 4789.2-2022; China National Standard: Food Microbiological Examination. Standards Press of China: Beijing, China, 2022.
- GB 5009.228-2016; China National Standard: Determination of Volatile Base Nitrogen in Food. Standards Press of China: Beijing, China, 2016.
- Lan, W.; Chen, X.; Zhao, Y.; Xie, J. The effects of ozonated slurry ice treatment on microbial, physicochemical, and quality of large yellow croaker (Pseudosciaena crocea) during cold-chain circulation. Food Control 2023, 145, 109511. [Google Scholar] [CrossRef]
- Zhang, H.; Shu, M.; Yang, W.; Pan, H.; Tang, M.; Zhao, Y.; Zhong, C.; Wu, G. Isolation and characterization of a novel Salmonella bacteriophage JNwz02 capable of lysing Escherichia coli O157:H7 and its antibacterial application in foods. LWT-Food Sci. Technol. 2023, 173, 114251. [Google Scholar] [CrossRef]
- Chen, J.; Yang, R.; Wang, Y.; Koseki, S.; Fu, L.; Wang, Y. Inhibitory effect of D-Tryptophan on the spoilage potential of Shewanella baltica and Pseudomonas fluorescens and its potential application in salmon fillet preservation. Food Microbiol. 2022, 108, 104104. [Google Scholar] [CrossRef]
- ICMSF. Microorganisms in Foods 2. Sampling for Microbiological Analysis: Principles and Specific Applications; University of Toronto Press: Toronto, ON, Canada, 1986. [Google Scholar]
- Zhang, J.; Fei, L.; Cui, P.; Walayat, N.; Ji, S.; Chen, Y.; Lyu, F.; Ding, Y. Effect of low voltage electrostatic field combined with partial freezing on the quality and microbial community of large yellow croaker. Food Res. Int. 2023, 169, 112933. [Google Scholar] [CrossRef]
- Dong, Q.; Yang, L.; Xiang, L.; Zhao, Y.; Li, L. Development of electrospun fish gelatin film containing lauroyl arginate ethyl and its application in large yellow croaker (Pseudosciaena crocea) preservation. Food Control 2023, 153, 109959. [Google Scholar] [CrossRef]
- Bekhit, A.E.-D.A.; Holman, B.W.B.; Giteru, S.G.; Hopkins, D.L. Total volatile basic nitrogen (TVB-N) and its role in meat spoilage: A review. Trends Food Sci. Technol. 2021, 109, 280–302. [Google Scholar] [CrossRef]
- SC/T 3101-2010; China Fisheries Industry Standard: Fresh Large Yellow Croaker, Frozen Large Yellow Croaker, Fresh Small Yellow Croaker, and Frozen Small Yellow Croaker. China Agricultural Press: Beijing, China, 2010.
- Mansur, A.R.; Song, E.-J.; Cho, Y.-S.; Nam, Y.-D.; Choi, Y.-S.; Kim, D.-O.; Seo, D.-H.; Nam, T.G. Comparative evaluation of spoilage-related bacterial diversity and metabolite profiles in chilled beef stored under air and vacuum packaging. Food Microbiol. 2019, 77, 166–172. [Google Scholar] [CrossRef] [PubMed]
- Chen, X.; Zhu, L.; Liang, R.; Mao, Y.; Hopkins, D.L.; Li, K.; Dong, P.; Yang, X.; Niu, L.; Zhang, Y.; et al. Shelf-life and bacterial community dynamics of vacuum packaged beef during long-term super-chilled storage sourced from two Chinese abattoirs. Food Res. Int. 2020, 130, 108937. [Google Scholar] [CrossRef] [PubMed]
- Draszanowska, A.; Karpinska-Tymoszczyk, M.; Simoes, M.; Olszewska, M.A. The Effect of Turmeric Rhizome on the Inhibition of Lipid Oxidation and the Quality of Vacuum-Packed Pork Meatloaf. Appl. Sci. 2022, 12, 10641. [Google Scholar] [CrossRef]
- Hui, X.; Wan, Y.; Dong, H.; Peng, J.; Wu, W.; Yang, X.; He, Q. A promising insight into the inhibition of lipid oxidation, protein degradation and biogenic amine accumulation in postmortem fish: Functional glazing layers of modified bio-polymer. LWT-Food Sci. Technol. 2023, 177, 114575. [Google Scholar] [CrossRef]
- Chai, T.; Huang, Y.; Ren, S.; Jin, D.; Fu, J.; Guo, J.; Chen, Y. Inhibitory effects of ultrasonic and rosmarinic acid on lipid oxidation and lipoxygenase in large yellow croaker during cold storage. Ultrason. Sonochem. 2023, 92, 106229. [Google Scholar] [CrossRef]
- Situ, H.; Li, Y.; Gao, J.; Zhang, C.; Qin, X.; Cao, W.; Lin, H.; Zheng, H. Effects of temperature fluctuations during simulated cold chain transportation on the quality and microbial diversity of cultured golden pompano. J. Food Sci. Technol. 2022, 40, 148–159. [Google Scholar] [CrossRef]
- Tan, C.; Xiao, M.; Wu, R.; Li, P.; Shang, N. Unraveling the Effects of Biochemical Drivers on the Bacterial Communities and Volatile Profiles in Refrigerated Sturgeon Filets at 4 °C. Front. Microbiol. 2022, 13, 849236. [Google Scholar] [CrossRef]
- Li, Y.; Zhao, N.; Li, Y.; Zhang, D.; Sun, T.; Li, J. Dynamics and diversity of microbial community in salmon slices during refrigerated storage and identification of biogenic amine-producing bacteria. Food Biosci. 2023, 52, 102441. [Google Scholar] [CrossRef]
- Zhang, J.; Li, Y.; Yang, X.; Liu, X.; Hong, H.; Luo, Y. Effects of oregano essential oil and nisin on the shelf life of modified atmosphere packed grass carp (Ctenopharyngodon idellus). LWT-Food Sci. Technol. 2021, 147, 111609. [Google Scholar] [CrossRef]
- Fang, J.; Feng, L.; Lu, H.; Zhu, J. Metabolomics reveals spoilage characteristics and interaction of Pseudomonas lundensis and Brochothrix thermosphacta in refrigerated beef. Food Res. Int. 2022, 156, 111139. [Google Scholar] [CrossRef] [PubMed]
- Quintieri, L.; Caputo, L.; Brasca, M.; Fanelli, F. Recent Advances in the Mechanisms and Regulation of QS in Dairy Spoilage by Pseudomonas spp. Foods 2021, 10, 3088. [Google Scholar] [CrossRef]
- Yan, Y.; Liu, L.; Zhu, J.; Lu, H.; Li, J. Study on biofilm formation and spoilage phenotype of Photobacterium phosphoreum from fish. Chin. J. Food Sci. 2019, 19, 202–209. [Google Scholar] [CrossRef]
- Guo, Q.; Xiu, Y.; Wang, L.; Jiang, C.; Wang, L. Analysis of carbon source utilization and growth kinetics of Pseudomonas fluorescens from fish. Trans. Chin. Soc. Agric. Mach. 2017, 48, 319–327. [Google Scholar] [CrossRef]
- Bassey, A.P.; Liu, P.P.; Chen, J.; Bako, H.K.; Boateng, E.F.; Ibeogu, H.I.; Ye, K.; Li, C.; Zhou, G. Antibacterial efficacy of phenyllactic acid against Pseudomonas lundensis and Brochothrix thermosphacta and its synergistic application on modified atmosphere/air-packaged fresh pork loins. Food Chem. 2023, 430, 137002. [Google Scholar] [CrossRef]
- Hao, Y.Y.; Brackett, R.E.; Doyle, M.P. Inhibition of Listeria monocytogenes and Aeromonas hydrophila by plant extracts in refrigerated cooked beef. J. Food Prot. 1998, 61, 307–312. [Google Scholar] [CrossRef]
- Lee, H.-J.; Tokle, I.F.; Lunestad, B.-T.; Lerfall, J.; Hoel, S.; Jakobsen, A.N. The effect of food processing factors on the growth kinetics of Aeromonas strains isolated from ready-to-eat seafood. Int. J. Food Microbiol. 2023, 384, 109985. [Google Scholar] [CrossRef]
- Li, X.; Yang, X.; Guo, Q.; Xu, Z. Preliminary analysis of spoilage bacteria ability of large yellow croaker. Sci. Technol. Food Ind. 2009, 30, 316–319. [Google Scholar]
- Zhu, Y.; Guo, Q.; Jiang, C.; Li, B. Differential analysis of carbon source utilization by dominant spoilage bacteria in fresh large yellow croaker. Food Sci. 2018, 39, 176–185. [Google Scholar] [CrossRef]
- Don, S.; Xavier, K.A.M.; Devi, S.T.; Nayak, B.B.; Kannuchamy, N. Identification of potential spoilage bacteria in farmed shrimp (Litopenaeus vannamei): Application of Relative Rate of Spoilage models in shelf life-prediction. LWT-Food Sci. Technol. 2018, 97, 295–301. [Google Scholar] [CrossRef]
- Jaaskelainen, E.; Jakobsen, L.M.A.; Hultman, J.; Eggers, N.; Bertram, H.C.; Bjorkroth, J. Metabolomics and bacterial diversity of packaged yellowfin tuna (Thunnus albacares) and salmon (Salmo salar) show fish species-specific spoilage development during chilled storage. Int. J. Food Microbiol. 2019, 293, 44–52. [Google Scholar] [CrossRef] [PubMed]
- Cao, J.; Wang, Q.; Ma, T.; Bao, K.; Yu, X.; Duan, Z.; Shen, X.; Li, C. Effect of EGCG-gelatin biofilm on the quality and microbial composition of tilapia fillets during chilled storage. Food Chem. 2020, 305, 125454. [Google Scholar] [CrossRef] [PubMed]
- Huang, Z.; Liu, X.; Jia, S.; Zhang, L.; Luo, Y. The effect of essential oils on microbial composition and quality of grass carp (Ctenopharyngodon idellus) fillets during chilled storage. Int. J. Food Microbiol. 2018, 266, 52–59. [Google Scholar] [CrossRef] [PubMed]
- Jia, S.; Huang, Z.; Lei, Y.; Zhang, L.; Li, Y.; Luo, Y. Application of Illumina-MiSeq high throughput sequencing and culture-dependent techniques for the identification of microbiota of silver carp (Hypophthalmichthys molitrix) treated by tea polyphenols. Food Microbiol. 2018, 76, 52–61. [Google Scholar] [CrossRef]
- Calliauw, F.; De Mulder, T.; Broekaert, K.; Vlaemynck, G.; Michiels, C.; Heyndrickx, M. Assessment throughout a whole fishing year of the dominant microbiota of peeled brown shrimp (Crangon crangon) stored for 7 days under modified atmosphere packaging at 4 degrees C without preservatives. Food Microbiol. 2016, 54, 60–71. [Google Scholar] [CrossRef]
- Parlapani, F.F.; Michailidou, S.; Pasentsis, K.; Argiriou, A.; Krey, G.; Boziaris, I.S. A meta-barcoding approach to assess and compare the storage temperature dependent bacterial diversity of gilt-head sea bream (Sparus aurata) originating from fish farms from two geographically distinct areas of Greece. Int. J. Food Microbiol. 2018, 278, 36–43. [Google Scholar] [CrossRef]
- Zhuang, S.; Hong, H.; Zhang, L.; Luo, Y. Spoilage-related microbiota in fish and crustaceans during storage: Research progress and future trends. Compr. Rev. Food Sci. Food Saf. 2021, 20, 252–288. [Google Scholar] [CrossRef]
- Duman, M.; Mulet, M.; Altun, S.; Saticioglu, I.B.; Ozdemir, B.; Ajmi, N.; Lalucat, J.; Garcia-Valdes, E. The diversity of Pseudomonas species isolated from fish farms in Turkey. Aquaculture 2021, 535, 736369. [Google Scholar] [CrossRef]
- Oladosu-Ajayi, R.; George, F.; Obasa, S.; Bankole, M. Effects of some plant extracts on some biological parameters of catfish Clarias gariepinus (Burchell 1822). In Proceedings of the 25th Annual Conference of the Fisheries Society of Nigeria (FISON), Lagos, Nigeria, 25–29 October 2010. [Google Scholar]
- He, R.; Chen, H.; Chen, W.; Zhang, M.; Pei, J.; Chen, W.; Zhong, Q. Respiratory depression driven by membrane damage as a mechanism for linalool to inhibit Pseudomonas lundensis and its preservation potential for beef. J. Appl. Microbiol. 2023, 134, lxad023. [Google Scholar] [CrossRef]
- Ravi, K.; Erb-Downward, J.R.; Gammon, N.K.; Falkowski, N.R.; Huffnagle, G.B. Complete Genome Sequences of Pseudomonas lundensis Strains M101 and M105, Isolated from 1% Pasteurized Milk. Microbiol. Resour. Announc. 2021, 10, e0071121. [Google Scholar] [CrossRef]
- Cui, F.; Li, T.; Liu, M.; Ma, Y.; Li, J. Study on quorum sensing phenomenon and spoilage characteristics of Photobacterium phosphoreum in flounder under different carbon sources. Mod. Food Sci. Technol. 2015, 31, 49–55. [Google Scholar] [CrossRef]
- Qian, X.; Luo, Y.; Zhang, Y.; Li, X.; Lu, Z.; Liu, M.; Liang, D. Antibacterial activity and mechanism of acetaldehyde against Photobacterium phosphoreum. Mod. Food Sci. Technol. 2022, 38, 104–111+125. [Google Scholar] [CrossRef]
- Jia, S.; Hong, H.; Yang, Q.; Liu, X.; Zhuang, S.; Li, Y.; Liu, J.; Luo, Y. TMT-based proteomic analysis of the fish-borne spoiler Pseudomonas psychrophila subjected to chitosan oligosaccharides in fish juice system. Food Microbiol. 2020, 90, 103494. [Google Scholar] [CrossRef]
- Yuan, L.; Sadiq, F.A.; Liu, T.; Flint, S.; Chen, J.; Yang, H.; Gu, J.; Zhang, G.; He, G. Psychrotrophic bacterial populations in Chinese raw dairy milk. LWT-Food Sci. Technol. 2017, 84, 409–418. [Google Scholar] [CrossRef]
- Feng, H.; Lan, W.; Zang, Y.; Tang, S.; Liu, D.; Xu, X.; Zhou, D.; Xie, J. nfluence of dominant spoilage bacteria on quality changes and spoilage ability during refrigerated storage of Takifugu flavidus. Food Sci. 2022, 43, 1191–1197. [Google Scholar] [CrossRef]


| Sample | Number of Effective Sequences (Pieces) | Base Number | Average Length (bp) | Minimum Sequence Length (bp) | Maximum Sequence Length (bp) |
|---|---|---|---|---|---|
| 0d | 65,028 | 26,949,661 | 413.22 | 350 | 476 |
| 3d | 66,689 | 27,712,508 | 415.40 | 350 | 474 |
| 6d | 62,350 | 26,678,327 | 427.74 | 350 | 476 |
| 9d | 87,343 | 37,428,755 | 428.53 | 350 | 473 |
| 12d | 79,654 | 34,139,914 | 428.60 | 350 | 475 |
| 15d | 49,190 | 21,063,294 | 428.21 | 351 | 470 |
| Number | OTUs | Chao | Ace | Shannon | Simpson | Shannoneven | Coverage | |
|---|---|---|---|---|---|---|---|---|
| 0d | 38,585 | 719 | 732.444 a | 728.687 a | 4.717 a | 0.031 d | 0.739 | 0.99924 |
| 3d | 41,710 | 717 | 722.957 a | 720.287 a | 4.783 a | 0.030 d | 0.728 | 0.99955 |
| 6d | 50,503 | 172 | 179.692 b | 179.430 b | 2.357 b | 0.168 c | 0.458 | 0.99966 |
| 9d | 63,184 | 71 | 84.547 b | 105.013 b | 2.010 bc | 0.212 bc | 0.471 | 0.99972 |
| 12d | 54,360 | 69 | 108.942 b | 128.171 b | 1.781 c | 0.283 ab | 0.423 | 0.99962 |
| 15d | 35,676 | 225 | 294.371 b | 287.186 b | 1.670 c | 0.334 a | 0.308 | 0.99815 |
| Putrefying Bacteria | TVC/CFU | TVB-N (mg/100 g) | γTVB-N/TVC (10−2 mg TVB-N/CFU) | ||
|---|---|---|---|---|---|
| Initial Stage/104 | Last Stage/108 | Initial Stage | Last Stage | ||
| Pseudomonas psychrophila | 5.99 ± 0.37 | 13.90 ± 0.43 | 10.03 ± 0.19 | 20.77 ± 0.83 | 7.75 × 10⁻⁹ ± 0.71 |
| Pseudomonas lundensis | 6.85 ± 0.63 | 9.47 ± 0.63 | 9.45 ± 0.34 | 17.03 ± 0.19 | 8.08 × 10⁻⁹ ± 0.43 |
| Pseudomonas flurescens | 4.23 ± 0.34 | 10.12 ± 0.20 | 8.95 ± 0.34 | 17.73 ± 0.19 | 8.71 × 10⁻⁹ ± 0.78 |
Disclaimer/Publisher’s Note: The statements, opinions and data contained in all publications are solely those of the individual author(s) and contributor(s) and not of MDPI and/or the editor(s). MDPI and/or the editor(s) disclaim responsibility for any injury to people or property resulting from any ideas, methods, instructions or products referred to in the content. |
© 2023 by the authors. Licensee MDPI, Basel, Switzerland. This article is an open access article distributed under the terms and conditions of the Creative Commons Attribution (CC BY) license (https://creativecommons.org/licenses/by/4.0/).
Share and Cite
Li, B.; Liu, S.; Chen, X.; Su, Y.; Pan, N.; Liao, D.; Qiao, K.; Chen, Y.; Liu, Z. Dynamic Changes in the Microbial Composition and Spoilage Characteristics of Refrigerated Large Yellow Croaker (Larimichthys crocea) during Storage. Foods 2023, 12, 3994. https://doi.org/10.3390/foods12213994
Li B, Liu S, Chen X, Su Y, Pan N, Liao D, Qiao K, Chen Y, Liu Z. Dynamic Changes in the Microbial Composition and Spoilage Characteristics of Refrigerated Large Yellow Croaker (Larimichthys crocea) during Storage. Foods. 2023; 12(21):3994. https://doi.org/10.3390/foods12213994
Chicago/Turabian StyleLi, Binbin, Shuji Liu, Xiaoting Chen, Yongchang Su, Nan Pan, Dengyuan Liao, Kun Qiao, Yihui Chen, and Zhiyu Liu. 2023. "Dynamic Changes in the Microbial Composition and Spoilage Characteristics of Refrigerated Large Yellow Croaker (Larimichthys crocea) during Storage" Foods 12, no. 21: 3994. https://doi.org/10.3390/foods12213994
APA StyleLi, B., Liu, S., Chen, X., Su, Y., Pan, N., Liao, D., Qiao, K., Chen, Y., & Liu, Z. (2023). Dynamic Changes in the Microbial Composition and Spoilage Characteristics of Refrigerated Large Yellow Croaker (Larimichthys crocea) during Storage. Foods, 12(21), 3994. https://doi.org/10.3390/foods12213994