Article

Study on the Effect of Different Concentrations of SO2 on the Volatile Aroma Components of ‘Beibinghong’ Ice Wine

1
Institute of Special Animal and Plant Sciences of Chinese Academy of Agricultural Sciences, Changchun 130112, China
2
School of Foreign Languages, Jilin Science and Technology Vocational College, Changchun 130123, China
*
Author to whom correspondence should be addressed.
Foods 2024, 13(8), 1247; https://doi.org/10.3390/foods13081247
Submission received: 13 March 2024 / Revised: 9 April 2024 / Accepted: 16 April 2024 / Published: 19 April 2024

Abstract

:
SO2 plays an important role in wine fermentation, and its effects on wine aroma are complex and diverse. In order to investigate the effects of different SO2 additions on the fermentation process, quality, and flavor of ‘Beibinghong’ ice wine, we fermented ‘Beibinghong’ picked in 2019. We examined the fermentation rate, basic physicochemical properties, and volatile aroma compound concentrations of ‘Beibinghong’ ice wine under different SO2 additions and constructed a fingerprint of volatile compounds in ice wine. The results showed that 44 typical volatile compounds in ‘Beibinghong’ ice wine were identified and quantified. The OAV and VIP values were calculated using the threshold values of each volatile compound, and t the effect of SO2 on the volatile compounds of ‘Beibinghong’ ice wine might be related to five aroma compounds: ethyl butyrate, ethyl propionate, ethyl 3-methyl butyrate-M, ethyl 3-methyl butyrate-D, and 3-methyl butyraldehyde. Tasting of ‘Beibinghong’ ice wine at different SO2 additions revealed that the overall flavor of ‘Beibinghong’ ice wine was the highest at an SO2 addition level of 30 mg/L. An SO2 addition level of 30 mg/L was the optimal addition level. The results of this study are of great significance for understanding the effect of SO2 on the fermentation of ‘Beibinghong’ ice wine.

1. Introduction

Ice wine is a sweet wine that is made by fermenting the naturally frozen grape juice from the vines when the temperature drops to −7~−8 °C [1]. Canada and Germany are the leading producers of ice wine, while China, Austria, and the United States also produce ice wine in large quantities. In recent years, the annual production of ice wine in China has reached 300 million liters, especially in Huanren County, Liaoning Province, and the Yalu River Basin, Jilin Province, where the ice wine industry is developing rapidly [2]. The ‘Beibinghong’ grape is the world’s first wild grape variety (Vitis amurensis Rupr) that can make ice wine and is very popular in northeast China. It has the advantages of high cold tolerance and stable yield. Compared to unfrozen grapes, frozen grapes contain high concentrations of sugar, aroma, and flavor compounds, giving the resulting ice wine a rich, fruity flavor. After alcoholic fermentation, ice wine still contains a rich concentration of residual sugar, which gives it a solid, sweet flavor. The ‘Beibinghong’ ice wine has a more rounded taste and mellow aroma than the ‘Beibinghong’ dry wine, and ice wine has received a lot of attention because of its unique flavor.
‘Beibinghong’ is one of the famous high-quality grape varieties; Vitis amurensis Rupr belong to the East Asian grape family. ‘Beibinghong’ is an interspecific cross between ‘Zuoyouhong’ as the mother and ’84-26-53′—a mountain-European F2 grape variety with low acid and high sugar content, thick skin and large bunches—as the father. This interspecific hybridization from the F5 generation to select and breed a new variety of ice wine brewing was first made in 1995. [3]. The ‘Beibinghong’ is the first Vitis amurensis Rupr variety cultivated at home and abroad to produce ice wine, and its preciousness and rarity exceed that of existing varieties on the market. It is cultivated in Inner Mongolia, Shaanxi, Gansu, and Northeastern provinces, with a planting area of about 8600 hm2 [4], and it is the first Vitis amurensis Rupr variety cultivated at home and abroad to produce ice wine. Its main planting area is in Jilin Province, and it occupies an essential position in cultivating unique plants in Jilin Province [5]. In recent years, ‘Beibinghong’ has been widely cultivated in the “Changbai Mountain” region of Jilin Province and the “Huanren” region of Liaoning Province and is the most popular variety of ice wine. Local breweries develop ice wine products and have distinctive aromas of “sweet”, “honey”, “roasted”, and “caramel”.
Volatile compounds are essential for wine quality, determining the characteristics of specific varieties and reflecting the effects of environmental conditions and viticultural management [6]. SO2 is an indispensable additive in the wine-making process. It has the following leading roles in the production and preservation of wine: inhibiting the growth of harmful bacteria and yeasts, eliminating dissolved oxygen, inhibiting polyphenol oxidizing enzymes and the infestation of stray bacteria, protecting the hygienic quality and stability of wines, and the addition of SO2 in appropriate quantities can attenuate the undesirable flavor of wines [7,8,9]. It prevents oxidative deterioration of wines and maintains their color, aroma, and flavor. Increases the acidity of wines, improves the balance and freshness of wines, promotes clarification and stabilization of wines, and reduces cloudiness and sedimentation of wines. SO2 should also be used in moderation, as excessive SO2 can adversely affect the quality of the wine and human health [10], such as reducing the aromatic intensity of the wine and masking its character and terroir, producing irritating odors that affect the taste and enjoyment of the wine. This causes allergic reactions such as headaches, breathing difficulties, and skin rashes, which are inappropriate for some people [11].
The SO2 content of wines must be strictly controlled, and each country and region must have its legal regulations and standards. According to EU regulations, the SO2 content in red wine should not exceed 150 mg/L, and white and pink wine should not exceed 200 mg/L. In China, according to The national standard GB 2760-2014 [12], SO2 ≤ 250 mg/L, and according to The national standard GB 7718-2011 [13], as long as SO2 is used in food, it has to be marked on the food label [14]. The overall goal of SO2 addition prior to wine consumption is to achieve the desired level of free SO2 at the lowest possible total SO2 [15]. The amount and timing of the addition of SO2 can affect the aroma of the wine in different ways. The right amount of SO2 protects the fruity and floral aromas of the wine from oxidative deterioration and increases the complexity and aging potential of the wine. The timing of the addition of SO2 is also essential, and in general, the earlier it is added, the more significant the impact on the aroma of the wine. For example, adding SO2 before wine fermentation can inhibit the growth of non-winemaking yeasts and maintain the cleanliness and purity of the wine. However, it can also reduce the aromatic diversity and complexity of the wine, and the addition of SO2 after wine fermentation can inhibit the growth of lactic acid bacteria and prevent the contamination of acetic acid bacteria. However, it also affects the taste and style of the wine. The study not only analyzed the chemical effects of SO2 on flavor substances only at the level of the sensory evaluation but also comprehensively from the point of view of the sensory evaluation, although the use of SO2 in winemaking is well known [16,17,18,19,20]. However, few articles have explored its effect on wine flavor in-depth, and even fewer studies have investigated the effect of different SO2 additions on the aroma of ‘Beibinghong’ ice wine, a special ice wine variety in the Jilin region. The study of ‘Beibinghong’ ice wine, which is a unique ice wine variety from the Jilin region, can improve the flavor quality of the wine by adjusting the strategy of using SO2, assessing the effect of SO2 concentration on the flavor of the wine in a more precise way, exploring how SO2 affects the fermentation process and aroma characteristics of the wine, and identifying the volatile compounds that play a vital role in the different amounts of SO2 added to the wine.
This study measured the fermentation start and end times, basic physicochemical properties, and volatile aroma compounds of ‘Beibinghong’ ice wine harvested in 2019. The fingerprints of volatile compounds of ice wine brewed with different concentrations of SO2 were established, and its brewed ice wine was tasted. In the experiment, SO2 was added by adding solid potassium metabisulfite (PMS), and each gram of PMS produced 0.56 g of SO2, i.e., 10 mg of SO2 required 17.86 μg of PMS, which was then added in eight treatments, i.e., 10 mg/L, 20 mg/L, 30 mg/L, 40 mg/L, 50 mg/L, 60 mg/L, 80 mg/L, and 100 mg/L, in the following order. Eight treatments were performed to determine the optimal amount of SO2 addition at the same temperature and under the same yeast strain and enzyme treatment conditions.

1.1. Materials and Reagents

1.1.1. Experimental Materials

‘Beibinghong’ ice grapes harvested from vineyards of Yujiang Valley Winery Co., Ltd. (Ji’an, China) in Ji’an City for ‘Beibinghong’ ice wine production; yeasts BV818 and CEC01 (Angie’s Yeast Co., Ltd., Yichang, Hubei, China); pectinases RF and RCO (AB Enzymes, Darmstadt, Germany); and potassium metabisulphite (SAS SOFRELAB OENOFRANCE).

1.1.2. Reagents

Analytical purity: sulfuric acid, sodium chloride, potassium chloride, sodium bicarbonate (Beijing Chemical Plant, Beijing, China); tannic acid (Tianjin Guangfu Fine Chemical Research Institute, Tianjin Fine Chemical Research Institute, Tianjin, China); Folin–Denis reagent (US Sigma, St. Louis, MO, USA); anhydrous sodium carbonate (Tianjin Hengxing Chemical Reagent Manufacturing Co., Ltd., Tianjin, China); glacial acetic acid, hydrochloric acid, anhydrous ethanol, sodium hydroxide, phosphoric acid (Beijing Chemical Plant); potassium hydrogen phthalate, anthracene ketone (Sinopharm Chemical Reagent Co., Ltd., Shanghai, China); anhydrous sodium acetate (Shanghai Hubtest Chemical Co., Ltd., Shanghai, China); dextrose (Tianjin Hengxing Chemical Reagent Manufacturing Co., Ltd., Tianjin, China).
Chromatographic purity: methanol (TEDIA Reagents, Fairfield, OH, USA), 4-methyl-2-pentanol (Shanghai Lianshuo Biotechnology Co., Ltd., Shanghai, China).
Fermentation auxiliaries: CEC01 active dry yeast (Angel Yeast Co., Ltd., Yichang, China); potassium metabisulphite (Yantai Dibs Homebrewer Co., Ltd., Yantai, China).

1.2. Instruments and Equipment

Agilent High Performance Liquid Chromatograph (Agilent Technologies Ltd., Santa Clara, CA, USA); FlavourSpec® Flavor Analyzer (Shandong Haineng Scientific Instrument Co., Ltd., Zibo, Shandong, China); BSA224S-CW Sartorius Electronic Balance (Sartorius Scientific Instruments Co., Ltd., Göttingen, Germany); PAL-1 Digital Hand-held Refractometer (ATAGO, Tokyo, Japan), CJJ-931 Dual-link Magnetic Heating Stirrer (Jiangsu Jintan Jincheng Guosheng Experimental Instrument Factory, Changzhou, Jiangsu, China); HWS-12 type electric thermostatic water bath (Shanghai Yiheng Scientific Instrument Co., Ltd., Shanghai, China); KQ-300E type ultrasonic cleaner, snowflake ice machine (Beijing Changliu Scientific Instrument Co., Ltd., Beijing, China), FA1004B electronic balance (Shanghai Yue Ping Scientific Instrument Co., Ltd., Shanghai, China), DHG-9240 constant temperature drying oven (Shanghai Yihang Scientific Instrument Co., Ltd., Shanghai, China), WAX chromatography columns (U.S. RESTEK, Bellefonte, PA, USA); Milli-Q Advantage A1 ultrapure water apparatus (Millipore Corporation, USA); Cary60UV-Vis UV spectrophotometer (Agilent Technologies Ltd., Santa Clara, CA, USA).

1.3. Methods

1.3.1. Process Flow of Brewing ‘Beibinghong’ Ice Wine

The process of ice wine production involves harvesting the fruit, screening, and de-stemming. The harvested fruit is then granulated, pressed, and preserved by adding different concentrations of SO2. Three sets of replicate brewing experiments were conducted using three fermenters per treatment to ensure the reproducibility of the experiments. Gum reduction is carried out, followed by a low-temperature maceration at 2–4 °C. The wine is then post-tempered to 15 °C. Subsequently, the post-temperature was adjusted to 15 °C, and controlled fermentation was carried out with the addition of CECO1 yeast at a dosage of 250 mg/Kg. After completion of fermentation, fermentation was stopped, and crude filtration was carried out to obtain the original wine. After controlled aging, the wine is then fine-filtered and sterilized. After passing quality tests, the final product is bottled, sealed, and labeled as ice wine.

1.3.2. Sample Labeling

The amount of SO2 used according to the quality of treated iced grape juice was as follows: sample No. 1 (10 mg/L), sample No. 2 (20 mg/L), sample No. 3 (30 mg/L), sample No. 4 (40 mg/L), sample No. 5 (50 mg/L), sample No. 6 (60 mg/L), sample No. 7 (80 mg/L), sample No. 8 (100 mg/L).

1.3.3. Detection Methods of Basic Physical and Chemical Indexes

Soluble solids were determined by handheld refractometer, and titrable acid content of wine was determined by indicator method according to The GB/T 15038-2006 [21]. The alcohol content is measured by the alcohol meter method. The total sugar content in wine was determined by anthrone and sulfuric acid colorimetric method, and standard koji was prepared by standard glucose solution. The total anthocyanin content in grape juice was determined by pH difference method, i.e., anthocyanin reacted with potassium chloride buffer (0.025 M, pH = 1) and acetic acid buffer (0.4 M, pH = 4.5), and then the difference of 520 nm and 700 nm was calculated. Total phenol content—Folin–Ciocalteu colorimetric method. Dry extract content: refer to the dry extract test method in the national standard (GB/T 15038-2006).

1.3.4. Quantification of Volatile Compounds in ‘Beibinghong’ Ice Wine by HS-GC-IMS

Headspace-gas chromatography-ion migration spectrometry (HS-GC-IMS) determined volatile substances in wine. The FlavourSpec® flavor analyzer was used to take a 1 mL sample, place it into a 20 mL headspace bottle, add 20 ppm 4-methyl-2-amyl alcohol 10 μL, incubate at 60 °C for 15 min, and then inject it into the sample.
Chromatographic conditions: the column was WAX column (15 m × 0.53 mm,1 µm), column temperature was 60 °C, carrier gas was N2, IMS temperature was 45 °C, and chromatographic conditions were shown in Table 1.
The conditions of automatic headspace injection were as follows: injection volume of 100 μL, incubation time of 10 min, incubation temperature of 60 °C, injection needle temperature of 65 °C, and incubation speed of 500 rpm; 4-methyl-2-pentanol was used as the internal standard for the analysis, and the concentration of 198 ppb, the signal peak volume of 493.34, and the intensity of each signal peak was about 0.401 ppb.
Quantitative calculation formula:
C i = C i s A i A i s
Ci is the calculated mass concentration of any component in µg/L, Cis is the mass concentration of the internal standard used in µg/L, and Ai/AIS is the volume ratio of any signal peak to the signal peak of the internal standard. The NIST database and IMS database are built into the software for the qualitative analysis of the substances.

1.3.5. Odor Activity Value (OAV) Calculation

OAV was used to assess the contribution of volatile compounds to the overall aroma of the wine. The concentration of volatile compounds was divided by the odor threshold (OT) to calculate the OAV value. Volatile compounds with OAV > 1 were considered to be types of aroma-active compounds, and the larger the OAV value, the more significant the contribution of components to the flavor; the OAV value can help to determine the critical aroma substances in food or plants [22,23,24], analyze the causes of flavor differences, and optimize the flavor quality of wine aroma characteristics formation plays an important role.

1.4. Sensory Evaluation

Sensory evaluation methodology: the wines were subjected to quantitative descriptive analysis (QDA) by a trained sensory panel of 17 tasters (10 women and 7 men, aged 24 to 52 years, with an average of 33 years). These experts were recruited based on their motivation and availability, having been trained according to the national standards ISO 6658 [25] and ISO 8586 [26] prior to the sensory evaluation. According to the definitions in the published literature, according to the definitions in The national standard GB 15038-2006 [27,28], and based on the discussion results, specify the development of a sensory evaluation form (Table 2). The samples were marked with three numbers and submitted to the tasters randomly.

1.5. Statistical Analysis of Data

Excel 2010 was used to organize the experimental data statistically, and an analysis of variance (ANOVA) was performed using SPSS (version 22.0, IBM, Armonk, NY, USA). Statistical). Statistical analyses were performed on the experimental data to check for significant differences in the individual results, and all the data were expressed as mean ± standard deviation. Differences between the two groups were considered significant at p < 0.05. Simca 14.1 software was used for OPLS-DA and VIP value analysis; GC-IMS assay was done with Savitzky Golay for smoothing and denoising, and migration time normalization was done by setting the RIP position as 1, i.e., dividing the actual migration time by the peak out time of the RIP to obtain the approximate migration time. The Reporter plug-in was used to directly compare the spectral differences between the samples, and the Gallery Plot plug-in was used to compare the fingerprints visually and quantitatively to compare the differences of VOCs between different samples. Heat map and correlation analysis were performed using the OmicShare tools, a free online platform for data analysis (https://www.omicshare.com/tools (accessed on 27 July 2020)).

2. Results and Analysis

2.1. Fermentation Process and Basic Indexes of ‘Beibinghong’ Ice Wine with Different SO2 Additions

The yeast treatment time in this experiment was 11 December 2019, and the initial solid content of ‘Beibinghong’ grape juice was 40.3%. It can be seen from Table 3 that the fermentation time was 24 h at 10 mg/L and 48 h at 30, 40, and 50 mg/L. The fermentation time of 10 mg/L, 40 mg/L, and 50 mg/L was 23, 23, and 21 days, but the red wine was suitable for slow fermentation at low temperatures. This is in line with the findings of Sun Hening and others [29] that the addition of SO2 prior to fermentation inhibits yeast activity in the short term and increases the delay in yeast multiplication, leading to a delay in fermentation; however, during this period, it allows the must to remain static and encourages the precipitation of impurities, colloidal substances, and decomposed tartaric acid, which is highly susceptible to the formation of tartar in wines. Wang et al. [30] studied the effect of SO2 on the fermentation process and quality of pineapple wine and found that SO2 had a significant effect on the time of starting fermentation when the concentration of SO2 was 150 mg/L or less, the time of starting fermentation was around ten h. With the increasing concentration of SO2, the time of starting fermentation was delayed significantly, and when the concentration of SO2 was 250 mg/L, the time of starting the fermentation time was more than 3 d at a concentration of 250 mg/L, which was the same as our results, indicating that the higher concentration of SO2 affects the fermentation of fruit wines. The fermentation time of fruit wines should not be too long, so it should be considered comprehensively. The total sugar of ice wine fermented with different amounts of SO2 was found to be above 160.0 g/L, which indicates that different amounts of SO2 do not have much effect on the total sugar, which is the same as the results of the study by Mou Jingxia et al. [10]. The total acid content of SO2 was relatively low at 10 mg/L, 20 mg/L, 30 mg/L, 40 mg/L. The level of dry leachate index is closely related to the raw materials, production process, and storage method of wine, and it is one of the essential symbols of the quality of wine [31]. Dry leachate was higher at SO2 additions of 30 mg/L, 40 mg/L; From the above table, adding 30 mg/L and 40 mg/L SO2 is more appropriate.

2.2. Changes in Anthocyanin Content of ‘Beibinghong’ Ice Wine Brewed with Different SO2 Additions

Color is one of the most critical indicators affecting the sensory quality of red wine, and anthocyanin, a class of flavonoid compounds with a benzopyran structure, is an essential water-soluble natural pigment in red wine, as well as a crucial color-presenting substance, with a variety of critical physiological functions and biological activities [32,33]. During grape growth and development, anthocyanosides are biosynthesised via the phenylpropane-flavonoid pathway. In wine, there is an equilibrium between the various states of anthocyanins, and their color expression is closely related to the structure and morphology of the anthocyanin molecule [34]. After human consumption of wine, wine anthocyanosides are mainly metabolized and absorbed by intestinal flora in the colon. The type, state, and content of anthocyanosides are essential in red wines’ color characteristics and aging potential. Changes in the content of anthocyanosides in ‘Beibinghong’ ice wine brewed with different SO2 additions are shown in Table 3.
As shown in Table 4, the content of anthocyanin was higher when SO2 was added at 30 mg/L, 60 mg/L, and 80 mg/L, especially at 80 mg/L, which reached the highest value. However, the total acid content was slightly higher because ‘Beibinghong’ belongs to the Vitis amurensis Rupr variety. From the taste and quality perspective, the SO2 addition was not too high, so 30 and 60 mg/L were more appropriate. A moderate addition of SO2 has a protective effect on the anthocyanins in wine [35]. SO2 inhibits the action of oxidative enzymes and prevents oxidation of the raw material, which helps to maintain the stability and color vividness of the anthocyanosides. The addition of SO2 also helps to select the fermentation microorganisms, clarify the fermentation matrix, and regulate the acidity of the fermentation matrix, which indirectly affects the solubilization and stability of the anthocyanosides [36,37,38,39]. J Bakker et al. [40] found that as the level of SO2 increased during winemaking, more anthocyanins were extracted. During maturation, all wines lost color and increased brownness. Wines without added SO2 browned more severely than wines with added SO2. This also shows that SO2 is essential to maintain color stability in wine production.
However, when the added SO2 level is too high, it can adversely affect anthocyanin [41]. This is in line with our findings that an addition of sulphur dioxide that is too high affects the content of anthocyanosides. High concentrations of SO2 may generate sulfites in acidic environments, which are capable of reacting with anthocyanoside molecules, leading to the formation of anthocyanoside sulfites, which are colorless, and therefore reduce the anthocyanoside content of wines, thus affecting the color of the wines. SO2 has both protective and potentially damaging effects on the anthocyanosides in wine, depending on the amount added and the conditions of use. The amount of SO2 added during the winemaking process needs to be precisely controlled to maximize the positive effects and minimize the negative effects on the anthocyanins, thus ensuring optimal wine quality and taste.

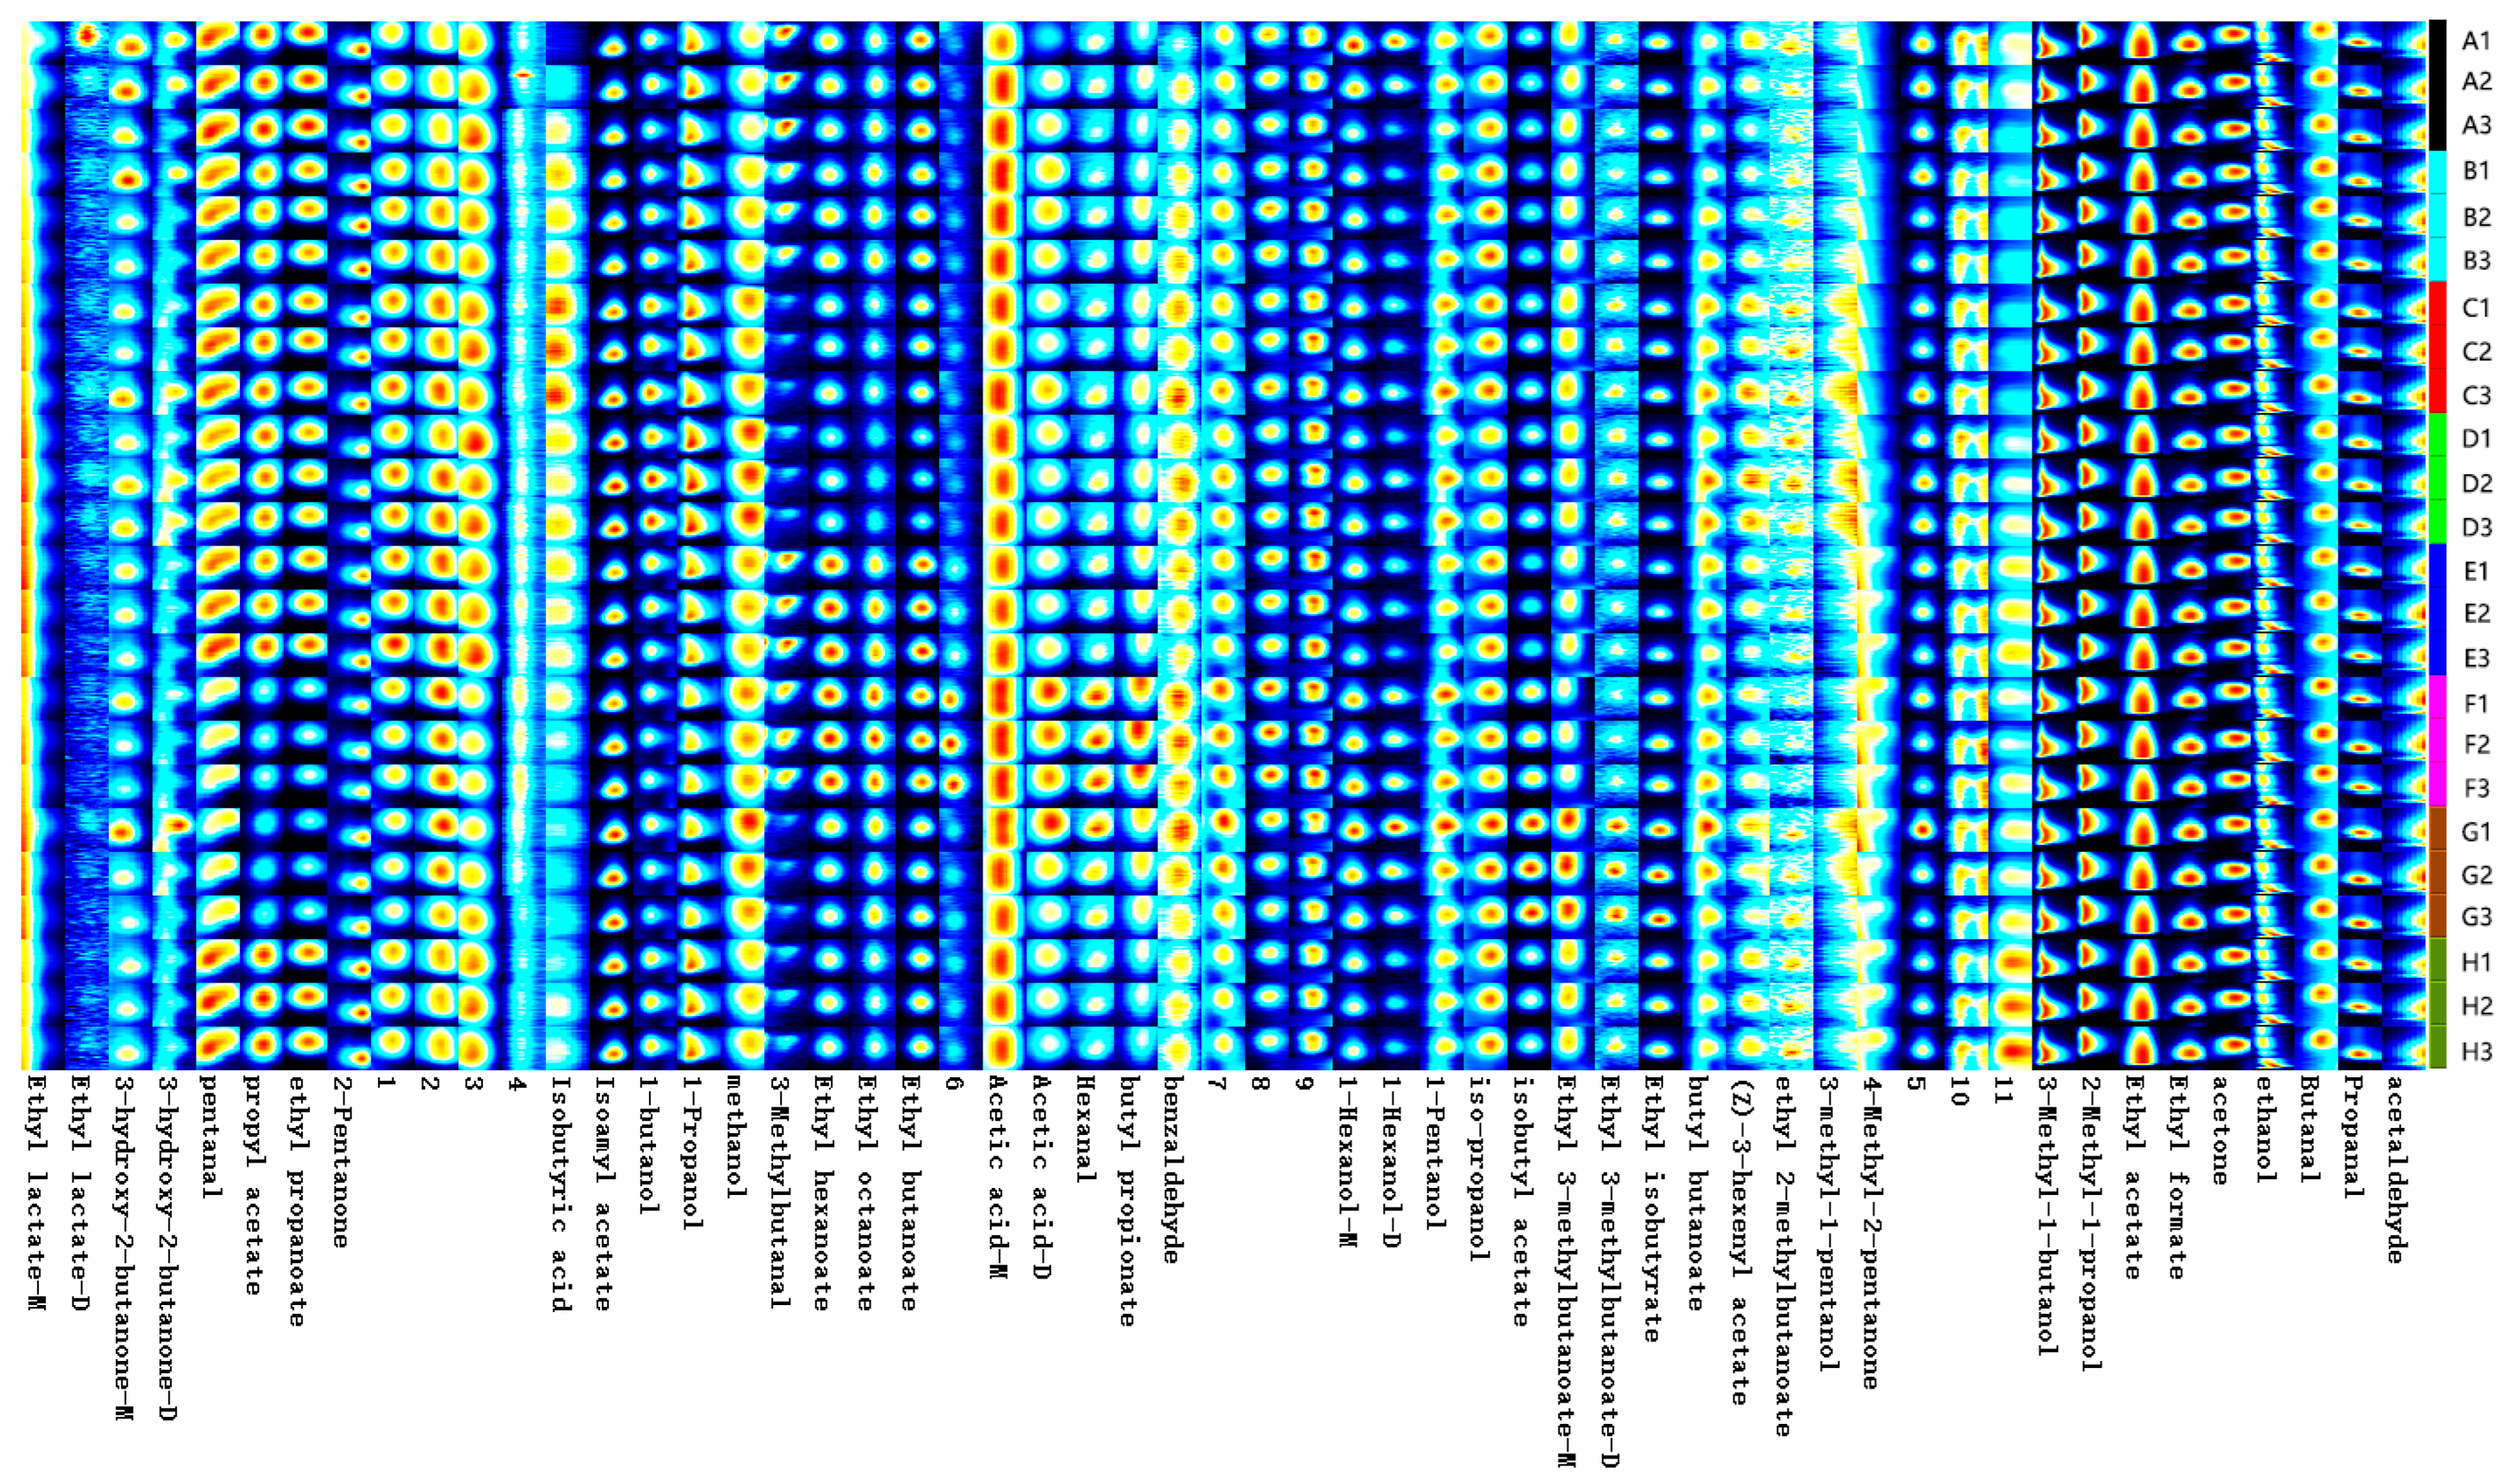
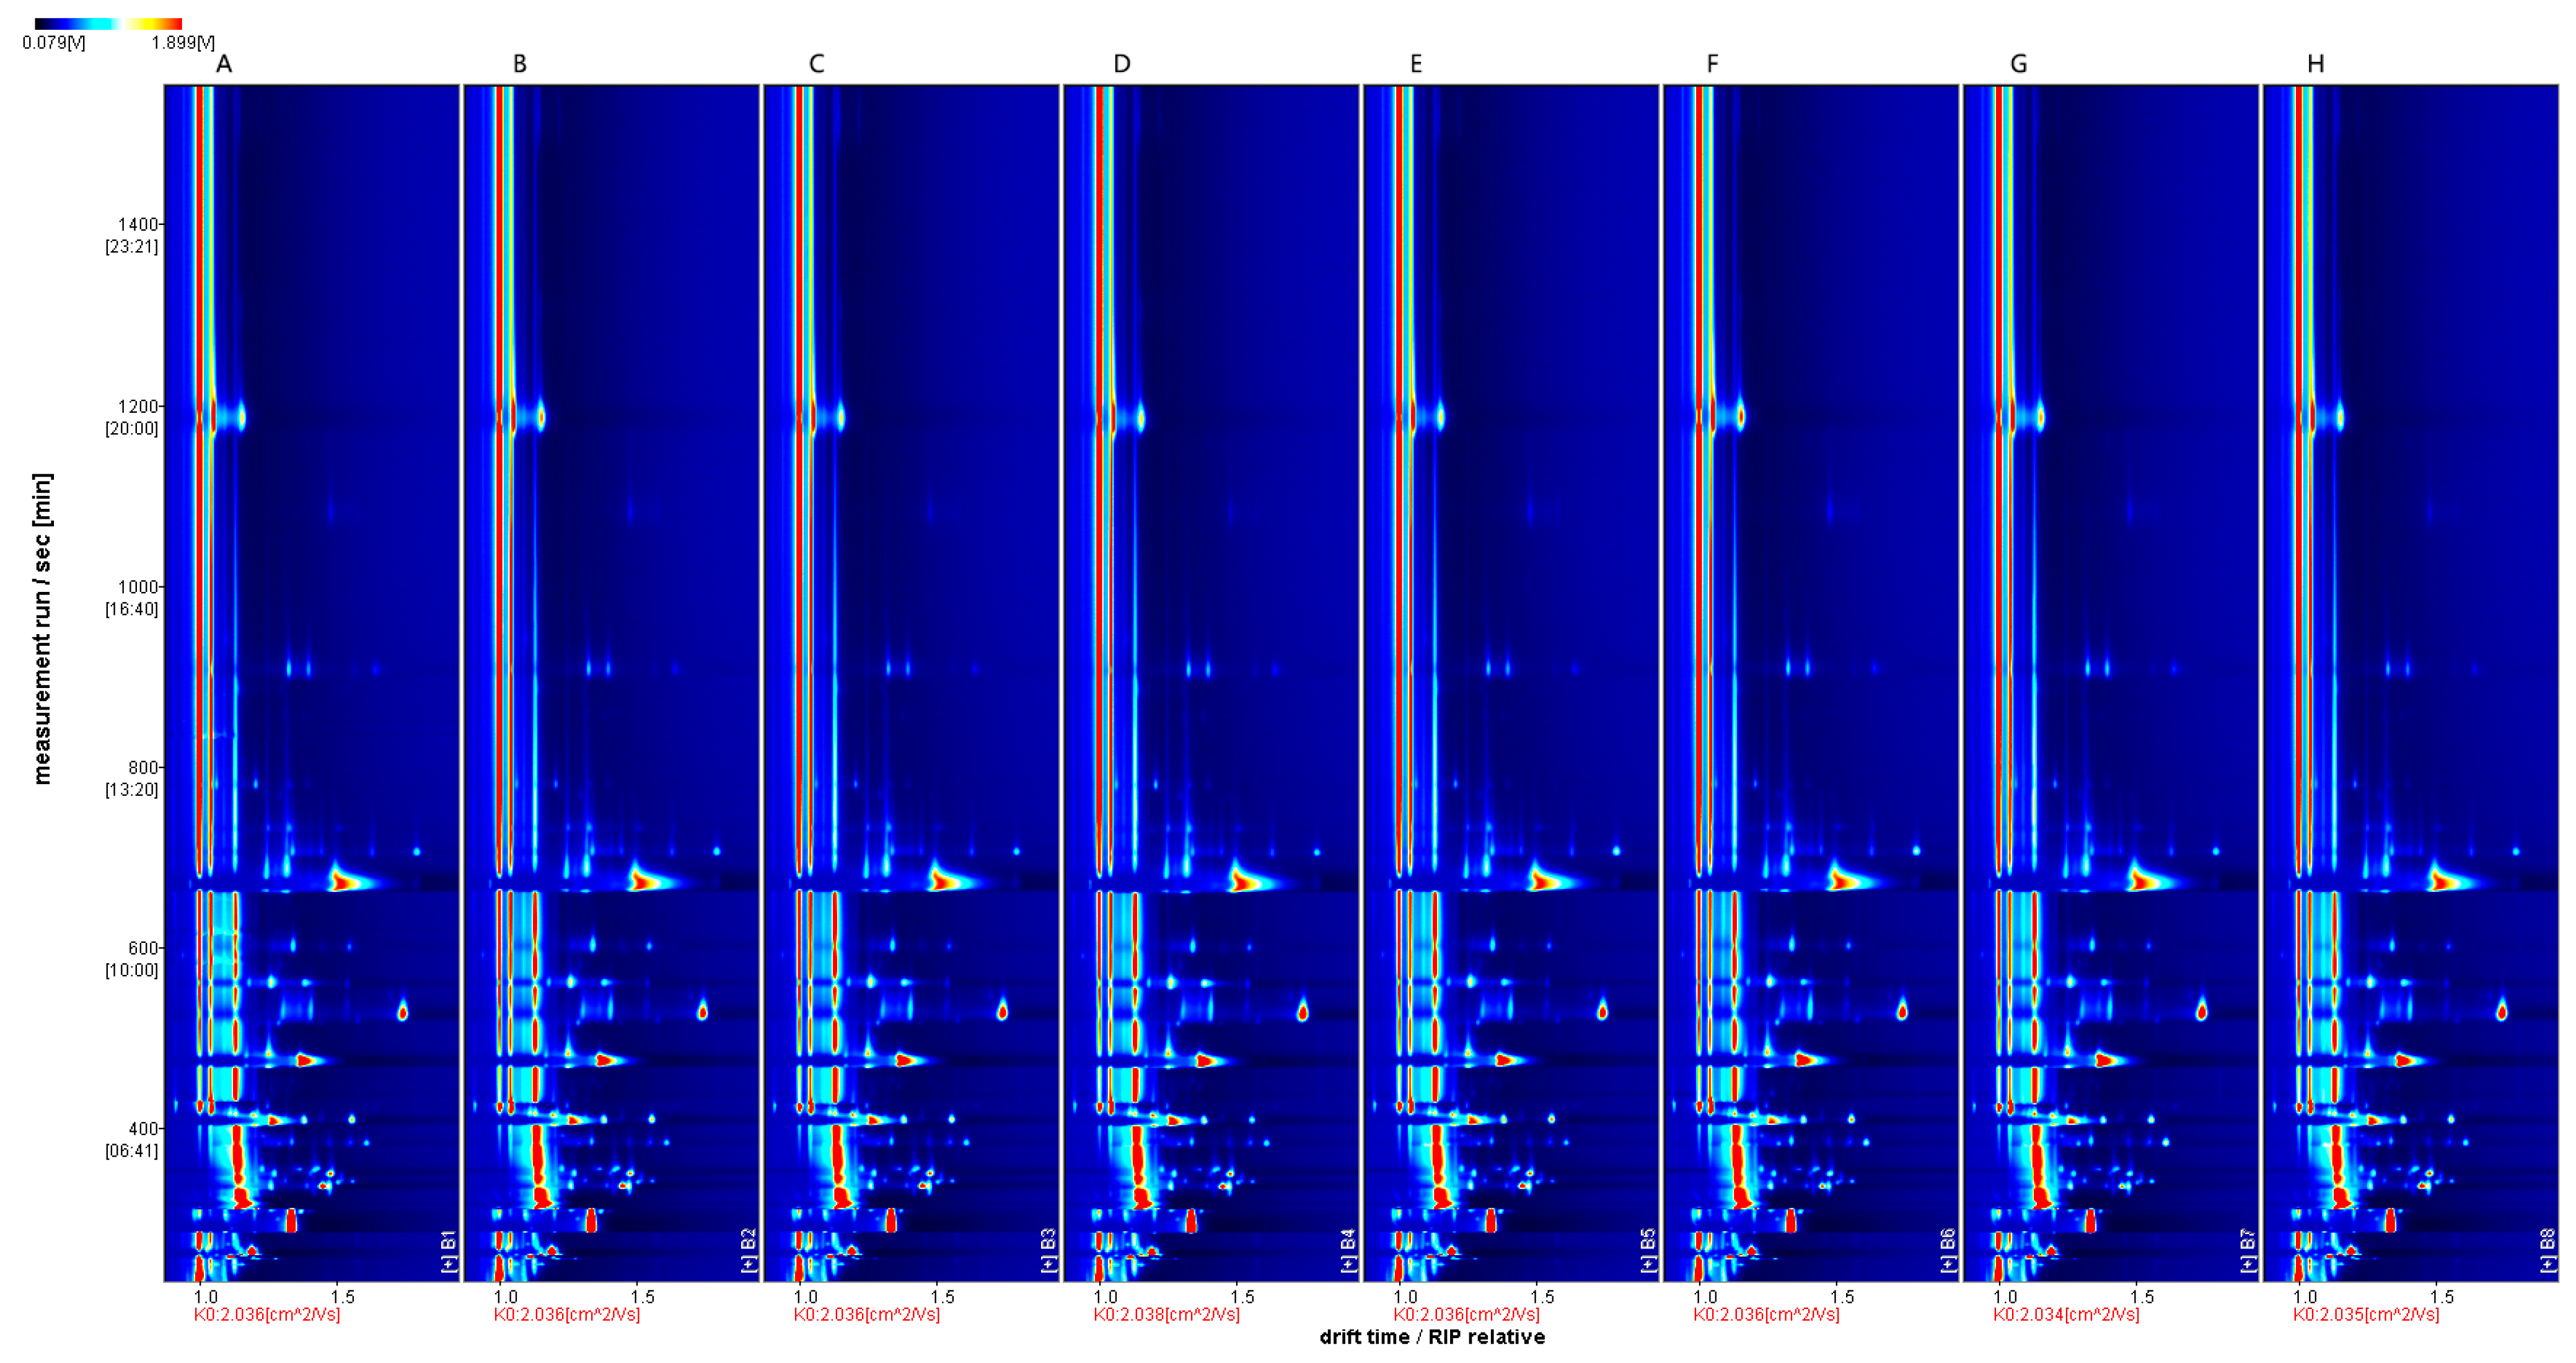
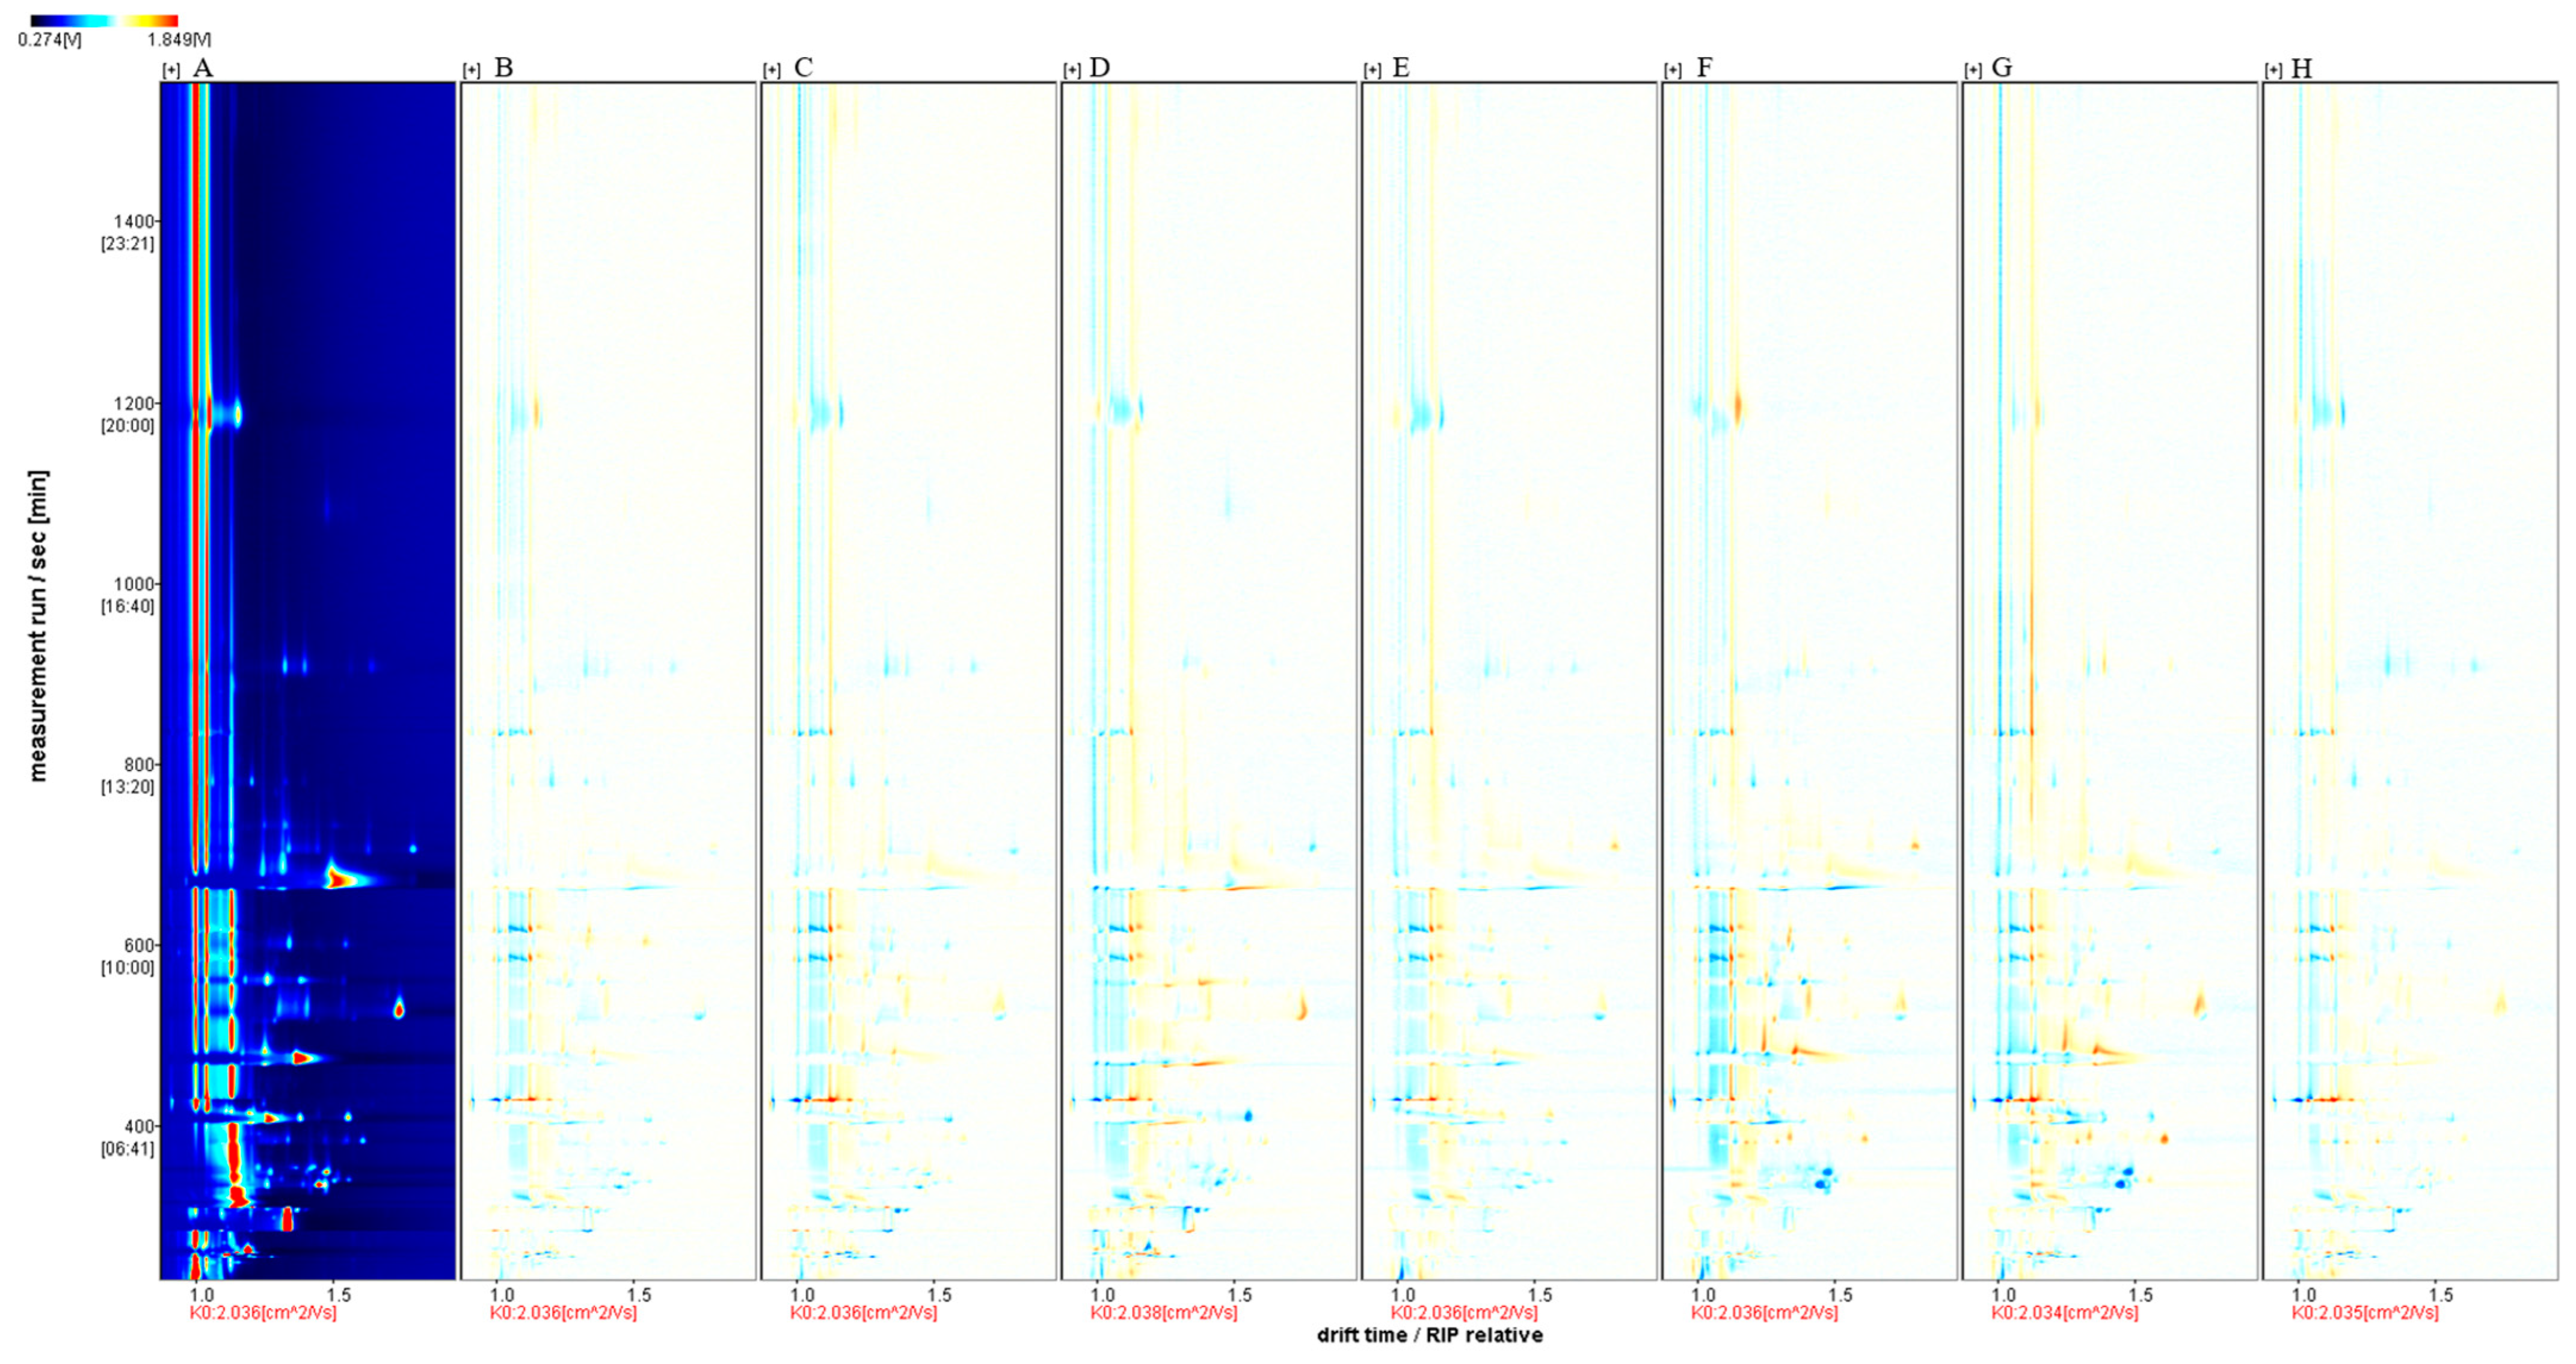
2.3. HS-GC-IMS Analysis of ‘Beibinghong’ Ice Wine Brewed with Different SO2 Additions

Fingerprints of Volatile Components of ‘Beibinghong’ Ice Wine Brewed with Different SO2 Additives

In order to analyze the variability of volatile substances in ice wine brewed with different concentrations of SO2, we constructed a fingerprint of volatile flavor compounds based on all the signal peaks in the two-dimensional HS-GC-IMS spectra (Figure 1). Each sample was measured three times in parallel, and the darker color indicated a greater peak intensity and higher content. The composition and differences of volatile flavor compounds in ice wine brewed with different concentrations of SO2 were revealed from the fingerprints.
As shown in Figure 2, the volatile compounds in the eight wine samples were well separated, and the aroma fingerprints of the wine samples differed significantly, mainly in the content of volatile compounds.
The ‘Beibinghong’ ice wine from the first treatment group was used as a reference, and the rest of the spectra were subtracted from the signal peaks in the first treatment to obtain the difference spectra (Figure 3).

2.4. Analysis of Volatile Components

Aroma is an essential index for evaluating the quality of wine, and the study of wine aroma mainly focuses on the aromatic substances that positively affect it. The critical role of SO2 in winemaking also includes its role in the aroma. SO2 also significantly affects the aroma of wine, with the addition of SO2 affecting the concentration of volatile compounds in the wine by between 33% and 43% [42]. Aromatic substances in wine can be categorized into terpenoids, aliphatic compounds, and aromatic compounds according to their chemical structure, of which aliphatic compounds include alcohols, acids, ketones, and esters. The analytical spectra and data were viewed with VOCal for qualitative and quantitative analysis, and the volatile components in the wine samples were characterized by the built-in NIST and IMS databases of HS-GC-IMS. A total of 44 typical volatile compounds were detected (Table 5), and the most significant number of species was 18 esters, 11 alcohols, 3 acids were detected, 5 ketones, and 11 uncharacterized volatile compounds. The volatile aroma compounds detected in the ice wine samples from the eight treatments were the same type, but the contents were significantly different. Among the eight treatments, the highest total volatile compound content was found in the seventh treatment group with 80 mg/L of added SO2, with a total volatile compound content of 81,930.42256 µg/L. The following treatments with the highest total volatile compound content in descending order were the treatment group with 50 mg/L of added SO2, with a volatile compound concentration of 81,394.73104 µg/L, treatment group with 70 mg/L SO2 addition 81,328.35368 µg/L, treatment group with 40 mg/L SO2 addition 81,182.37288 µg/L, treatment group with 60 mg/L SO2 addition 79,569.26936 µg/L, and treatment group with 90 mg/L SO2 addition 79,215.75989 µg/L. 79,569.26936 µg/L for 60 mg/L of SO2, 79,215.75984 µg/L for 90 mg/L of SO2, 78,921.88528 µg/L for 30 mg/L of SO2, and 77,818.71496 µg/L for 20 mg/L of SO2. Table 5 shows that alcohols accounted for the most significant proportion of 62.9–64.73%, followed by esters at 24–25.82%, and alcohols and esters were the main aroma compounds in the wine samples.

2.4.1. Esters

The esters in wine are mainly produced by acyl-coenzyme A and fatty acids and alcohols in yeast cells under the catalytic action of relevant enzymes during alcoholic fermentation, and they have the aroma of fruits or flowers, which play a vital role in the aroma of wine [43,44]. Esters give wines a unique and complex fruity flavor, which is a critical component of their aroma composition, and the description of the aroma of the detected ester compounds also shows that the esters are mainly dominated by fruity aroma. The various ester compounds present in wines have coordinated compositional ratios and have synergistic effects on the formation of aroma [43,45]. The esters in grapes are mainly found in grape skins, which are fully macerated during fermentation, releasing the variety’s unique fruity and floral aromas. As can be seen in Table 4, esters were the compounds with the highest percentage of content in the assay, and from the esters detected, the esters that provided a higher concentration of aromas were isoamyl acetate, ethyl acetate, methyl formate, ethyl butyrate, and Ethyl propionate, the highest content of esters detected among the eight treatments was in treatment group 7 (SO2 addition of 80 mg/L) at 20,217.62344 µg/L, followed by ester volatile compounds in descending order by treatment group 8 (SO2 addition of 90 mg/L) at 20,201.48088 µg/L; treatment group 1 (SO2 addition of 20 mg/L) was 20,089.12584 µg/L; treatment group 5 (SO2 addition of 60 mg/L) was 19,966.58664 µg/L; treatment group 3 (SO2 addition of 40 mg/L) was 19,897.53192 µg/L; and treatment group 6 (SO2 addition of 70 mg/L) was 19,734.66768 µg/L; the fourth treatment group (SO2 addition of 50 mg/L) was 19,533.09736 µg/L; and the second treatment group (SO2 addition of 30 mg/L) was 19,438.08048 µg/L. A study by Teresa Garde-Cerdán et al. found [46] that when volatile aroma compounds were examined in wines with or without the addition of SO2, it was found that the concentration of SO2 did not have a significant effect on the total esters in the wines, which is the same as our findings, and this is probably because the wines are rich in unsaturated fatty acids. Therefore, the concentration of oxygen in the medium did not affect the formation of these compounds. Liu et al. [47] found that the addition of an appropriate concentration of SO2 can also increase the content of isoamyl acetate, ethyl acetate, and ethyl octanoate in wine to a certain extent, which can bring pleasant floral and fruity aroma to wine and increase the complexity of wine aroma. The high concentration of SO2 can lead to the increase of ethyl acetate, which can hurt the aroma quality of the wine. Therefore, when choosing the concentration of SO2, it is essential to consider not only the concentration of the aroma but also the negative effect of the aroma content on the wine, and the amount added should be manageable [42,48,49]. Moderate amounts of SO2 can help stabilize the aroma components in wine and contribute to forming certain aromas. However, excessive amounts of SO2 may react with the aroma components of the wine, resulting in a change or loss of aroma. Such changes may be manifested as a diminution or loss of certain aromas in the wine or the production of some unpleasant off-flavors.

2.4.2. Alcohols

Alcohols accounted for the most significant percentage of 62.9–64.73% of the wines, and their aroma characteristics were mainly pungent or grassy. The content of alcohols between different treatment groups in descending order was 52,687.70472 µg/L in the fourth treatment group (SO2 addition of 50 mg/L); 52,419.32192 µg/L in the seventh treatment group (SO2 addition of 80 mg/L); 51,936.64448 µg/L in the sixth treatment group (SO2 addition of 70 mg/L); third treatment group (SO2 addition of 40 mg/L) at 51,900.99208 µg/L; fifth treatment group (SO2 addition of 60 mg/L) at 50,486.39344 µg/L; second treatment group (SO2 addition of 30 mg/L) at 50,107.1648 mg/L; the eighth treatment group (SO2 addition of 90 mg/L) with 50,067.50616 µg/L; and the first treatment group (SO2 addition of 20 mg/L) with 48,951.784 µg/L. The highest ethanol content was found in the treatment group with the highest SO2 addition of 70 mg/L, and the lowest was found in the treatment group with the lowest SO2 addition of 20 mg/L. The highest ethanol content was found in the treatment group with the highest SO2 addition of 70 mg/L and the lowest in the treatment group with the lowest SO2 addition of 20 mg/L. The highest ethanol content was in the treatment group with 70 mg/L of SO2, and the lowest was in the treatment group with 20 mg/L of SO2; the highest methanol content was in the treatment group with 50 mg/L of SO2, and the lowest methanol content was in the treatment group with 20 mg/L of SO2;

2.4.3. Others

Aldehydes, acids, and ketones accounted for a relatively small percentage of the wine. The percentage of aldehydes in the volatile compounds of ice wine was 2.06–2.17%. Among the treatment groups, the most considerable aldehydes content was in the third treatment group (SO2 addition of 40 mg/L) with 1758.6688. The lowest content was in the eighth treatment group (SO2 addition of 90 mg/L) with 1627.96816 µg/L. The proportion of ketones in the volatile compounds of ice wine ranged from 1.87% to 2.02%, with the most considerable ketone content in the first treatment group (20 mg/L SO2) at 1575.7028 µg/L and the lowest in the fifth treatment group (60 mg/L SO2) at 1511.65784 µg/L. The proportion of acid compounds in the volatile compounds of ice wine ranged from 1.87% to 2.02%. The percentage of acid compounds in the volatile compounds of ice wine ranged from 4.73% to 5.66%, with the most significant amount of acid compounds in treatment group 6 (70 mg/L of SO2 addition) at 4604.20464 µg/L and the lowest in treatment group 1 (20 mg/L of SO2 addition) at 3%.
Among the treatments, regarding the total content of volatile compounds, the SO2 addition of 30 mg/L had a higher content of total aroma substances. Methanol and other substances harmful to the aroma components of ‘Beibinghong’ ice wine were fewer. The content of the components that impacted the quality was lower, so the quality of the wine was better than that of the other treatment groups from a comprehensive point of view.

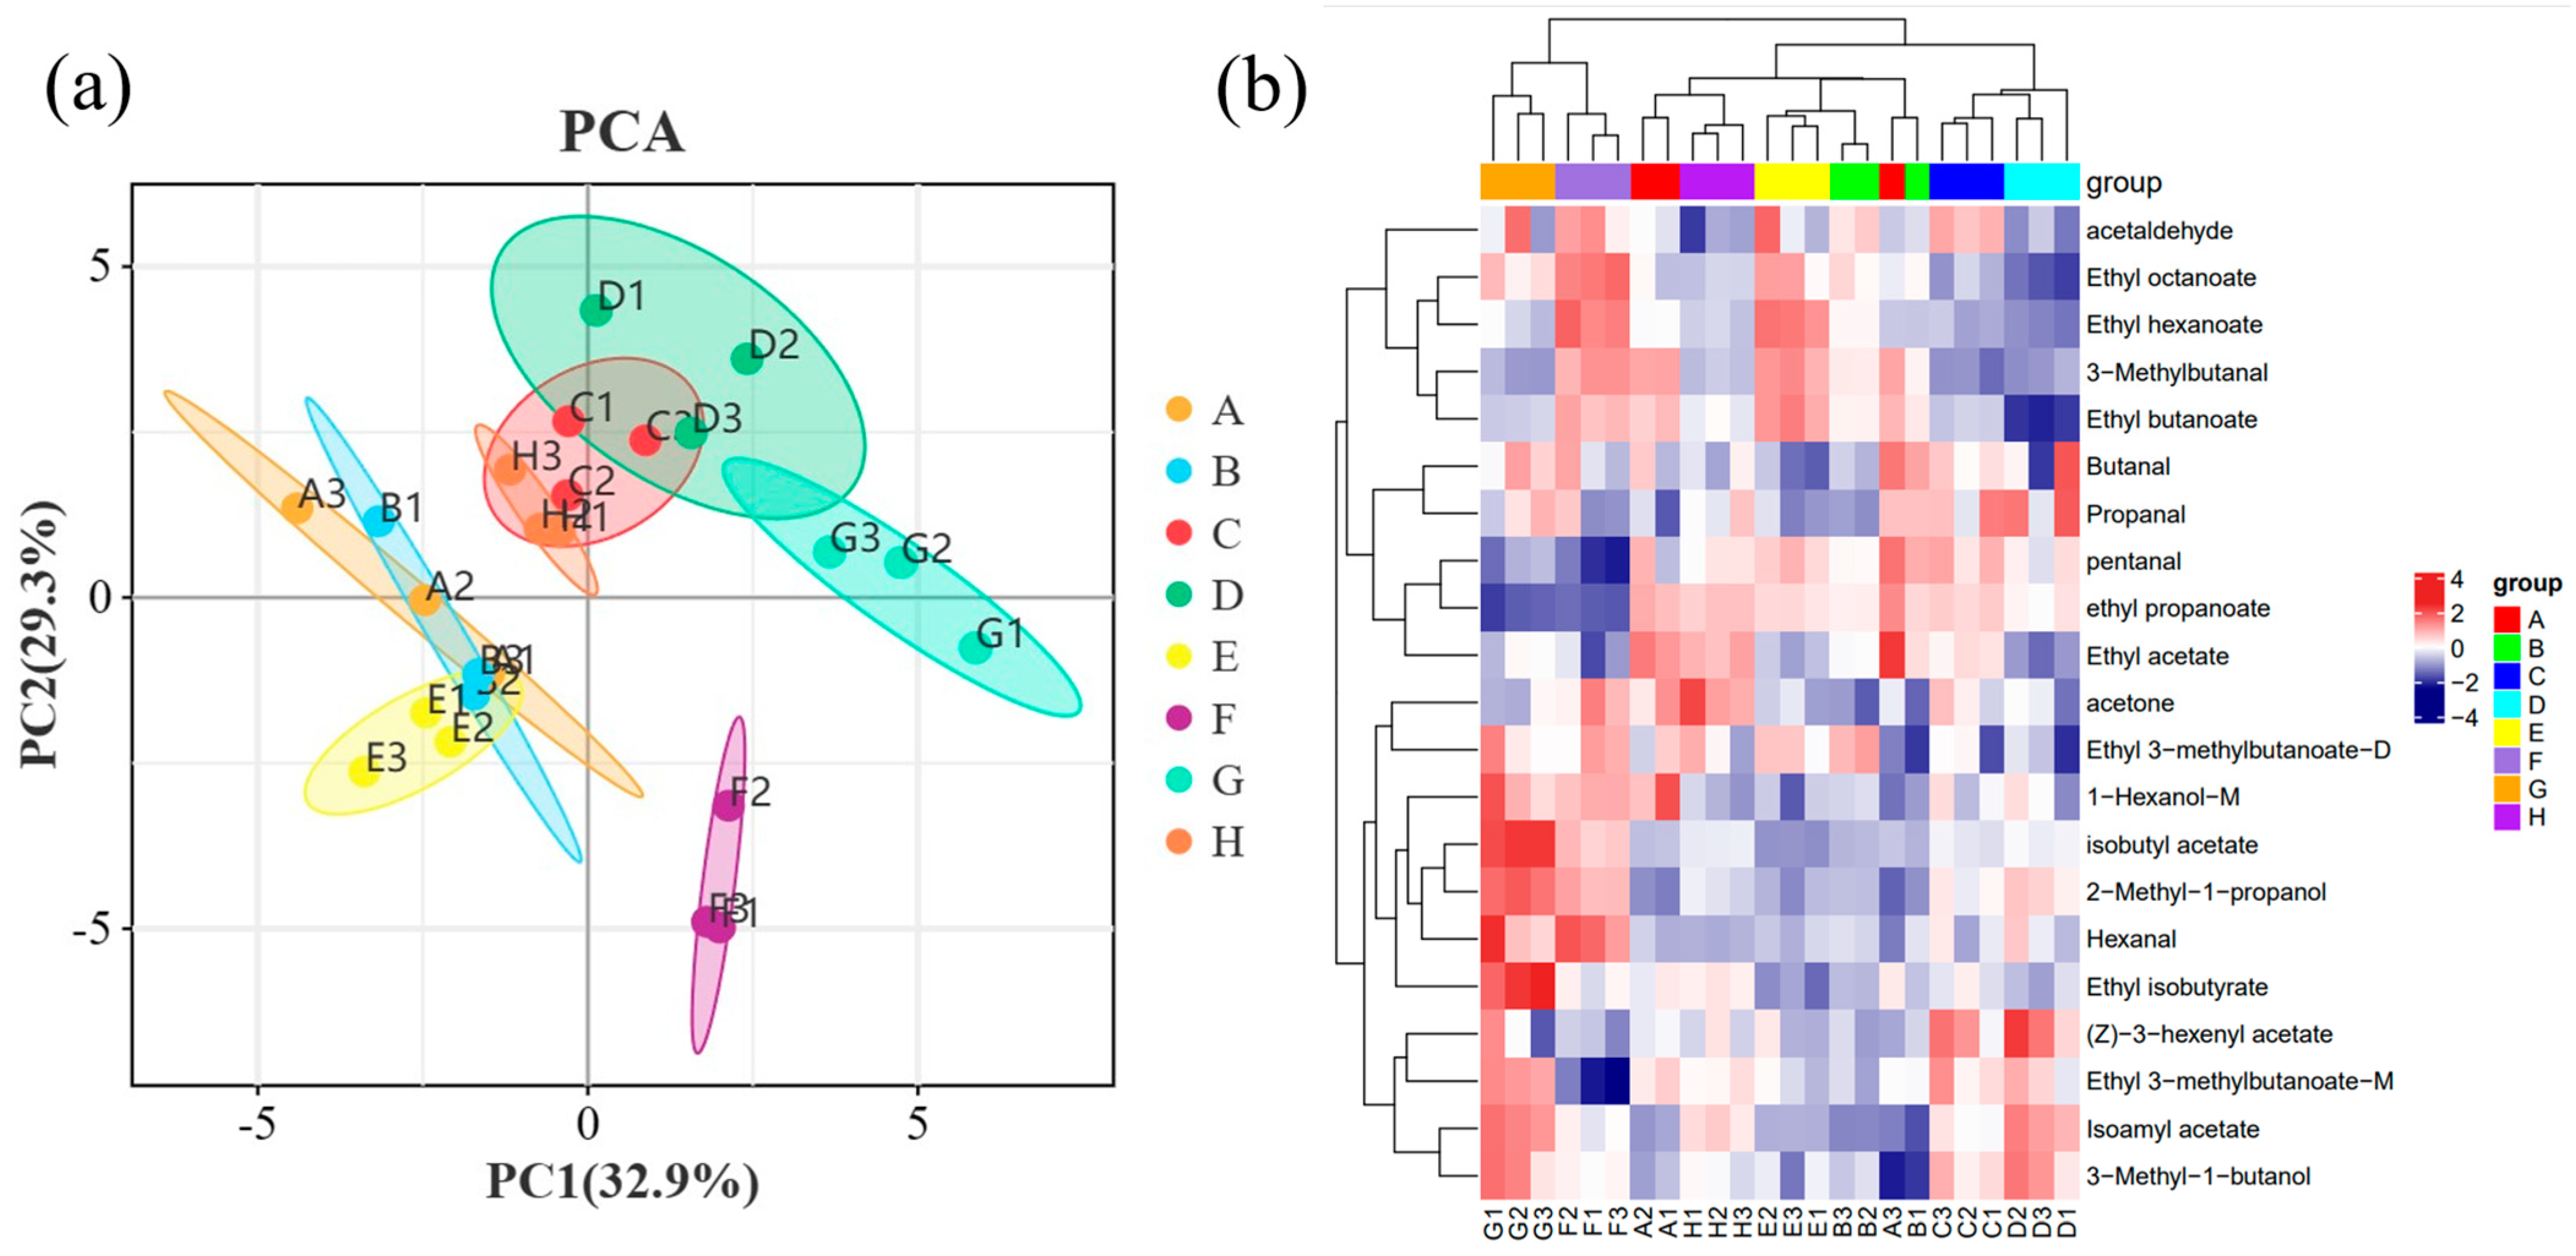
2.5. Principal Component Analysis (PCA) of Wine Samples

In order to better present and distinguish the differences between the different treatment ice wine samples, the known volatile compounds identified by GC-IMS were analyzed by PCA (Figure 4). Eight treatment groups of samples were well differentiated according to their aroma characteristics. PCA was performed on the samples to discriminate the magnitude of variability between the samples of the groups of different wines, between subgroups, and between samples within groups. The contribution rate of PC1 was 28.4%, and that of PC2 was 21.1%, and the eight groups of samples showed apparent separation trends on the two-dimensional graph, with no outlier samples. The samples of the same kind of wines were clustered well, with high experimental reproducibility. The PCA results show that the differences in aroma substances among the eight groups of samples are significant and clearly distinguishable from other samples. As shown in the figure, it can be seen that the four treatments of A, B, H, and E clustered together, the treatment groups of C and D clustered together, and the groups of G and F clustered together, which indicated that the volatile compounds were similar between these treatment groups. The concentration of the aroma compounds was also somewhat different between the different treatments.

2.5.1. OAV Analysis of Major Aroma Compounds of Different Wine Samples

Generally, the components with OAV greater than one directly impacts the overall flavor and are the main components providing the flavor [50,51,52]. Based on the qualitative and quantitative results of GC–IMS, the threshold values of corresponding aroma compounds in water were found in the literature, and their OAV values were calculated. As shown in Table 6, a total of 21 aroma compounds with OAV values greater than one were detected in different ice wine samples, which were ethyl caprylate, 1-hexanol-M, ethyl caproate, 3-methyl-1-butanol, isoamyl acetate, hexanal, 2-methyl-1-propanol, ethyl butyrate, isobutyl acetate, pentanal, ethyl acrylate, ethyl isobutyrate, ethyl acetate, acetone, acetaldehyde, propionaldehyde, (Z)-3-hexenyl acetate, ethyl 3-methyl butanoate-M, ethyl 3-methyl butanoate-D, butyraldehyde, and 3-methyl butanal; studies have shown that the OAV values are directly proportional to the contribution of aroma [53,54]. Among the compounds with OAV values greater than 1, esters accounted for the most significant proportion of ten, and the OAV values of esters were significantly higher than those of other types of compounds, indicating that esters contribute to the prominent aroma of ‘Beibinghong’ ice wine. This is also in line with the GC–IMS results, where esters contributed the primary aromas in ‘Beibinghong’ ice wine, dominated by fruity and floral notes [55], followed by aldehydes, with six aldehydes having OAVs greater than 1, indicating that the grassy aroma of aldehydes is also a significant contributor to the aroma of ‘Beibinghong’ ice wine; there was also a ketone compound of acetone among the compounds with an OAV value of greater than 1; and there were three alcohols, which is also a significant contributor to the iconic wine flavor of the ‘Beibinghong’ ice wine aroma.
Principal component analysis (PCA) is a multivariate statistical analysis technique. Many complex and hard–to–find variables in the original sample are represented by identifying several principal component factors. The regularity and variability between samples are assessed based on the contribution of the principal component factors in different samples [56]. The PCA results clearly showed that two principal components were extracted from the PCA analysis of the concentration of volatile aroma compounds with OVA values greater than 1 in different treatments of ‘Beibinghong’ ice wine samples in a relatively independent space (Figure 5a), with a contribution of 32.9% for PC1 and 29.3% for PC2. Among the different varietal treatments, D, C, and H were located at the junction of one and four quadrants and were positive on PC2. G and D were located in the first quadrant of the score and were positive on PC1 and PC2. F was located in the second quadrant and was positive on PC1 and negative on PC2. E was located in the third quadrant and was negative on PC1 and PC2, and A and B were located in the junction of the third and fourth quadrants and were negative on PC1. This indicates significant differences in the volatile aroma compounds with OVA values greater than 1 in the ‘Beibinghong’ ice wine samples from different treatments. However, specific treatment groups also showed similarities in the aroma compounds with OAV values greater than 1.
Clustering of the concentration of volatile aroma compounds in nine sample wines with OVA values greater than 1. Based on the sample heat map analysis (Figure 5b), it was seen that the red color indicated that the aroma compound component was highly expressed in the sample, and the blue color indicated that the aroma compound was expressed at a lower level in the sample. The concentration of volatile aroma compounds with an OVA value of greater than 1 varied considerably among the samples of each variety. In general, most volatile aroma compounds with high aroma intensity values also have high OAV [57]; moreover, the two methods can be mutually verified. However, a small number of volatile aroma compounds also have low OAV despite high aroma intensity values, or vice versa. In this experiment, screening volatile aroma compounds between different treatment groups using OAV values can more accurately extract the critical volatile aroma compounds that may affect the aroma of ‘Beibinghong’ ice wine.

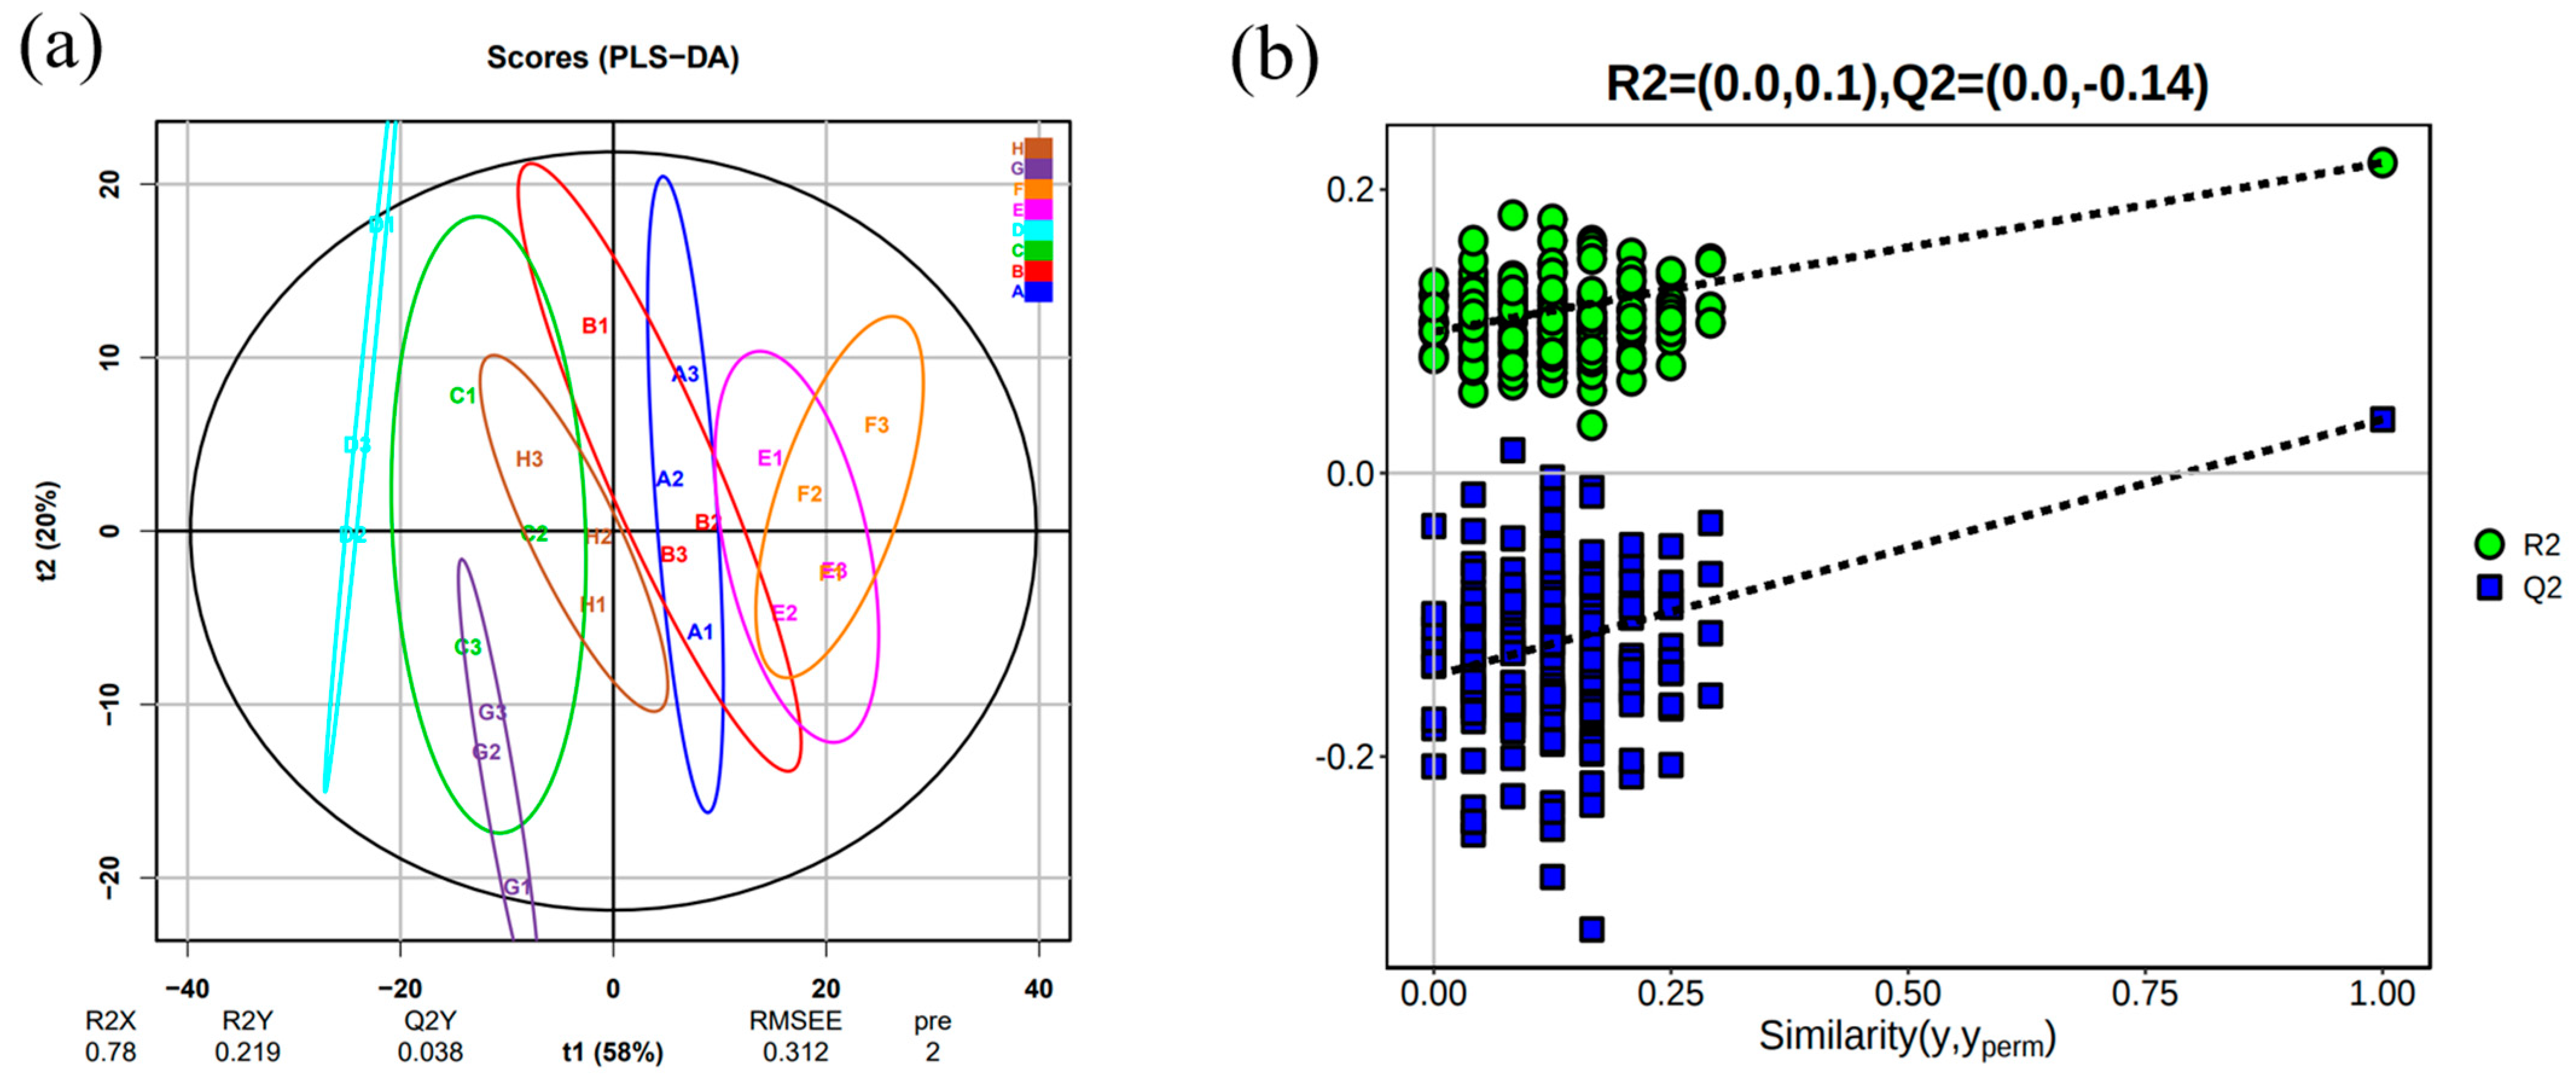
2.5.2. Analysis of Volatile Compounds 0PLS-DA in Wine

OPLS-DA is a statistical method for supervised discriminant analysis [54,58,59]. The contribution of each variable to the flavor of the wine was further quantified according to the variable important for the projection (VIP) in the OPLS-DA model [59]. OPLS-DA was validated with 200 permutations and found that R2 and Q2 were more significant than the model after Y replacement (Figure 6b). Thus, the model predictions were reliable, and variables with VIP > 1 could be used as potential biomarkers. This experiment used the OVA values of compounds with an OAV value greater than 1 in the composition of wine samples from different varieties as Y variables for OPLS-DA analysis.
Screening of compounds with VIP values > 1 as marker compounds for wine (Table 7). The results revealed that the compounds that may affect the aroma differences at different SO2 concentration treatments might be related to ethyl butyrate, ethyl propionate, ethyl 3-methyl butyrate-M, ethyl 3-methyl butyrate-D, and 3-methyl butyraldehyde.

2.6. Sensory Evaluation of ‘Beibinghong’ Ice Wine Brewed with Different Concentrations of SO2

Sensory evaluation is a crucial way for consumers to assess the quality of a wine [60]. Sensory evaluation of wines influences consumer choice. As seen in the sensory evaluation, it can be found (Table 8) that the color and clarity of wine samples from the eight treatment groups were above 9 points, and their color and clarity scores were the highest in the sixth treatment group, and the aroma and taste scores were the highest in the third treatment group; the typicality of the wines from the third and the sixth treatment groups had the highest scores; the highest total score was obtained from the third treatment group, and the lowest total score was obtained from the first treatment group. In summary, the overall flavor of the ‘Beibinghong’ ice wines was the highest when SO2 was added to the ice wines at an added amount of 30 mg/L. Adding too little or too much SO2 can affect the wine’s flavor and lead to certain defects. Pelonnier-Magimel E et al. [30] studied whether the Bordeaux quality wines without added SO2 have their typicality to assess the organoleptic specificity of the wines without added SO2. Finally, it was found that wines without added SO2 had a much higher frequency of defects than wines with added SO2 (70 percent and 15 percent, respectively). Therefore, the absence of SO2 in production can significantly impact the wine’s flavor. If the wine is to maintain its typicality in production, as little SO2 as possible can be added, while ensuring the flavor and bactericidal effect [34,61].

3. Conclusions

In this study, we investigated the effects of SO2 addition on the fermentation process and volatile aroma compounds of ‘Beibinghong’ ice wine. The basic physicochemical properties of ice wine and the types and contents of volatile aroma compounds were analyzed in different SO2 treatment groups, and the fingerprints of volatile compounds in ice wine brewed with different concentrations of SO2 were constructed. In this study, it was found that the fermentation time of ice wine was shortest and the total acid content was relatively low at 10 mg/L, but the types and contents of volatile aroma compounds did not increase significantly; the total content of volatile aroma compounds of ice wine was highest at 80 mg/L. OPLS-DA calculated the VIP values, and the joint analysis of OAV and VIP values further identified five compounds: ethyl butyrate, ethyl propionate, ethyl 3-methyl butyrate-M, ethyl 3-methyl butyrate-D, and 3-methyl butyraldehyde, which were significantly different among the groups treated with different concentrations of SO2. These compounds might be the critical factors of the effect of SO2 on the volatile aroma compounds of the ‘Beibinghong’ ice wine. These compounds may be critical factors in the effect of SO2 on the volatile aroma compounds of ‘Beibinghong’ ice wine. Tasting of ‘Beibinghong’ ice wine with different SO2 additions revealed that the overall flavor of ‘Beibinghong’ ice wine was the highest at 30 mg/L. In conclusion, the wine’s best accumulation of nutrients and flavor was achieved at 30 mg/L of SO2 additions. To some extent, this experiment reflects the differences in the quality of wines at different concentrations of SO2 through micro-winemaking, which provided a reference for the development and promotion of wines, and the results of the study provided a basis for optimizing the fermentation process of the ‘Beibinghong’ ice wine. As SO2 is a cheap and effective wine preservative, its complete replacement is not feasible. The optimum level of SO2 addition in the production of ‘Beibinghong’ ice wine was investigated in order to minimize the excessive use of SO2 in wine production. The results of this study provide some theoretical basis for optimizing the fermentation process of ‘Beibinghong’ ice wine and improving the quality of ice wine.

Author Contributions

Conceptualization, B.Z.; Software, W.C.; Validation, W.C.; Formal analysis, H.Q. and S.F.; Investigation, B.Z.; Resources, W.L.; Data curation, C.L., Z.Z. and P.X.; Writing—original draft, B.Z.; Writing—review & editing, Y.L.; Visualization, C.L. and Y.Y.; Supervision, B.Z.; Project administration, W.L.; Funding acquisition, W.L. All authors have read and agreed to the published version of the manuscript.

Funding

This work was supported by the Science and Scientific and Technologic Foundation of Jilin Province (20190301056NY).

Institutional Review Board Statement

Ethics approval was obtained from the Institute of Special Animal and Plant Sciences of Chinese Academy of Agricultural Sciences (Approval Date: 10 May 2020).

Informed Consent Statement

Informed consent was obtained from all subjects involved in the study.

Data Availability Statement

The original contributions presented in the study are included in the article, further inquiries can be directed to the corresponding author.

Conflicts of Interest

The authors declare that they have no competing interests. Compliance with Ethics Requirements: This article does not contain any studies with human or animal subjects.

References

  1. Penghui, L.; Yuanlong, J.; Donglin, C.; Xinyuan, W.; Jiahua, L.; Rongchen, Z.; Zhitong, W.; Yang, H.; Liankui, W. Study on the relationship between flavor components and quality of ice wine during freezing and brewing of ‘beibinghong’ grapes. Food Chem. X 2023, 20, 101016. [Google Scholar]
  2. Lan, Y.-B.; Qian, X.; Yang, Z.-J.; Xiang, X.-F.; Yang, W.-X.; Liu, T.; Zhu, B.-Q.; Pan, Q.-H.; Duan, C.-Q. Striking changes in volatile profiles at sub-zero temperatures during over-ripening of ‘Beibinghong’ grapes in Northeastern China. Food Chem. 2016, 212, 172–182. [Google Scholar] [CrossRef] [PubMed]
  3. Song, R.; Lu, W.; Shen, Y. New Grape Winemaking Variety-Beibinghong. J. Acta Hortic. Sin. 2008, 35, 1085. [Google Scholar]
  4. Liu, Y.; Fan, S.; Yang, Y.; Zhang, B.; Qin, H.; Lu, W. Effects of Different Fertilization Amounts on Nutrient Elements Accumulation, Yield and Quality of ‘Beibinghong’ Grape. North. Hortic. 2023, 7, 46–51. [Google Scholar]
  5. Li, C.; Liu, Y.; Fan, S.; Yang, Y.; Lu, W. Current Situation and Preview of ‘Beibinghongs’ Cultivation. Spec. Wild Econ. Anim. Plant 2019, 41, 125–128. [Google Scholar] [CrossRef]
  6. Na, L.; Guanyu, L.; Aihua, L.; Yongsheng, T. Synergy Effect between Fruity Esters and Potential Odorants on the Aroma of Hutai-8 Rose Wine Revealed by Threshold, S-Curve, and σ-τ Plot Methods. J. Agric. Food Chem. 2023, 71, 13869–13879. [Google Scholar]
  7. Peng, X.; Yang, X.; Aisaiti, A.; Yang, F.; Li, Z.; Li, H. Effects of different concentrations of free SO2 and dissolved oxygen on wine color and anthocyanins content. Food Mach. 2022, 38, 11–16+23. [Google Scholar] [CrossRef]
  8. Li, Q.; Zhang, X.; Niu, G.; Dang, Y.; Sun, S. Determination of Wine by Inductively Coupled Plasma Emission Spectrometry (ICP-OES) Study on Sulfur Dioxide Method. Food Nutr. China 2023, 29, 17–20. [Google Scholar] [CrossRef]
  9. Sara, W.; Pascaline, R.; Soizic, L.; Laura, F.; Georgia, L.; Margaux, C.; Jean-Christophe, B.; Joana, C.; Joana, T.; Isabelle, M.-P. Non-Saccharomyces yeasts as bioprotection in the composition of red wine and in the reduction of sulfur dioxide. LWT 2021, 149, 111781. [Google Scholar]
  10. Mu, J.; Wang, Y.; Liu, J.; Zhao, X. The Changes of the SO2 during the Alcohol Fermentation Process in Wine. Food Res. Dev. 2011, 32, 53–55. [Google Scholar]
  11. Yildirim, H.K. Alternative methods of sulfur dioxide used in wine production. J. Microbiol. Biotechnol. Food Sci. 2020, 9, 675–687. [Google Scholar] [CrossRef]
  12. The National Standard for Food Safety Packaged Drinking Water (GB19298-2014), the National Standard for Food Safety Use of Food Additives (GB2760-2014) and 37 other national food safety standards were issued. Beverage Ind. 2014, 17, 46–47.
  13. GB 7718-2011; General Principles for the Labelling of Prepackaged Foods Promulgated and Implemented. Ministry of Health: Wellington, New Zealand, 2011.
  14. Lin, Z. Analysis and Prospects of Sulfur Dioxide Residues in Wine. Food Ind. 2023, 12, 104–106. [Google Scholar]
  15. Wang, H.; Tian, X.; Yang, C.; Han, Y.; Shi, X.; Li, H. Wine and health. China Brew. 2022, 41, 1–5. [Google Scholar]
  16. Du, F.; Huang, Y.; Liu, Z.; Miao, J.; Lai, K. Effects of pH, linoleic acid, and reheating on volatile compounds in glucose-lysine model system. Food Biosci. 2024, 58, 103631. [Google Scholar] [CrossRef]
  17. Wang, X.; Dang, C.; Liu, Y.; Ge, X.; Suo, R.; Ma, Q.; Wang, J. Effect of indigenous Saccharomyces cerevisiae strains on microbial community successions and volatile compounds changes during Longyan wine fermentation. Food Biosci. 2024, 57, 103595. [Google Scholar] [CrossRef]
  18. Prezioso, I.; Fioschi, G.; Rustioni, L.; Mascellani, M.; Natrella, G.; Venerito, P.; Gambacorta, G.; Paradiso, V.M. Influence of prolonged maceration on phenolic compounds, volatile profile and sensory properties of wines from Minutolo and Verdeca, two Apulian white grape varieties. Lebensm.-Wiss. Technol. 2024, 192, 115698. [Google Scholar] [CrossRef]
  19. Ju, Y.L.; Xu, X.L.; Yu, Y.K.; Liu, M.; Wang, W.N.; Wu, J.R.; Liu, B.C.; Zhang, Y.; Fang, Y.L. Effects of winemaking techniques on the phenolics, organic acids, and volatile compounds of Muscat wines. Food Biosci. 2023, 54, 102937. [Google Scholar] [CrossRef]
  20. Weiyu, C.; Nan, S.; Jinli, W.; Yiming, Y.; Yanli, W.; Wenpeng, L. Widely Targeted Metabolomics Was Used to Reveal the Differences between Non-Volatile Compounds in Different Wines and Their Associations with Sensory Properties. Foods 2023, 12, 290. [Google Scholar] [CrossRef]
  21. Shu, N. Study on Fermentation Characteristics and Dry Red WineBrewing Technology of New Vitis amurensis Cultivar ‘Beiguohong’. Master’s Thesis, Chinese Academy of Agricultural Sciences, Beijing, China, 2019. [Google Scholar]
  22. Yonghong, Y.; Songyan, Z.; Yuanxing, W. Analysis of aroma components changes in Gannan navel orange at different growth stages by HS-SPME-GC–MS, OAV, and multivariate analysis. Food Res. Int. 2024, 175, 113622. [Google Scholar]
  23. Qianqian, L.; Bei, L.; Rong, Z.; Shuyan, L.; Shupeng, Y.; Yi, L.; Jianxun, L. Flavoromics Approach in Critical Aroma Compounds Exploration of Peach: Correlation to Origin Based on OAV Combined with Chemometrics. Foods 2023, 12, 837. [Google Scholar] [CrossRef] [PubMed]
  24. Yijin, Y.; Lianzhong, A.; Zhiyong, M.; Haodong, L.; Xin, Y.; Li, N.; Hui, Z.; Yongjun, X. Flavor compounds with high odor activity values (OAV > 1) dominate the aroma of aged Chinese rice wine (Huangjiu) by molecular association. Food Chem. 2022, 383, 132370. [Google Scholar]
  25. ISO 8586-2:2008; Sensory analysis. General Guidelines for the Selection, Training and Monitoring of Assessors. Part 2: Professional Sensory Assessors. ISO: Geneva, Switzerland, 2008.
  26. ISO 8586:2012; Sensory Analysis. General Guidelines for the Selection, Training and Monitoring of Selected Assessors and Specialised Sensory Assessors. ISO: Geneva, Switzerland, 2012.
  27. Jin, Y.; Shu, N.; Xie, S.; Cao, W.; Xiao, J.; Zhang, B.; Lu, W. Comparison of ‘Beibinghong’ dry red wines from six producing areas based on volatile compounds analysis, mineral content analysis, and sensory evaluation analysis. Eur. Food Res. Technol. 2021, 247, 1461–1475. [Google Scholar] [CrossRef]
  28. Kim, B.H.; Park, S.K. Volatile aroma and sensory analysis of black raspberry wines fermented by different yeast strains. J. Inst. Brew. 2015, 121, 87–94. [Google Scholar] [CrossRef]
  29. Sun, H.; Wu, Y. Sulphur dioxide in the wine industry. Deciduous Fruits 1996, S1, 45–46. [Google Scholar] [CrossRef]
  30. Pelonnier-Magimel, E.; Mangiorou, P.; Philippe, D.; De Revel, G.; Jourdes, M.; Marchal, A.; Marchand, S.; Pons, A.; Riquier, L.; Tesseidre, P.L.; et al. Sensory characterisation of Bordeaux red wines produced without added sulfites. Oeno One 2020, 54, 687–697. [Google Scholar] [CrossRef]
  31. Tian, B.; Yuan, M.; Yuan, X. Determination of Dry Leachate in Wine by FOSS Instrument—Specific Gravity Bottle Method. Sino-Overseas Grapevine Wine 2016, 4, 39–41. [Google Scholar] [CrossRef]
  32. Liu, X.; Xing, J.; Feng, J.; Chen, J.; Jiao, Y.; Yang, B. Research progress on copigmentation of red wine. China Brew. 2023, 42, 9–14. [Google Scholar]
  33. Margherita, M.; Gianmarco, A.; Anna, M.; Roberto, F.; Serena, F.; Milena, P.; Isabella, T.; Fabio, M.; Andrea, B. Using ethanol as postharvest treatment to increase polyphenols and anthocyanins in wine grape. Heliyon 2024, 10, e26067. [Google Scholar] [CrossRef]
  34. Ferreira, V.; Carrascon, V.; Bueno, M.; Ugliano, M.; Fernandez-Zurbano, P. Oxygen Consumption by Red Wines. Part I: Consumption Rates, Relationship with Chemical Composition, and Role of SO2. J. Agric. Food Chem. 2015, 63, 10928–10937. [Google Scholar] [CrossRef]
  35. Christofi, S.; Malliaris, D.; Katsaros, G.; Panagou, E.; Kallithraka, S. Limit SO2 content of wines by applying High Hydrostatic Pressure. Innov. Food Sci. Emerg. Technol. 2020, 62, 102342. [Google Scholar] [CrossRef]
  36. Oliveira, C.M.; Ferreira, A.C.S.; Freitas, V.D.; Silva, A.M.S. Oxidation mechanisms occurring in wines. Food Res. Int. 2011, 44, 1115–1126. [Google Scholar] [CrossRef]
  37. Ribéreau-Gayon, P.; Dubourdieu, D.; Donèche, B.; Lonvaud, A. Handbook of Enology, Volume 1: The Microbiology of Wine and Vinifications; John Wiley & Sons: Hoboken, NJ, USA, 2006; Volume 1. [Google Scholar]
  38. Dallas, C.; Laureano, O. Effects of pH, sulphur dioxide, alcohol content, temperature and storage time on colour composition of a young Portuguese red table wine. J. Sci. Food Agric. 1994, 65, 477–485. [Google Scholar] [CrossRef]
  39. Sáenz-Navajas, M.-P.; Henschen, C.; Cantu, A.; Watrelot, A.A.; Waterhouse, A.L. Understanding microoxygenation: Effect of viable yeasts and sulfur dioxide levels on the sensory properties of a Merlot red wine. Food Res. Int. 2018, 108, 505–515. [Google Scholar] [CrossRef] [PubMed]
  40. Bakker, J.; Bridle, P.; Bellworthy, S.; Garcia-Viguera, C.; Reader, H.; Watkins, S. Effect of sulphur dioxide and must extraction on colour, phenolic composition and sensory quality of red table wine. J. Sci. Food Agric. 1998, 78, 297–307. [Google Scholar] [CrossRef]
  41. Miao, L.; Zhao, X.; Han, A.; Jiang, K. The Main Influencing Factors of Anthocyanins in Red Wine. Liquor-Mak. Sci. Technol. 2016, 2, 40–46. [Google Scholar] [CrossRef]
  42. Coetzee, C.; Lisjak, K.; Nicolau, L.; Kilmartin, P.; du Toit, W.J. Oxygen and sulfur dioxide additions to Sauvignon blanc must: Effect on must and wine composition. Flavour Fragr. J. 2013, 28, 155–167. [Google Scholar] [CrossRef]
  43. Liu, P.-T.; Zhang, B.-Q.; Duan, C.-Q.; Yan, G.-L. Pre-fermentative supplementation of unsaturated fatty acids alters the effect of overexpressing ATF1 and EEB1 on esters biosynthesis in red wine. Lebensm.-Wiss. Technol. 2020, 120, 108925. [Google Scholar] [CrossRef]
  44. Yang, Z.; Zhang, Z.; He, Y.; Zhu, C.; Hu, B. Effect of fermentation with peel on volatile compounds in Kiwi wines based on Headspace Solid Phase Microextraction-Gas Chromatography-Mass Spectrometry and Gas Chromatography-Ion Mobility Spectrometry. Food Sci. 2024, 1–14. [Google Scholar]
  45. Wei, G.; Yang, X.; Zhou, Y.; Zeng, F.; Zhang, H. Review on research progress of esters in wine. Sci. Technol. Food Ind. 2015, 36, 394–399. [Google Scholar] [CrossRef]
  46. Garde-Cerdán, T.; Ancín-Azpilicueta, C. Effect of SO2 on the formation and evolution of volatile compounds in wines. Food Control 2007, 18, 1501–1506. [Google Scholar] [CrossRef]
  47. Liu, J.; Zhang, B.; Zhu, B.; Duan, C.; Yan, G. Effect of pretreatment of sulfur dioxide preservative on aroma and biogenic amines contents in wines. China Brew. 2020, 39, 32–39. [Google Scholar]
  48. Santos, T.P.M.; Alberti, A.; Judacewski, P.; Zielinski, A.A.F.; Nogueira, A. Effect of sulphur dioxide concentration added at different processing stages on volatile composition of ciders. J. Inst. Brew. 2018, 124, 261–268. [Google Scholar] [CrossRef]
  49. Daniel, M.A.; Elsey, G.M.; Capone, D.L.; Perkins, M.V.; Sefton, M.A. Fate of damascenone in wine: The role of SO2. J. Agric. Food Chem. 2004, 52, 8127–8131. [Google Scholar] [CrossRef] [PubMed]
  50. Zheng, Y.; Li, Y.; Pan, L.; Guan, M.; Yuan, X.; Li, S.; Ren, D.; Gu, Y.; Liang, M.; Yi, L. Aroma and taste analysis of pickled tea from spontaneous and yeast-enhanced fermentation by mass spectrometry and sensory evaluation. Food Chem. 2024, 442, 138472. [Google Scholar] [CrossRef] [PubMed]
  51. Weiyu, C.; Nan, S.; Jinli, W.; Yiming, Y.; Yuning, J.; Wenpeng, L. Characterization of the Key Aroma Volatile Compounds in Nine Different Grape Varieties Wine by Headspace Gas Chromatography–Ion Mobility Spectrometry (HS-GC-IMS), Odor Activity Values (OAV) and Sensory Analysis. Foods 2022, 11, 2767. [Google Scholar] [CrossRef] [PubMed]
  52. Yue, M.; Noëlle, B.; Ke, T.; Yuanyi, L.; Marie, S.; Yan, X.; Thierry, T.-D. Assessing the contribution of odor-active compounds in icewine considering odor mixture-induced interactions through gas chromatography–olfactometry and Olfactoscan. Food Chem. 2022, 388, 132991. [Google Scholar]
  53. Lan, Y.-B.; Xiang, X.-F.; Qian, X.; Wang, J.-M.; Ling, M.-Q.; Zhu, B.-Q.; Liu, T.; Sun, L.-B.; Shi, Y.; Reynolds, A.G.; et al. Characterization and differentiation of key odor-active compounds of ‘Beibinghong’ icewine and dry wine by gas chromatography-olfactometry and aroma reconstitution. Food Chem. 2019, 287, 186–196. [Google Scholar] [CrossRef] [PubMed]
  54. Xu, Q.; Mengqi, L.; Yanfeng, S.; Fuliang, H.; Ying, S.; Changqing, D.; Yibin, L. Decoding the aroma characteristics of icewine by partial least-squares regression, aroma reconstitution, and omission studies. Food Chem. 2024, 440, 138226. [Google Scholar]
  55. Marine, T.; Marina, B.; Warren, A.; Isabelle, M.; Benoit, C.; Philippe, M.; JeanChristophe, B. Impact of Grape Maturity on Ester Composition and Sensory Properties of Merlot and Tempranillo Wines. J. Agric. Food Chem. 2022, 70, 11520–11530. [Google Scholar]
  56. Sebzalli, Y.M.; Wang, X.Z. Knowledge discovery from process operational data using PCA and fuzzy clustering. Eng. Appl. Artif. Intell. 2001, 14, 607–616. [Google Scholar] [CrossRef]
  57. Yi, F.; Ma, N.; Zhu, J. Identification of Characteristic Aroma Compounds in Soy Sauce Aroma Type Xi Baijiu Using Gas Chromatography-Olfactometry, Odor Activity Value and Feller’s Additive Model. Food Sci. 2022, 43, 242–256. [Google Scholar]
  58. Xiangwu, H.; Lihong, Z.; Sheng, P.; Yijun, L.; Jianrong, L.; Meiqian, Z. Effects of Varieties, Cultivation Methods, and Origins of Citrus sinensis ‘hongjiang’ on Volatile Organic Compounds: HS-SPME-GC/MS Analysis Coupled with OPLS-DA. Agriculture 2022, 12, 1725. [Google Scholar] [CrossRef]
  59. Li, C.; Wang, Y.; Lv, Y.; Qiu, X.; Wu, B.; Ma, T.; Fang, Y.; Sun, X. Physicochemical characterization and antioxidant capacity analysis of commercial Marselan wines from Ningxia and Hebei regions based on OPLS-DA. Food Ferment. Ind. 2023, 49, 283–292. [Google Scholar] [CrossRef]
  60. Qi, Y.; Wang, M.; Wan, N.; Yin, D.; Wei, M.; Sun, X.; Fang, Y.; Ma, T. Sensory characteristics of “Shine Muscat” grapes based on consumer reviews and human and intelligent sensory evaluation. Lebensm.-Wiss. Technol. 2024, 195, 115810. [Google Scholar] [CrossRef]
  61. Valásek, P.; Mlcek, J.; Fisera, M.; Fiserová, L.; Sochor, J.; Baron, M.; Juríková, T. Effect of various sulphur dioxide additions on amount of dissolved oxygen, total antioxidant capacity and sensory properties of white wines. Mitteilungen Klosterneubg. 2014, 64, 193–200. [Google Scholar]
Figure 1. Fingerprints of volatile compounds of ‘Beibinghong’ ice wine under different treatments (Note: A–H are the amounts of SO2 added, in the order of 10 mg/L, 20 mg/L, 30 mg/L, 40 mg/L, 50 mg/L, 60 mg/L, 80 mg/L, and 100 mg/L. Same below).
Foods 13 01247 g001
Figure 2. HS-GC-IMS 2D spectrum (top view). Note: The background of the whole graph is blue, and the red vertical line at horizontal coordinate 1.0 is the RIP peak (reactive ion peak, normalized). The vertical coordinate represents the retention time (s) of the gas chromatogram, and the horizontal coordinate represents the ion migration time (normalized). Each point on both sides of the RIP peak represents a volatile organic compound.
Foods 13 01247 g002
Figure 3. HS-GC-IMS difference spectrum of the sample. Note: Using A as a reference, the rest of the spectrum subtracts the signal peaks in A to obtain the difference spectrum between the two. Blue areas indicate less substance in this sample than in A. Red areas indicate more substance in this sample than in A. The darker the color, the more significant the difference. The difference between the samples can be seen from the above graph.
Foods 13 01247 g003
Figure 4. PCA analysis of the sample.
Foods 13 01247 g004
Figure 5. (a) PCA plots and (b) thermograms of volatile aroma compounds with OVA values greater than 1 in ice samples from different treatments of ‘Beibinghong’.
Foods 13 01247 g005
Figure 6. Analysis of different treatments of ‘Beibinghong’ ice wine samples OPLSA-DA ((a) Score chart of the OPLS-DA model of the sample, (b) Sample replacement test chart).
Foods 13 01247 g006
Table 1. Gas chromatography conditions.
Time (Min:Sec)E1E2Recording
00:00,000150 mL/min2 mL/minrec
02:00,000150 mL/min2 mL/min-
10:00,000150 mL/min10 mL/min-
20:00,000150 mL/min100 mL/min-
30:00,000150 mL/min100 mL/minstop
Table 2. Sensory score.
ItemPercentageFeaturesFull Marks
Color10%Chroma and hue10
Clarification10%Degree of clarification10
Aroma30%Finesse5
Richness5
Coherence5
Variety characteristics5
Duration5
Variation and complexity (multiple levels of aroma)5
Taste40%Balance and coordination10
Body and fullness (weightiness in the mouth)10
Texture and structure5
Continuity and layers5
Flavor quality and persistence5
Lingering flavor5
Typicality10%Synthesize and evaluate10
Totals 100
Table 3. Fermentation process and basic physicochemical indexes of ‘Beibinghong’ ice wine with different SO2 additions.
SO2 Concentration (mg/L)Start of Fermentation (h)End of Fermentation (days)Soluble Solids (%)Total Sugar (g/L)Total Acid (g/L)Dry Extract (g/L)Alcohol Content (v/v)
1024 ± 0 f23 ± 1 e26.3 ± 0.5 b162.66 ± 13.2 d11.36 ± 0.41 bc151.24 ± 15.61 d11.5 ± 0.50 bc
2072 ± 0 d34 ± 3 d26.5 ± 2.0 b163.57 ± 8.06 c11.28 ± 1.10 c150.33 ± 7.58 e11.5 ± 0.36 bc
3048 ± 0 e34 ± 3 d25.4 ± 1.7 c162.19 ± 5.13 d11.26 ± 1.65 c153.71 ± 6.42 b12 ± 1.0 a
4048 ± 0 e23 ± 1 e26.5 ± 1.0 b160.96 ± 10.7 e11.32 ± 0.26 bc156.94 ± 13.33 a11.5 ± 0.72 bc
5048 ± 0 e21 ± 2 f26.7 ± 2.0 b161.08 ± 4.5 e11.48 ± 0.15 abc152.82 ± 17.21 c11.5 ± 0.21 bc
6096 ± 0 c35 ± 4 c27.8 ± 1.0 a164.69 ± 5.57 b11.65 ± 1.03 abc149.21 ± 4.31 f11 ± 0.06 cd
80168 ± 0 b64 ± 9 a28.3 ± 0.8 a168.73 ± 11.02 a12.06 ± 1.02 ab145.17 ± 15.30 g10.5 ± 0.42 d
100192 ± 0 a38 ± 5 b28.5 ± 1.7 a168.92 ± 19.20 a12.15 ± 0.78 a144.98 ± 7.06 g10.5 ± 0.11 d
Means with different letters in the same column express significant differences (Duncan’s test p < 0.05).
Table 4. Content of anthocyanin in ‘Beibinghong’ ice wine with different SO2 additions.
SO2 (mg/L)10203040506080100
Total anthocyanin (µg/L)126.63 ± 11.26 h133.87 ± 7.48 f155.86 ± 2.51 c135.26 ± 9.06 e140.27 ± 3.29 d172.56 ± 11.38 b194.26 ± 26.93 a132.76 ± 18.71 g
Means with different letters in the same column express significant differences (Duncan’s test p < 0.05).
Table 5. Composition of volatile compounds in ‘Beibinghong’ ice wine treated with different concentrations of SO2.
Serial No.Retention Time (sec)SubstancesAroma DescriptionSubstance Content (µg/L)
Sample No. 1Sample No. 2Sample No. 3Sample No. 4Sample No. 5Sample No. 6Sample No. 7Sample No. 8
11080.89Ethyl octanoate Apricot, Brandy, Fat, Floral, Pineapple322.722 ± 19.384347.309 ± 13.027296.373 ± 17.554248.987 ± 13.003376.587 ± 32.87419.786 ± 8.103360.532 ± 17.447310.012 ± 6.096
2886.48Ethyl lactate-MCheese, Floral, Fruit, Pungent, Rubber357.994 ± 50.581330.748 ± 9.635345.173 ± 6.24393.777 ± 9.815378.219 ± 11.958302.744 ± 2.979333.986 ± 37.971318.373 ± 5.942
3885.16Ethyl lactate-DCheese, Floral, Fruit, Pungent, Rubber41.248 ± 10.96727.997 ± 2.46530.767 ± 4.56433.067 ± 6.44528.271 ± 3.1629.047 ± 5.95231.753 ± 3.37929.832 ± 3.881
4707.83Ethyl hexanoateCheese, Floral, Fruit, Pungent, Rubber408.356 ± 25.405414.364 ± 31.845360.863 ± 18.269322.325 ± 11.466548.61 ± 17.016555.558 ± 18.26394.243 ± 29.17382.963 ± 9.191
5526.01Isoamyl acetate Apple, Banana, Pear2867.294 ± 58.4012775.802 ± 94.5773217.441 ± 64.1183539.672 ± 96.5812949.724 ± 2.7123181.046 ± 71.3883621.83 ± 67.2443319.403 ± 54.505
6409.12Ethyl butanoate pineapple flavor712.02 ± 17.695653.213 ± 6.981577.538 ± 7.574417.204 ± 11.829765.006 ± 29.341725.577 ± 20.563580.78 ± 6.748617.956 ± 16.818
7383.33isobutyl acetate Apple, Banana, Floral, Herb266.451 ± 3.555255.106 ± 3.543297.941 ± 9.633308.365 ± 5.877224.468 ± 3.165377.387 ± 14.584512.87 ± 10.248302.304 ± 2.072
8350.14propyl acetate Celery, Floral, Pear, Red Fruit589.059 ± 20.017535.422 ± 7.295571.309 ± 0.436561.966 ± 4.026554.909 ± 11.265327.439 ± 5.638295.958 ± 12.592600.24 ± 9.152
9336.31ethyl propanoate Apple, Pineapple, Rum, Strawberry904.927 ± 50.425783.426 ± 25.267827.193 ± 14.304760.554 ± 30.164802.542 ± 14.539479.4 ± 17.647460.67 ± 32.085845.108 ± 17.746
10340.92Ethyl isobutyrate fruit189.551 ± 5.722173.682 ± 1.248184.696 ± 6.095174.112 ± 6.533163.053 ± 6.197187.054 ± 6.442233.276 ± 8.061192.519 ± 1.879
11292.51Ethyl acetate Aromatic, Brandy, Grape10,270.327 ± 79.70210,043.96 ± 35.94410,070.65 ± 23.9239856.912 ± 39.4939926.147 ± 32.159879.314 ± 112.0629994.921 ± 63.21910,158.871 ± 27.223
12263.7Ethyl formate Pungent2485.568 ± 36.3042385.056 ± 11.9812380.013 ± 13.7852164.664 ± 5.4312485.498 ± 36.8822487.519 ± 7.5552639.144 ± 16.1112418.238 ± 6.044
13732.02Butyl butanoate Apple, pineapple flavor314.625 ± 20.591339.229 ± 24.721346.936 ± 5.068377.007 ± 20.819372.044 ± 14.43362.305 ± 5.044343.359 ± 12.26331.742 ± 9.67
14767.45(Z)-3-Hexenyl acetate Banana, floral51.247 ± 2.12350.296 ± 1.65657.74 ± 4.4760.325 ± 4.38950.99 ± 3.05949.451 ± 1.98152.637 ± 7.37352.258 ± 2.257
15516.1Butyl propionateFruit88.274 ± 3.0599.196 ± 7.89198.357 ± 5.90288.606 ± 7.85100.681 ± 5.435140.951 ± 4.581114.616 ± 7.30190.438 ± 1.154
16424.71Ethyl3-methylbutanoate-MApple, Mulberry Aroma119.992 ± 2.944113.215 ± 4.203123.41 ± 5.895121.37 ± 5.868114.138 ± 3.70698.191 ± 6.187128.856 ± 1.569119.214 ± 1.785
17424.09Ethyl3-methylbutanoate-DApple, Mulberry Aroma63.356 ± 8.17866.816 ± 14.99661.928 ± 9.26458.284 ± 8.34770.701 ± 3.64673.035 ± 5.26671.903 ± 6.92167.135 ± 8.382
18444.3Ethyl 2-methylbutanoateApple, Ester, Green Apple, Kiwi, Strawberry36.115 ± 0.75643.242 ± 5.61149.203 ± 7.37445.902 ± 3.92654.997 ± 4.22958.865 ± 4.47746.289 ± 4.71644.875 ± 2.32
No. of ester species18Total20,089.1258419,438.0804819,897.5319219,533.0973619,966.5866419,734.6676820,217.6234420,201.48088
%25.8224.6324.512425.0924.2724.6825.5
1908.811-Hexanol-MBanana, Flower, Grass, Herb761.642 ± 160.852664.524 ± 32.62709.027 ± 50.629695.845 ± 76.075637.454 ± 59.986802.564 ± 14.503823.121 ± 75.245650.641 ± 30.475
2907.51-Hexanol-DBanana, Flower, Grass, Herb230.981 ± 77.158172.311 ± 15.172194.661 ± 16.176197.904 ± 33.232181.147 ± 34.356246.892 ± 10.754286.767 ± 50.847173.555 ± 14.727
3672.363-Methyl-1-butanolbrandy11,466.999 ± 322.87211,589.634 ± 344.14712,161.029 ± 151.63312,360.758 ± 264.31111,737.75 ± 270.25411,990.457 ± 38.29912,405.587 ± 280.96211,910.102 ± 94.116
4560.941-ButanolFruit566.218 ± 48.597603.987 ± 42.987747.541 ± 51.003813.903 ± 68.365606.207 ± 54.248552.356 ± 4.052549.573 ± 59.427656.573 ± 8.621
5472.652-Methyl-1-propanolpungent odor5164.863 ± 71.0845345.103 ± 89.5435632.972 ± 81.4715768.918 ± 91.1365318.293 ± 89.9475916.619 ± 59.9666204.353 ± 51.9185508.228 ± 54.195
6408.341-Propanol Alcohol, Candy, Pungent2975.777 ± 47.0183039.996 ± 39.4333196.466 ± 54.5373380.095 ± 61.0273033.742 ± 44.1282616.758 ± 31.352550.967 ± 71.8813153.482 ± 10.22
7355.13Iso-propanolpungent odor205.871 ± 14.473209.079 ± 14.817222.704 ± 19.452202.013 ± 14.932183.215 ± 10.323187.335 ± 19.493207.814 ± 30.254204.116 ± 8.551
8316.72Ethanol alcoholic flavor27,126.098 ± 103.78927,986.877 ± 144.83928,515.642 ± 295.58328,715.711 ± 181.6628,281.016 ± 139.47329,096.813 ± 127.82928,853.397 ± 710.69327,325.985 ± 86.132
9304.42Methanolalcoholic flavor226.817 ± 10.88260.779 ± 9.167270.235 ± 1.287295.837 ± 5.807277.732 ± 4.16285.157 ± 7.154288.702 ± 19.969255.843 ± 5.281
10856.393-methyl-1-pentanol Fruit19.148 ± 1.4220.134 ± 0.73724.437 ± 1.32726.431 ± 2.35520.43 ± 1.55820.347 ± 1.47222.287 ± 1.95421.038 ± 0.308
11734.11-Pentanolalcoholic flavor207.371 ± 15.316214.742 ± 8.932226.28 ± 9.042230.289 ± 15.029209.406 ± 6.591221.346 ± 10.837226.752 ± 13.725207.941 ± 5.393
No. of alcohol species11Total48,951.78450,107.164851,900.9920852,687.7047250,486.3934451,936.6444852,419.3219250,067.50616
%62.963.4963.9364.7363.4563.8663.9863.2
11184.66Acetic acid-M Acid, Fruit, Pungent, Sour, Vinegar2054.497 ± 79.0132128.91 ± 70.7012107.461 ± 50.1392023.938 ± 65.2372100.214 ± 30.5932214.206 ± 13.9022077.372 ± 158.5192037.589 ± 46.317
21187.29Acetic acid-D Acid, Fruit, Pungent, Sour, Vinegar1451.248 ± 398.8131903.677 ± 96.5281755.035 ± 222.2021736.671 ± 70.5481608.712 ± 60.0582177.888 ± 122.5341989.475 ± 388.3281604.389 ± 116.831
31528.26Isobutyric acid Burnt, Butter, Cheese, Sweat175.997 ± 74.937277.775 ± 5.854311.54 ± 1.733261.381 ± 20.018246.378 ± 18.058212.109 ± 35.442179.723 ± 16.096206.798 ± 15.601
No. of acid species3Total3681.74244310.361444174.03564021.990563955.303524604.204644246.571283848.77752
%4.735.465.144.944.975.665.184.86
1518.25HexanalApple, Fat, Fresh, Green, Oil81.55 ± 4.56687.068 ± 0.79387.762 ± 6.2390.012 ± 7.24584.554 ± 2.101108.163 ± 4.545103.644 ± 10.97882.262 ± 0.496
2355.52Pentanalpungent odor234.398 ± 19.219230.222 ± 8.562236.699 ± 6.672225.716 ± 6.372234.86 ± 3.745193.785 ± 7.765208.26 ± 7.021227.682 ± 3.167
3230.52AcetaldehydeFloral, Green Apple591.445 ± 10.713610.715 ± 20.006638.589 ± 7.464562.302 ± 17.218614.15 ± 53.505638.151 ± 24.136609.98 ± 55.699552.894 ± 24.171
4265.32Propanalpungent odor492 ± 27.458491.237 ± 23.69517.149 ± 20.744526.488 ± 27.194481.319 ± 11.761489.426 ± 23.396506.841 ± 16.626504.963 ± 11.44
5299.69Butanallemon scent89.624 ± 4.03787.713 ± 3.45489.178 ± 1.0688.058 ± 6.82683.719 ± 1.9587.988 ± 3.2389.737 ± 2.04986.741 ± 1.879
61306.57Benzaldehyde Bitter Almond, Burnt Sugar, Cherry, Malt, Roasted Pepper115.298 ± 12.179136.866 ± 11.171155.016 ± 16.2136.091 ± 9.857134.335 ± 5.562139.781 ± 10.206134.194 ± 7.058129.152 ± 3.039
7309.353-Methylbutanalapple flavor72.15 ± 0.21157.976 ± 0.99334.274 ± 3.73438.078 ± 3.22273.824 ± 4.13573.536 ± 3.91139.255 ± 3.17344.275 ± 1.451
No. of aldehyde species7Total1676.462481701.797441758.66881666.74481706.760161730.828961691.91121627.96816
%2.152.162.172.052.142.132.072.06
1782.713-Hydroxy-2-butanone-MButtery166.582 ± 8.812151.271 ± 30.591143.925 ± 20.161144.25 ± 14.122130.308 ± 3.805128.757 ± 18.812131.074 ± 31.528125.517 ± 5.321
2781.393-Hydroxy-2-butanone-DButtery106.295 ± 15.86997.755 ± 7.259117.172 ± 15.478133.046 ± 15.23993.92 ± 9.74293.471 ± 4.586123.232 ± 21.554102.916 ± 3.284
3258.7AcetoneButter, Creamy, Green Pepper1019.321 ± 12.794988.156 ± 5.671014.408 ± 10.4681002.652 ± 12.9491002.012 ± 6.2281025.531 ± 11.4721002.946 ± 8.7491035.26 ± 10.713
4381.324-Methyl-2-pentanoneketone odor73.862 ± 2.16379.874 ± 1.46880.804 ± 1.75988.907 ± 4.275101.28 ± 4.113103.437 ± 1.217102.252 ± 2.736104.469 ± 1.763
5356.182-PentanoneFruit, Pungent209.642 ± 4.206202.415 ± 1.836193.008 ± 4.084160.568 ± 5.345184.14 ± 2.373170.299 ± 4.524190.478 ± 3.963204.548 ± 3.183
No. of ketone species5Total1575.70281519.47041549.317281529.423281511.657841521.497041549.979761572.70792
%2.021.931.911.881.91.871.891.99
1350.141 216.928 ± 6.115233.045 ± 1.731247.923 ± 7.816247.363 ± 4.28248.273 ± 5.335202.989 ± 9.454193.582 ± 8.193233.392 ± 2.338
2335.542 353.637 ± 9.007379.626 ± 7.302399.756 ± 16.515395.541 ± 21.29407.613 ± 1.878375.575 ± 10.84362.538 ± 14.597379.164 ± 5.413
3335.923 378.483 ± 11.402377.544 ± 1.911379.778 ± 14.451386.267 ± 18.497377.753 ± 17.064302.47 ± 5.513314.602 ± 16.398385.479 ± 8.25
4846.774 45.751 ± 10.7439.73 ± 3.06536.079 ± 1.48342.046 ± 3.42442.802 ± 1.53341.685 ± 3.22136.582 ± 8.86142.381 ± 3.375
5780.15 316.261 ± 31.987277.719 ± 49.572291.323 ± 53.825315.245 ± 28.833278.636 ± 8.194252.474 ± 40.115301.364 ± 77.458253.721 ± 10.992
6438.276 45.653 ± 2.39446.319 ± 1.66550.52 ± 3.75449.329 ± 2.22659.937 ± 0.19478.5 ± 5.71650.037 ± 0.97450.825 ± 0.44
7391.087 125.533 ± 8.327133.177 ± 4.903143.463 ± 11.165141.022 ± 3.036124.45 ± 2.218133.933 ± 15.61136.195 ± 8.149130.383 ± 2.378
8589.688 73.228 ± 2.13277.55 ± 2.72475.599 ± 3.33474.943 ± 1.96876.667 ± 0.70284.907 ± 3.38573.308 ± 3.22372.36 ± 3.653
9668.969 115.615 ± 1.826120.402 ± 6.387122.84 ± 4.661123.177 ± 4.685126.067 ± 4.301128.344 ± 4.744120.47 ± 5.171119.037 ± 0.98
10254.4110 71.712 ± 6.86666.46 ± 3.26269.208 ± 3.71467.92 ± 3.42766.642 ± 1.67869.151 ± 1.25870.994 ± 2.40471.019 ± 1.878
11383.5611 101.099 ± 13.28393.438 ± 2.73385.338 ± 5.32112.917 ± 11.088133.728 ± 7.189130.483 ± 9.075145.343 ± 8.451159.559 ± 1.114
No. of other categories11Total1843.897441845.010721901.82721955.770321942.567761800.510881805.014961897.3192
%2.372.342.342.42.442.262.22.4
Total77,818.7149678,921.8852881,182.3728881,394.7310479,569.2693681,328.3536881,930.4225679,215.75984
Note: Compound flavor description from the Flavornet database (https://www.femaflavor.org); http://www.flavornet.org; accessed on 6 June 2020.
Table 6. OAV analysis of major aroma compounds of ‘Beibinghong’ ice wine treated with different SO2 additions.
Serial No.SubstanceABCDEFGH
1Ethyl octanoate3.508 ± 0.2113.775 ± 0.1423.221 ± 0.1912.706 ± 0.1414.093 ± 0.3574.563 ± 0.0883.919 ± 0.193.37 ± 0.066
21-Hexanol-M1.523 ± 0.3221.329 ± 0.0651.418 ± 0.1011.392 ± 0.1521.275 ± 0.121.605 ± 0.0291.646 ± 0.151.301 ± 0.061
3Ethyl hexanoate81.671 ± 5.08182.873 ± 6.36972.173 ± 3.65464.465 ± 2.293109.722 ± 3.403111.112 ± 3.65278.849 ± 5.83476.593 ± 1.838
43-Methyl-1-butanol52.123 ± 1.46852.68 ± 1.56455.277 ± 0.68956.185 ± 1.20153.353 ± 1.22854.502 ± 0.17456.389 ± 1.27754.137 ± 0.428
5Isoamyl acetate7.168 ± 0.1466.94 ± 0.2368.044 ± 0.168.849 ± 0.2417.374 ± 0.0077.953 ± 0.1789.055 ± 0.1688.299 ± 0.136
6Hexanal16.31 ± 0.91317.414 ± 0.15917.552 ± 1.24618.002 ± 1.44916.911 ± 0.4219.817 ± 3.03920.729 ± 2.19616.452 ± 0.099
72-Methyl-1-propanol5.165 ± 0.0715.345 ± 0.095.633 ± 0.0815.769 ± 0.0915.318 ± 0.095.696 ± 0.4196.204 ± 0.0525.508 ± 0.054
8Ethyl butanoate791.133 ± 19.661725.792 ± 7.757641.709 ± 8.416463.56 ± 13.144850.006 ± 32.601838.845 ± 41.953645.312 ± 7.497686.617 ± 18.687
9isobutyl acetate10.658 ± 0.14210.204 ± 0.14211.918 ± 0.38512.335 ± 0.2358.979 ± 0.12713.266 ± 3.64420.515 ± 0.4112.092 ± 0.083
10Pentanal19.533 ± 1.60219.185 ± 0.71419.725 ± 0.55618.81 ± 0.53119.572 ± 0.31217.49 ± 2.18617.355 ± 0.58518.974 ± 0.264
11Ethyl propanoate90.493 ± 5.04278.343 ± 2.52782.719 ± 1.4376.055 ± 3.01680.254 ± 1.45459.23 ± 19.21546.067 ± 3.20884.511 ± 1.775
12Ethyl isobutyrate12.637 ± 0.38111.579 ± 0.08312.313 ± 0.40611.607 ± 0.43610.87 ± 0.41312.232 ± 0.84115.552 ± 0.53712.835 ± 0.125
13Ethyl acetate2.054 ± 0.0162.009 ± 0.0072.014 ± 0.0051.971 ± 0.0081.985 ± 0.0061.984 ± 0.0121.999 ± 0.0132.032 ± 0.005
14Acetone1.225 ± 0.0151.188 ± 0.0071.219 ± 0.0131.205 ± 0.0161.204 ± 0.0071.221 ± 0.0111.205 ± 0.0111.244 ± 0.013
15Acetaldehyde23.658 ± 0.42924.429 ± 0.825.544 ± 0.29922.492 ± 0.68924.566 ± 2.1424.719 ± 1.07324.399 ± 2.22822.116 ± 0.967
16Propanal6.074 ± 0.3396.065 ± 0.2926.385 ± 0.2566.5 ± 0.3365.942 ± 0.1456.029 ± 0.3016.257 ± 0.2056.234 ± 0.141
17(Z)-3-hexenyl acetate1.653 ± 0.0681.622 ± 0.0531.863 ± 0.1441.946 ± 0.1421.645 ± 0.0991.584 ± 0.0591.698 ± 0.2381.686 ± 0.073
18Ethyl 3-methylbutanoate-M1199.918 ± 29.4391132.15 ± 42.031234.101 ± 58.9481213.696 ± 58.6761141.382 ± 37.0581041.044 ± 103.4541288.565 ± 15.6881192.138 ± 17.852
19Ethyl 3-methylbutanoate-D633.563 ± 81.778668.157 ± 149.962619.284 ± 92.636582.841 ± 83.472707.005 ± 36.459716.13 ± 41.233719.029 ± 69.215671.354 ± 83.818
20Butanal5.637 ± 0.2545.517 ± 0.2175.609 ± 0.0675.538 ± 0.4295.265 ± 0.1235.451 ± 0.2825.644 ± 0.1295.455 ± 0.118
213-Methylbutanal180.374 ± 0.528144.94 ± 2.48285.685 ± 9.33595.195 ± 8.055184.561 ± 10.337185.264 ± 11.20998.137 ± 7.933110.689 ± 3.628
Table 7. Analysis of VIP values of aroma compounds in different treatments of ‘Beibinghong’.
SubstancesVIP Value
Ethyl butanoate2.741464
ethyl propanoate1.077886
Ethyl 3-methylbutanoate-M2.23449
Ethyl 3-methylbutanoate-D1.761919
3-Methylbutanal1.550059
Table 8. Sensory score.
ItemPercentageABCDEFGH
Color10%9.0 ± 0.069.1 ± 0.19.7 ± 0.159.2 ± 0.069.3 ± 0.219.9 ± 0.159.8 ± 0.109.7 ± 0.10
Clarification10%9.9 ± 0.0610 ± 010 ± 010 ± 010 ± 010 ± 010 ± 010 ± 0
Aroma30%26.4 ± 1.0227.2 ± 1.2529.3 ± 0.6728.4 ± 1.0228 ± 0.7827 ± 0.2126.7 ± 0.5326.1 ± 1.02
Taste40%36.1 ± 0.1736.4 ± 2.0839 ± 0.1537 ± 1.038.1 ± 0.0637.4 ± 1.0338 ± 0.5735.9±0.26
Typicality10%9.4 ± 0.159.5 ± 1.2110 ± 0.069.8 ± 1.159.6 ± 0.2710 ± 09.4 ± 0.219.7 ± 0.06
Totals100%90.7 ± 1.2092.2 ± 1.2798 ± 1.094.4 ± 0.5795 ± 1.094.3 ± 2.0793.9 ± 1.5291.4 ± 0.70
Disclaimer/Publisher’s Note: The statements, opinions and data contained in all publications are solely those of the individual author(s) and contributor(s) and not of MDPI and/or the editor(s). MDPI and/or the editor(s) disclaim responsibility for any injury to people or property resulting from any ideas, methods, instructions or products referred to in the content.

