Communication

Increased Effectiveness of Microbiological Verification by Concentration-Dependent Neutralization of Sanitizers Used in Poultry Slaughter and Fabrication Allowing Salmonella enterica Survival

1
Department of Nutrition and Food Science, Texas A & M University, College Station, TX 77843, USA
2
Department of Poultry Science, Texas A & M University, College Station, TX 77843, USA
3
Department of Animal Science, Texas A & M AgriLife Research, College Station, TX 77843, USA
*
Author to whom correspondence should be addressed.
Foods 2018, 7(3), 32; https://doi.org/10.3390/foods7030032
Submission received: 22 January 2018 / Revised: 21 February 2018 / Accepted: 27 February 2018 / Published: 3 March 2018
(This article belongs to the Section Food Microbiology)

Abstract

:
Sanitizer neutralizers can assist foodborne pathogen detection during routine testing by counteracting sanitizer residues carried over into fluids collected and tested from food samples. This study tested sanitizer-matched neutralizers applied at increasing concentrations to facilitate Salmonella enterica survival following exposure to cetylpyridinium chloride (CPC) or peracetic acid (PAA), identifying minimum required concentrations of neutralizers to facilitate pathogen survival. Salmonella isolates were individually inoculated into a non-selective medium followed immediately by CPC (0.1 to 0.8% v/v) or PAA (0.0125 to 0.2% v/v) application, followed by neutralizers application. CPC was neutralized by lecithin and polysorbate 80, each supplemented into buffered peptone water (BPW) at 0.125 to 2.0X its respective content in Dey-Engley (D/E) neutralizing buffer. PAA was neutralized in BPW supplemented with disodium phosphate, potassium monophosphate, and sodium thiosulfate, each at 0.25 to 3.0X its respective concentration in BPW (phosphates) or D/E buffer (thiosulfate). Addition of neutralizers at 1X their respective concentrations in D/E buffer was required to allow Salmonella growth at the maximum CPC concentration (0.8%), while 2X neutralizer addition was required for Salmonella growth at the maximum PAA level (0.2%). Sanitizer neutralizers can assist pathogen survival and detection during routine food product testing.

1. Introduction

Currently in the United States of America, multiple food sanitizers are approved to decontaminate surfaces of poultry animal carcasses, as well as fabricated poultry parts (e.g., wings, thighs, breasts, drumsticks), from microbial pathogens such as Salmonella enterica and differing species of Campylobacter [1,2]. Nevertheless, sanitizer use may result in residues of the sanitizing agent being carried over into sample collection/rinsing fluid, potentially hindering subsequent pathogen detection [3]. The U.S. Department of Agriculture Food Safety and Inspection Service (USDA-FSIS) in July 2016 issued a notice to inspection personnel to initiate use of neutralizing buffered peptone water (nBPW) in lieu of the conventional BPW formulation for poultry carcass and parts verification sampling [4]. nBPW is formulated to contain three sanitizer neutralizing agents in addition to other BPW ingredients: sodium bicarbonate (NaHCO3; 12.5 g/L), sodium thiosulfate (Na2SsO3; 1.0 g/L), and refined soy lecithin (7.0 g/L) [5]. Lecithin and thiosulfate are also incorporated into the formula of Dey-Engley (D/E) neutralizing buffer; lecithin is reported to neutralize quaternary ammonium compounds (QACs) while thiosulfate can reduce chlorine and some other oxidizers [6,7]. Bicarbonate can assist the buffering of acidulants to prevent significant pH decline.
The USDA-FSIS currently enforces Salmonella performance standards for fresh poultry products and conducts routine sampling of inspected establishments in order to test compliance with the performance standard. At present, a maximum of 5/51 (9.8%) of poultry carcass samples, and 8/52 (15.4%) of poultry parts samples, are allowed to bear detectable Salmonella without the establishment falling out of compliance with the performance standard [8]. However, the impact of poultry sanitizer neutralizer use on Salmonella survival, as well as minimum neutralizer concentrations allowing pathogen survival following sanitizer application, remains unknown. This study was undertaken in order to determine the minimum neutralizer concentrations required to allow Salmonella enterica isolates comprising multiple serovars to survive exposure to two sanitizers approved for use in poultry harvest and fabrication: cetylpyridinium chloride (CPC) and peracetic acid (PAA). CPC is a quaternizing ammonium-type sanitizer allowed to a concentration of 0.8% by the U.S. Department of Agriculture in fresh poultry and poultry carcass sanitization, whereas PAA decomposes into acetic acid and hydrogen peroxide, and functions primarily as an oxidizing sanitizer and is allowed to a maximum concentration of 2000 ppm (0.2%) PAA [2].

2. Materials and Methods

2.1. Salmonella Revival and Inoculum Preparation

Three isolates of S. enterica subsp. enterica belonging to serovars Typhimurium, Kentucky, and Heidelberg were obtained from the Food Microbiology Laboratory (Department of Animal Science, Texas A & M University, College Station, TX, USA) culture collection; all isolates were recovered from a U.S. federally inspected poultry slaughter establishment. Isolates were revived from −80 °C by transfer of frozen cultures into tubes containing 9.0 mL sterile tryptic soy broth (TSB; Becton, Dickinson and Co., Franklin Lakes, NJ, USA) and incubating for 24 h at 35 °C. Following incubation, cultures were passed into sterile 9.0 mL TSB-containing tubes and incubated (24 h, 35 °C) prior to being prepared for inoculation. Inoculum fluid for each isolate was produced from revived cultures by serially diluting into 9.0 mL volumes of sterilized double strength TSB (2X TSB). Double strength TSB was used so as to provide the appropriate nutrient content to inoculated bacterial cells once sample preparation was completed. The targeted inoculum concentration for pathogen isolates in samples was 105 CFU/mL. To quantify ingoing pathogen counts, decimal dilutions were prepared from 2X TSB tubes diluted to contain approximately 105 CFU/mL in 0.1% (w/v) peptone diluent (Becton, Dickinson and Co.). Salmonella isolates were spread onto tryptic soy agar-containing (TSA; Becton, Dickinson and Co.) Petri plates; inoculated plates were incubated at 35 °C for 24 h prior to colony enumeration. Plate counts were log10-transformed for subsequent statistical analysis.

2.2. Neutralizer-Supplemented Buffered Peptone Water Preparation

BPW was selected as the neutralizer carrier fluid given its current usage in USDA-FSIS poultry sampling procedures [9]. Neutralizer-supplemented BPW was prepared from scratch using the formula published in the USDA-FSIS Microbiology Laboratory Guidebook [10] to allow alteration of the formulation as needed. To prepare neutralizer-supplemented BPW matched for CPC, 40 mL BPW was added to a 100-mL volumetric flask. Stock solutions of refined soy lecithin and polysorbate 80 (Sigma-Aldrich Co., St. Louis, MO, USA) were prepared in distilled water so as to obtain two times (2X) their standard concentrations in D/E buffer (soy lecithin: 7.0 g/L; polysorbate 80: 5.0 g/L) upon completion of final sample preparation. After addition of lecithin and polysorbate 80, sufficient BPW was added to bring to volume (100 mL). Similar preparations of CPC neutralizers-supplemented BPW were prepared to provide 1.0X, 0.5X, 0.25X, and 0.125X the standard contents of neutralizers in D/E buffer in like fashion. All solutions were then transferred into screw-cap bottles, subjected to steam sterilization (15 min, 121 °C), and tempered to room temperature prior to use. Peracetic acid neutralizers-supplemented BPW was prepared in similar fashion to BPW prepared for CPC experiments. Neutralizers for PAA were sodium thiosulfate, disodium phosphate (Na2HPO4), and monopotassium phosphate (KPO4; Sigma-Aldrich Co.). For thiosulfate and phosphates, BPW basal medium (1% peptone, 0.5% NaCl, distilled water; not containing phosphates) was supplemented with sufficient neutralizers to provide up to three times (3X) each of neutralizers’ respective contents in BPW or D/E buffer upon final sample preparation (thiosulfate: 6.0 g/L; disodium phosphate: 3.5 g/L; monopotassium phosphate: 1.5 g/L) [10]. Similar preparations were then produced to deliver 2X, 1X, 0.5X, and 0.25X of neutralizers’ respective concentrations in individual flasks, steam-sterilized (15 min, 121 °C), and then cooled to ambient before use.

2.3. Sanitizer Preparation

Commercial CPC (Cecure®, 40% CPC; Safe Foods Corp., North Little Rock, AR, USA) was diluted in sterile distilled water in a 100-mL volumetric flask. CPC was added to deliver a final concentration of 0.8% CPC upon final sample preparation (1.0 mL 2X TSB inoculated with Salmonella isolate +0.5 mL sanitizer +0.5 mL CPC-matched neutralizers-supplemented BPW). Similar working stocks, designed to deliver 0.6, 0.4, 0.2, and 0.1% (v/v) CPC, were prepared in like fashion for experimental use. In the case of PAA, working stocks of commercial PAA solution (PromoatTM, Safe Foods Corp., Rogers, AR, USA) were prepared in similar fashion as those for CPC experiments, and were used within 30 min of preparation based on manufacturer guidance regarding PAA degradation kinetics upon dilution. PAA working stocks were prepared to deliver 0.2, 0.1, 0.05, 0.025, and 0.0125% (v/v) PAA upon completion of sample preparation. For both sanitizer solutions, upon mixing of working stocks, sanitizer solutions were filtered through a 0.45 µm filter.

2.4. Experimental Procedures

To initiate sanitizer neutralization experiments, 1.0 mL volumes of Salmonella isolates diluted in 2x TSB were aseptically loaded into sterilized, cooled (25 °C) glass vials. Then, 0.5 mL of sanitizer solution was added aseptically. Finally, 0.5 mL of appropriately mixed sanitizer (CPC or PAA)-matched neutralizer-supplemented BPW was added into the sample vial. Procedures were completed to yield all combinations of five sanitizer concentrations and five neutralizer additions for each Salmonella isolate. Additionally, sanitizer-containing, neutralizer-free controls were prepared by adding 1.0 mL pathogen-inoculated 2X TSB, 0.5 mL sanitizer, and 0.5 mL sterile distilled water to confirm sanitizer inactivation of pathogens absent of neutralizer addition. Once sample preparations were completed, samples were capped and incubated for 24 h at 35 °C. Following incubation, tubes were checked for turbidity as evidence of pathogen survival and growth, and scored for Salmonella isolate growth (1) or no growth (0). Sample tubes not showing visible evidence of growth were sampled for Salmonella survival by spreading a 0.1 mL volume onto the surface of a TSA Petri dish. Following inoculation, plates were incubated for 24–36 h at 35 °C prior to checking for colonies. If colonies were detected following incubation, the source tube was scored as positive (1) for Salmonella survival.

2.5. Analysis of Data

Sanitizer neutralization experiments were replicated six times in identical fashion (N = 6). Salmonella isolate-specific mean inoculum (log10 CFU/mL) were first compared to one another by Student’s t-test (p < 0.05) in order to determine whether inoculum counts between isolates differed. Sets of ‘1’s and ‘0’s (growth and no growth, respectively) for each Salmonella isolate and sanitizer/neutralizer combination were analyzed by two-way analysis of co-variance (ANCOVA). Log10-transformed counts of Salmonella isolate inocula were treated as a co-variate to detect and negate any potential influence on growth/no growth results as a function of Salmonella inoculum levels. Least squares means of Salmonella growth/no growth results were subsequently separated by Student’s t-test, assigning significance at p = 0.05. Chi square (χ2) analysis was completed to determine whether Salmonella growth/no growth frequencies were independent of sanitizer and neutralizer application (H0) or dependent upon sanitizer and neutralizer application (H1), at a significance level of p = 0.05. Finally, a logistic regression model was fitted identifying the response variable Salmonella survival (1 = growth; 0 = no growth) as a binomially distributed random variable. Growth was evaluated using generalized linear mixed models, with distinct models for each sanitizer [11]. Logit link functions were employed during analysis; the residual variance was fixed at a value of 1. The replicate was modeled as a random effect. Multiple parameterizations of sanitizer levels and neutralizer levels were initially investigated. The parameterization that appeared most appropriate for characterizing Salmonella response to sanitizer and neutralizer application was the ratio of neutralizer concentration to sanitizer concentration as a continuous variable. Then, linear, quadratic, and cubic regression coefficients for those ratios as covariates were investigated to determine the optimal model for characterizing growth/no growth responses of Salmonella for each sanitizer.

3. Results

3.1. Survival of Salmonella Isolates as a Function of CPC and CPC-Matched Neutralizer Combinations

The application of sanitizer-matched neutralizers in BPW was anticipated to counteract antimicrobial activity of CPC and PAA sanitizers at sanitizer-specific minimum required neutralizer concentrations. Mean counts of Salmonella Typhimurium, Kentucky, and Heidelberg inocula for CPC experiments were 5.48 ± 0.31, 5.58 ± 0.42, and 5.90 ± 0.11 log10 CFU/mL, respectively. Salmonella isolate mean inoculum counts did not differ from one another (p > 0.05). For Salmonella challenged with CPC and then neutralized, the interaction of sanitizer concentration and neutralizers concentration was highly significant (p < 0.01) for predicting Salmonella growth or non-growth; counts of Salmonella inocula did not function as a co-variate to influence growth/no growth results (Table 1). Addition of neutralizers at 1X their respective contents in D/E buffer was required to allow for Salmonella isolates’ survival exposed to 0.6 and 0.8% CPC, except during one replicate testing S. Typhimurium. Predictably, as CPC content was lowered, required contents of sanitizer neutralizers allowing Salmonella survival were reduced, except that even 0.1% CPC (lowest applied sanitizer concentration) was generally capable of inhibiting Salmonella growth when challenged with 0.125X neutralizers addition (Table 1). A Χ2 = 408.5 (p < 0.01) was obtained for Salmonella isolates treated with CPC and subsequently neutralized, indicating Salmonella growth or non-growth was dependent upon sanitizer and neutralizers combinations, rejecting the null hypothesis. No Salmonella growth was detected in control samples where isolates were challenged with the lowest concentration of sanitizer but not neutralized.

3.2. Survival of Salmonella as a Function of PAA and PAA Neutralizer Combination

Mean Salmonella inoculum counts for PAA experiments were 5.63 ± 0.43, 5.35 ± 0.62, and 5.64 ± 0.29 log10 CFU/mL for S. Typhimurium, Kentucky, and Heidelberg, respectively. Mean inoculum counts did not differ statistically between Salmonella isolates (p > 0.05). Similar to CPC results (Section 3.1), Salmonella isolates did not differ in responses (growth, non-growth) to sanitizer and matched neutralizers application (p > 0.05) (Table 2). Salmonella inoculum counts did not function as a co-variate to influence pathogen growth for sanitizer and neutralizers pairings (Table 2). Compared to CPC, 2X neutralizers addition was required to support Salmonella growth at the highest applied PAA concentration (0.2% v/v; Table 2). At intermediate concentrations of PAA (0.05, 0.1%), statistical differences were observed with respect to frequency of Salmonella survival as a function of neutralizer content (p < 0.05), but not as a function of Salmonella isolate. For 0.05% PAA sanitizer, increasing from 0.5 to 1.0X neutralizers addition resulted in a statistically significant increase in Salmonella survival frequency (Table 2). Similar to results for Salmonella treated with CPC and neutralizers (Section 3.1), Salmonella growth was dependent upon PAA + neutralizers application (χ2 = 369.4; p < 0.01). Consistent growth for all isolates was observed at the lowest concentrations of PAA (0.0125, 0.025%) except at the lowest neutralizers addition (0.5X, 0.25X).

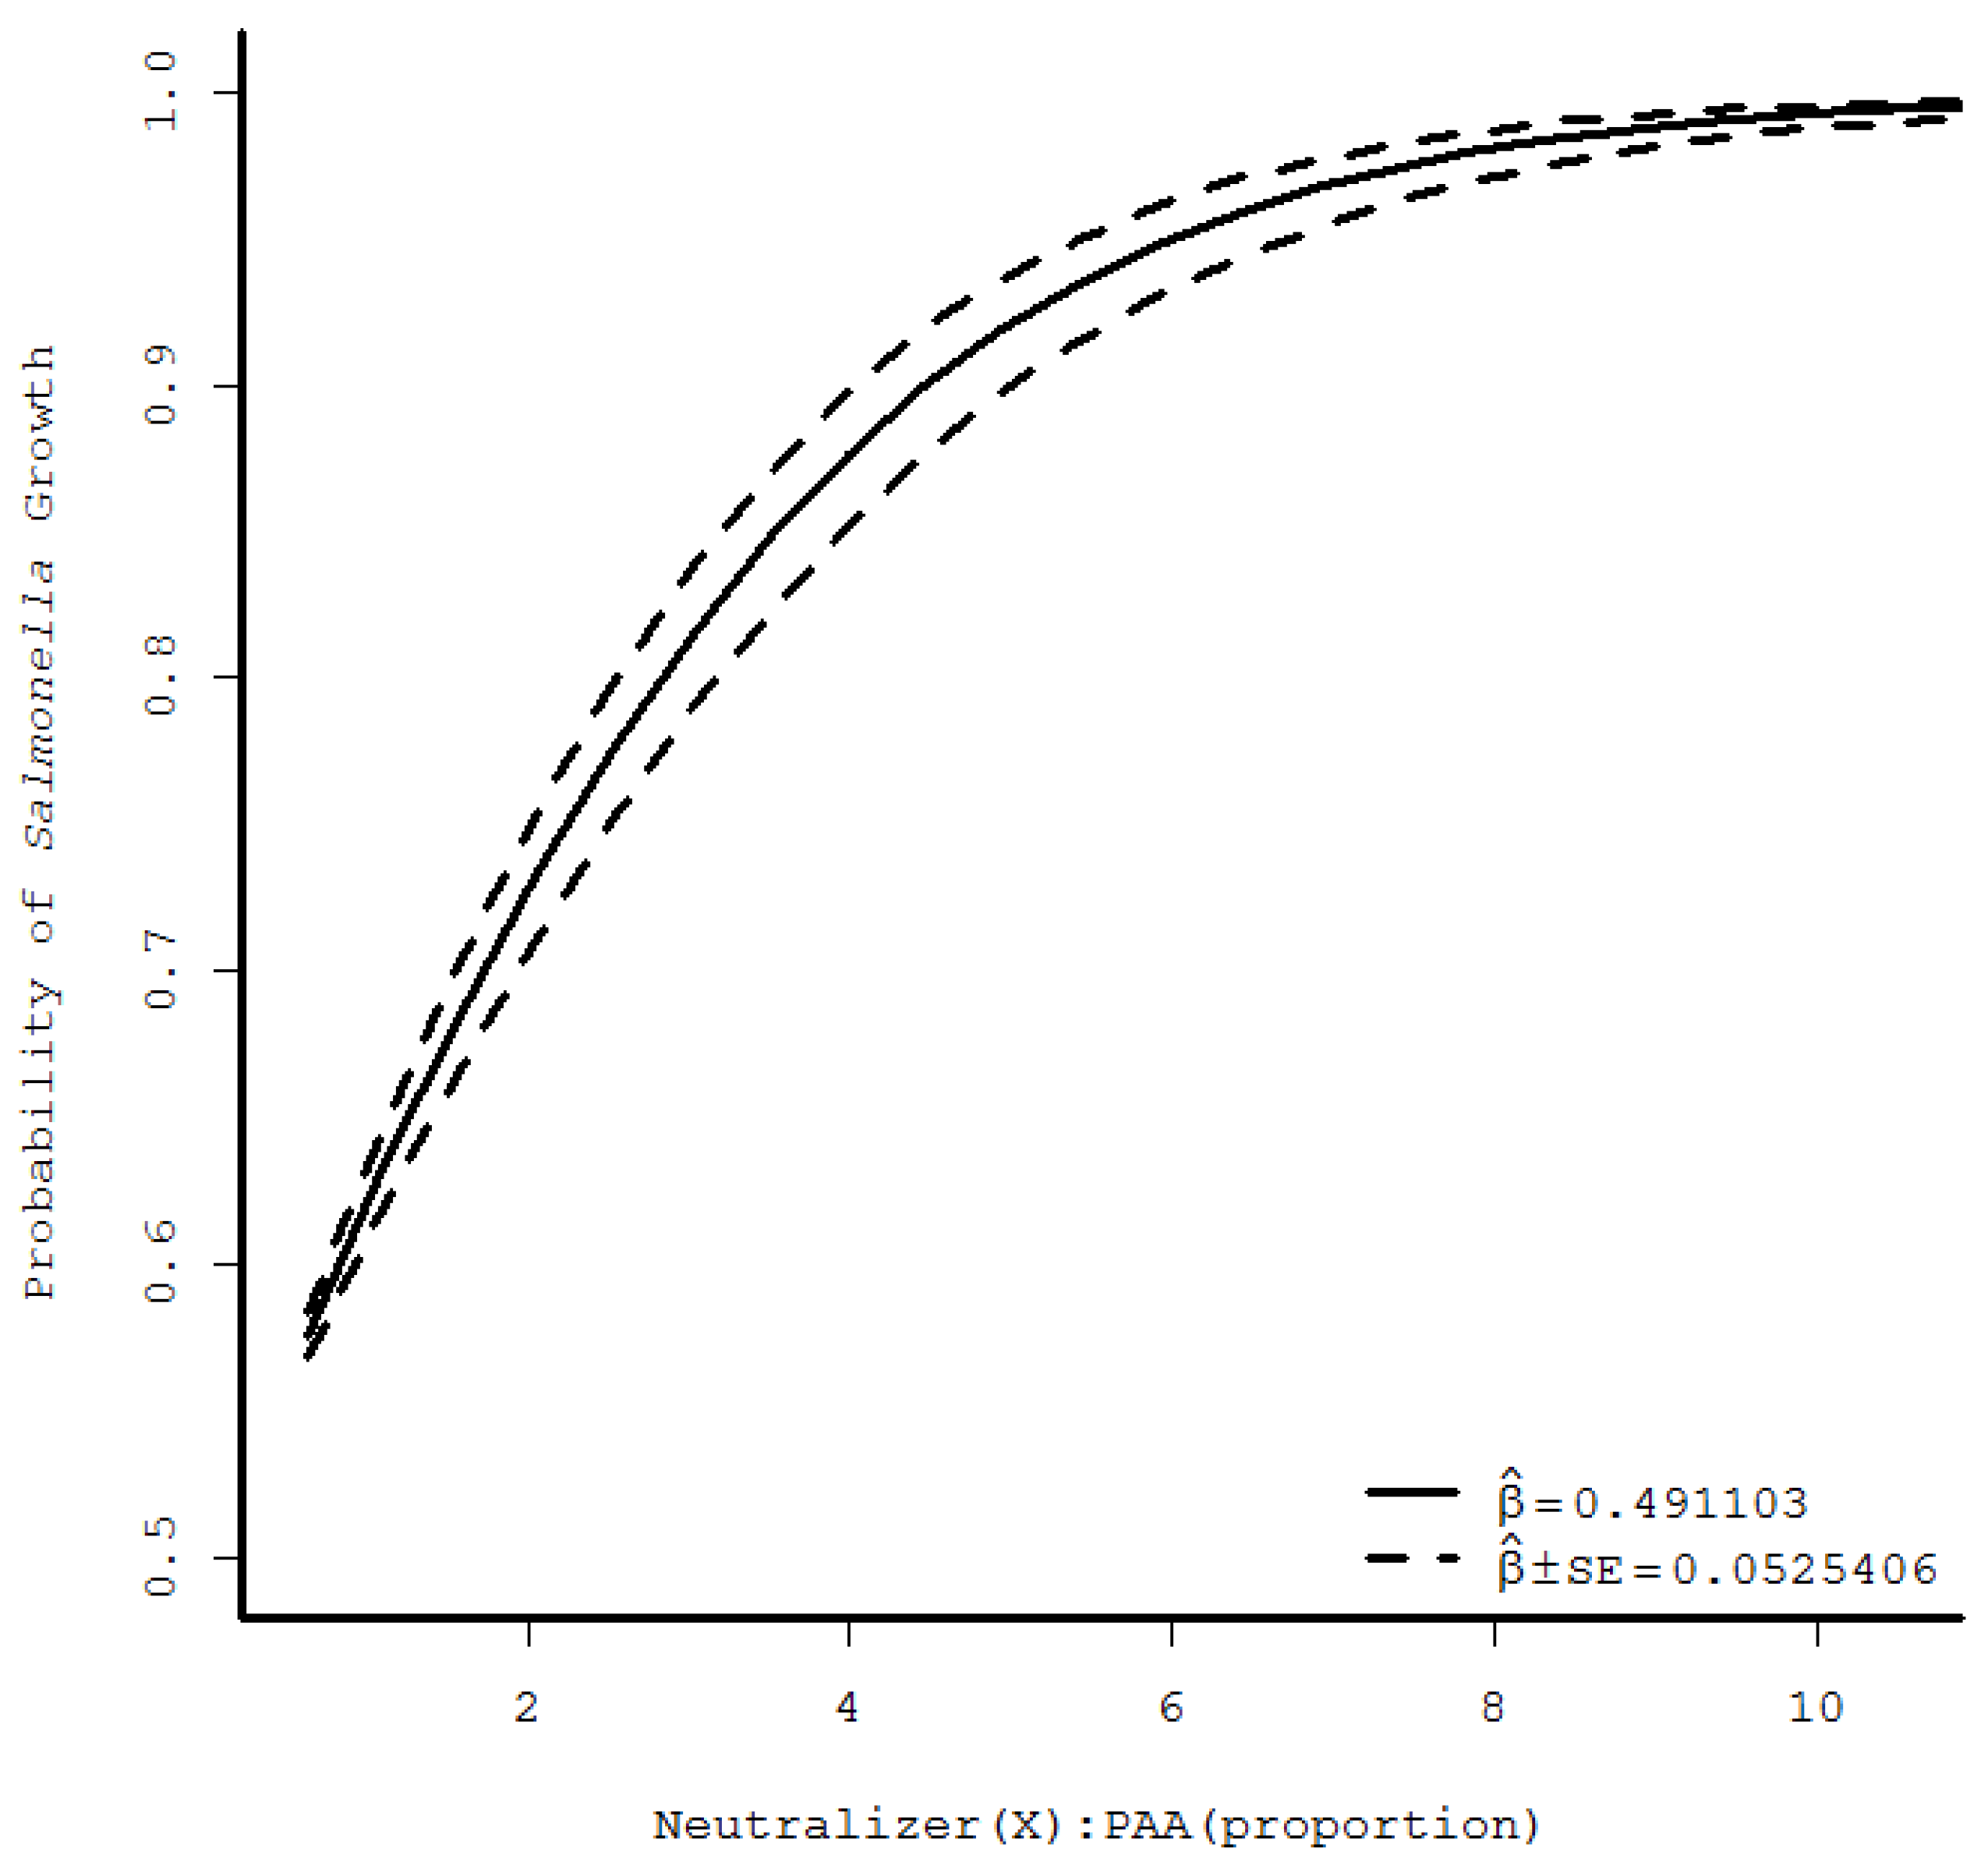
3.3. Modeling of Salmonella Survival As a Function of Sanitizer and Combined Neutralizers Exposure via Logistic Regression

During logistic regression analysis, increasing the order of the regression from linear to quadratic to cubic resulted in highly significant F-statistics for each analysis unique to CPC and PAA-specific datasets. Plots of the predicted curves were evaluated on logit and also on observed scales after application of the inverse link function. Throughout the various models’ analysis, linear regression appeared to most appropriately characterize Salmonella growth across the range of experimental neutralizers/sanitizer combinations. Plots of the predicted Salmonella growth/no growth as a function of the ratio of neutralizers:sanitizer probability are shown in Figure 1 and Figure 2 for CPC and PAA, respectively. From these, minimum ratios of neutralizers:sanitizer of 0.68 and 8.8 for CPC and PAA, respectively, were identified to provide high likelihood of Salmonella growth (probability of growth > 0.99). Figure 1 and Figure 2 demonstrate convergence of observed Salmonella growth/no growth response means with standard error limits at the lower and higher ratios of neutralizers/sanitizer for CPC and PAA, respectively.

4. Discussion

Research testing the survival of human pathogens following sanitizer exposure has indicated Salmonella may be inhibited by sanitizers such as CPC and PAA during sanitizer testing during poultry slaughter and/or meat fabrication. Kim and Slavik [12] reported 0.1% CPC spray or immersion application reduced S. Typhimurium on chicken skin by 0.9 to 1.8 log10 CFU/cm2, suggesting the sanitizer permeabilized the outer membrane of the pathogen as well as inhibited proper metabolism. Others have shown significant reductions in Salmonella counts on chicken carcasses following application of 0.02 to 0.04% PAA [13,14]. Nevertheless, Gamble et al. [3] reported the capacity of Salmonella to survive CPC (0.8%) or PAA (0.2%) supplementation in BPW under conditions designed to simulate extended poultry carcass dripping (5 min) occurring during routine verification sampling. Researchers concluded neutralizers usage in poultry sampling fluids was warranted to reduce the potential of pathogen non-detection. Soon thereafter, USDA-FSIS released Notice 41-16 directing the implementation of nBPW use during routine testing to enhance the likelihood of pathogen detection during poultry routine verification testing [4].
In the current study, data analysis indicates Salmonella detection would be supported when CPC-matched neutralizers are added into poultry rinsing fluids at 1X their respective concentrations in D/E neutralizing buffer. The formula for nBPW contains refined soy lecithin at 7.0 g/L and sodium thiosulfate at 1.0 g/L [5]. Assuming a poultry slaughter facility applies CPC at its maximum allowable concentration of 0.8% to poultry surfaces, even without loss of CPC activity prior to sample collection, Salmonella detection would be facilitated by nBPW as its CPC-matched neutralizers contents are equivalent to that of D/E neutralizing buffer (Table 1) [10]. Furthermore, the required ratio of CPC neutralizers:CPC of 0.68 indicates only moderate amounts of neutralizers are required for sanitizer neutralization under conditions likely optimal for contaminating pathogens (no sub-lethal injury onset by previously applied interventions, no impacts of cold water application typical of immersion chilling) (Figure 1).
In contrast to CPC findings, Salmonella detection following application of PAA as impacted by PAA-matched sanitizers indicated a higher neutralizers requirement for predictable pathogen detection. While frequencies of pathogen detection as a function of sanitizer and neutralizers pairings did not differ between CPC and PAA, the requirement of at least 2X the standard concentrations of neutralizers in BPW or D/E media for PAA neutralization indicates greater opportunity for pathogens to escape detection on poultry samples if the sanitizer is insufficiently neutralized. The predicted requirement for 8.8 times the neutralizer content versus sanitizer addition indicates greater neutralizer addition requirement for pathogen detection. This may have occurred due to decreased acidulant buffer content in the 1X experimental PAA neutralizer fluid (3.5 g/L sodium phosphate dibasic +1.5 g/L potassium phosphate monobasic) [10] vs. nBPW formulation (12.5 g/L sodium bicarbonate) used in USDA-FSIS routine testing [5]. In the current study, the combination of phosphates, as compared to bicarbonate, was used in order to provide for acidulant neutralization/buffering. This was done due to the inclusion of these agents in BPW as well as due to a lack of awareness of USDA-FSIS’s intent for formulation of nBPW at the time of experiment startup. Repeat of the current study method, substituting bicarbonate for phosphates, may lead to differing outcomes regarding minimal requirements for PAA neutralizers use.
The multiple forms of analysis applied in the current study provided a more comprehensive understanding of the data and experimental outcomes. The confirmation that Salmonella inoculum counts (log10 CFU/mL) did not differ from one another, and that Salmonella inoculum did not function as a covariate to influence pathogen growth/no growth, demonstrated Salmonella serovars are not likely to differ in their response to an applied sanitizer. ANCOVA and Χ2 analyses both indicated that Salmonella growth was influenced by the content of sanitizer and neutralizer applied, though these procedures do so by differing means. Finally, the utilization of logistic regression provided opportunity to predict Salmonella growth/no growth along a continuum of predicted combinations of sanitizer and matched neutralizers, not available via analysis of variance or Χ2 procedures. This technique facilitates prediction of minimum needs of neutralizers for refining nBPW formulation, or for application of neutralizers into testing media in other applications. Previous research has indicated the superiority of logistic regression of binary data versus linear regression [15]. In the current study, whereas the ratios of sanitizer to neutralizers numerically differed for CPC and PAA, frequencies of Salmonella growth/no-growth did not differ for the two sanitizers, supporting the utility of logistic regression analysis in tandem with ANOVA for gaining more in-depth understanding of potential pathogen survival outcomes during food sanitizer use and subsequent pathogen testing. Ultimately, the utilization of multiple forms of data analysis yielded a comprehensive understanding of the impact of sanitizer neutralization during experimental trials and provided multiple points of reference for subsequent study of Salmonella recovery as impacted by sanitizer and neutralizers application.

5. Conclusions

In summary, data presented herein indicate that non-injured cells belonging to Salmonella enterica serovars do not differ in their responses to the USDA-FSIS-approved poultry sanitizers CPC and PAA applied in vitro. While Salmonella inocula did not influence outcomes of growth/no growth experiments, Salmonella growth or no growth was dependent upon, and highly influenced by, the contents of paired sanitizer and matched neutralizers (p < 0.01). Predicted neutralizer requirements for consistent sanitizer neutralization were determined through multiple methods of data analysis. The current study tested neutralizers and sanitizers mixed in liquid medium that likely allowed for homogeneous mixing of compounds and bacterial cells in the sample vial. Sanitizer neutralizers, when matched to the sanitizer and of sufficient concentration, can facilitate pathogen survival and subsequent detection during sampling of a food product.

Acknowledgments

Partial funding and in-kind support (sanitizer donation) was provided by Safe Foods Corp. (North Little Rock, AR, USA). Additional support of author Mohammad’s graduate assistantship was provided by Texas A & M University, Department of Animal Science. No funds were received by corporate sponsor to defray costs of open access publication.

Author Contributions

Authors Z.H.M. and T.M.T. conceived of experimental design and parameters. Authors Z.H.M. and A.A.H. completed all experimental reagent and microbial isolate inoculum preparation, sample preparation and incubation, and results interpretation. Authors D.G.R. and C.R.K. collaborated to complete statistical analysis of experimental data and interpretation of analysis results.

Conflicts of Interest

The authors declare no conflict of interest.

References

  1. U.S. Department of Agriculture-Food Safety and Inspection Service. Salmonella Compliance Guidelines for Small and Very Small Meat and Poultry Establishments that Produce Ready-to-Eat (RTE) Products. Available online: http://www.fsis.usda.gov/wps/wcm/connect/2ed353b4-7a3a-4f31-80d8-20262c1950c8/Salmonella_Comp_Guide_091912.pdf?MOD = AJPERES (accessed on 5 June 2014).
  2. U.S. Department of Agriculture-Food Safety and Inspection Service. Safe and Suitable Ingredients Used in the Production of Meat, Poultry, and Egg Products. Directive 7120.1, Rev. 44. Available online: https://www.fsis.usda.gov/wps/wcm/connect/bab10e09-aefa-483b-8be8-809a1f051d4c/7120.1.pdf?MOD = AJPERES (accessed on 4 January 2018).
  3. Gamble, G.R.; Berrang, M.E.; Buhr, R.J.; Hinton, A., Jr.; Bourassa, D.V.; Johnston, J.J.; Ingram, K.D.; Adams, E.S.; Feldner, P.W. Effect of simulated sanitizer carryover on recovery of Salmonella from broiler carcass rinsates. J. Food Prot. 2016, 79, 710–714. [Google Scholar] [CrossRef] [PubMed]
  4. U.S. Department of Agriculture-Food Safety and Inspection Service. Notice 41–16: New Neutralizing Buffered Peptone Water to Replace Current Buffered Peptone Water for Poultry Verification Sampling. Available online: https://www.fsis.usda.gov/wps/wcm/connect/2cb982e0-625c-483f-9f50-6f24bc660f33/41-16.pdf?MOD = AJPERES (accessed on 18 March 2017).
  5. U.S. Department of Agriculture-Food Safety and Inspection Service. Neutralizing Buffered Peptone Water (nBPW) in Poultry Carcass and Parts Sampling. Available online: https://askfsis.custhelp.com/app/answers/detail/a_id/2007/~/neutralizing-buffered-peptone-water-%28nbpw%29-in-poultry-carcass-and-parts-sampling (accessed on 12 July 2017).
  6. Dey, B.P.; Engley, F.B., Jr. Methodology for recovery of chemically treated Staphylococcus aureus with neutralizing medium. Appl. Environ. Microbiol. 1983, 45, 1533–1537. [Google Scholar] [PubMed]
  7. Black and Veach Corp. White’s Handbook of Chlorination and Alternative Disinfectants, 5th ed.; John Wiley & Sons, Inc.: Hoboken, NJ, USA, 2010. [Google Scholar]
  8. U.S. Department of Agriculture-Food Safety and Inspection Service. Pathogen Reduction—Salmonella and Campylobacter Performance Standards Verification Testing. Available online: https://www.fsis.usda.gov/wps/wcm/connect/b0790997-2e74-48bf-9799-85814bac9ceb/28_IM_PR_Sal_Campy.pdf?MOD = AJPERES (accessed on 18 March 2017).
  9. U.S. Department of Agriculture-Food Safety and Inspection Service. Directive 10,250.1: Salmonella and Campylobacter Verification Program for Raw Meat and Poultry Products. Available online: https://www.fsis.usda.gov/wps/wcm/connect/ebf83112-4c3b-4650-8396-24cc8d38bf6c/10250.1.pdf?MOD = AJPERES (accessed on 18 March 2017).
  10. U.S. Department of Agriculture-Food Safety and Inspection Service. Microbiology Laboratory Guidebook Appendix 1.08: Media and Reagents. Available online: https://www.fsis.usda.gov/wps/wcm/connect/b089fb25-5d69-4b01-a470-da1d0182a5d7/MLG-Appendix-1-Media-Reagents.pdf?MOD = AJPERES (accessed on 15 March 2016).
  11. Gilmour, A.R.; Gogel, B.J.; Cullis, B.R.; Thompson, R. ASReml User Guide (Release 3.0). Available online: https://www.vsni.co.uk/downloads/asreml/release3/UserGuide.pdf (accessed on 10 August 2017).
  12. Kim, J.-W.; Slavik, M.F. Cetylpyridinium chloride (CPC) treatment on poultry skin to reduce attached Salmonella. J. Food Prot. 1996, 59, 322–326. [Google Scholar] [CrossRef] [PubMed]
  13. Bauermeister, L.J.; Bowers, J.W.J.; Townsend, J.C.; McKee, S.R. The microbial and quality properties of poultry carcasses treated with peracetic acid as an antimicrobial treatment. Poult. Sci. 2008, 87, 2390–2398. [Google Scholar] [CrossRef] [PubMed]
  14. Nagel, G.M.; Bauermeister, L.J.; Bratcher, C.L.; Singh, M.; McKee, S.R. Salmonella and Campylobacter reduction and quality characteristics of poultry carcasses treated with various antimicrobials in a post-chill immersion tank. Int. J. Food Microbiol. 2013, 165, 281–286. [Google Scholar] [CrossRef] [PubMed]
  15. Zhao, L.; Chen, Y.; Schaffner, D.W. Comparison of logistic regression and linear regression in modeling percentage data. Appl. Environ. Microbiol. 2001, 67, 2129–2135. [Google Scholar] [CrossRef] [PubMed]
Figure 1. Probability of Salmonella growth following exposure to cetylpyridinium chloride (CPC) and matched neutralizers (lecithin, polysorbate 80), depicting predicted values and confidence band representing one standard error from the linear regression of logit values versus the ratio of neutralizers:sanitizer (N = 6). SE: standard error of model.
Foods 07 00032 g001
Figure 2. Probability of Salmonella growth following exposure to peracetic acid (PAA) and matched neutralizers (sodium thiosulfate, disodium phosphate, potassium phosphate), depicting predicted values and confidence band representing one standard error from the linear regression of logit values versus the ratio of neutralizers:sanitizer (N = 6). SE: standard error of the model.
Foods 07 00032 g002
Table 1. Least squares means of the proportions of Salmonella growth or non-growth as affected by the interaction of cetylpyridinium chloride (CPC) concentration and combined neutralizers addition (p < 0.01).
Neutralizer Addition 10.8% 20.6%0.4%0.2%0.1%
2X1.0 A 31.0 A1.0 A1.0 A1.0 A
1X1.0 A1.0 A1.0 A1.0 A1.0 A
0.5X0.0 D0.06 D0.94 A1.0 A1.0 A
0.25X0.0 D0.0 D0.0 D0.5 B1.0 A
0.125X0.0 D0.0 D0.0 D0.0 D0.28 C
Pooled Standard Error = 0.04
1 1X concentrations for sanitizer (CPC; Cecure®, 40% CPC, Safe Foods Corp., North Little Rock, AR, USA) neutralizers were 7.0 g/L lecithin and 5.0 g/L polysorbate 80 [10]; 2 CPC was formulated in distilled water to concentrations sufficient to produce indicated final concentrations upon completion of all additions to sample vials (1.0 mL diluted Salmonella culture in 2X TSB +0.5 mL CPC stock +0.5 mL neutralizers-supplemented BPW); 3 Values presented are compiled from six independently completed replicates, with one sample per replicate (N = 6). Values not sharing common letters (A–D) differ by two-way analysis of variance and Student’s t-test means separation test at p = 0.05. Salmonella isolate inoculum counts (log10 CFU/mL) did not function as a co-variate to impact Salmonella growth/no growth results (p > 0.05).
Table 2. Least squares means of the frequencies of Salmonella growth or non-growth (number of samples showing growth or non-growth/total number samples) as affected by the interaction of peracetic acid (PAA) concentration x combined neutralizers addition (p < 0.0001).
Neutralizer Addition 10.2% 20.1%0.05%0.025%0.0125%
3X1.0 A 31.0 A1.0 A1.0 A1.0 A
2X1.0 A1.0 A1.0 A1.0 A1.0 A
1X0.0 D0.06 D0.94 A1.0 A1.0 A
0.5X0.0 D0.0 D0.0 D0.5 B1.0 A
0.25X0.0 D0.0 D0.0 D0.0 D0.28 C
Pooled Standard Error = 0.05
1 1X concentrations for sanitizer (PAA; Promoat™, 11–13% PAA, Safe Foods Corp., North Little Rock, AR, USA) neutralizers were Na2S2O3 (6.0 g/L), Na2HPO4 (3.5 g/L) and KPO4 (1.5 g/L) [10]; 2 PAA was formulated in distilled water to concentrations sufficient to produce indicated final concentrations upon completion of all additions to sample vials (1.0 mL diluted Salmonella culture in 2X TSB +0.5 mL PAA stock +0.5 mL neutralizers-supplemented BPW); 3 Values presented are compiled from six independently completed replicates, with one sample per replicate (N = 6). Values not sharing common letters (A–E) differ by two-way analysis of variance and Student’s t-test means separation test at p = 0.05. Salmonella isolate inoculum counts (log10 CFU/mL) did not function as a co-variate to explain Salmonella growth/no growth results (p > 0.05).

