Regionalized Strategies for Food Loss and Waste Management in Spain under a Life Cycle Thinking Approach

 , ,
, ,  and
and
Abstract
: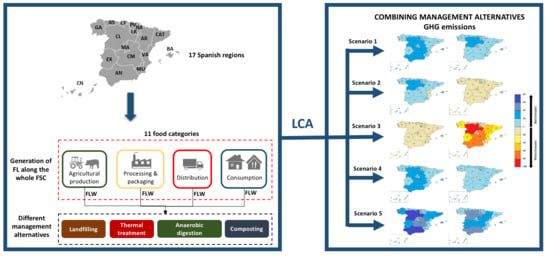
1. Introduction
2. Materials and Methods
2.1. Goal Definition
2.2. Function and Functional Unit
2.3. System Boundaries
2.4. Scenarios under Study
- Scenario 1 (S1). Represents the baseline scenario taking into account the current FLW management in each region (shown in Table 2), according to data published by the Spanish Waste Management Framework Plan (PEMAR) [35] and the CONAMA Foundation [36]. The results of S1 are calculated using the best-founded data for 2015, combined with certain assumptions.
- Scenario 2 (S2). Replicates the current situation in Germany regarding FLW management [37], where AC represents the high part of the treatment, but AD systems are increasingly being promoted. Therefore, it is considered that 75% of FLW goes to AC, 20% to AD and the rest is divided between landfill (2.5%) and thermal treatment (2.5%).
- Scenario 3 (S3). This scenario prioritizes the use of AD systems, assuming that 75% goes to AD, 20% to AC, and the rest is divided between landfill (2.5%) and thermal treatment (2.5%).
- Scenario 4 (S4). This scenario is based on current Danish conditions, where over 90% of the share of biowaste is incinerated [38]. Thus, 90% of FLW goes to thermal treatment, while the “10%” goes to landfill, AD and, respectively, AC in equal proportions.
- Scenario 5 (S5). This scenario is based on the increasingly promoted claim that FLW is a valuable resource that should never end up in landfilling sites [39]. It is assumed that landfilling is not a FLW management alternative, so 33.3% goes to each of the remaining management options.
- Scenario 6 (S6). Landfilling and thermal treatment are not considered in this scenario, so 50% of FLW is treated in AC, and 50% in AD. The argument for avoid including thermal treatment plants in S6 refers to the fact that, similarly to what has recently occurred to coal plants in many nations including Spain, thermal treatment plants will potentially have problems with regard to providing energy to the system by the year 2030. More specifically, they will have serious difficulties in maintaining competitiveness against other technologies in an environment highly conditioned by the European response to climate change, in which the cost of CO2 will tend to be increasingly higher [2].
2.5. Life Cycle Inventory
- AC was modelled using the professional database of the GaBi software [49], which considers closed halls or so-called composting boxes or rotting tunnels. The input waste is assumed as an average mixture of biodegradable waste consisting of biodegradable garden and park waste, as well as a 35% content of food and kitchen waste. For the selective collection fraction, the composting system includes the energy requirements of a mechanical separation unit [50].
- Thermal treatment was based on the professional database of the GaBi software [49] for the biodegradable waste fraction of municipal solid waste. To model a single fraction, energy production and credits were attributed to the biodegradable waste fraction. The plant consists of an incineration line fitted with a grate and a steam generator. Grate is the most common technology in Europe, applied in 80% of plants in Spain [53]. The thermal treatment of one metric ton of waste produces 495 MJ of energy, 1277 MJ of steam, 220 kg of bottom ash, and 42 kg of boiler ash, filter cake, and slurries.
- Landfill with biogas recovery includes biogas and leachate treatment and deposition. Sealing materials (e.g., clay or mineral coating) and diesel for the compactor were also included. The modelling was based on the landfill process for municipal household waste from the professional database of GaBi [49]. According to the model, 17% of the biogas naturally released is collected, treated, and burnt to produce electricity. The remaining biogas is flared (21%) and released to the atmosphere (62%). A rate of 50% transpiration/runoff and a 100-year lifetime for the landfill were considered. Additionally, a net electricity generation of 0.0942 MJ per kg of municipal solid FLW was assumed [49].
2.6. System Expansion
2.7. Life Cycle Impact Assessment
2.8. Main Limitations and Assumptions of the Study
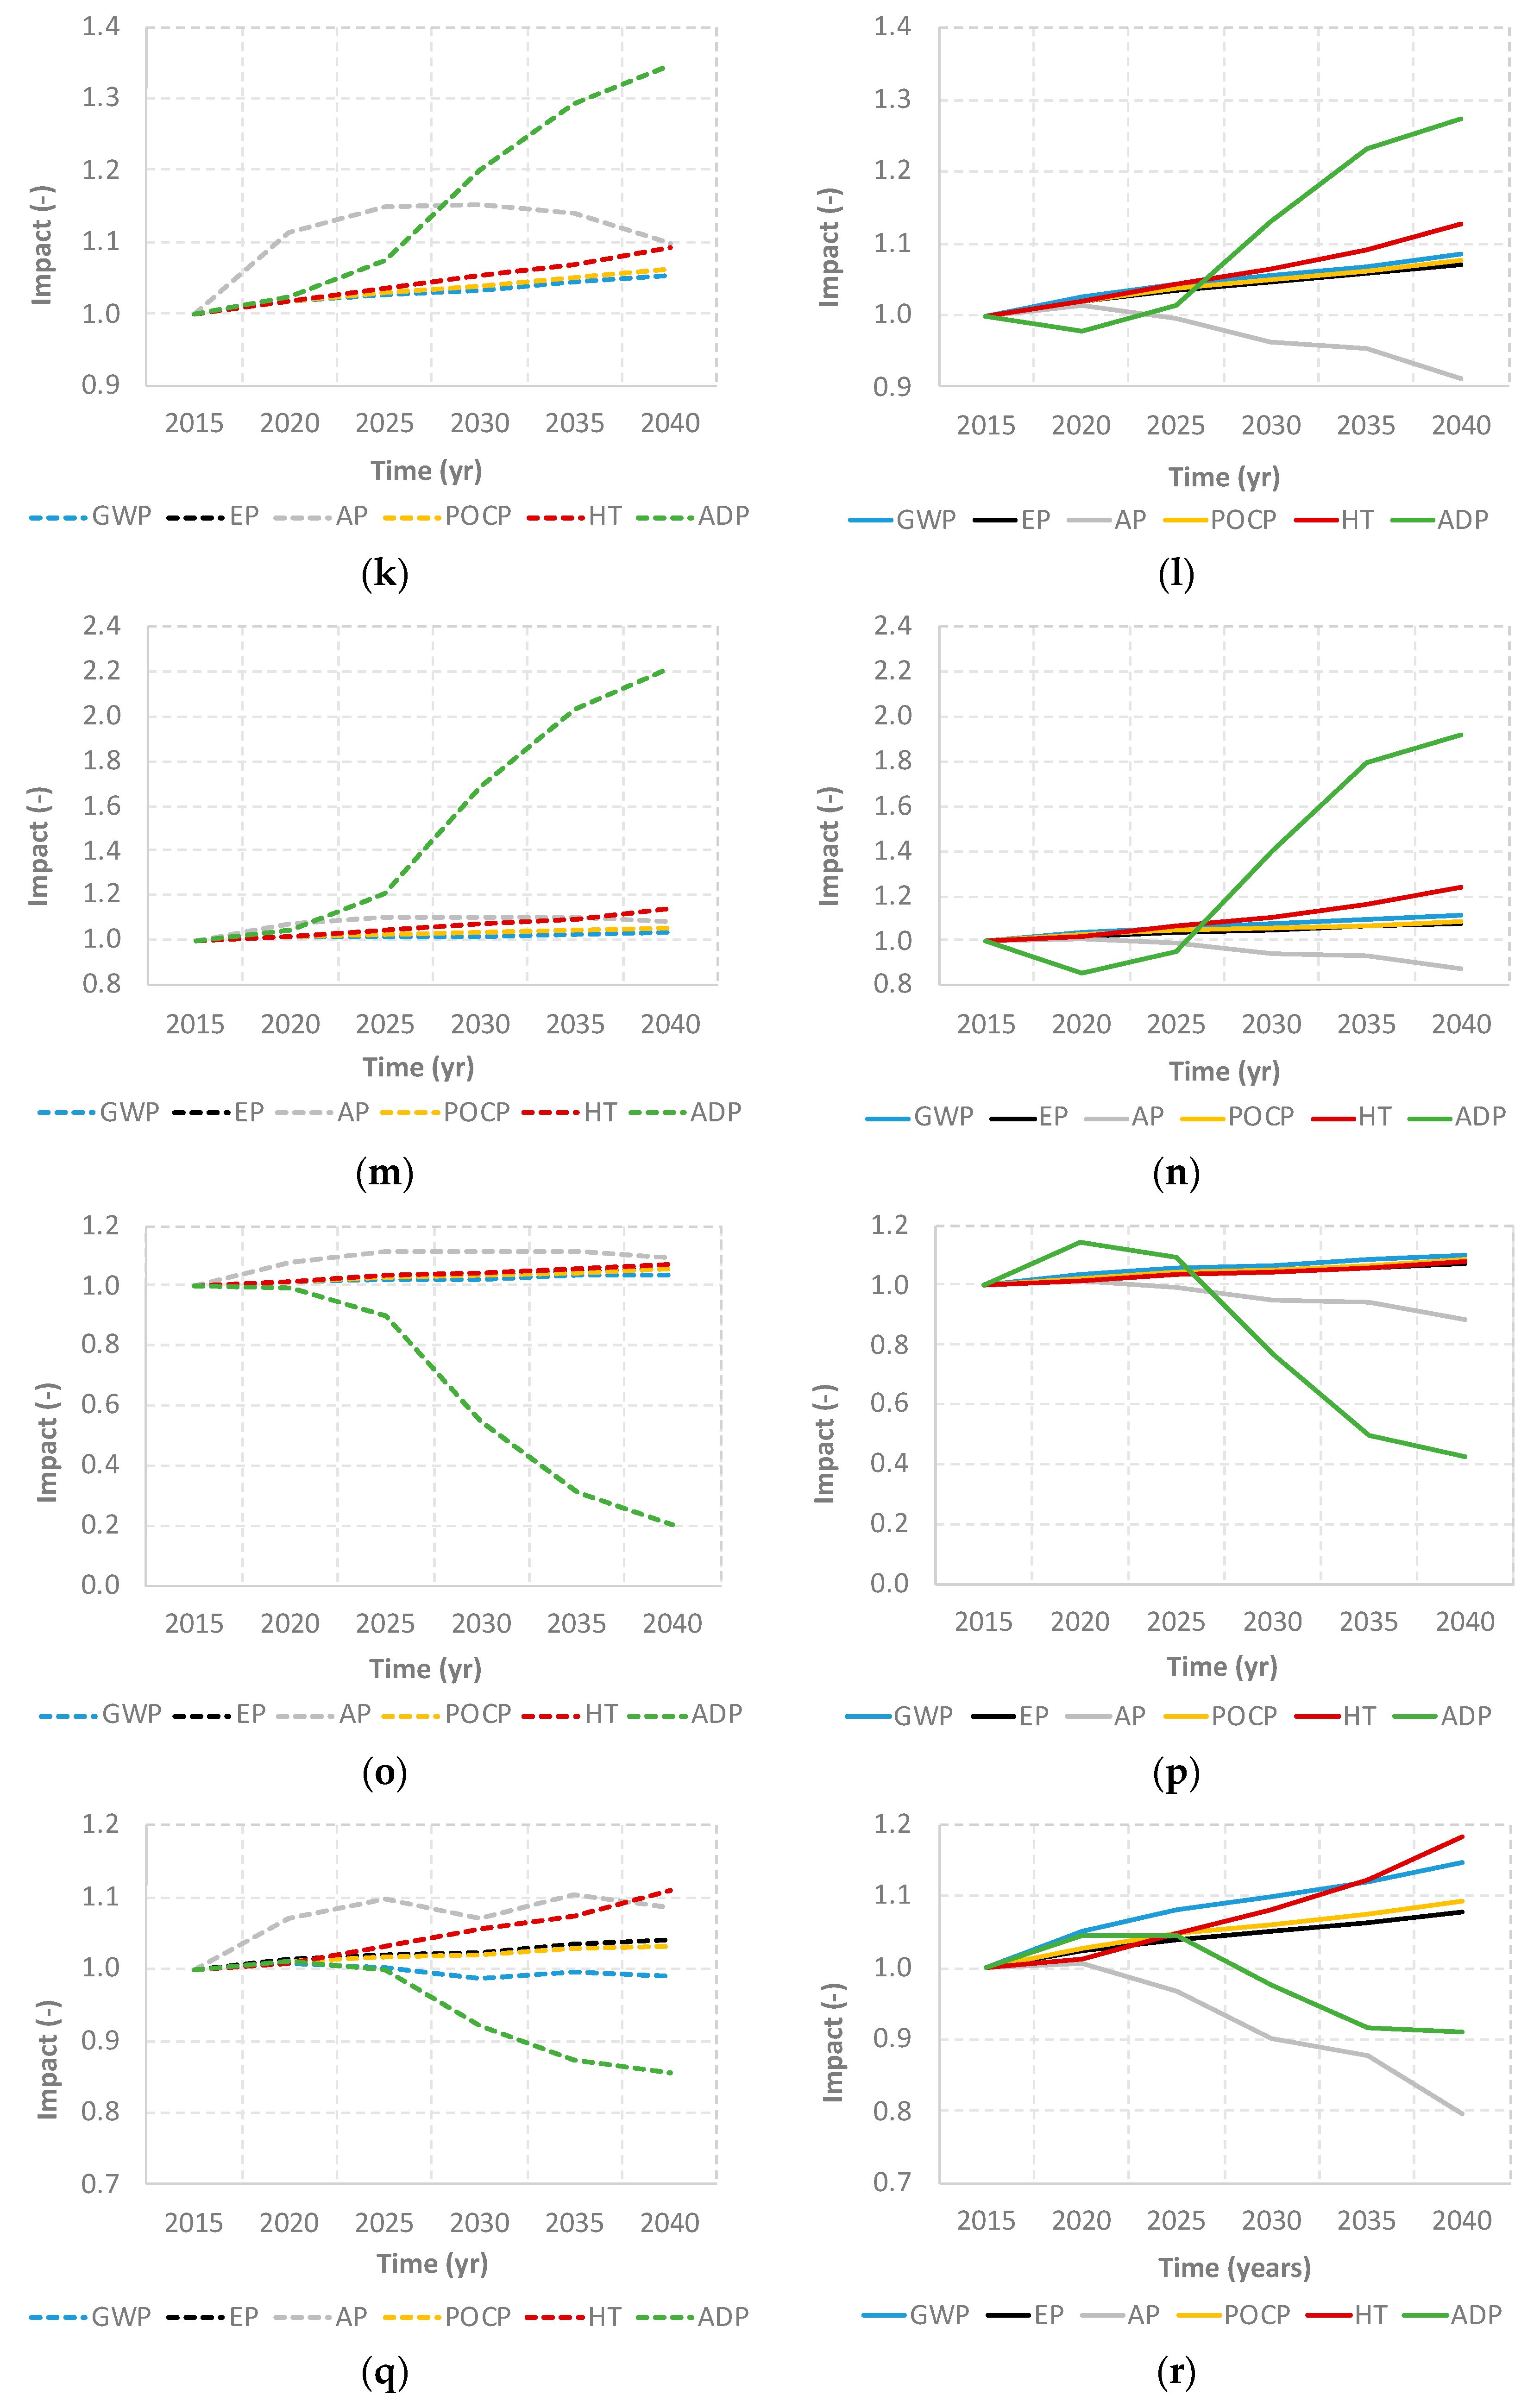
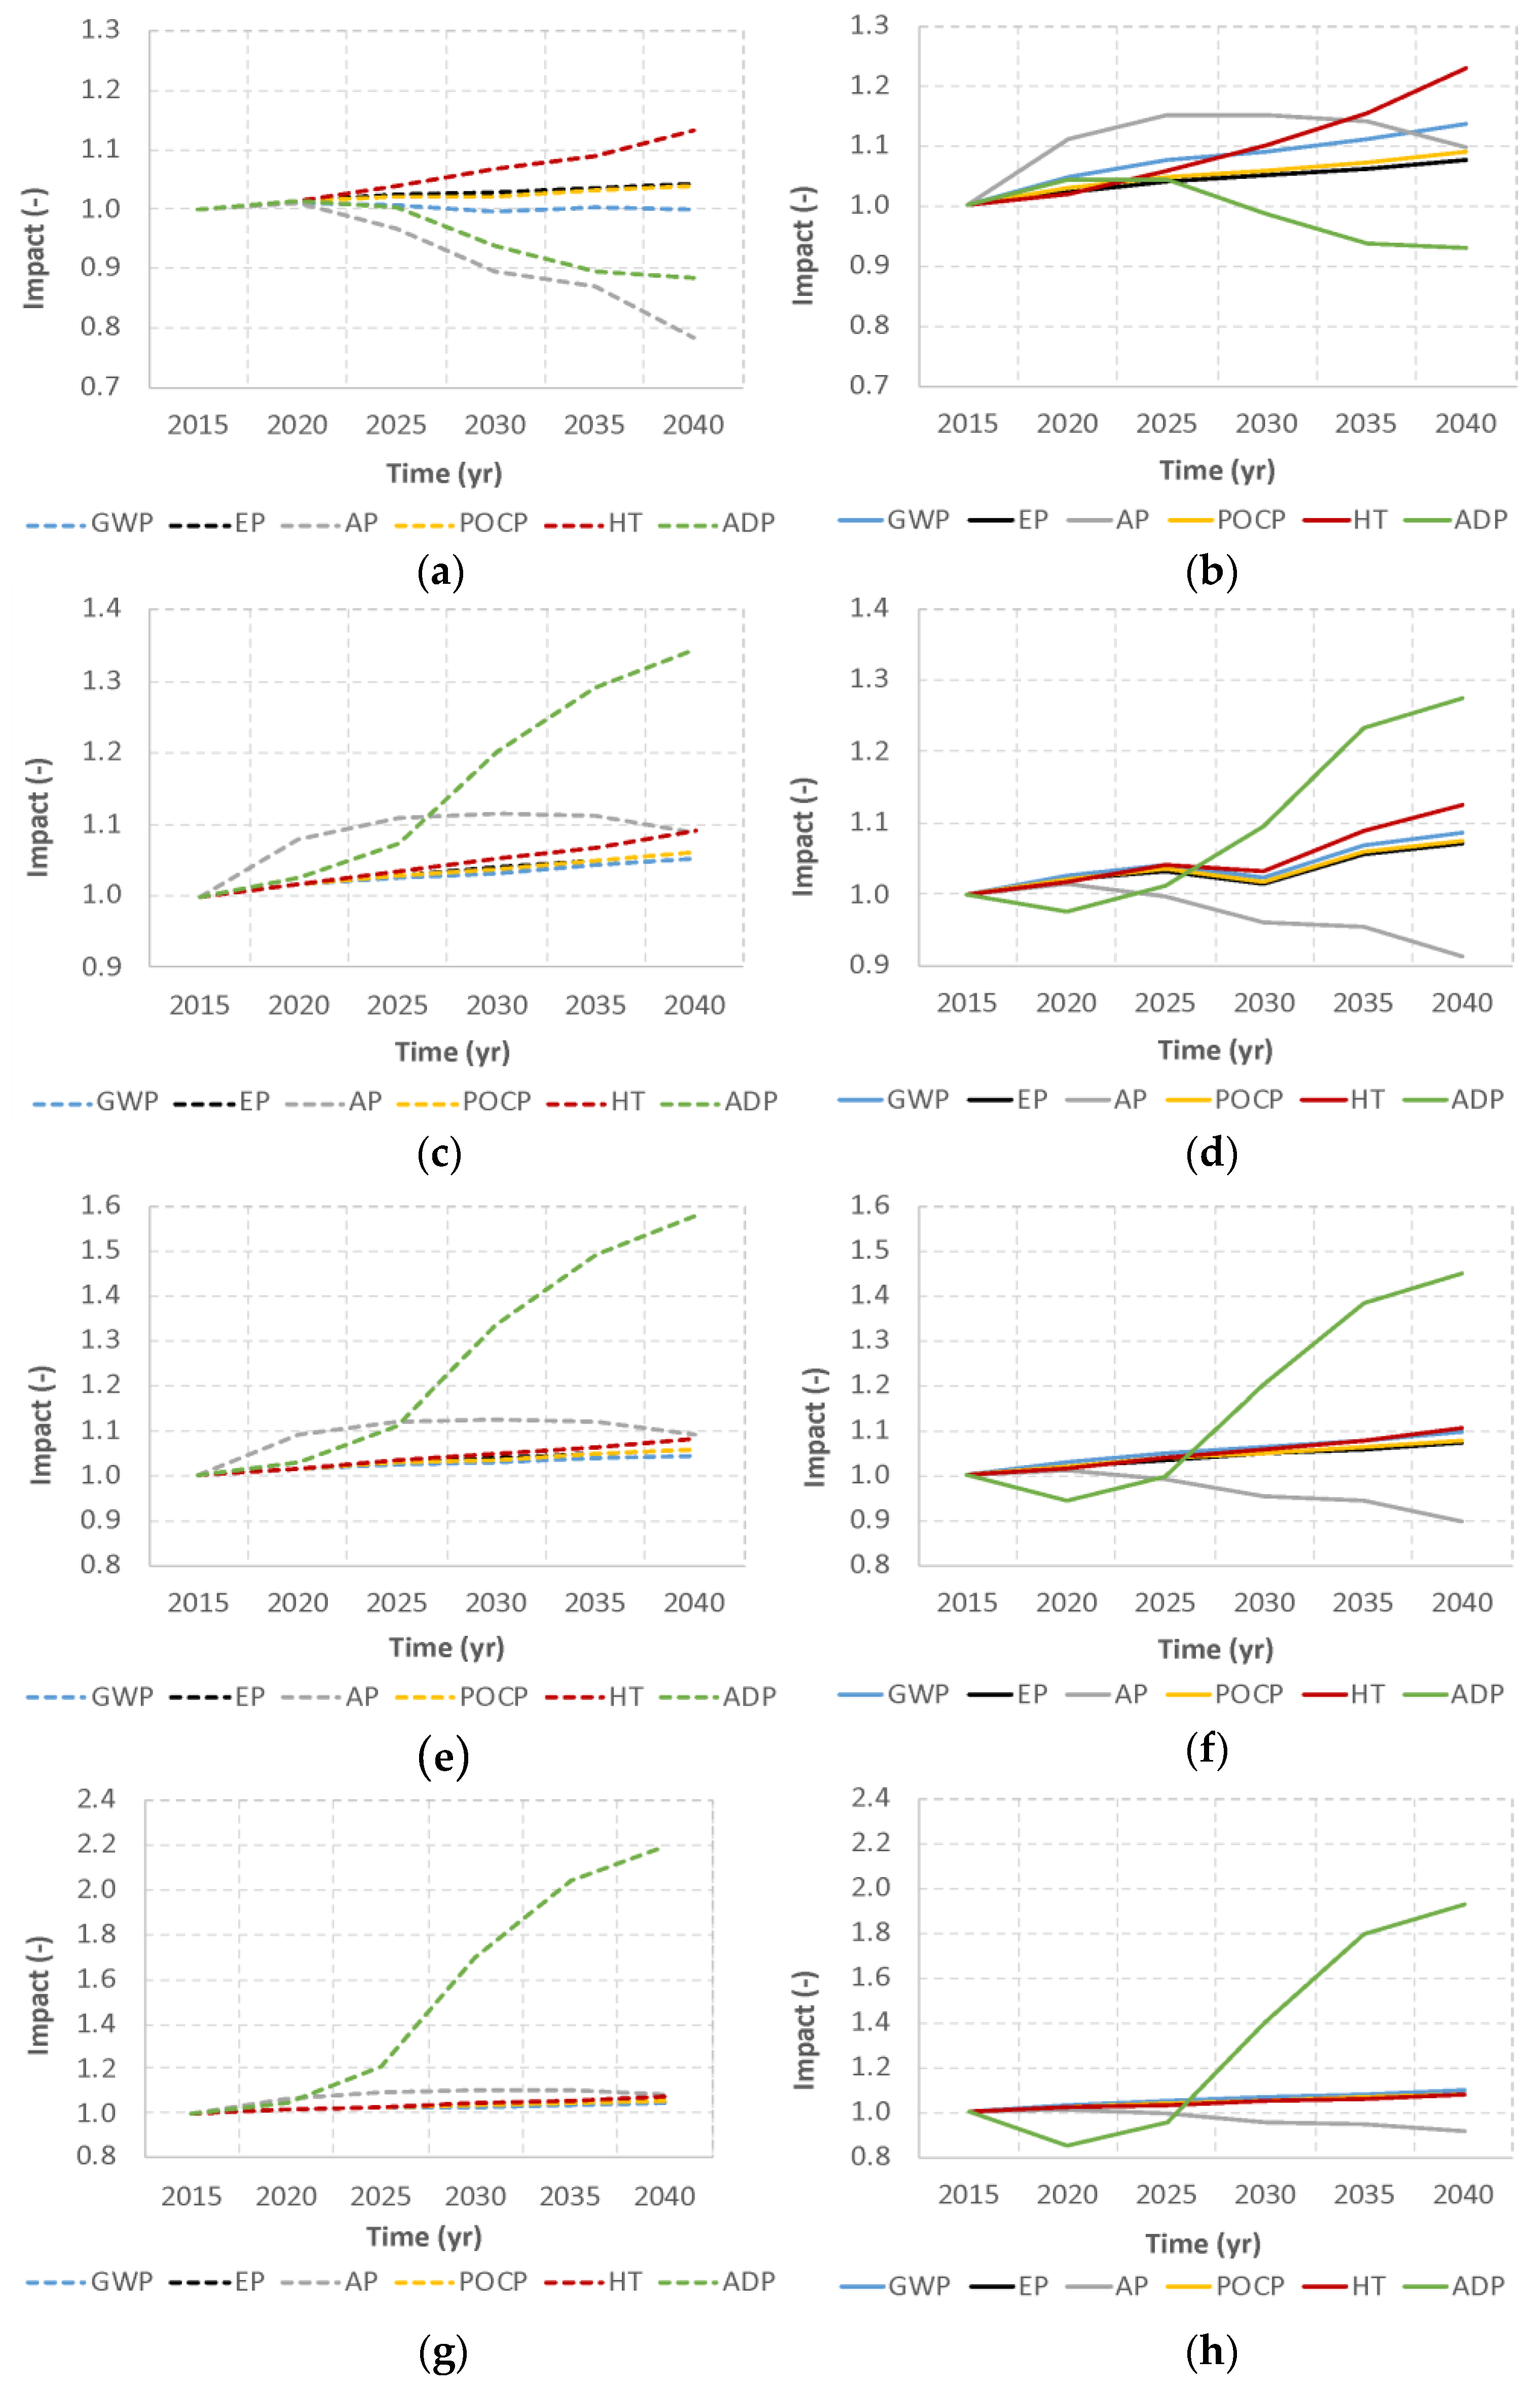
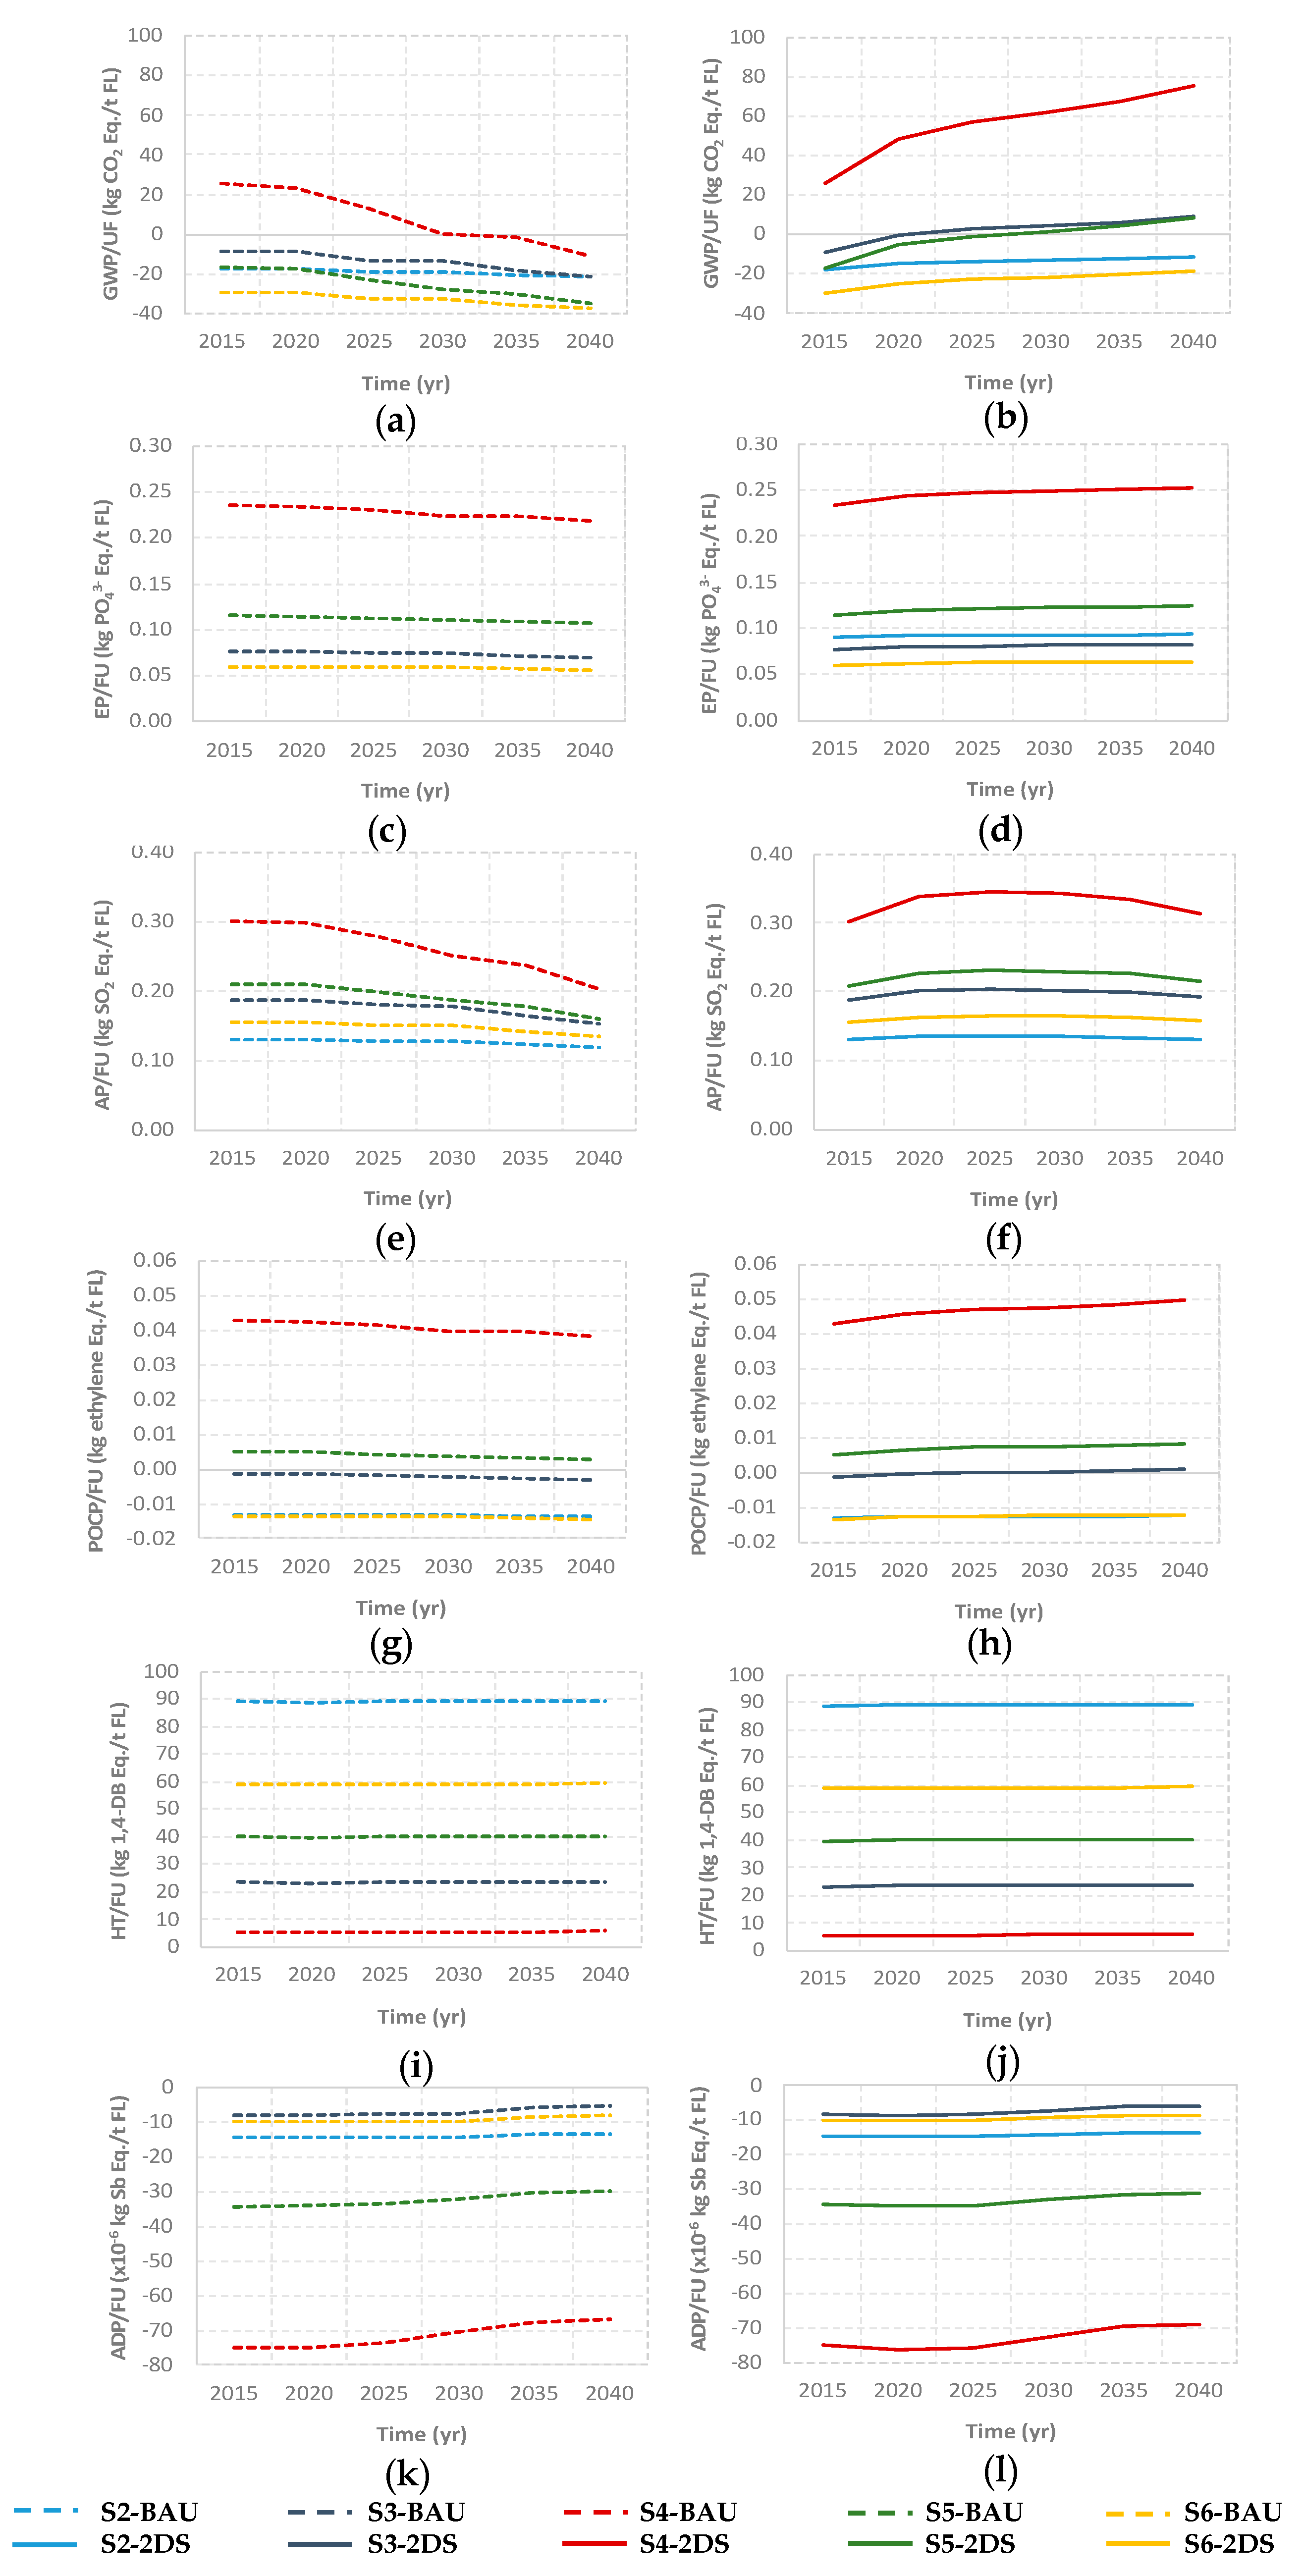
3. Results and Discussion
3.1. Environmental Impacts of the Current Spanish Regional FLW Management: Scenario 1
3.2. Alternative Simulated Scenarios Analysis
3.3. Comparison with the Literature
4. Conclusions
Author Contributions
Funding
Acknowledgments
Conflicts of Interest
Appendix A

| Spanish Region | Stage | Cereals | Roots and Tubers | Sweets | Vegetable Oils | Vegetables | Fruits | Pulses | Meat | Fish and Seafood | Dairy Products | Eggs |
|---|---|---|---|---|---|---|---|---|---|---|---|---|
| AN | 1 | 258.6 | 55.1 | 5.1 | 21.8 | 362.0 | 360.4 | 10.2 | 20.6 | 13.5 | 33.0 | 7.4 |
| 2 | 127.5 | 36.4 | 5.5 | 13.8 | 10.8 | 9.8 | 1.7 | 52.5 | 10.5 | 1.8 | 1.3 | |
| 3 | 21.1 | 16.0 | 7.0 | 3.2 | 59.1 | 48.6 | 3.8 | 39.6 | 11.1 | 5.8 | 6.3 | |
| 4 | 257.8 | 49.4 | 51.0 | 13.2 | 176.9 | 152.0 | 10.8 | 104.7 | 20.5 | 79.4 | 24.3 | |
| AR | 1 | 140.9 | 30.0 | 1.4 | 11.9 | 197.2 | 196.4 | 5.6 | 27.1 | 0.2 | 24.0 | 14.2 |
| 2 | 34.1 | 9.7 | 1.5 | 3.7 | 2.9 | 2.6 | 0.5 | 14.1 | 2.8 | 0.5 | 0.3 | |
| 3 | 3.3 | 2.5 | 1.1 | 0.5 | 9.3 | 7.6 | 0.6 | 6.2 | 1.8 | 0.9 | 1.0 | |
| 4 | 40.4 | 7.7 | 8.0 | 2.1 | 27.8 | 23.9 | 1.7 | 16.4 | 3.2 | 12.5 | 3.8 | |
| AS | 1 | 2.2 | 2.3 | 0.0 | 0.0 | 24.2 | 28.4 | 0.9 | 0.0 | 0.0 | 0.0 | 0.2 |
| 2 | 15.3 | 4.4 | 0.7 | 1.6 | 1.3 | 1.2 | 0.2 | 6.3 | 1.3 | 0.2 | 0.2 | |
| 3 | 2.6 | 2.0 | 0.9 | 0.4 | 7.4 | 6.1 | 0.5 | 5.0 | 1.4 | 0.7 | 0.8 | |
| 4 | 32.3 | 6.2 | 6.4 | 1.6 | 22.1 | 19.0 | 1.4 | 13.1 | 2.6 | 10.0 | 3.0 | |
| BA | 1 | 14.7 | 3.1 | 0.2 | 1.2 | 20.6 | 20.5 | 0.6 | 1.7 | 2.9 | 3.4 | 0.6 |
| 2 | 4.5 | 1.3 | 0.2 | 0.5 | 0.4 | 0.3 | 0.1 | 1.9 | 0.4 | 0.1 | 0.0 | |
| 3 | 2.8 | 2.1 | 1.0 | 0.4 | 7.8 | 6.4 | 0.5 | 5.2 | 1.5 | 0.8 | 0.8 | |
| 4 | 33.9 | 6.5 | 6.7 | 1.7 | 23.3 | 20.0 | 1.4 | 13.8 | 2.7 | 10.4 | 3.2 | |
| CN | 1 | 22.0 | 4.7 | 0.4 | 1.9 | 30.8 | 30.6 | 0.9 | 0.6 | 6.5 | 1.0 | 3.7 |
| 2 | 10.8 | 3.1 | 0.5 | 1.2 | 0.9 | 0.8 | 0.1 | 4.4 | 0.9 | 0.2 | 0.1 | |
| 3 | 5.3 | 4.0 | 1.8 | 0.8 | 14.8 | 12.2 | 0.9 | 9.9 | 2.8 | 1.4 | 1.6 | |
| 4 | 64.5 | 12.4 | 12.7 | 3.3 | 44.2 | 38.0 | 2.7 | 26.2 | 5.1 | 19.9 | 6.1 | |
| CT | 1 | 15.7 | 3.3 | 0.4 | 1.3 | 22.0 | 21.9 | 0.6 | 3.3 | 1.2 | 7.2 | 0.2 |
| 2 | 10.8 | 3.1 | 0.5 | 1.2 | 0.9 | 0.8 | 0.1 | 4.4 | 0.9 | 0.2 | 0.1 | |
| 3 | 1.5 | 1.1 | 0.5 | 0.2 | 4.1 | 3.4 | 0.3 | 2.8 | 0.8 | 0.4 | 0.4 | |
| 4 | 18.0 | 3.4 | 3.6 | 0.9 | 12.3 | 10.6 | 0.8 | 7.3 | 1.4 | 5.5 | 1.7 | |
| CM | 1 | 234.6 | 50.0 | 2.5 | 19.8 | 328.4 | 327.0 | 9.3 | 18.2 | 4.2 | 32.0 | 34.3 |
| 2 | 62.0 | 17.7 | 2.7 | 6.7 | 5.2 | 4.8 | 0.8 | 25.5 | 5.1 | 0.9 | 0.6 | |
| 3 | 5.2 | 3.9 | 1.7 | 0.8 | 14.5 | 11.9 | 0.9 | 9.7 | 2.7 | 1.4 | 1.5 | |
| 4 | 63.2 | 12.1 | 12.5 | 3.2 | 43.4 | 37.3 | 2.6 | 25.7 | 5.0 | 19.5 | 6.0 | |
| CL | 1 | 278.2 | 59.2 | 3.6 | 23.5 | 389.4 | 387.7 | 11.0 | 35.8 | 0.6 | 59.8 | 23.2 |
| 2 | 89.8 | 25.6 | 3.9 | 9.7 | 7.6 | 6.9 | 1.2 | 37.0 | 7.4 | 1.3 | 0.9 | |
| 3 | 6.2 | 4.7 | 2.1 | 1.0 | 17.4 | 14.3 | 1.1 | 11.7 | 3.4 | 1.7 | 1.9 | |
| 4 | 75.9 | 14.5 | 15.0 | 3.9 | 52.1 | 44.7 | 3.2 | 30.8 | 6.0 | 23.4 | 7.2 | |
| CAT | 1 | 94.8 | 20.2 | 8.2 | 8.0 | 132.7 | 132.1 | 3.7 | 26.8 | 9.8 | 19.3 | 10.7 |
| 2 | 204.7 | 58.4 | 8.9 | 22.1 | 17.3 | 15.7 | 2.7 | 84.4 | 16.9 | 3.0 | 2.1 | |
| 3 | 18.8 | 14.3 | 6.3 | 2.9 | 52.8 | 43.5 | 3.4 | 35.4 | 10.0 | 5.2 | 5.6 | |
| 4 | 230.4 | 44.1 | 45.6 | 11.8 | 158.1 | 135.9 | 9.7 | 93.6 | 18.4 | 71.0 | 21.7 | |
| EX | 1 | 122.9 | 26.2 | 0.9 | 10.4 | 172.1 | 171.3 | 4.9 | 26.4 | 0.4 | 50.9 | 3.6 |
| 2 | 20.7 | 5.9 | 0.9 | 2.2 | 1.7 | 1.6 | 0.3 | 8.5 | 1.7 | 0.3 | 0.2 | |
| 3 | 2.7 | 2.1 | 6.6 | 0.4 | 7.7 | 6.3 | 0.5 | 5.2 | 1.5 | 0.8 | 0.8 | |
| 4 | 33.5 | 6.4 | 2.8 | 1.7 | 23.0 | 19.8 | 1.4 | 13.6 | 2.7 | 10.3 | 3.2 | |
| GA | 1 | 87.3 | 18.6 | 2.8 | 7.4 | 122.2 | 121.7 | 3.4 | 13.5 | 83.7 | 24.2 | 6.8 |
| 2 | 69.1 | 19.7 | 3.0 | 7.5 | 5.9 | 5.3 | 0.9 | 28.5 | 5.7 | 1.0 | 0.7 | |
| 3 | 6.9 | 5.2 | 2.3 | 1.1 | 19.2 | 15.8 | 1.2 | 12.9 | 3.6 | 1.9 | 2.1 | |
| 4 | 83.9 | 16.1 | 16.6 | 4.3 | 57.5 | 49.5 | 3.5 | 34.0 | 6.7 | 25.8 | 7.9 | |
| LR | 1 | 14.9 | 3.2 | 0.6 | 1.3 | 30.8 | 28.4 | 0.8 | 4.7 | 0.1 | 7.5 | 2.3 |
| 2 | 15.3 | 4.4 | 0.7 | 1.6 | 1.3 | 1.2 | 0.2 | 6.2 | 1.3 | 0.2 | 0.2 | |
| 3 | 1.6 | 1.2 | 0.5 | 0.2 | 4.5 | 3.7 | 0.3 | 3.0 | 0.9 | 0.4 | 0.5 | |
| 4 | 1.6 | 1.2 | 0.5 | 0.2 | 4.5 | 3.7 | 0.3 | 3.0 | 0.9 | 0.4 | 0.5 | |
| MA | 1 | 23.7 | 5.0 | 1.7 | 2.0 | 33.2 | 33.0 | 0.9 | 1.5 | 0.2 | 3.1 | 2.0 |
| 2 | 43.1 | 12.3 | 1.9 | 4.7 | 3.6 | 3.3 | 0.6 | 17.8 | 3.6 | 0.6 | 0.4 | |
| 3 | 16.2 | 12.3 | 5.4 | 2.5 | 45.3 | 37.3 | 2.9 | 30.4 | 8.6 | 4.4 | 4.8 | |
| 4 | 197.6 | 37.8 | 39.1 | 10.1 | 135.6 | 116.5 | 8.3 | 80.2 | 15.7 | 60.9 | 18.6 | |
| MU | 1 | 33.4 | 7.1 | 2.2 | 2.8 | 46.8 | 46.6 | 1.3 | 7.3 | 1.7 | 6.9 | 3.0 |
| 2 | 54.8 | 15.6 | 2.4 | 5.9 | 4.6 | 4.2 | 0.7 | 22.6 | 4.5 | 0.8 | 0.5 | |
| 3 | 3.7 | 2.8 | 1.2 | 0.6 | 10.3 | 8.5 | 0.7 | 6.9 | 2.0 | 1.0 | 1.1 | |
| 4 | 45.0 | 8.6 | 8.9 | 2.3 | 30.9 | 26.6 | 1.9 | 18.3 | 3.6 | 13.9 | 4.2 | |
| NA | 1 | 30.7 | 6.5 | 1.0 | 2.6 | 37.1 | 38.2 | 1.1 | 2.6 | 1.5 | 5.6 | 3.3 |
| 2 | 26.0 | 7.4 | 1.1 | 2.8 | 2.2 | 2.0 | 0.3 | 10.7 | 2.1 | 0.4 | 0.3 | |
| 3 | 1.6 | 1.2 | 0.5 | 0.2 | 4.5 | 3.7 | 0.3 | 3.0 | 0.9 | 0.4 | 0.5 | |
| 4 | 19.7 | 12.9 | 1.9 | 0.1 | 1.8 | 0.0 | 0.0 | 0.0 | 0.0 | 0.0 | 0.0 | |
| PV | 1 | 21.4 | 4.5 | 1.3 | 1.8 | 29.9 | 29.8 | 0.8 | 2.6 | 1.5 | 5.6 | 3.4 |
| 2 | 32.3 | 9.2 | 1.4 | 3.5 | 2.7 | 2.5 | 0.4 | 13.3 | 2.7 | 0.5 | 0.3 | |
| 3 | 5.5 | 4.2 | 1.8 | 0.8 | 15.4 | 12.7 | 1.0 | 10.3 | 2.9 | 1.5 | 1.6 | |
| 4 | 67.2 | 12.9 | 13.3 | 3.4 | 46.1 | 39.6 | 2.8 | 27.3 | 5.4 | 20.7 | 6.3 | |
| VA | 1 | 68.7 | 14.6 | 3.1 | 5.8 | 96.1 | 95.7 | 2.7 | 4.4 | 5.4 | 4.0 | 10.0 |
| 2 | 77.2 | 22.0 | 3.4 | 8.3 | 6.5 | 5.9 | 1.0 | 31.8 | 6.4 | 1.1 | 0.8 | |
| 3 | 12.5 | 9.5 | 4.2 | 1.9 | 35.0 | 28.8 | 2.2 | 23.5 | 6.6 | 3.4 | 3.7 | |
| 4 | 152.9 | 29.3 | 30.2 | 7.8 | 104.9 | 90.2 | 6.4 | 62.1 | 12.2 | 47.1 | 14.4 |
| Scenario | Region | Framework | GWP | EP | AP | POCP | HT | ADP |
|---|---|---|---|---|---|---|---|---|
| S2 | AN | BAU | 26.4 | −65.6 | −62.2 | −76.4 | −90.4 | −97.2 |
| 2DS | 18.9 | −66.1 | −63.6 | −76.6 | −90.4 | −97.2 | ||
| AR | BAU | 15.0 | −19.3 | −20.2 | −11.6 | −51.0 | −17.3 | |
| 2DS | 10.8 | −19.6 | −21.0 | −11.7 | −51.0 | −17.3 | ||
| AS | BAU | 1.4 | −6.7 | −6.0 | −9.9 | −4.6 | −12.1 | |
| 2DS | 1.1 | −6.7 | −6.1 | −9.9 | −4.6 | −12.1 | ||
| BA | BAU | 1.6 | −6.4 | −5.8 | −8.9 | −5.5 | −11.0 | |
| 2DS | 1.2 | −6.4 | −5.9 | −8.9 | −5.5 | −11.0 | ||
| CN | BAU | 2.5 | −11.8 | −10.6 | −17.4 | −8.1 | −21.3 | |
| 2DS | 1.8 | −11.8 | −10.7 | −17.4 | −8.1 | −21.3 | ||
| CT | BAU | 1.8 | −4.6 | −4.4 | 0.0 | −6.1 | −7.0 | |
| 2DS | 1.3 | −4.7 | −4.5 | −5.6 | −6.1 | −7.0 | ||
| CM | BAU | 24.6 | −31.6 | −33.0 | −18.9 | −83.3 | −28.3 | |
| 2DS | 17.6 | −32.1 | −34.3 | −19.2 | −83.4 | −28.3 | ||
| CL | BAU | 29.4 | −39.0 | −40.5 | −24.6 | −100.0 | −36.2 | |
| 2DS | 21.1 | −39.5 | −42.0 | −24.9 | −100.0 | −36.2 | ||
| CAT | BAU | 10.6 | −55.1 | −49.4 | −81.8 | −36.8 | −100.0 | |
| 2DS | 7.5 | −55.3 | −50.0 | −81.9 | −36.9 | −100.0 | ||
| EX | BAU | 13.8 | −16.4 | −17.4 | −8.4 | −46.4 | −13.2 | |
| 2DS | 9.9 | −16.6 | −18.1 | −8.6 | −46.4 | −13.2 | ||
| GA | BAU | 11.3 | −25.3 | −24.3 | −27.7 | −38.7 | −35.6 | |
| 2DS | 8.1 | −25.5 | −24.9 | −27.8 | −38.7 | −35.6 | ||
| LR | BAU | 2.2 | −5.0 | −4.9 | −5.6 | −7.4 | −7.1 | |
| 2DS | 1.6 | −5.0 | −4.9 | −5.6 | −7.4 | −7.1 | ||
| MA | BAU | 2.4 | −33.2 | −28.7 | −55.4 | −8.5 | −66.6 | |
| 2DS | 1.7 | −33.2 | −28.8 | −55.4 | −8.5 | −66.6 | ||
| MU | BAU | 3.8 | −12.9 | −11.9 | −17.5 | −12.5 | −21.7 | |
| 2DS | 2.7 | −13.0 | −12.1 | −17.5 | −12.5 | −21.7 | ||
| NA | BAU | 3.1 | −5.7 | −5.6 | −5.6 | −10.3 | −7.4 | |
| 2DS | 2.2 | −5.8 | −5.8 | −5.6 | −10.3 | −7.4 | ||
| PV | BAU | 2.4 | −13.6 | −12.1 | −20.7 | −8.1 | −25.2 | |
| 2DS | 1.7 | −13.7 | −12.3 | −20.7 | −8.1 | −25.2 | ||
| VA | BAU | 7.1 | −32.6 | −29.4 | −47.2 | −24.5 | −57.9 | |
| 2DS | 5.1 | −32.7 | −29.8 | −47.2 | −24.5 | −57.9 |
| Scenario | Region | Framework | GWP | EP | AP | POCP | HT | ADP |
|---|---|---|---|---|---|---|---|---|
| S3 | AN | BAU | 19.2 | −61.9 | −71.4 | −80.7 | −24.0 | −97.2 |
| 2DS | −3.2 | −63.4 | −75.5 | −81.6 | −24.1 | −97.2 | ||
| AR | BAU | 11.0 | −17.3 | −25.4 | −14.0 | −13.5 | −17.3 | |
| 2DS | −1.7 | −18.1 | −27.7 | −14.5 | −13.5 | −17.3 | ||
| AS | BAU | 1.1 | −6.5 | −6.5 | −10.1 | −1.2 | −12.1 | |
| 2DS | 0.0 | −6.5 | −6.7 | −10.1 | −1.2 | −12.1 | ||
| BA | BAU | 1.2 | −6.2 | −6.4 | −9.2 | −1.5 | −11.0 | |
| 2DS | −0.2 | −6.2 | −6.6 | −9.2 | −1.5 | −11.0 | ||
| CN | BAU | 1.8 | −11.4 | −11.4 | −17.8 | −2.2 | −21.3 | |
| 2DS | −0.2 | −11.6 | −11.8 | −17.8 | −2.2 | −21.3 | ||
| CT | BAU | 1.3 | −4.4 | −5.0 | −5.9 | −1.6 | −7.0 | |
| 2DS | −0.2 | −4.5 | −5.3 | −5.9 | −1.6 | −7.0 | ||
| CM | BAU | 17.9 | −28.3 | −41.4 | −23.0 | −22.1 | −28.3 | |
| 2DS | −2.8 | −29.6 | −45.3 | −23.7 | −22.1 | −28.3 | ||
| CL | BAU | 21.4 | −35.0 | −50.6 | −29.4 | −26.5 | −36.2 | |
| 2DS | −3.4 | −36.6 | −55.2 | −30.3 | −26.5 | −36.2 | ||
| CAT | BAU | 7.6 | −53.6 | −53.1 | −83.6 | −9.9 | −100.0 | |
| 2DS | −1.5 | −54.2 | −54.8 | −83.9 | −9.9 | −100.0 | ||
| EX | BAU | 10.1 | −14.5 | −22.1 | −10.7 | −12.3 | −13.2 | |
| 2DS | −1.5 | −15.3 | −24.2 | −11.1 | −12.3 | −13.2 | ||
| GA | BAU | 8.2 | −23.7 | −28.2 | −29.5 | −10.3 | −35.6 | |
| 2DS | −1.4 | −24.3 | −30.0 | −29.9 | −10.3 | −35.6 | ||
| LR | BAU | 1.6 | −4.7 | −5.5 | −5.9 | −2.0 | −7.1 | |
| 2DS | −0.2 | −4.8 | −5.9 | −6.0 | −2.0 | −7.1 | ||
| MA | BAU | 1.7 | −32.8 | −29.6 | −55.8 | −2.4 | −66.6 | |
| 2DS | −0.4 | −33.0 | −30.0 | −55.9 | −2.4 | −66.6 | ||
| MU | BAU | 2.8 | −12.4 | −13.2 | −18.1 | −3.3 | −21.7 | |
| 2DS | −0.3 | −12.6 | −13.7 | −18.2 | −3.4 | −21.7 | ||
| NA | BAU | 2.3 | −5.3 | −6.6 | −6.1 | −2.7 | −7.4 | |
| 2DS | −0.3 | −5.5 | −7.1 | −6.2 | −2.7 | −7.4 | ||
| PV | BAU | 1.8 | −13.3 | −13.0 | −21.1 | −2.2 | −25.2 | |
| 2DS | −0.2 | −13.4 | −13.3 | −21.2 | −2.2 | −25.2 | ||
| VA | BAU | −0.1 | −31.6 | −31.9 | −48.3 | −6.6 | −57.9 | |
| 2DS | −0.9 | −32.0 | −33.0 | −48.6 | −6.6 | −57.9 |
| Scenario | Region | Framework | GWP | EP | AP | POCP | HT | ADP |
|---|---|---|---|---|---|---|---|---|
| S4 | AN | BAU | −11.6 | −95.7 | −87.5 | −97.6 | −5.9 | −97.2 |
| 2DS | −77.2 | −100.0 | −100.0 | −100.0 | −6.0 | −97.2 | ||
| AR | BAU | −6.4 | −36.4 | −34.5 | −23.5 | −3.3 | −17.3 | |
| 2DS | −43.5 | −38.8 | −41.5 | −24.9 | −3.3 | −17.3 | ||
| AS | BAU | −0.5 | −8.2 | −7.3 | −10.9 | −0.3 | −12.1 | |
| 2DS | −3.8 | −8.4 | −7.9 | −11.1 | −0.3 | −12.1 | ||
| BA | BAU | −0.7 | −8.2 | −7.3 | −10.2 | −0.4 | −11.0 | |
| 2DS | −4.7 | −8.5 | −8.1 | −10.4 | −0.4 | −11.0 | ||
| CN | BAU | −0.9 | −14.5 | −12.8 | −19.3 | −0.6 | −21.3 | |
| 2DS | −6.8 | −14.8 | −14.0 | −19.5 | −0.6 | −21.3 | ||
| CT | BAU | −0.7 | −6.7 | −6.1 | −7.0 | −0.4 | −7.0 | |
| 2DS | −5.2 | −7.0 | −6.9 | −7.2 | −0.4 | −7.0 | ||
| CM | BAU | −10.5 | −59.4 | −56.3 | −38.5 | −5.3 | −28.2 | |
| 2DS | −71.1 | −63.4 | −67.9 | −40.7 | −5.4 | −28.2 | ||
| CL | BAU | −12.7 | −72.4 | −68.5 | −48.1 | −6.4 | −36.1 | |
| 2DS | −85.5 | −77−2 | −82.3 | −50.8 | −6.5 | −36.1 | ||
| CAT | BAU | −4.9 | −67.4 | −59.7 | −90.4 | −2.5 | −100.0 | |
| 2DS | −31.5 | −69.1 | −65.7 | −91.4 | −2.6 | −100.0 | ||
| EX | BAU | −5.8 | −31.9 | −30.4 | −19.3 | −2.9 | −13.2 | |
| 2DS | −39.5 | −34.1 | −36.8 | −20.6 | −3.0 | −13.2 | ||
| GA | BAU | −5.0 | −38.2 | −35.1 | −36.7 | −2.5 | −35.6 | |
| 2DS | −33.1 | −40.0 | −40.4 | −37.8 | −2.6 | −35.6 | ||
| LR | BAU | −0.9 | −7.5 | −6.9 | −7.3 | −0.5 | −7.1 | |
| 2DS | −6.3 | −7.8 | −7.9 | −7.5 | −0.5 | −7.1 | ||
| MA | BAU | −1.2 | −36.0 | −31.1 | −57.4 | −0.7 | −66.6 | |
| 2DS | −7.2 | −36.4 | −32.2 | −57.6 | −0.7 | −66.6 | ||
| MU | BAU | −1.5 | −17.1 | −15.4 | −20.4 | −0.8 | −21.7 | |
| 2DS | −10.6 | −17.7 | −17.1 | −20.7 | −0.9 | −21.7 | ||
| NA | BAU | −1.2 | −9.1 | −8.5 | −8.0 | −0.7 | −7.4 | |
| 2DS | −8.7 | −9.6 | −9.9 | −8.3 | −0.7 | −7.4 | ||
| PV | BAU | −1.0 | −16.3 | −14.4 | −22.6 | −0.6 | −25.2 | |
| 2DS | −6.9 | −9.1 | −15.5 | −22.8 | −0.6 | −25.2 | ||
| VA | BAU | −3.2 | −9.6 | −36.3 | −52.9 | −1.7 | −57.9 | |
| 2DS | −20.9 | −16.3 | −39.6 | −53.6 | −1.7 | −57.9 |
| Scenario | Region | Framework | GWP | EP | AP | POCP | HT | ADP |
|---|---|---|---|---|---|---|---|---|
| S5 | AN | BAU | 34.6 | −70.2 | −74.2 | −83.2 | −40.7 | −97.2 |
| 2DS | 1.8 | −72.4 | −80.4 | −84.4 | −40.8 | −97.2 | ||
| AR | BAU | 19.7 | −22.0 | −26.9 | −15.4 | −22.9 | −17.3 | |
| 2DS | 1.1 | −23.2 | −30.4 | −16.1 | −23.0 | −17.3 | ||
| AS | BAU | 1.9 | −6.9 | −6.6 | −10.2 | −2.1 | −12.1 | |
| 2DS | 0.2 | −7.0 | −6.9 | −10.3 | −2.1 | −12.1 | ||
| BA | BAU | 2.1 | −6.7 | −6.5 | −9.3 | −2.5 | −11.0 | |
| 2DS | 0.1 | −6.8 | −6.9 | −9.4 | −2.5 | −11.0 | ||
| CN | BAU | 3.2 | −12.2 | −11.6 | −18.0 | −3.7 | −21.3 | |
| 2DS | 0.3 | −12.4 | −12.2 | −18.1 | −3.7 | −21.3 | ||
| CT | BAU | 2.4 | −5.0 | −5.2 | −6.0 | −2.7 | −7.0 | |
| 2DS | 0.2 | −5.1 | −5.6 | −6.1 | −2.7 | −7.0 | ||
| CM | BAU | 32.1 | −35.9 | −44.0 | −25.2 | −37.5 | −28.3 | |
| 2DS | 1.8 | −37.9 | −49.7 | −26.3 | −37.5 | −28.3 | ||
| CL | BAU | 38.4 | −44.2 | −53.7 | −32.1 | −45.0 | −36.2 | |
| 2DS | 2.1 | −46.5 | −60.5 | −33.5 | −45.0 | −36.2 | ||
| CAT | BAU | 13.9 | −57.0 | −54.2 | −84.6 | −16.7 | −100.0 | |
| 2DS | 0.6 | −57.9 | −56.8 | −85.1 | −16.7 | −100.0 | ||
| EX | BAU | 18.0 | −18.8 | −23.5 | −11.9 | −20.8 | −13.2 | |
| 2DS | 1.1 | −19.9 | −26.7 | −12.6 | −20.9 | −13.2 | ||
| GA | BAU | 14.8 | −27.2 | −29.4 | −30.6 | −17.4 | −35.6 | |
| 2DS | 0.8 | −28.2 | −32.0 | −31.1 | −17.5 | −35.6 | ||
| LR | BAU | 2.8 | −5.4 | −5.8 | −6.1 | −3.3 | −7.1 | |
| 2DS | 0.2 | −5.5 | −6.3 | −6.2 | −3.4 | −7.1 | ||
| MA | BAU | 3.0 | −33.6 | −29.8 | −56.0 | −3.9 | −66.6 | |
| 2DS | 0.1 | −33.8 | −30.4 | −56.2 | −3.9 | −66.6 | ||
| MU | BAU | 4.9 | −13.6 | −13.6 | −18.4 | −5.7 | −21.7 | |
| 2DS | 0.4 | −13.9 | −14.4 | −18.6 | −5.7 | −21.7 | ||
| NA | BAU | 4.0 | −6.2 | −7.0 | −6.4 | −4.6 | −7.4 | |
| 2DS | 0.3 | −6.5 | −7.7 | −6.5 | −4.6 | −7.4 | ||
| PV | BAU | 3.1 | −14.0 | −13.2 | −21.3 | −3.7 | −25.2 | |
| 2DS | 0.2 | −14.2 | −13.8 | −21.4 | −3.7 | −25.2 | ||
| VA | BAU | 9.3 | −33.8 | −32.7 | −49.0 | −11.1 | −57.9 | |
| 2DS | 0.5 | −34.4 | −34.3 | −49.3 | −11.1 | −57.9 |
| Scenario | Region | Framework | GWP | EP | AP | POCP | HT | ADP |
|---|---|---|---|---|---|---|---|---|
| S6 | AN | BAU | 45.1 | −58.6 | −66.3 | −76.2 | −60.1 | −97.2 |
| 2DS | 31.5 | −59.5 | −68.8 | −76.7 | −60.1 | −97.2 | ||
| AR | BAU | 25.6 | −15.4 | −22.5 | −11.4 | −33.9 | −17.3 | |
| 2DS | 18.0 | −15.9 | −23.9 | −11.7 | −33.9 | −17.3 | ||
| AS | BAU | 2.4 | −6.3 | −6.2 | −9.9 | −3.1 | −12.1 | |
| 2DS | 1.7 | −6.3 | −6.3 | −9.9 | −3.1 | −12.1 | ||
| BA | BAU | 2.7 | −5.9 | −6.1 | −8.9 | −3.7 | −11.0 | |
| 2DS | 1.9 | −6.0 | −6.2 | −8.9 | −3.7 | −11.0 | ||
| CN | BAU | 4.1 | −11.1 | −10.9 | −17.4 | −5.4 | −21.3 | |
| 2DS | 2.9 | −11.2 | −11.2 | −17.4 | −5.4 | −21.3 | ||
| CT | BAU | 3.1 | −4.2 | −4.7 | −5.5 | −4.1 | −7.0 | |
| 2DS | 2.2 | −4.2 | −4.8 | −5.6 | −4.1 | −7.0 | ||
| CM | BAU | 41.8 | −25.2 | −36.7 | −18.7 | −55.4 | −28.3 | |
| 2DS | 29.3 | −26.0 | −39.0 | −19.2 | −55.4 | −28.3 | ||
| CL | BAU | 50.1 | −31.3 | −45.0 | −24.3 | −66.4 | −36.2 | |
| 2DS | 35.1 | −32.2 | −47.7 | −24.9 | −66.5 | −36.2 | ||
| CAT | BAU | 18.1 | −52.3 | −51.0 | −81.7 | −24.5 | −100.0 | |
| 2DS | 12.7 | −52.6 | −52.1 | −81.9 | −24.6 | −100.0 | ||
| EX | BAU | 23.4 | −12.8 | −19.4 | −8.3 | −30.8 | −13.2 | |
| 2DS | 16.4 | −13.3 | −20.7 | −8.6 | −30.8 | −13.2 | ||
| GA | BAU | 19.3 | −22.3 | −26.0 | −27.6 | −25.7 | −35.6 | |
| 2DS | 13.5 | −22.6 | −27.1 | −27.8 | −25.7 | −35.6 | ||
| LR | BAU | 3.7 | −4.4 | −5.1 | −5.5 | −4.9 | −7.1 | |
| 2DS | 2.6 | −4.5 | −5.3 | −5.6 | −4.9 | −7.1 | ||
| MA | BAU | 4.1 | −32.5 | −29.1 | −55.4 | −5.7 | −66.6 | |
| 2DS | 2.8 | −32.6 | −29.3 | −55.4 | −5.7 | −66.6 | ||
| MU | BAU | 6.4 | −12.0 | −12.5 | −17.4 | −8.3 | −21.7 | |
| 2DS | 4.5 | −12.1 | −12.8 | −17.5 | −8.4 | −21.7 | ||
| NA | BAU | 5.2 | −4.9 | −6.1 | −5.6 | −6.8 | −7.4 | |
| 2DS | 3.7 | −5.0 | −6.4 | −5.6 | −6.8 | −7.4 | ||
| PV | BAU | 4.1 | −13.0 | −12.5 | −20.7 | −5.4 | −25.2 | |
| 2DS | 2.9 | −13.1 | −12.7 | −20.7 | −5.4 | −25.2 | ||
| VA | BAU | −0.2 | −30.7 | −30.5 | −47.1 | −16.3 | −57.9 | |
| 2DS | 8.5 | −30.9 | −31.2 | −47.2 | −16.3 | −57.9 |
Appendix B


References
- Adoption of the Paris Agreement, United Nations. 2015. Available online: https://unfccc.int/resource/docs/2015/cop21/eng/l09r01.pdf (accessed on 17 November 2020).
- Instituto para la Diversificación y Ahorro de la Energía. Borrador del Plan Nacional Integrado de Energía y Clima 2021–2030. Available online: https://ec.europa.eu/energy/sites/ener/files/documents/spain_draftnecp.pdf (accessed on 17 November 2020). (In Spanish).
- Communication from the Commission to the European Parliament, the Council, the European Economic and Social Committee and the Committee of the Regions. In An EU-Wide Assessment of National Energy and Climate Plans; COM (2020) 564 final; European Union: Brussels, Belgium, 2020.
- Haberl, H.; Beringer, T.; Bhattacharya, S.C.; Erb, K.H.; Hoogwijk, M. The global technical potential of bio-energy in 2050 considering sustainability constraints. Curr. Opin. Environ. Sustain. 2010, 2, 394–403. [Google Scholar] [CrossRef] [PubMed] [Green Version]
- European Commission. Energy in Figures, Statistical Pocketbook 2008. 2017. Available online: https://ec.europa.eu/energy/data-analysis/energy-statistical-pocketbook_en?redir=1- (accessed on 17 November 2020).
- Red Eléctrica de España. Las Energías Renovables en el Sistema Eléctrico Español. 2019. Available online: https://www.ree.es/sites/default/files/11_PUBLICACIONES/Documentos/Renovables-2019.pdf (accessed on 19 November 2020). (In Spanish).
- FAO. The State of Food and Agriculture—Moving Forward on Food Loss and Waste Reduction. 2019. Available online: http://www.fao.org/3/ca6030en/ca6030en.pdf (accessed on 19 November 2020).
- Kiran, E.U.; Trzcinski, A.P.; Jern, W.N.; Liu, Y. Bioconversion of food waste to energy: A review. Fuel 2014, 134, 389–399. [Google Scholar] [CrossRef]
- Gintouli, J.; Agostini, A.; Caserini, S.; Lugato, E.; Baxter, D.; Marelli, L. Climate change impacts of power generation from residual biomass. Biomass Bioenergy 2016, 89, 146–158. [Google Scholar] [CrossRef]
- Secondi, L.; Principato, L.; Laureti, T. Household food waste behavior in EU-27 countries: A multilevel analysis. Food Policy 2015, 56, 25–40. [Google Scholar] [CrossRef]
- Maisarah, M.; Bong, C.P.C.; Ho, W.S.; Lim, J.S.; Muis, Z.; Hashim, H.; Elagroudy, S.; Ling, G.H.T.; Ho, C.S. Review on the suitability of waste for appropriate waste-to-energy technology. Chem. Eng. Trans. 2018, 63, 187–192. [Google Scholar]
- Gustavsson, J.; Cederberg, C.; Sonesson, U.; Van Otterdijk, R.; Meybeck, A. Global Food Losses and Food Waste; Extent, Causes and Prevention. 2011. Available online: http://www.fao.org/sustainable-food-value-chains/library/detalles/es/c/266053/ (accessed on 19 November 2020).
- Montagut, X.; Gascon, J. Alimentos desperdiciados. In Un Análisis del Derroche Alimentario Desde la Soberanía Alimentaria; Icaria Editorial: Barcelona, Spain, 2014; ISBN 978-84-9888-618-4. (In Spanish) [Google Scholar]
- Foley, J.A.; Ramankutty, N.; Brauman, K.A.; Cassidy, E.S.; Gerber, J.S.; Johnston, M.; Mueller, N.D.; O’Connell, C.; Ray, D.K.; West, P.C.; et al. Solutions for a cultivated planet. Nature 2011, 478, 337–342. [Google Scholar] [CrossRef] [Green Version]
- Godfray, H.C.J.; Beddington, J.R.; Crute, I.R.; Haddad, L.; Lawrence, D.; Muir, J.F.; Pretty, J.; Robinson, S.; Thomas, S.M.; Toulmin, C. Food Security: The Challenge of Feeding 9 Billion People. Science 2010, 327, 812–818. [Google Scholar] [CrossRef] [Green Version]
- European Commission. Communication from the Commission to the European Parliament, the Council, the European Economic and Social Committee of the Regions. Closing the Loop, An EU Action Plan for the Circular Economy, COM/2015/0614 Final. 2015. Available online: https://eur-lex.europa.eu/legal-content/EN/TXT/?uri=CELEX%3A52015DC0614 (accessed on 19 November 2020).
- European Commission. Report on the Implementation of the Circular Economy Action Plan. 2019. Available online: https://ec.europa.eu/environment/circular-economy/pdf/new_circular_economy_action_plan.pdf (accessed on 19 November 2020).
- European Commission. Farm to Fork Strategy—For a Fair, Healthy and Environmentally-Friendly Food System. 2020. Available online: https://ec.europa.eu/food/sites/food/files/safety/docs/f2f_action-plan_2020_strategy-info_en.pdf (accessed on 19 November 2020).
- European Commission. A Framework Strategy for a Resilient Energy Union with a Forward-Looking Climate Change Policy, Communication from the Commission to the European Parliament, the Council, the European Economic and Social Committee, the Committee of the Regions and the European Investment Bank, COM/2015/080 Final. 2015. Available online: https://eur-lex.europa.eu/legal-content/EN/TXT/?uri=CELEX:52015DC0080 (accessed on 19 November 2020).
- Cristobal, J.; Castellani, V.; Manfredi, S.; Sala, S. Prioritizing and optimizing sustainable measures for food waste prevention and management. Waste Manag. 2018, 72, 3–16. [Google Scholar] [CrossRef]
- Directive 2008/98/EC of the European Parliament and of the Council on Waste and Repealing Certain Directives, Official Journal of the European Union. 2008. Available online: https://eur-lex.europa.eu/legal-content/EN/TXT/?uri=celex%3A32008L0098 (accessed on 19 November 2020).
- European Commission. Council Directive 1999/31/EC. 1999. Available online: https://eur-lex.europa.eu/legal-content/EN/TXT/PDF/?uri=CELEX:31999L0031&from=EN (accessed on 19 November 2020).
- Castillo-Giménez, J.; Montañés, A.; Picazo-Tadeo, A.J. Performance and convergence in municipal waste treatment in the European Union. Waste Manag. 2019, 85, 222231. [Google Scholar] [CrossRef]
- Danish Ministry of the Environment. The Danish Action Plan for Promotion of Eco-Efficient Technologies—Danish Lessons. 2013. Available online: https://eng.ecoinnovation.dk/media/mst/8051413/Affald_Case_Forbr%C3%A6nding_web_15.01.13.pdf (accessed on 19 November 2020).
- World Bank Group. Sustainable Financing and Policy Models for Municipal Compost, Urban Development Series Knowledge Papers, 24. 2016. Available online: http://documents1.worldbank.org/curated/en/529431489572977398/pdf/113487-WP-compostingnoweb-24-PUBLIC.pdf (accessed on 19 November 2020).
- Fachagentur Nachwachsende Rohstoffe e.V. Solid Fuels, Biofuels, Biogás, 484. 2019. Available online: http://www.fnr.de/fileadmin/allgemein/pdf/broschueren/broschuere_basisdaten_bioenergie_2018_engl_web_neu.pdf (accessed on 19 November 2020).
- ISO 14040 Environmental Management—Life Cycle AssessmentPrinciples and Framework; ISO: Geneva, Switzerland, 2006.
- ISO 14044 Environmental Management—Life Cycle Assessment—Requirements and Guidelines; ISO: Geneva, Switzerland, 2006.
- Pirlo, G.; Carè, S.; Della Casa, G.; Marchetti, R.; Ponzoni, G.; Faeti, V.; Fantin, V.; Masoni, P.; Buttol, P.; Zerbinatti, L.; et al. Environmental impact of heavy pig production in a sample of Italian farms, A cradle to farm-gate analysis. Sci. Total Environ. 2016, 565, 576–585. [Google Scholar] [CrossRef]
- Garcia-Herrero, I.; Laso, J.; Margallo, M.; Bala, A.; Gazulla, A.; Fullana-i-Palmer, P.; Vázquez Rowe, I.; Irabien, A.; Aldaco, R. Incorporating linear programing and life cycle thinking into environmental sustainability decision-making: A case study on anchovy canning industry. Clean Techn. Environ. Policy 2017. [Google Scholar] [CrossRef] [Green Version]
- Anandarajah, G.; Pye, S.; Ushner, W.; Kesicki, f.; Mcglade, C. TIAM-UCL Global Model Documentation, Working Paper, REF UKERC/WP7ESY/2011/001. 2011. Available online: https://www.ucl.ac.uk/drupal/site_energy-models/sites/energy-models/files/tiam-ucl-manual.pdf (accessed on 19 November 2020).
- FAO. Definitional Framework of Food Loss, Working Paper. 2014. Available online: http://www.fao.org/fileadmin/user_upload/save-food/PDF/FLW_Definition_and_Scope_2014.pdf (accessed on 19 November 2020).
- Garcia-Herrero, I.; Hoehn, D.; Margallo, M.; Laso, J.; Bala, A.; Batle-Bayer, L.; Fullana, P.; Vazquez-Rowe, I.; Gonzalez, M.J.; Durá, M.J.; et al. On the estimation of potential food waste reduction to support sustainable production and consumption policies. Food Policy 2018, 80, 24–38. [Google Scholar] [CrossRef]
- Aldaco, R.; Butnar, I.; Margallo, M.; Laso, J.; Rumayor, M.; Dominguez-Ramos, A.; Irabien, A.; Dodds, P.E. Bringing value to the chemical industry from capture, storage and use of CO2: A dynamic LCA of formic acid production. Sci. Total Environ. 2019, 663, 738–753. [Google Scholar] [CrossRef] [PubMed]
- Spanish Ministry of Agriculture, Food and Environment (MITECO). PEMAR, Plan Estatal Marco de Gestión de Residuos (2016–2022). 2015. Available online: https://www.miteco.gob.es/es/calidad-y-evaluacion-ambiental/planes-y-estrategias/pemaraprobado6noviembrecondae_tcm30-170428.pdf (accessed on 19 November 2020). (In Spanish)
- CONAMA, Congreso Nacional del Medio Ambiente, Estudio de la Situación Actual de las Plantas de Tratamiento Mecánico-Biológico en España. 2014. Available online: http://www.conama.org/conama/download/files/conama2014/CT%202014/1896711843.pdf (accessed on 19 November 2020). (In Spanish).
- Deutsches Biomasserforschungzentrum. Anlagebestand Biogas und Biomethan—Biogaserzeugung und—nutzung in Deutschland, 30. 2017. Available online: https://www.dbfz.de/fileadmin/user_upload/Referenzen/DBFZ_Reports/DBFZ_Report_30.pdf (accessed on 19 November 2020). (In German).
- Bang-Jensen, M.; Moller, J.; Scheutz, C. Comparison of the organic waste management systems in the Danish-German border region using life cycle assessment (LCA). Waste Manag. 2016, 49, 491–504. [Google Scholar] [CrossRef]
- Vision 2020: UK Roadmap to Zero Food Waste to Landfill. 2013. Available online: https://storage.googleapis.com/www.bioregional.com/downloads/Vision-2020-UK-roadmap-to-zero-food-waste-to-landfill_Vision-2020_2013.pdf (accessed on 19 November 2020).
- Composta en Red, Situación del Compostaje Doméstico y Comunitario en el Estado Español. 2012. Available online: http://www.compostaenred.org/proyectos/Proyecto1/publicacion/Sit_compostaje_domycomunitario_Composta%20en%20Red.pdf (accessed on 19 November 2020). (In Spanish).
- Ammann, P. Dry Extraction of Bottom Ashes in WtE Plants; CEWEP-EAA Seminar: Copenhagen, Denmar, 2011. [Google Scholar]
- European Commission. Commission Regulation (EU) Nº 142/2011. 2011. Available online: https://eur-lex.europa.eu/legal-content/EN/TXT/PDF/?uri=CELEX:32011R0142&from=ES (accessed on 19 November 2020).
- Boletín Oficial del Estado, Nº 181, Sec I, 85650. 2011. Available online: https://www.boe.es/boe/dias/2011/07/29/pdfs/BOE-A-2011-13046.pdf (accessed on 19 November 2020). (In Spanish).
- Spanish Ministry of Agriculture, Fisheries and Food (MAPA). Encuesta sobre Superficies y Rendimientos de Cultivos. 2019. Available online: https://www.mapa.gob.es/es/estadistica/temas/estadisticas-agrarias/boletin2019_tcm30-536911.pdf (accessed on 19 November 2020). (In Spanish)
- Spanish Ministry of Agriculture, Fisheries and Food (MAPA). Informe Anual Industria (2015–2016). 2017. Available online: https://www.mapa.gob.es/es/alimentacion/temas/industria-agroalimentaria/_informeanualindustria2015-2016_ok_tcm30-380020.pdf (accessed on 19 November 2020). (In Spanish)
- Instituto Nacional de Estadística. Población por Comunidades Autónomas. 2015. Available online: https://www.ine.es/jaxiT3/Tabla.htm?t=2915&L=0 (accessed on 19 November 2020). (In Spanish)
- Instituto Nacional de Estadística. Estadística de Movimientos Turísticos en Fronteras (FRONTUR). 2016. Available online: https://ine.es/daco/daco42/frontur/frontur1215.pdf (accessed on 19 November 2020). (In Spanish)
- Aldaco, R.; Hoehn, D.; Lado, J.; Margallo, M.; Ruiz-Salmón, I.; Cristóbal, J.; Kahhat, R.; Villanueva-Rey, P.; Bala, A.; Batlle-Bayer, L.; et al. Food waste management during the COVID-19 outbreak: A holistic climate, economic and nutritional approach. Sci. Total Environ. 2020, 742, 140524. [Google Scholar] [CrossRef] [PubMed]
- GaBi 9.2: Software-System and Databases for Life Cycle Engineering; Sphera: Stuttgart-Echterdingen, Germany, 2019.
- Cimpan, C.; Wenzel, H. Energy implications of mechanical and mechanical–biological treatment compared to direct waste-to-energy. Waste Manag. 2013, 33, 1648–1658. [Google Scholar] [CrossRef]
- Ecoinvent, Ecoinvent v3 database, Ecoinvdent Centre. 2016. Available online: http://www.ecoinvent.org/ (accessed on 19 November 2020).
- Junta de Andalucía. 2011. Available online: https://www.agenciaandaluzadelaenergia.es/sites/default/files/documentos/estudio_basico_del_biogas_0.pdf (accessed on 19 November 2020).
- Margallo, M.; Aldaco, R.; Irabien, A.; Carrillo, V.; Fischer, M.; Bala, A.; Fullana, P. Life cycle assessment modelling of waste-to-energy incineration in Spain and Portugal. Waste Manag. Res. 2014, 32, 492–499. [Google Scholar] [CrossRef]
- BGBI, Bundesgesetz vom 5. Dezember 1978, Nr. 676/1978: Verbot der Nutzung der Kernspaltung für die Energieversorgung in Österreich. 1978. Available online: https://www.ris.bka.gv.at/Dokumente/BgblPdf/1978_676_0/1978_676_0.pdf (accessed on 19 November 2020). (In German).
- Arcadis Project number—11/004759, Version C, Assessment of the Options to Improve the Management of Biowaste in the European Union—Final Report, European Commission DG Environment. 2010. Available online: https://ec.europa.eu/environment/waste/compost/pdf/ia_biowaste%20-%20final%20report.pdf (accessed on 19 November 2020).
- Guinée, J.B.; Gorrée, M.; Heijungs, R.; Huppes, G.; Kleijn, R.; Koning, A.; Van Oers, L.; Sleeswijk, A.W.; Suh, S.; De Haes, H.A.U.; et al. Handbook on Life Cycle Assessment. Operational Guide to the ISO Standards; I: LCA in Perspective. IIa: Guide. IIb: Operational Annex. III: Scientific Background; Kluwer Academic Publishers: Dordrecht, The Netherlands, 2002; ISBN 1-4020-0228-9. [Google Scholar]
- Guinée, J.B. Selection of Impact Categories and Classification of LCI. Results to Impact Categories. In Life Cycle Impact Assessment, 1st ed.; Springer: Dordrecht, The Netherlands, 2015; pp. 17–37. [Google Scholar]
- Bernstad Saraiva, A.; Souza, R.G.; Valle, R.A.B. Comparative lifecycle assessment of alternatives for waste management in Rio de Janeiro—Investigating the influence of an attributional or consequential approach. Waste Manag. 2017, 68, 701–710. [Google Scholar] [CrossRef] [Green Version]
- World Bank Group. What a Waste 2.0, A Global Snapshot of Solid Waste Management to 2050. 2018. Available online: https://openknowledge.worldbank.org/handle/10986/30317 (accessed on 19 November 2020).
- European Commission. Commission Delegated Decision (EU) 2019/1597. 2019. Available online: https://eur-lex.europa.eu/legal-content/EN/TXT/PDF/?uri=CELEX:32019D1597&from=GA (accessed on 19 November 2020).
- Achinas, S.; Achinas, V.; Euverink, G.J.W. A Technological Overview of Biogas Production from Biowaste. Engineering 2017, 3, 299–307. [Google Scholar] [CrossRef]
- Xu, C.; Shi, W.; Hong, J.; Zhang, F.; Chen, W. Life cycle assessment of food waste-based biogas generation. Renew. Sust. Energ. Rev. 2015, 49, 169–177. [Google Scholar] [CrossRef]
- Moller, J.; Boldrin, A.; Christensen, T.H. Anaerobic digestion and digestate use: Accounting of greenhouse gases and global warming contribution. Waste Manag. Res. 2009, 27, 8. [Google Scholar] [CrossRef] [PubMed] [Green Version]
- Evangelisti, S.; Lettieri, P.; Borello, D.; Clift, R. Life cycle assessment of energy from waste via anaerobic digestión: A UK case study. Waste Manag. 2014, 34, 226–237. [Google Scholar] [CrossRef] [PubMed]
- Hoehn, D.; Margallo, M.; Laso, J.; García-Herrero, I.; Bala, A.; Fullana-i-Palmer, P.; Irabien, A.; Aldaco, R. Energy Embedded in Food Loss Management and in the Production of Uneaten Food: Seeking a Sustainable Pathway. Energies 2019, 12, 767. [Google Scholar] [CrossRef] [Green Version]
- Bernstad, A.; La Cour Jansen, J. A life cycle approach to the management of household food waste—A Swedish full-scale case study. Waste Manag. 2011, 31, 1879–1896. [Google Scholar] [CrossRef] [PubMed]
- Martínez-Blanco, J.; Colón, J.; Gabarrell, X.; Font, X.; Sánchez, A.; Artola, A.; Rieradevall, J. The use of life cycle assessment for the comparison of biowaste composting at home and full scale. Waste Manag. 2010, 30, 983–994. [Google Scholar] [CrossRef] [Green Version]
- Margallo, M.; Aldaco, R.; Irabien, A.; Bala, A.; Fullana, P. Best available techniques in municipal solid waste incineration (MSWI). Chem. Eng. Trans. 2012, 35, 871–876. [Google Scholar]
- Fruergaard, T.; Astrup, T. Optimal utilization of waste-to-energy in an LCA perspective. Waste Manag. 2011, 31, 572–582. [Google Scholar] [CrossRef]
- Bernstad, A.; La Cour Jansen, J. Review of comparative LCAs of food waste management systems—Current status and potential improvements. Waste Manag. 2012, 32, 2439–2455. [Google Scholar] [CrossRef]
- Burnley, S.; Phillips, R.; Coleman, T.; Rampling, T. Energy implications of the thermal recovery of biodegradable municipal waste materials in the United Kingdom. Waste Manag. 2011, 31, 1049–1959. [Google Scholar] [CrossRef]
- Real Decreto 646/2020, de 7 de julio, por el que se regula la eliminación de residuos mediante depósito en vertedero. In Boletín Oficial del Estado 187; State Agency of Official State Gazette: Madrid, Spain, 2020; pp. 48659–48721. (In Spanish)


| Scenarios | Landfill | Thermal Treatment | AD | AC |
|---|---|---|---|---|
| S1 | Dependent on each region (see Table 2) | |||
| S2 | 2.5% | 2.5% | 20% | 75% |
| S3 | 2.5% | 2.5% | 75% | 20% |
| S4 | 3.3% | 90% | 3.3% | 3.3% |
| S5 | - | 33.3% | 33.3% | 33.3% |
| S6 | - | - | 50% | 50% |
| Region | Landfill | Thermal Treatment | AD | AC |
|---|---|---|---|---|
| AN | 93.8% | - | 2.3% | 3.9% |
| AR | 62.0% | - | 3.0% | - |
| AS | 92.1% | - | - | 7.9% |
| BA | 18.9% | 72.7% | 5.1% | 3.3% |
| CN | 95.7% | - | 4.3% | - |
| CT | 35.1% | 64.9% | - | - |
| CM | 100% | - | - | - |
| CL | 56.4% | - | 43.6% | - |
| CAT | 49.4% | 18.4% | 15.7% | 16.5% |
| EX | 100% | - | - | - |
| GA | 33.6% | 50.6% | 14.9% | 0.9% |
| LR | 35.1% | - | 64.9% | - |
| MA | 63.4% | 10.6% | 25.5% | 0.5% |
| MU | 100% | - | - | - |
| NA | 61.4% | - | 26.6% | 12.1% |
| PV | 65.9% | 25.3% | 6.7% | 2.1% |
| VA | 75.9% | - | 21.6% | 2.5% |
| SP | 68.8% | 11.9% | 14.9% | 4.5% |
| Food Loss and Waste Management | Cereals | Roots and Tubers | Sweets | Vegetable Oils | Vegetables | Fruits | Pulses | Meat | Fish and Seafood | Dairy Products | Eggs |
|---|---|---|---|---|---|---|---|---|---|---|---|
| Prevention | ✔ | ✔ | ✔ | ✔ | ✔ | ✔ | ✔ | ✔ | ✔ | ✔ | ✔ |
| Re-use | ✔ | ✔ | ✔ | ✔ | ✔ | ✔ | ✔ | 🗶 a | 🗶 a | 🗶 a | 🗶 a |
| Animal feed | ✔ | ✔ | ✔ | ✔ | ✔ | ✔ | ✔ | 🗶 a | 🗶 a | 🗶 a | 🗶 a |
| Industrial use | 🗶 | 🗶 | 🗶 | ✔ b | 🗶 | 🗶 | 🗶 | 🗶 | 🗶 | 🗶 | 🗶 |
| AC c | ✔ | ✔ | ✔ | ✔ | ✔ | ✔ | ✔ | 🗶 a | 🗶 a | 🗶 a | 🗶 a |
| AD c | ✔ | ✔ | ✔ | ✔ | ✔ | ✔ | ✔ | ✔ | ✔ | ✔ | ✔ |
| Thermal treatment c | ✔ | ✔ | ✔ | ✔ | ✔ | ✔ | ✔ | ✔ | ✔ | ✔ | ✔ |
| Landfill c | ✔ | ✔ | ✔ | ✔ | ✔ | ✔ | ✔ | ✔ | ✔ | ✔ | ✔ |
| Impact Category Group | Name | Acronym | Unit |
|---|---|---|---|
| Acidification | Acidification Potential | AP | kg SO2 Equivalent |
| Climate change | Global Warming Potential (excluding biogenic carbon) over 100 years | GWP | kg CO2 Equivalent |
| Depletion of abiotic resources | Abiotic Depletion Potential | ADP | kg Sb Equivalent |
| Eutrophication | Eutrophication Potential | EP | kg Phosphate Equivalent |
| Human Toxicity | Human Toxicity Potential | HTP | kg DCB Equivalent |
| Photochemical oxidation | Photochemical Ozone Creation Potential | POCP | kg Ethene Equivalent |
Publisher’s Note: MDPI stays neutral with regard to jurisdictional claims in published maps and institutional affiliations. |
© 2020 by the authors. Licensee MDPI, Basel, Switzerland. This article is an open access article distributed under the terms and conditions of the Creative Commons Attribution (CC BY) license (http://creativecommons.org/licenses/by/4.0/).
Share and Cite
Hoehn, D.; Laso, J.; Cristóbal, J.; Ruiz-Salmón, I.; Butnar, I.; Borrion, A.; Bala, A.; Fullana-i-Palmer, P.; Vázquez-Rowe, I.; Aldaco, R.; et al. Regionalized Strategies for Food Loss and Waste Management in Spain under a Life Cycle Thinking Approach. Foods 2020, 9, 1765. https://doi.org/10.3390/foods9121765
Hoehn D, Laso J, Cristóbal J, Ruiz-Salmón I, Butnar I, Borrion A, Bala A, Fullana-i-Palmer P, Vázquez-Rowe I, Aldaco R, et al. Regionalized Strategies for Food Loss and Waste Management in Spain under a Life Cycle Thinking Approach. Foods. 2020; 9(12):1765. https://doi.org/10.3390/foods9121765
Chicago/Turabian StyleHoehn, Daniel, Jara Laso, Jorge Cristóbal, Israel Ruiz-Salmón, Isabela Butnar, Aiduan Borrion, Alba Bala, Pere Fullana-i-Palmer, Ian Vázquez-Rowe, Rubén Aldaco, and et al. 2020. "Regionalized Strategies for Food Loss and Waste Management in Spain under a Life Cycle Thinking Approach" Foods 9, no. 12: 1765. https://doi.org/10.3390/foods9121765