Bioconversion of Fish Discards through the Production of Lactic Acid Bacteria and Metabolites: Sustainable Application of Fish Peptones in Nutritive Fermentation Media

 , ,
, ,  ,
,
Abstract
:
1. Introduction
2. Materials and Methods
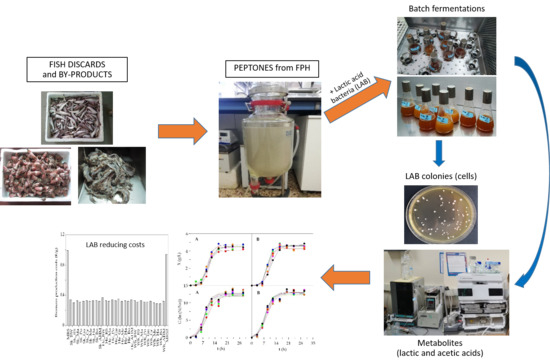
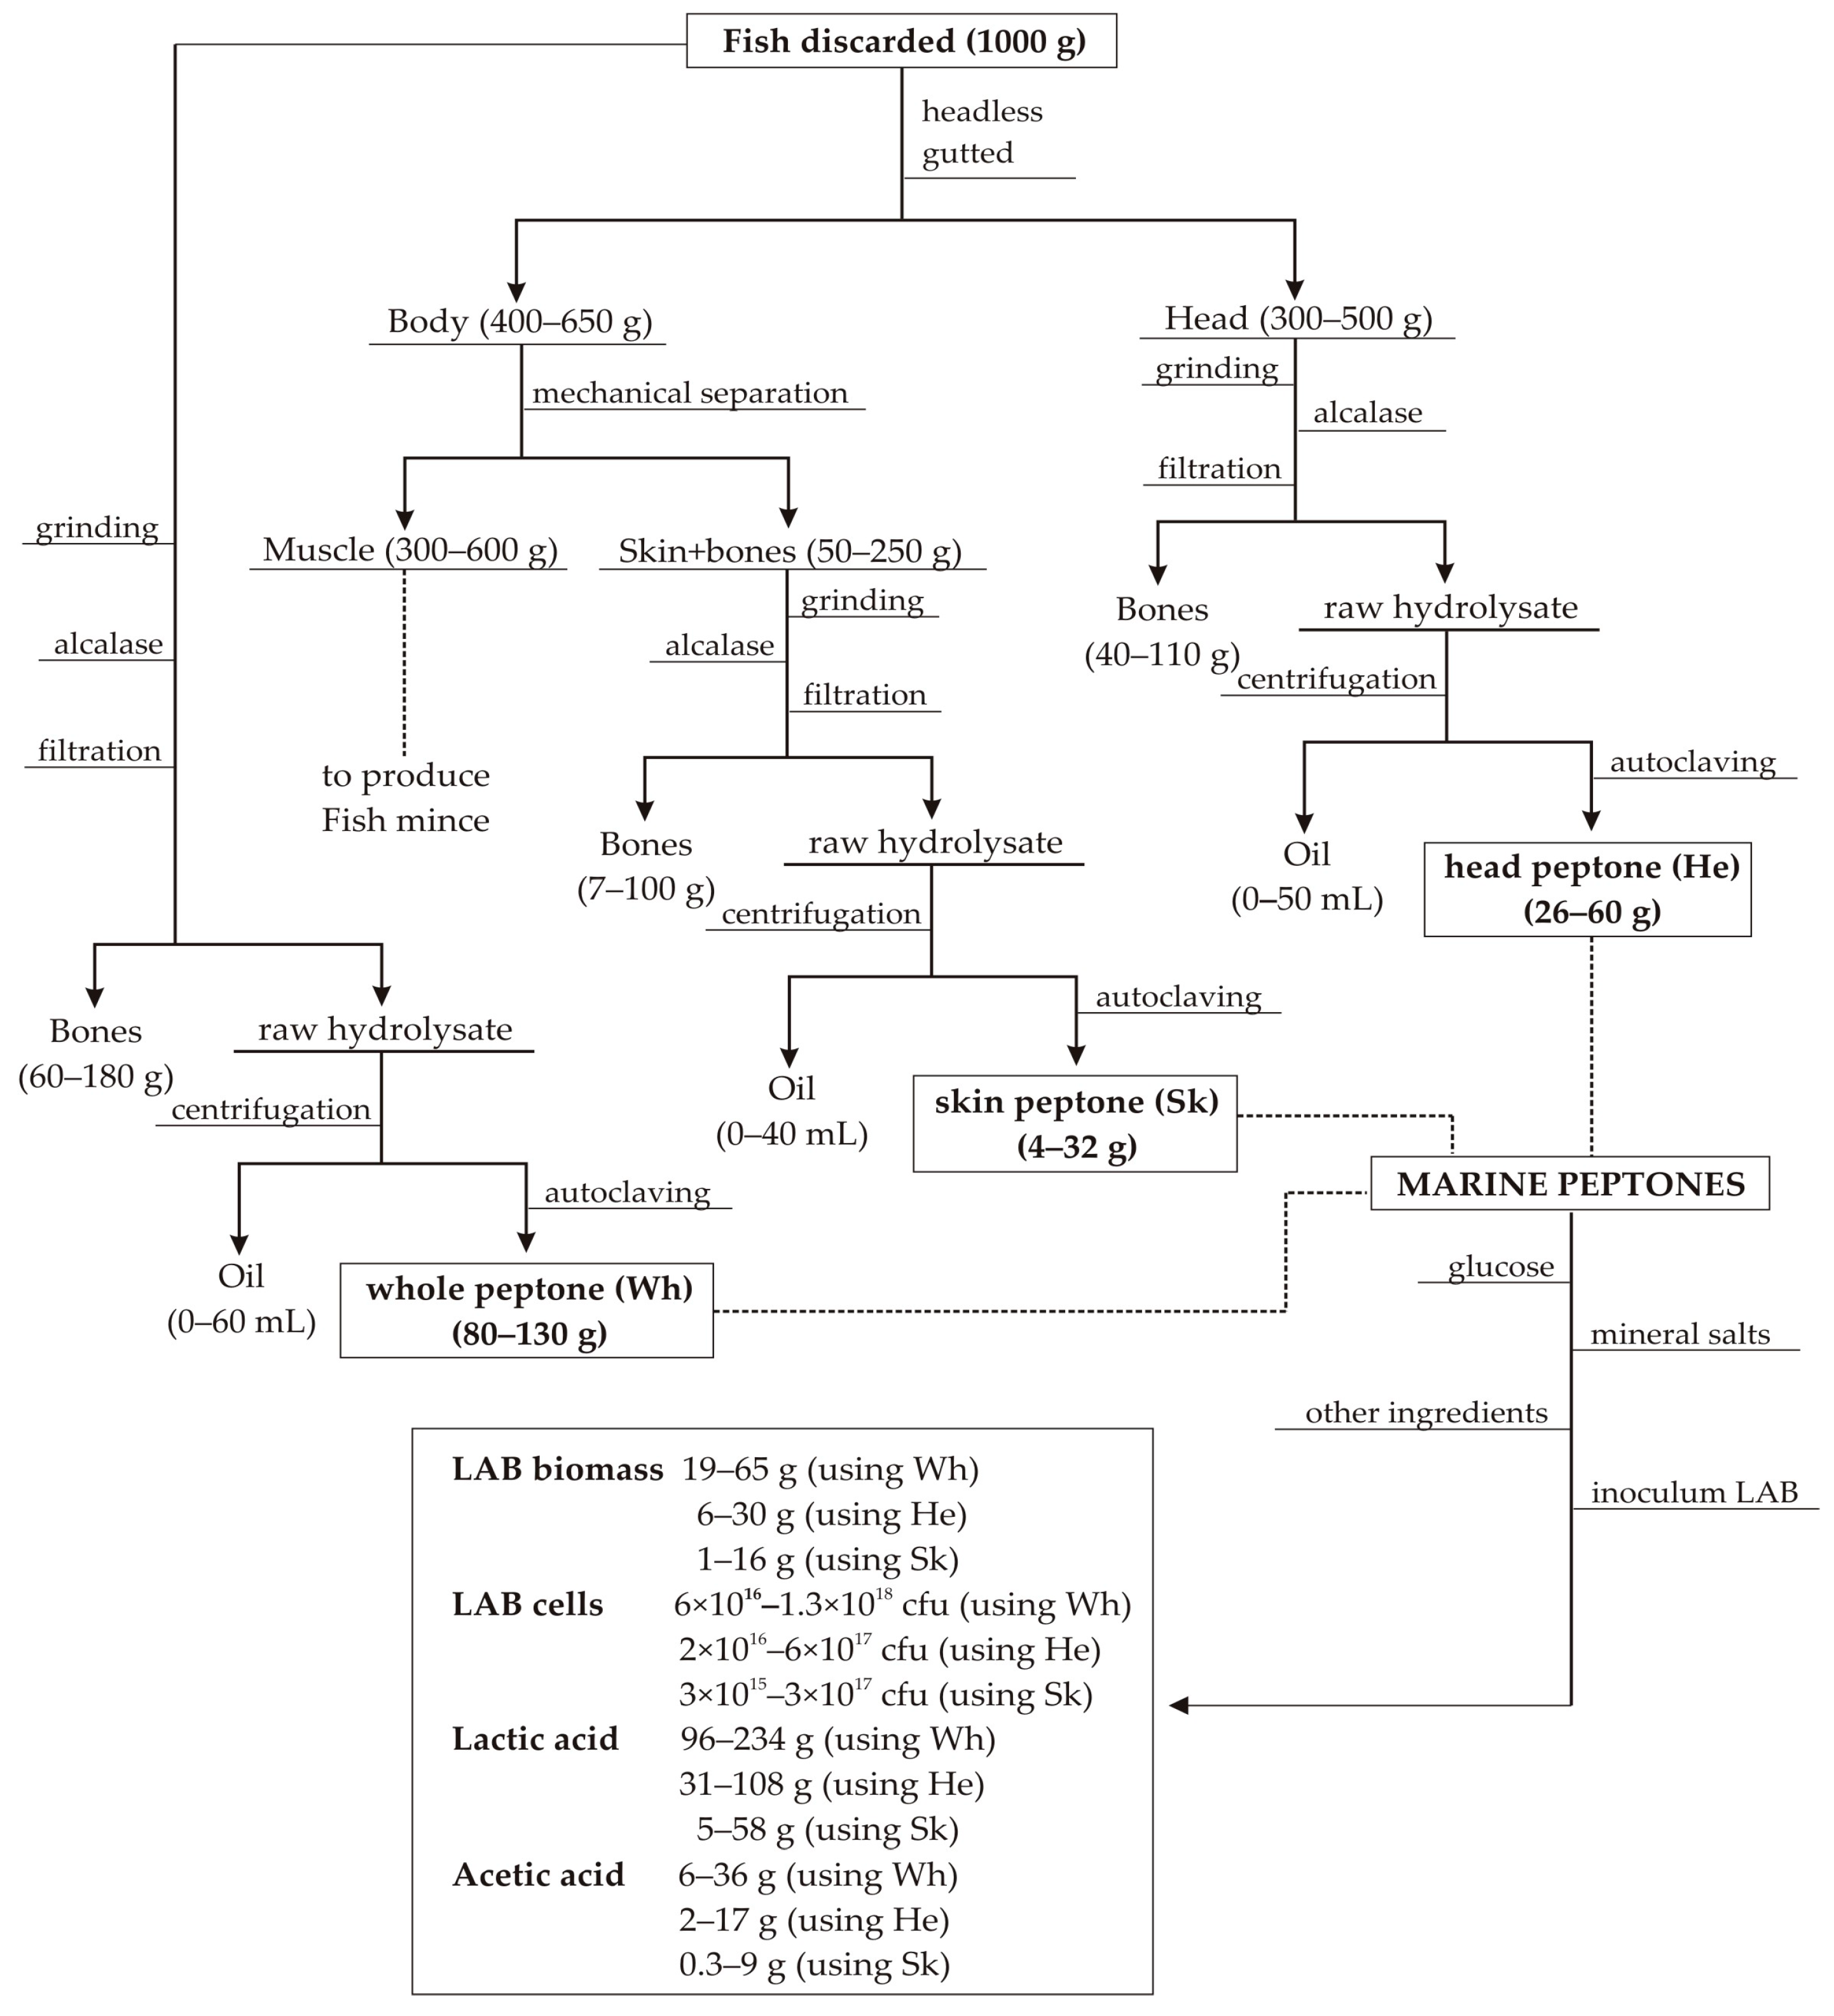
2.1. Fish Discards and Production of Marine Peptones
2.2. Bacterial Protocols and Culture Media
2.3. Analytical Determinations
2.4. Mathematical Modelling of Bacterial Kinetics
2.5. Economical Evaluation of Bioproduction Costs
2.6. Numerical Fittings and Statistical Analyses
3. Results and Discussion
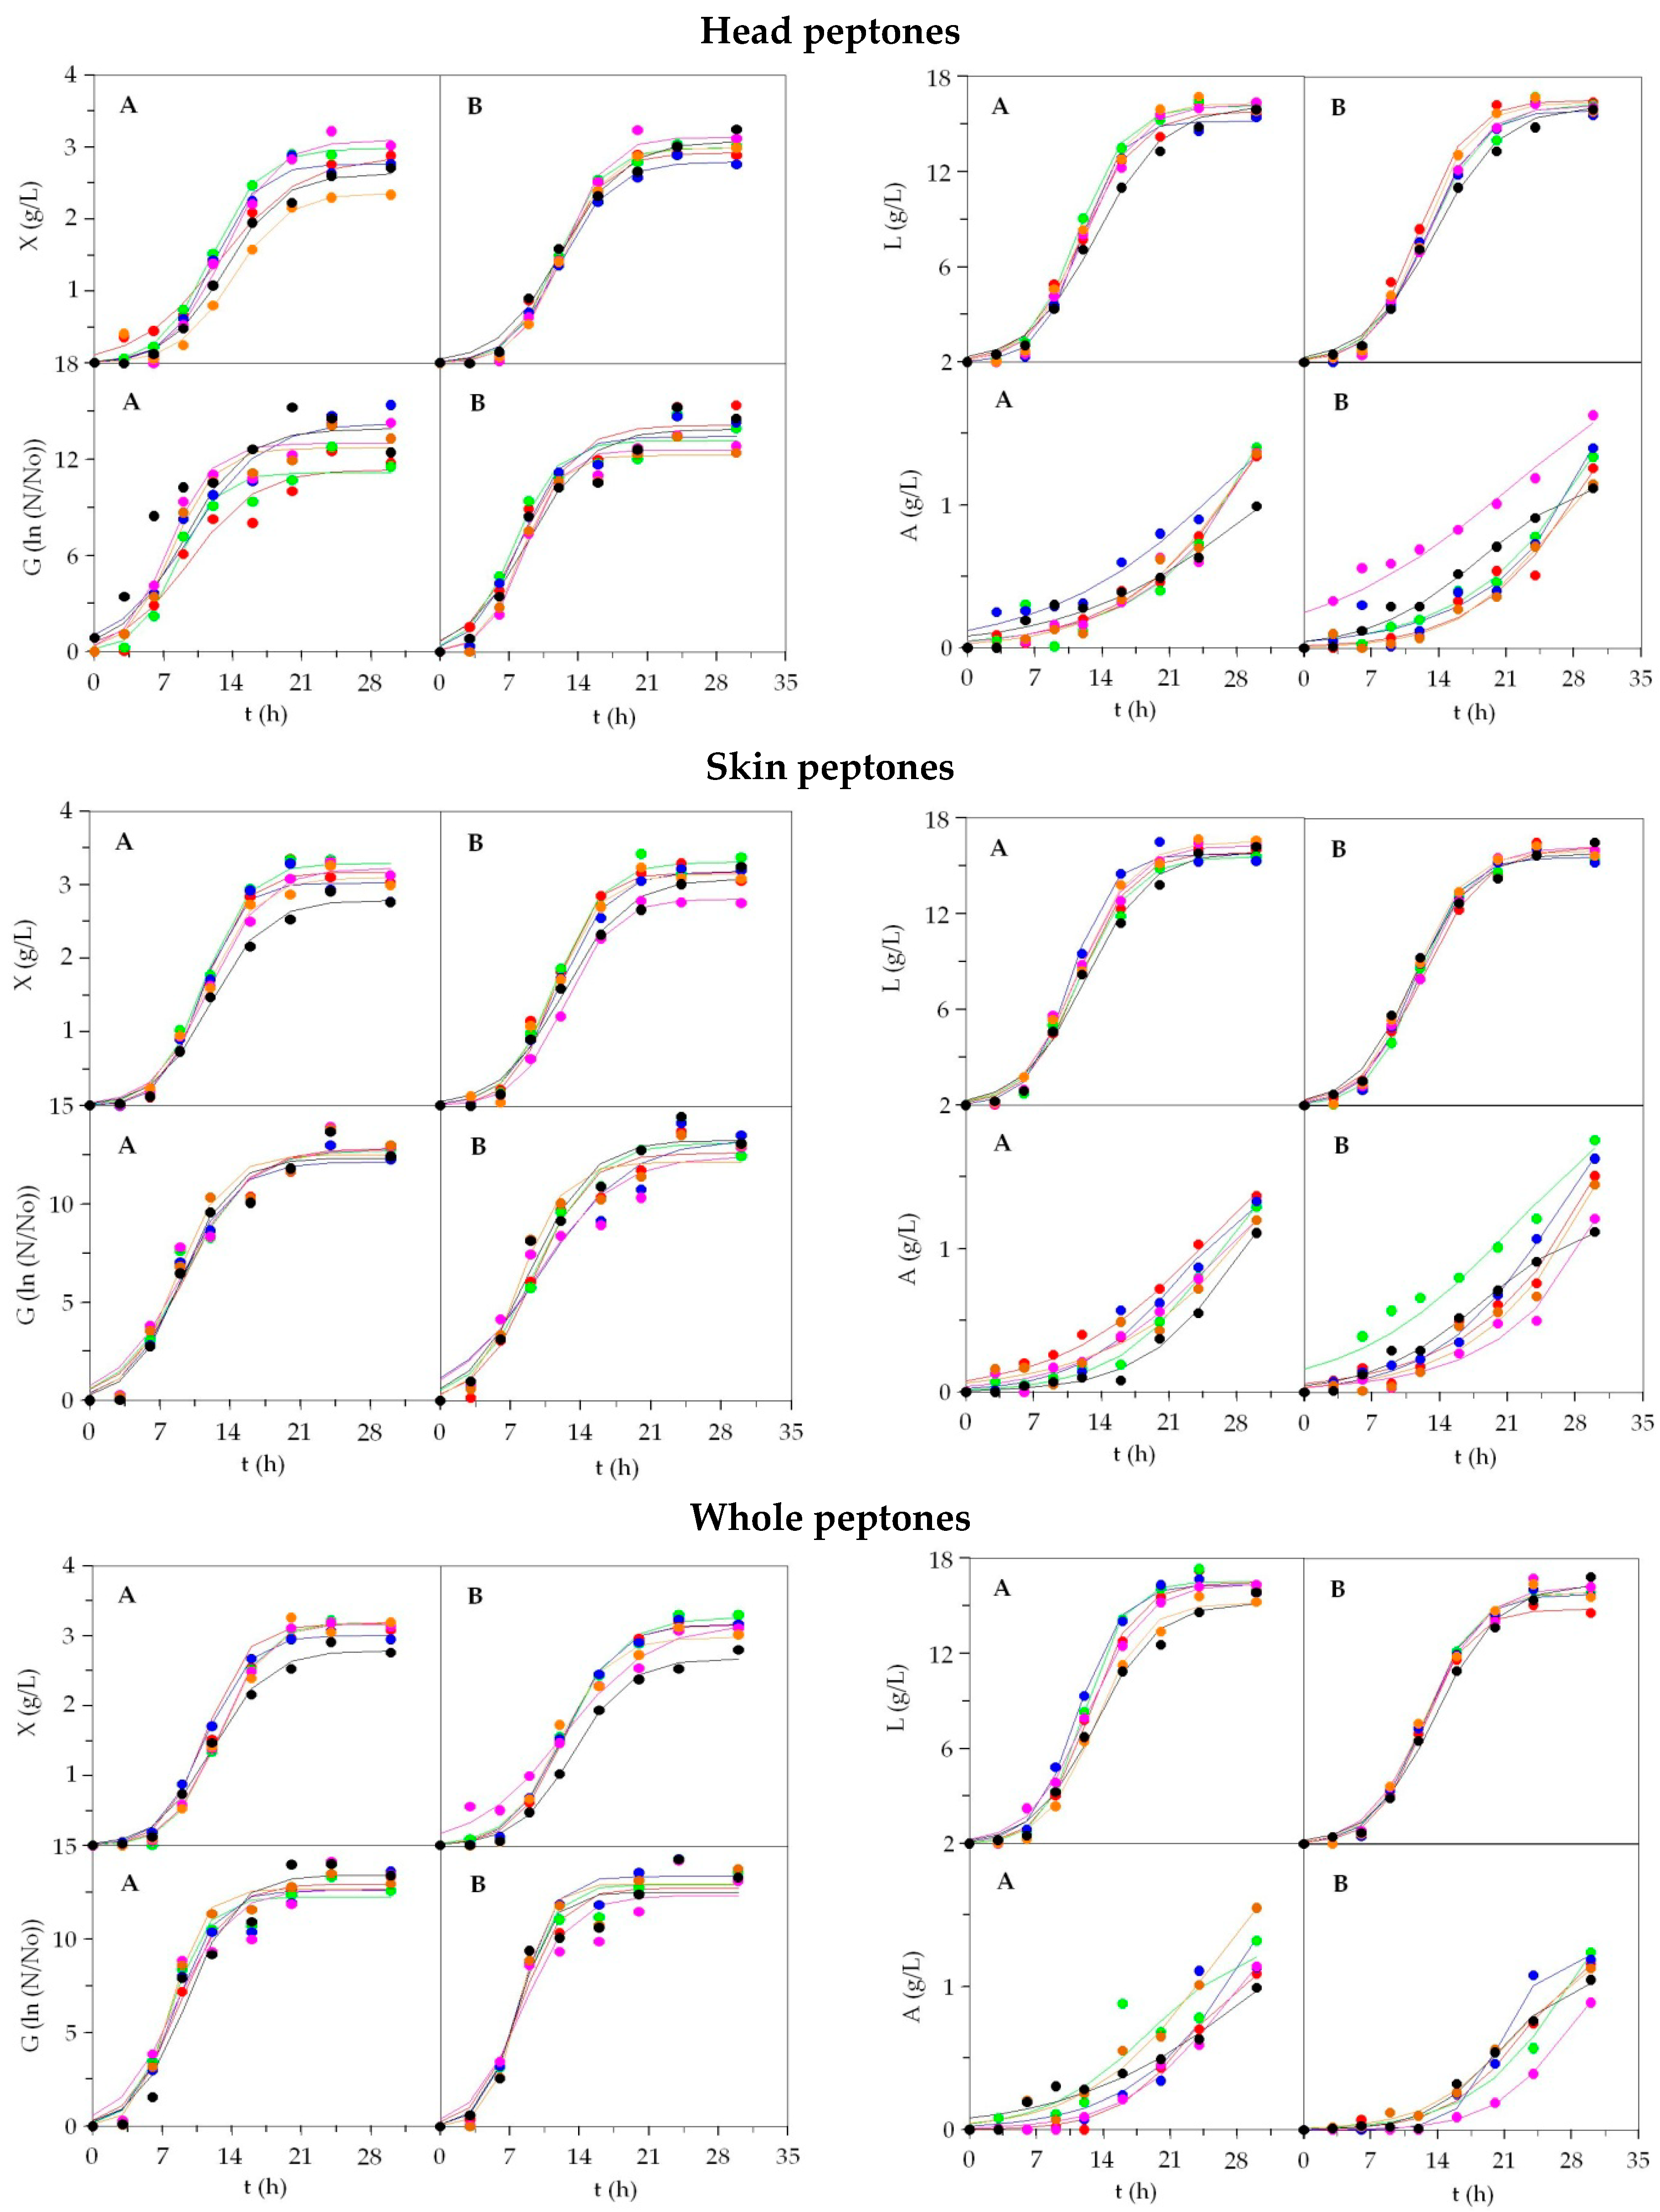
3.1. Growth of LAB on Marine Peptones from Fish Discards
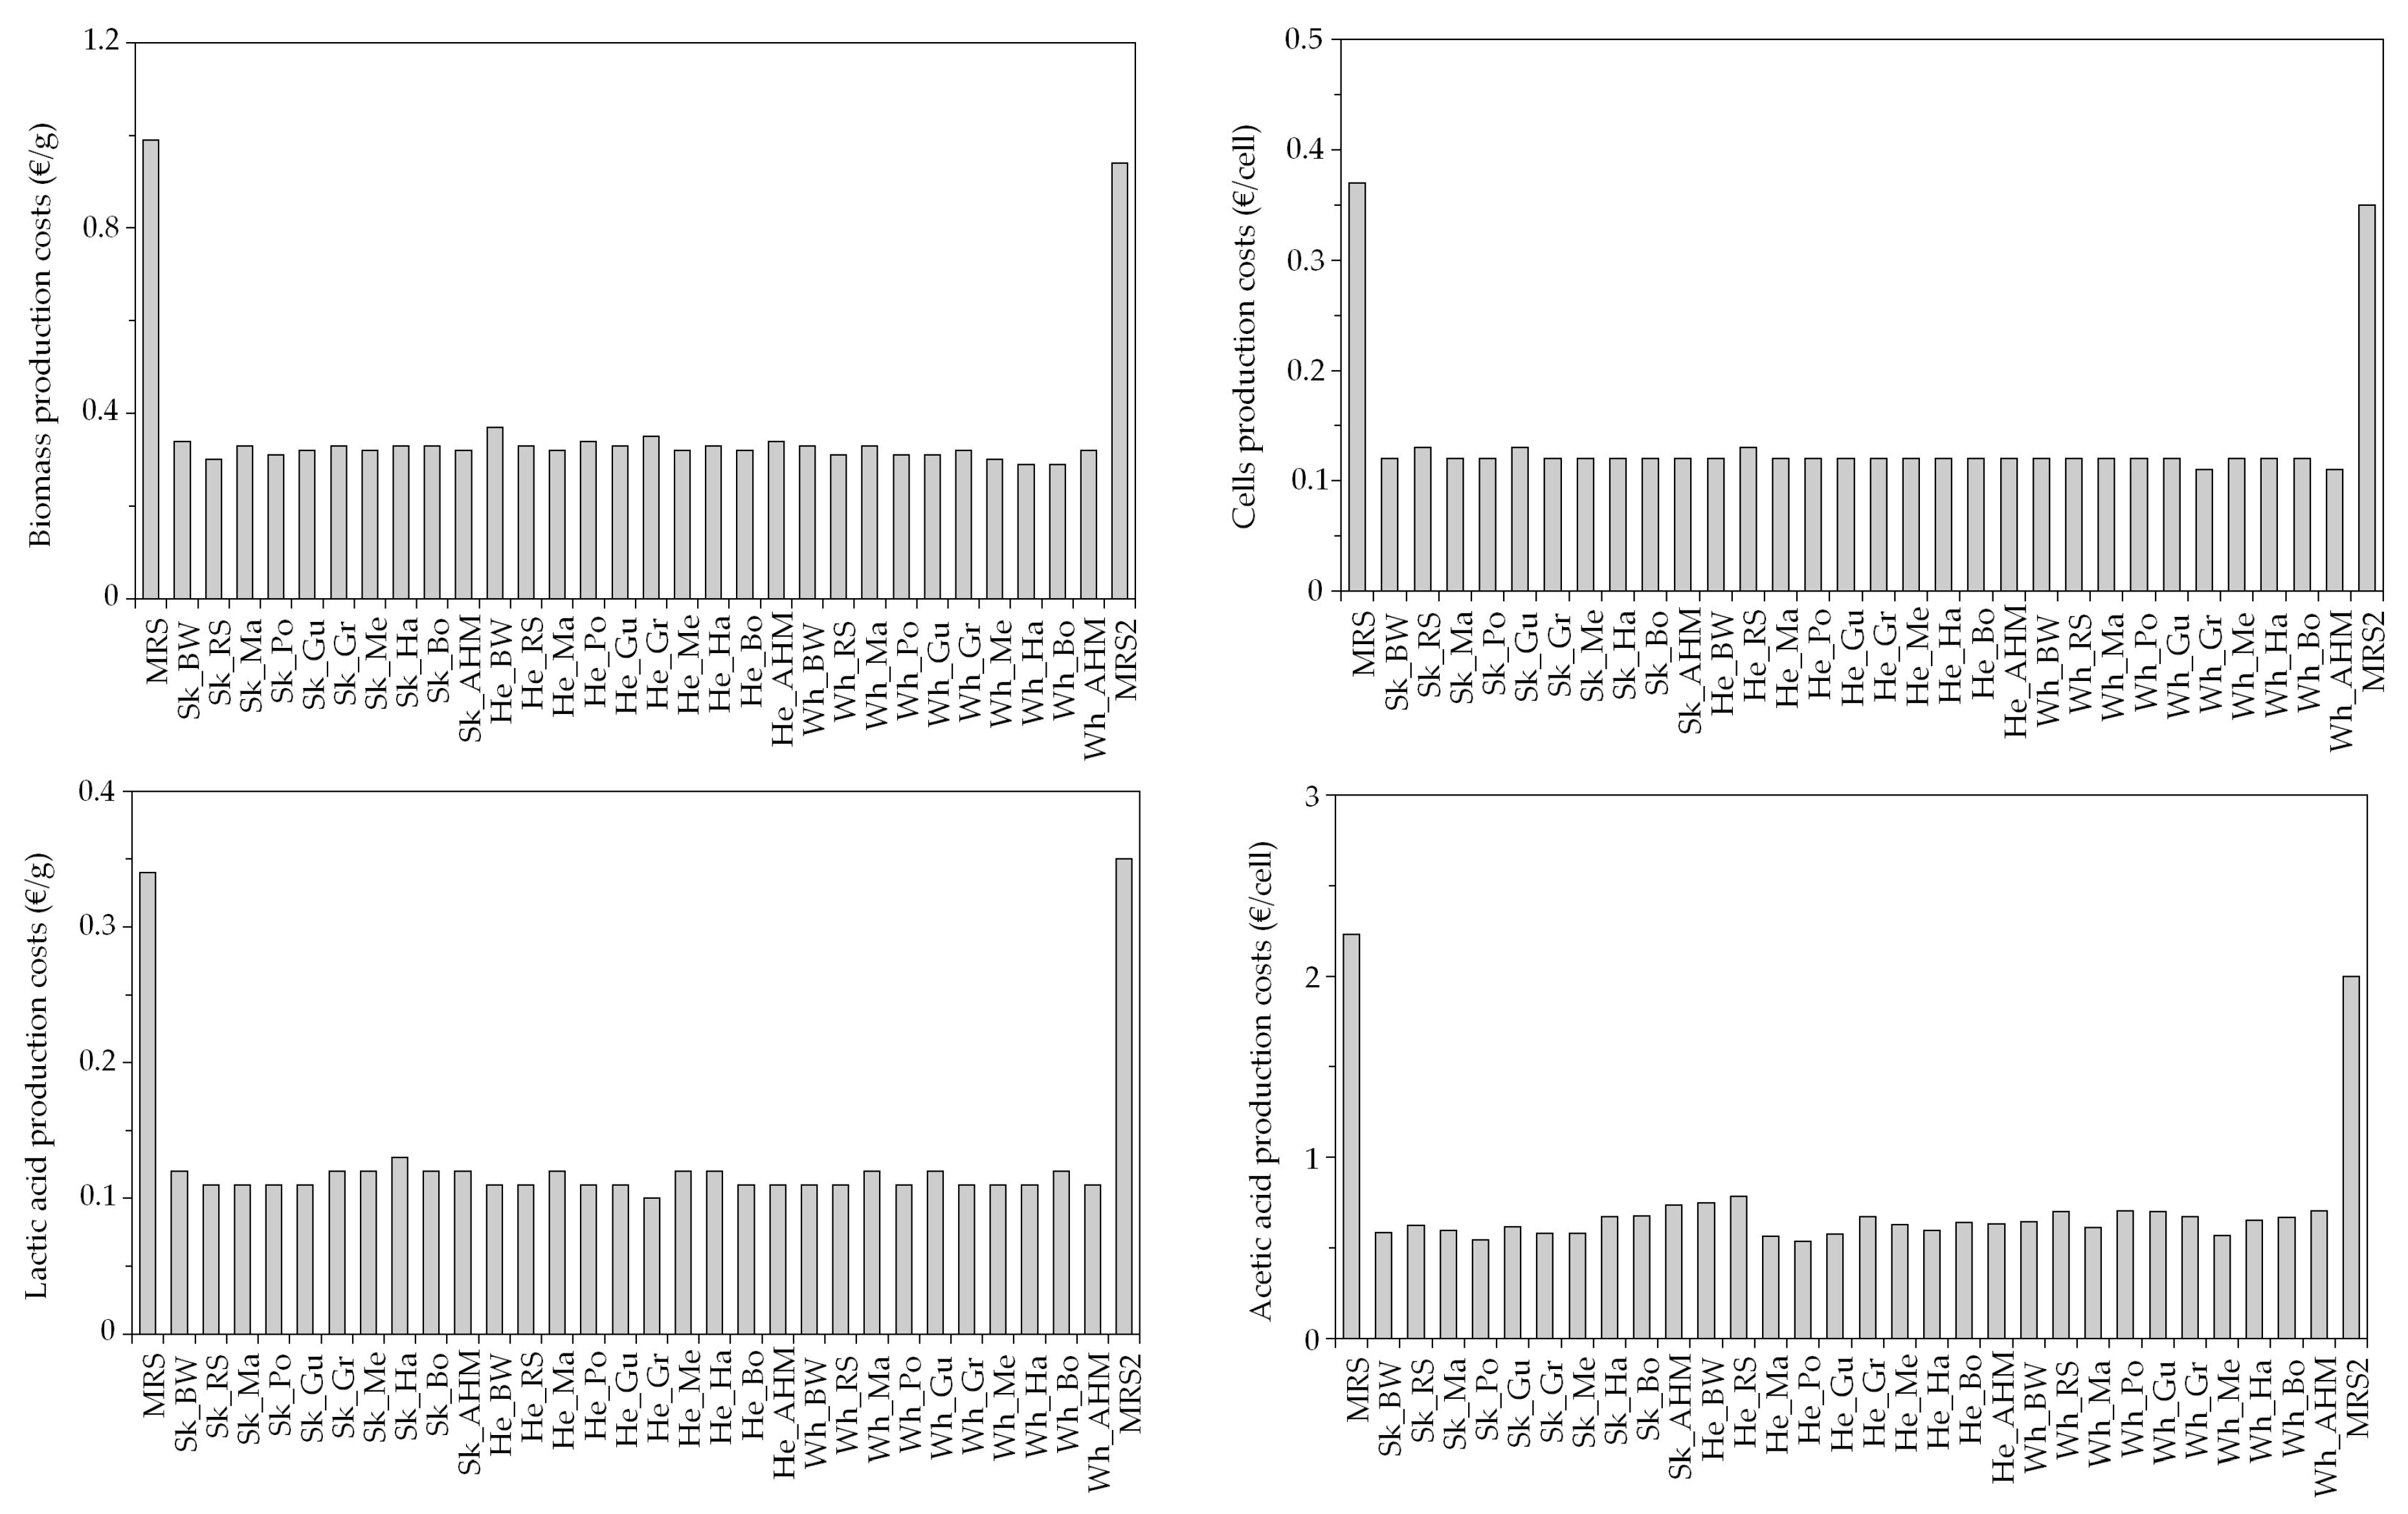
3.2. Economical Evaluation of Low-Cost Media for LAB Bioproductions
4. Conclusions
Supplementary Materials
Author Contributions
Funding
Acknowledgments
Conflicts of Interest
References
- European Commission. Discarding and the Landing Obligation. 2020. Available online: https://ec.europa.eu/fisheries/cfp/fishing_rules/discards_en (accessed on 13 April 2020).
- Iñarra, B.; Bald, C.; Cebrián, M.; Antelo, L.T.; Franco-Uría, A.; Vázquez, J.A.; Pérez-Martín, R.I.; Zufía, J. What to Do with Unwanted Catches: Valorisation Options and Selection Strategies. The European Landing Obligation, Reducing Discards in Complex, Multi-Species and Multi-Jurisdictional Fisheries (Chapter 17); Uhlmann, S.S., Ulrich, C., Kennelly, S.J., Eds.; Springer: Berlin/Heidelberg, Germany, 2019; pp. 333–359. ISBN 978-3-030-03307-1. [Google Scholar] [CrossRef]
- Mangi, S.C.; Catchpole, T.L. Using discards not destined for human consumption. Environ. Conserv. 2013, 41, 290–301. [Google Scholar] [CrossRef]
- Vázquez, J.A.; Fernández-Compás, A.; Blanco, M.; Rodríguez-Amado, I.; Moreno, H.; Borderías, J.; Pérez-Martín, R.I. Development of bioprocesses for the integral valorisation of fish discards. Biochem. Eng. J. 2019, 144, 198–208. [Google Scholar] [CrossRef]
- Vázquez, J.A.; Fraguas, J.; Novoa-Carvallal, R.; Reis, R.L.; Antelo, L.T.; Pérez-Martín, R.; Valcarcel, J. Isolation and chemical characterization of chondroitin sulfate from cartilage by-products of Blackmouth catshark (Galeus melastomus). Mar. Drugs 2018, 16, 344. [Google Scholar] [CrossRef] [PubMed] [Green Version]
- Vázquez, J.A.; Ramos, P.; Valcarcel, J.; Antelo, L.T.; Novoa-Carballal, R.; Reis, R.L.; Pérez-Martín, R.I. An integral and sustainable valorisation strategy of squid pen by-products. J. Clean. Prod. 2018, 201, 207–218. [Google Scholar] [CrossRef]
- García-Moreno, P.J.; Pérez-Gálvez, R.; Morales-Medina, R.; Guadix, A.; Guadix, E.M. Discarded species in the west Mediterranean sea as sources of omega-3 PUFA. Eur. J. Lipid Sci. Technol. 2013, 115, 982–989. [Google Scholar] [CrossRef]
- Saini, R.K.; Moon, S.H.; Keum, Y.-S. An updated review on use of tomato pomace and crustacean processing waste to recover commercially vital carotenoids. Food Res. Int. 2018, 108, 516–529. [Google Scholar] [CrossRef]
- López-Álvarez, M.; González, P.; Serra, J.; Fraguas, J.; Valcarcel, J.; Vázquez, J.A. Chondroitin sulfate and hydroxyapatite from Prionace glauca shark jaw: Physicochemical and structural characterization. Int. J. Biol. Macromol. 2020, 156, 329–339. [Google Scholar] [CrossRef]
- Blanco, M.; Vázquez, J.A.; Pérez-Martín, R.I.; Sotelo, C.G. Collagen extraction optimization from the skin of the small-spotted catshark (S. canicula) by response surface methodology. Mar. Drugs 2019, 17, 40. [Google Scholar] [CrossRef] [Green Version]
- Halim, N.R.A.; Yusof, H.M.; Sarbon, N.N. Functional and bioactive properties of fish protein hydolysates and peptides: A comprehensive review. Trends Food Sci. Technol. 2016, 51, 24–33. [Google Scholar] [CrossRef]
- Murthy, L.N.; Phadke, G.G.; Unnikrishnan, P.; Annamalai, J.; Joshy, C.G.; Zynudheen, A.A.; Ravishankar, C.N. Valorization of fish viscera for crude proteases production and its use in bioactive protein hydrolysate preparation. Waste Biomass Valorization 2018, 9, 1735–1746. [Google Scholar] [CrossRef]
- Sousa, S.C.; Vázquez, J.A.; Pérez-Martín, R.I.; Carvalho, A.P.; Gomes, A.M. Valorization of by-products from commercial fish species: Extraction and chemical properties of skin gelatins. Molecules 2017, 22, 1545. [Google Scholar] [CrossRef] [PubMed] [Green Version]
- Vázquez, J.A.; Fraguas, J.; Mirón, J.; Valcárcel, J.; Pérez-Martín, R.I.; Antelo, L.T. Valorisation of fish discards assisted by enzymatic hydrolysis and microbial bioconversion: Lab and pilot plant studies and preliminary sustainability evaluation. J. Clean. Prod. 2020, 246, 119027. [Google Scholar] [CrossRef]
- Swanepoel, J.C.; Goosen, N.J. Evaluation of fish protein hydrolysates in juvenile African catfish (Clarias gariepinus) diets. Aquaculture 2018, 496, 262–269. [Google Scholar] [CrossRef]
- Pleissner, D.; Venus, J. Utilization of protein-rich residues in biotechnological processes. Appl. Microb. Biotechnol. 2016, 100, 2133–2140. [Google Scholar] [CrossRef] [PubMed]
- Vázquez, J.A.; Durán, A.I.; Menduíña, A.; Nogueira, M.; Fraguas, J.; Mirón, J.; Valcárcel, J. Tailor-made process to recover high added value compounds from fishery by-products. In Green Extraction and Valorization of By-Products from Food Processing; CRC Press: Boca Raton, FL, USA, 2019; pp. 91–140. [Google Scholar]
- Deraz, S.F.; El-Fawal, G.F.; Abd-Ellatif, S.A.; Khalil, A.A. Autohydrolysed Tilapia nilotica fish viscera as a peptone source in bacteriocin production. Indian J. Microbiol. 2011, 51, 171–175. [Google Scholar] [CrossRef] [Green Version]
- Esakkiraj, P.; Immanuel, G.; Sowmya, S.M.; Iyapparaj, P.; Palavesam, A. Evaluation of protease-producing ability of fish gut isolate Bacillus cereus for aqua feed. Food Bioprocess Technol. 2008, 2, 383. [Google Scholar] [CrossRef]
- Horn, S.J.; Aspmo, S.I.; Eijsink, V.G.H. Evaluation of different cod viscera fractions and their seasonal variation used in a growth medium for lactic acid bacteria. Enzym. Microb. Technol. 2007, 40, 1328–1334. [Google Scholar] [CrossRef]
- Ramkumar, A.; Nallusamy, S.; Victor, R. Fish waste-potential low cost substrate for bacterial protease production: A brief review. Open Biotechnol. J. 2016, 10, 335–341. [Google Scholar] [CrossRef]
- Vos, P.; Garrity, G.; Jones, D.; Krieg, N.R.; Ludwig, W.; Rainey, F.A.; Schleifer, K.-H.; Whitman, W.B. Bergey’s Manual of Systematic Bacteriology: Volume 3: The Firmicutes; Springer Science & Business Media: Berlin/Heidelberg, Germany, 2011. [Google Scholar]
- Gildberg, A.; Dahl, R.; Mikkelsen, H.; Nilsen, K. Peptones from Atlantic cod stomach as nitrogen sources in growth media to marine bacteria. J. Aquat. Food Prod. Technol. 2010, 19, 75–83. [Google Scholar] [CrossRef]
- Nácher-Vázquez, M.; Ballesteros, N.; Canales, A.; Saint-Jean, S.R.; Pérez-Prieto, S.I.; Prieto, A.; Aznar, R.; López, P. Dextrans produced by lactic acid bacteria exhibit antiviral and immunomodulatory activity against salmonid viruses. Carbohyd. Polym. 2015, 124, 292–301. [Google Scholar] [CrossRef]
- Shi, S.; Li, J.; Guan, W.; Blersch, D. Nutrient value of fish manure waste on lactic acid fermentation by Lactobacillus pentosus. RSC Adv. 2018, 8, 31267–31274. [Google Scholar] [CrossRef] [Green Version]
- Vázquez, J.A.; González, M.P.; Murado, M.A. Preliminary tests on nisin and pediocin production using waste protein sources: Factorial and kinetic studies. Bioresour. Technol. 2006, 97, 605–613. [Google Scholar] [CrossRef] [PubMed] [Green Version]
- Pérez-Martín, R.I.; Antelo, L.T.; Vázquez, J.A.; Mirón, J. An on-land management and valorisation approach for biomass associated with landing obligation compliance. Mar. Policy 2020, 116, 103506. [Google Scholar] [CrossRef]
- Blanco, M.; Domínguez-Timón, F.; Pérez-Martín, R.I.; Fraguas, J.; Ramos-Ariza, P.; Vázquez, J.A.; Borderías, A.J.; Moreno, H.M. Valorization of recurrently discarded fish species in trawler fisheries in North-West Spain. J. Food Sci. Technol. 2018, 55, 4477–4484. [Google Scholar] [CrossRef]
- Bernfeld, P. Enzymes of starch degradation and synthesis. Adv. Enzymol. 1951, 12, 379–427. [Google Scholar]
- Lowry, O.H.; Rosebrough, N.J.; Farr, A.L.; Randall, R.J. Protein measurement with the Folin phenol reagent. J. Biol. Chem. 1951, 193, 265–275. [Google Scholar]
- Dubois, M.; Gilles, K.A.; Hamilton, J.K.; Rebers, P.A.; Smith, F. Colorimetric method for determination of sugars and related substances. Anal. Chem. 1956, 28, 350–356. [Google Scholar] [CrossRef]
- Vázquez, J.A.; Menduíña, A.; Durán, A.I.; Nogueira, M.; Fernández-Compás, A.; Pérez-Martín, R.I.; Rodríguez-Amado, I. Production of valuable compounds and bioactive metabolites from by-products of fish discards using chemical processing, enzymatic hydrolysis, and bacterial fermentation. Mar. Drugs 2019, 17, 139. [Google Scholar] [CrossRef] [Green Version]
- Vázquez, J.A.; Lorenzo, J.M.; Fuciños, P.; Franco, D. Evaluation of non-linear equations to model different animal growths with mono and bi-sigmoid profiles. J. Theor. Biol. 2012, 314, 95–105. [Google Scholar] [CrossRef]
- Laranjo, M.; Potes, M.E.; Elias, M. Role of starter cultures on the safety of fermented meat products. Front. Microbiol. 2019, 10, 853. [Google Scholar] [CrossRef] [Green Version]
- Martins, E.M.F.; Ramos, A.M.; Vanzela, E.S.L.; Stringheta, P.C.; de Oliveira Pinto, C.L.; Martins, J.M. Products of vegetable origin: A new alternative for the consumption of probiotic bacteria. Food Res. Int. 2013, 51, 764–770. [Google Scholar] [CrossRef]
- Linares, D.M.; Gómez, C.; Renes, E.; Fresno, J.M.; Tornadijo, M.E.; Ross, R.P.; Stanton, C. Lactic acid bacteria and Bifidobacteria with potential to design natural biofunctional health-promoting dairy foods. Front. Microbiol. 2017, 8, 846. [Google Scholar] [CrossRef] [PubMed]
- Rao, R.K.; Samak, G. Protection and restitution of gut barrier by probiotics: Nutritional and clinical implications. Curr. Nutr. Food Sci. 2013, 9, 99–107. [Google Scholar] [PubMed] [Green Version]
- Muñoz-Atienza, E.; Araújo, C.; Magadán, S.; Hernández, P.E.; Herranz, C.; Santos, Y.; Cintas, L.M. Invitro and invivo evaluation of lactic acid bacteria of aquatic origin as probiotics for turbot (Scophthalmus maximus L.) farming. Fish Shellfish Immunol. 2014, 41, 570–580. [Google Scholar] [CrossRef]
- Shin, Y.; Kim, T.; Kim, K. Probiotics used for respiratory diseases. J. Bacteriol. Virol. 2015, 45, 79–92. [Google Scholar] [CrossRef] [Green Version]
- Planas, M.; Vázquez, J.A.; Marques, J.; Pérez-Lomba, R.; González, M.P.; Murado, M.A. Enhancement of rotifer (Brachionus plicatilis) growth by using terrestrial acid lactic bacteria. Aquaculture 2004, 240, 313–329. [Google Scholar] [CrossRef] [Green Version]
- Vázquez, J.A.; Caprioni, R.; Nogueira, M.; Menduiña, A.; Ramos, P.; Pérez-Martín, R.I. Valorisation of effluents obtained from chemical and enzymatic chitin production of Illex argentinus pen by-products as nutrient supplements for various bacterial fermentation. Biochem. Eng. J. 2016, 116, 34–44. [Google Scholar] [CrossRef] [Green Version]
- Prieto, M.A.; Prieto, I.; Vázquez, J.A.; Ferreira, I.C.F.R. An environmental management industrial solution for the treatment and reuse of mussel wastewaters. Sci. Total Environ. 2015, 538, 117–128. [Google Scholar] [CrossRef] [PubMed] [Green Version]
- Vázquez, J.A.; Durán, A.; Nogueira, M.; Menduíña, A.; Antunes, J.; Freitas, A.C.; Gomes, A.M. Production of marine probiotic bacteria in a cost-effective marine media based on peptones obtained from discarded fish by-products. Microorganisms 2020, 8, 1121. [Google Scholar] [CrossRef]
- Thilakavathi, M.; Basak, T.; Panda, T. Modeling of enzyme production kinetics. Appl. Microb. Biotechnol. 2007, 73, 991–1007. [Google Scholar] [CrossRef]
- Amado, I.R.; Vázquez, J.A.; Pastrana, L.; Teixeira, J.A. Cheese whey: A cost-effective alternative for hyaluronic acid production by Streptococcus zooepidemicus. Food Chem. 2016, 198, 54–61. [Google Scholar] [CrossRef] [Green Version]
- Quintas, M.; Brandão, T.R.S.; Silva, C.L.M. Modelling autocatalytic behaviour of a food model system-Sucrose thermal degradation at high concentrations. J. Food Eng. 2007, 78, 537–545. [Google Scholar] [CrossRef]
- Vázquez, J.A.; Murado, M.A. Mathematical tools for objective comparison of microbial cultures. Application to evaluation of 15 peptones for lactic acid bacteria productions. Biochem. Eng. J. 2008, 39, 276–287. [Google Scholar] [CrossRef] [Green Version]
- Luedeking, R.; Piret, E.L. A kinetic study of the lactic acid fermentation batch process, and controlled pH. J. Biochem. Microbiol. Technol. Eng. 1959, 16, 52–55. [Google Scholar] [CrossRef]
- Vázquez, J.A.; Docasal, S.F.; Prieto, M.A.; González, M.P.; Murado, M.A. Growth and metabolic features of lactic acid bacteria in media with hydrolysed fish viscera. An approach to bio-silage of fishing by-products. Bioresour. Technol. 2008, 99, 6246–6257. [Google Scholar] [CrossRef] [PubMed] [Green Version]
- Aspmo, S.I.; Horn, S.J.; Eijsink, V.G.H. Use of hydrolysates from Atlantic cod (Gadus morhua L.) viscera as a complex nitrogen source for lactic acid bacteria. FEMS Microbiol. Lett. 2005, 248, 65–68. [Google Scholar] [CrossRef] [PubMed]
- Kowalczyk, M.; Mayo, B.; Fernández, M.; Aleksandrzak-Piekarczyk, T. Biotechnology of Lactic Acid Bacteria: Novel Applications, 2nd ed.; Updates on Metabolism in Lactic Acid Bacteria in Light of “Omic” Technologies; Wiley Online Library: Hoboken, NJ, USA, 2015; pp. 1–24. [Google Scholar]
- Juarez del Valle, M.; Laiño, J.E.; Savoy de Giori, G.; LeBlanc, J.G. Factors stimulating riboflavin produced by Lactobacillus plantarum CRL 725 grown in a semi-defined medium. J. Basic Microbiol. 2017, 57, 245–252. [Google Scholar] [CrossRef] [PubMed]
- Kobayashi, J. D-amino acids and lactic acid bacteria. Microorganisms 2019, 7, 690. [Google Scholar] [CrossRef] [Green Version]
- Daba, H.; Lacroix, C.; Huang, J.; Simard, R.E. Influence of growth conditions on production and activity of mesenterocin 5 by a strain of Leuconostoc mesenteroides. Appl. Microbiol. Biotechnol. 1993, 39, 166–173. [Google Scholar] [CrossRef]
- De Vuyst, L. Nutritional factors affecting nisin production by Lactococcus lactis subsp. lactis NIZO22186 in a synthetic medium. J. Appl. Bacteriol. 1995, 78, 28–33. [Google Scholar] [CrossRef]
- Biswas, S.R.; Ray, P.; Johnson, M.C.; Ray, B. Influence of growth conditions on theproduction of a bacteriocin, pediocin AcH, by Pediococcus acidilactici H. Appl. Environ. Microbiol. 1991, 4, 1265–1267. [Google Scholar] [CrossRef] [PubMed] [Green Version]
- Jensen, P.R.; Hammer, K. Minimal requirements for exponential growth of Lactococcus lactis. Appl. Environ. Microbiol. 1993, 59, 4363–4366. [Google Scholar] [CrossRef] [PubMed] [Green Version]
- Vázquez, J.A.; Cabo, M.L.; González, M.P.; Murado, M.A. The role of amino acids in nisin and pediocin production by two lactic acid bacteria. A factorial study. Enzym. Microb. Technol. 2004, 34, 319–325. [Google Scholar] [CrossRef] [Green Version]
- Harnedy, P.A.; Parthsarathy, V.; McLaughlin, C.M.; O’Keeffe, M.B.; Allsopp, P.J.; McSorley, E.M.; O’Harte, F.; FitzGerald, R.J. Blue whiting (Micromesistius poutassou) muscle protein hydrolysate with in vitro and in vivo antidiabetic properties. J. Funct. Foods 2018, 40, 137–145. [Google Scholar] [CrossRef] [Green Version]
- Da Rocha, M.; Alemán, A.; Baccan, G.C.; López-Caballero, M.E.; Gómez-Guillén, C.; Montero, P.; Prentice, C. Anti-Inflammatory, antioxidant, and antimicrobial effects of underutilized fish protein hydrolysate. J. Aquat. Food Prod. Technol. 2018, 27, 592–608. [Google Scholar] [CrossRef] [Green Version]
- Batista, I.; Ramos, C.; Coutinho, J.; Bandarra, N.M.; Nunes, M.L. Characterization of protein hydrolysates and lipids obtained from black scabbardfish (Aphanopus carbo) by-products and antioxidative activity of the hydrolysates produced. Proc. Biochem. 2010, 45, 18–24. [Google Scholar] [CrossRef]
- Arvanitoyannis, I.S.; Kassaveti, A. Fish industry waste: Treatments, environmental impacts, current and potential uses. Int. J. Food Sci. Technol. 2008, 43, 726–745. [Google Scholar] [CrossRef]
- Pleissner, D.; Qi, Q.; Gao, C.; Rivero, C.P.; Webb, C.; Lin, C.S.K.; Venus, J. Valorization of organic residues for the production of added value chemicals: A contribution to the bio-based economy. Biochem. Eng. J. 2016, 116, 3–16. [Google Scholar] [CrossRef]
- Pleissner, D.; Dietz, D.; Van Duuren, J.B.J.H.; Wittmann, C.; Yang, X.; Lin, C.S.K.; Venus, J. Biotechnological production of organic acids from renewable resources. Adv. Biochem. Eng. Biotechnol. 2019, 166, 373–410. [Google Scholar]
- Lübeck, M.; Lübeck, P.S. Application of lactic acid bacteria in green biorefineries. FEMS Microbiol. Lett. 2019, 366, I60–I67. [Google Scholar] [CrossRef]

| Marine Peptones | Pr (g/L) | RS (g/L) | TS (g/L) | Marine Peptones | Pr (g/L) | RS (g/L) | TS (g/L) |
|---|---|---|---|---|---|---|---|
| Sk_BW | 44.8 ± 3.1 | 0.13 ± 0.02 | 0.65 ± 0.06 | He_Gr | 29.4 ± 0.7 | 0.19 ± 0.05 | 0.83 ± 0.04 |
| Sk_RS | 39.7 ± 3.6 | 0.17 ± 0.04 | 0.74 ± 0.16 | He_Me | 34.5 ± 1.6 | 0.20 ± 0.02 | 0.62 ± 0.06 |
| Sk_Ma | 35.7 ± 2.4 | 0.42 ± 0.18 | 1.61 ± 0.50 | He_Ha | 29.5 ± 0.3 | 0.24 ± 0.09 | 0.79 ± 0.08 |
| Sk_Po | 42.7 ± 4.0 | 0.09 ± 0.01 | 0.45 ± 0.09 | He_Bo | 29.1 ± 4.8 | 0.16 ± 0.10 | 0.87 ± 0.12 |
| Sk_Gu | 39.7 ± 2.7 | 0.27 ± 0.03 | 0.92 ± 0.07 | He_AHM | 27.7 ± 0.9 | 0.36 ± 0.06 | 1.06 ± 0.07 |
| Sk_Gr | 42.2 ± 2.0 | 0.31 ± 0.04 | 0.73 ± 0.01 | Wh_BW | 47.8 ± 4.8 | 0.42 ± 0.09 | 1.20 ± 0.07 |
| Sk_Me | 40.4 ± 3.1 | 0.11 ± 0.09 | 0.50 ± 0.02 | Wh_RS | 36.8 ± 1.6 | 0.12 ± 0.00 | 0.60 ± 0.02 |
| Sk_Ha | 33.1 ± 0.5 | 0.13 ± 0.05 | 0.59 ± 0.02 | Wh_Ma | 36.4 ± 0.7 | 0.11 ± 0.00 | 0.74 ± 0.31 |
| Sk_Bo | 34.2 ± 0.5 | 0.45 ± 0.12 | 1.15 ± 0.05 | Wh_Po | 44.3 ± 2.3 | 0.14 ± 0.02 | 0.79 ± 0.05 |
| Sk_AHM | 38.4 ± 0.1 | 0.20 ± 0.03 | 0.70 ± 0.01 | Wh_Gu | 41.1 ± 5.4 | 0.24 ± 0.03 | 0.92 ± 0.00 |
| He_BW | 34.7 ± 3.4 | 0.31 ± 0.08 | 0.79 ± 0.01 | Wh_Gr | 47.1 ± 1.1 | 0.09 ± 0.01 | 0.50 ± 0.02 |
| He_RS | 39.2 ± 1.5 | 0.32 ± 0.09 | 1.25 ± 0.06 | Wh_Me | 53.9 ± 5.1 | 0.28 ± 0.12 | 1.06 ± 0.25 |
| He_Ma | 31.4 ± 2.8 | 0.25 ± 0.07 | 0.89 ± 0.04 | Wh_Ha | 36.5 ± 1.7 | 0.16 ± 0.02 | 0.72 ± 0.08 |
| He_Po | 39.6 ± 0.4 | 0.21 ± 0.07 | 0.68 ± 0.05 | Wh_Bo | 39.3 ± 1.9 | 0.41 ± 0.06 | 1.31 ± 0.37 |
| He_Gu | 33.5 ± 5.8 | 0.32 ± 0.06 | 1.45 ± 0.26 | Wh_AHM | 47.6 ± 3.2 | 0.33 ± 0.10 | 1.40 ± 0.23 |
| Sk_BW | Sk_RS | Sk_Ma | Sk_Po | Sk_Gu | Sk_Gr | Sk_Me | Sk_Ha | Sk_Bo | Sk_AHM | He_BW | He_RS | He_Ma | He_Po | He_Gu | MRS1 | |
|---|---|---|---|---|---|---|---|---|---|---|---|---|---|---|---|---|
| Biomass (X) | ||||||||||||||||
| Xm | 4.39 ± 0.23 A | 4.91 ± 0.31 B | 4.60 ± 0.18 B | 4.88 ± 0.21 B | 4.72 ± 0.31 B | 4.51 ± 0.16 A | 4.65 ± 0.23 B | 4.56 ± 0.31 B | 4.49 ± 0.18 B | 4.66 ± 0.21 B | 4.06 ± 0.31 A | 4.51 ± 0.16 B | 4.69 ± 0.17 B | 4.42 ± 0.10 A | 4.51 ± 0.23 B | 4.90 ± 0.23 B |
| vm | 0.54 ± 0.14 A | 0.58 ± 0.18 A | 0.52 ± 0.10 A | 0.56 ± 0.12 A | 0.59 ± 0.20 A | 0.50 ± 0.08 A | 0.66 ± 0.14 A | 0.68 ± 0.18 A | 0.71 ± 0.10 A | 0.67 ± 0.12 A | 0.77 ± 0.20 A | 0.49 ± 0.08 A | 0.83 ± 0.19 A | 0.70 ± 0.09 A | 0.75 ± 0.24 A | 0.73 ± 0.20 A |
| λX | 6.43 ± 1.18 A | 6.63 ± 1.38 A | 6.32 ± 0.87 A | 6.82 ± 0.96 A | 6.80 ± 1.42 A | 6.50 ± 0.80 A | 7.18 ± 1.18 A | 7.23 ± 1.38 A | 7.37 ± 0.87 A | 7.14 ± 0.96 A | 7.65 ± 1.42 A | 5.40 ± 0.80 A | 6.80 ± 0.72 A | 6.80 ± 0.47 A | 6.31 ± 1.08 A | 6.56 ± 1.00 A |
| μX | 0.49 ± 0.14 A | 0.47 ± 0.15 A | 0.45 ± 0.09 A | 0.46 ± 0.10 A | 0.50 ± 0.18 A | 0.44 ± 0.08 A | 0.57 ± 0.14 A | 0.60 ± 0.15 A | 0.63 ± 0.09 A | 0.58 ± 0.10 A | 0.75 ± 0.18 A | 0.43 ± 0.07 A | 0.70 ± 0.17 A | 0.63 ± 0.09 A | 0.66 ± 0.23 A | 0.59 ± 0.17 A |
| τX | 10.5 ± 0.7 A | 10.9 ± 0.8 A | 10.7 ± 0.5 A | 11.2 ± 0.6 B | 10.8 ± 0.8 A | 11.1 ± 0.5 B | 10.7 ± 0.7 A | 10.6 ± 0.8 A | 10.5 ± 0.5 A | 10.6 ± 0.6 A | 10.3 ± 0.8 A | 10.1 ± 0.5 A | 9.64 ± 0.39 A | 9.95 ± 0.26 A | 9.32 ± 0.56 A | 9.94 ± 0.55 A |
| tmX | 14.6 ± 1.5 A | 15.1 ± 1.8 A | 15.1 ± 1.1 A | 15.5 ± 1.3 A | 14.8 ± 1.8 A | 15.3 ± 1.4 A | 14.2 ± 1.5 A | 14.0 ± 1.8 A | 13.7 ± 1.1 A | 14.0 ± 1.3 A | 13.0 ± 1.8 A | 14.7 ± 1.4 A | 12.5 ± 0.9 A | 13.1 ± 0.6 A | 12.3 ± 1.3 A | 13.3 ± 1.2 A |
| R2 | 0.995 | 0.993 | 0.997 | 0.997 | 0.992 | 0.998 | 0.995 | 0.997 | 0.999 | 0.998 | 0.993 | 0.992 | 0.997 | 0.999 | 0.995 | 0.995 |
| Cells (G) | ||||||||||||||||
| Gm | 12.3 ± 1.1 A | 11.9 ± 1.1 A | 12.4 ± 0.9 A | 12.5 ± 1.2 A | 11.9 ± 1.0 A | 12.6 ± 1.1 A | 12.3 ± 1.1 A | 12.4 ± 1.1 A | 12.5 ± 0.9 A | 12.6 ± 1.2 A | 12.1 ± 1.0 A | 11.9 ± 1.1 A | 12.1 ± 1.1 A | 12.5 ± 1.4 A | 13.0 ± 1.5 A | 13.0 ± 1.2 A |
| vG | 1.60 ± 0.77 A | 1.47 ± 0.70 A | 1.59 ± 0.65 A | 1.44 ± 0.68 A | 1.74 ± 0.87 A | 1.56 ± 0.71 A | 2.62 ± 0.78 A | 1.55 ± 0.70 A | 1.38 ± 0.65 A | 1.40 ± 0.68 A | 1.19 ± 0.87 A | 1.66 ± 0.71 A | 1.80 ± 0.92 A | 1.44 ± 0.84 A | 1.61 ± 0.99 A | 1.59 ± 0.79 A |
| λG | 4.50 ± 2.07 A | 3.84 ± 2.17 A | 4.64 ± 1.77 A | 4.31 ± 2.29 A | 4.56 ± 1.96 A | 4.35 ± 2.06 A | 5.72 ± 2.07 A | 4.02 ± 2.17 A | 4.50 ± 1.77 A | 3.86 ± 2.29 A | 4.42 ± 1.96 A | 5.23 ± 2.06 A | 4.80 ± 1.97 A | 3.55 ± 2.80 A | 4.24 ± 2.78 A | 3.51 ± 2.28 A |
| μG | 0.52 ± 0.26 A | 0.49 ± 0.25 A | 0.51 ± 0.22 A | 0.46 ± 0.23 A | 0.59 ± 0.31 A | 0.49 ± 0.24 | 0.86 ± 0.26 A | 0.50 ± 0.25 A | 0.44 ± 0.22 A | 0.45 ± 0.23 A | 0.39 ± 0.31 A | 0.56 ± 0.24 A | 0.59 ± 0.32 A | 0.46 ± 0.28 A | 0.49 ± 0.32 A | 0.49 ± 0.25 A |
| τG | 8.35 ± 1.12 A | 7.90 ± 1.18 A | 8.54 ± 0.96 A | 8.66 ± 1.26 A | 8.00 ± 1.10 A | 8.40 ± 1.11 A | 8.06 ± 1.12 A | 8.02 ± 1.18 A | 9.04 ± 0.96 A | 8.36 ± 1.26 A | 9.52 ± 1.05 A | 8.81 ± 1.12 A | 8.18 ± 1.05 A | 7.89 ± 1.54 A | 8.29 ± 1.5 A | 7.62 ± 1.25 A |
| tmG | 12.2 ± 2.4 A | 12.0 ± 2.5 A | 12.4 ± 2.1 A | 13.0 ± 2.7 A | 11.4 ± 2.2 A | 12.4 ± 2.4 A | 10.4 ± 2.4 A | 12.0 ± 2.5 A | 13.6 ± 2.1 A | 12.8 ± 2.7 A | 14.6 ± 2.2 A | 12.4 ± 2.4 A | 11.6 ± 2.2 A | 12.2 ± 3.3 A | 12.3 ± 1.0 A | 11.7 ± 2.7 A |
| R2 | 0.982 | 0.981 | 0.988 | 0.982 | 0.982 | 0.984 | 0.976 | 0.974 | 0.973 | 0.972 | 0.971 | 0.976 | 0.958 | 0.965 | 0.969 | 0.978 |
| Lactic acid (L) | ||||||||||||||||
| Lm | 12.5 ± 1.1 A | 13.1 ± 0.7 A | 13.4 ± 0.4 A | 13.3 ± 0.8 A | 13.2 ± 0.6 A | 12.4 ± 0.6 A | 12.2 ± 1.1 A | 11.9 ± 0.6 A | 12.8 ± 0.4 A | 13.0 ± 0.8 A | 13.6 ± 0.6 A | 13.1 ± 0.5 A | 12.8 ± 0.6 A | 13.7 ± 1.1 A | 13.6 ± 0.9 A | 13.2 ± 0.8 A |
| vL | 1.60 ± 0.73 A | 1.52 ± 0.36 A | 1.50 ± 0.21 A | 1.43 ± 0.36 A | 1.31 ± 0.23 A | 1.47 ± 0.32 A | 1.82 ± 0.73 A | 1.80 ± 0.36 A | 1.71 ± 0.21 A | 1.45 ± 0.36 A | 1.33 ± 0.23 A | 1.31 ± 0.32 A | 1.70 ± 0.42 A | 1.55 ± 0.60 A | 1.61 ± 0.50 A | 1.49 ± 0.43 A |
| λL | 7.08 ± 1.91 A | 6.52 ± 1.09 A | 6.46 ± 0.66 A | 6.37 ± 1.26 A | 5.76 ± 0.94 A | 6.53 ± 0.98 A | 7.38 ± 1.91 A | 7.37 ± 1.09 A | 6.85 ± 0.66 A | 6.45 ± 1.26 A | 6.17 ± 0.94 A | 6.29 ± 0.98 A | 6.32 ± 1.02 A | 6.05 ± 1.84 A | 5.52 ± 1.45 A | 5.61 ± 1.24 A |
| μL | 0.51 ± 0.25 A | 0.47 ± 0.12 A | 0.45 ± 0.07 A | 0.43 ± 0.12 A | 0.39 ± 0.08 A | 0.47 ± 0.11 A | 0.60 ± 0.25 A | 0.60 ± 0.12 A | 0.54 ± 0.07 A | 0.45 ± 0.12 A | 0.39 ± 0.08 A | 0.40 ± 0.11 A | 0.53 ± 0.14 A | 0.45 ± 0.19 A | 0.47 ± 0.16 A | 0.45 ± 0.13 A |
| τL | 11.0 ± 1.1 A | 10.8 ± 0.6 A | 11.0 ± 0.4 A | 11.0 ± 0.7 A | 10.8 ± 0.6 A | 10.8 ± 0.6 A | 10.7 ± 1.1 A | 10.7 ± 0.6 A | 10.6 ± 0.4 A | 10.9 ± 0.7 A | 11.3 ± 0.6 A | 11.3 ± 0.6 A | 10.1 ± 0.6 A | 10.5 ± 1.1 A | 9.76 ± 0.80 A | 10.1 ± 0.7 A |
| tmL | 14.9 ± 2.4 A | 15.1 ± 1.4 A | 15.4 ± 0.9 A | 15.7 ± 1.7 A | 15.9 ± 1.3 A | 15.0 ± 1.3 A | 14.1 ± 2.4 A | 14.0 ± 1.4 A | 14.3 ± 0.9 A | 15.4 ± 1.7 A | 16.4 ± 1.3 A | 16.3 ± 1.2 A | 13.8 ± 1.2 A | 14.9 ± 2.4 A | 14.0 ± 1.8 A | 14.5 ± 1.6 A |
| R2 | 0.987 | 0.996 | 0.999 | 0.995 | 0.997 | 0.996 | 0.997 | 0.998 | 0.998 | 0.997 | 0.995 | 0.990 | 0.996 | 0.989 | 0.993 | 0.992 |
| Acetic acid (A) | ||||||||||||||||
| Am | 2.56 ± 0.33 A | 2.40 ± 0.41 A | 2.52 ± 0.18 A | 2.75 ± 0.33 B | 2.43 ± 0.22 A | 2.58 ± 0.16 B | 2.59 ± 0.28 A | 2.23 ± 0.16 A | 2.21 ± 0.10 A | 2.03 ± 0.23 A | 2.00 ± 0.15 A | 1.91 ± 0.43 A | 2.66 ± 0.20 B | 2.80 ± 0.66 A | 2.60 ± 0.21 B | 2.07 ± 0.29 A |
| vA | 0.33 ± 0.23 A | 0.28 ± 0.23 A | 0.20 ± 0.05 A | 0.18 ± 0.07 A | 0.20 ± 0.07 A | 0.19 ± 0.04 A | 0.16 ± 0.05 A | 0.16 ± 0.03 A | 0.15 ± 0.02 A | 0.15 ± 0.04 A | 0.18 ± 0.06 A | 0.14 ± 0.07 A | 0.13 ± 0.03 A | 0.15 ± 0.05 A | 0.17 ± 0.03 A | 0.15 ± 0.06 A |
| λA | 5.77 ± 2.92 A | 5.19 ± 4.00 A | 3.42 ± 1.71 A | 3.00 ± 2.82 A | 3.40 ± 2.20 A | 2.89 ± 1.49 A | 2.06(NS) | 7.38 ± 1.28 A | 6.21 ± 0.89 A | 7.50 ± 2.06 A | 8.28 ± 1.85 A | 8.46 ± 1.57 A | 4.39 ± 1.66 A | 7.72 ± 3.12 A | 7.31 ± 1.34 A | 6.87 ± 2.71 A |
| μA | 0.52 ± 0.37 A | 0.46 ± 0.41 A | 0.32 ± 0.09 A | 0.27 ± 0.11 A | 0.34 ± 0.13 A | 0.30 ± 0.07 A | 0.25 ± 0.09 A | 0.28 ± 0.06 A | 0.28 ± 0.04 A | 0.30 ± 0.10 A | 0.36 ± 0.13 A | 0.28 ± 0.18 A | 0.30 ± 0.08 A | 0.21 ± 0.10 A | 0.25 ± 0.05 A | 0.30 ± 0.14 A |
| τA | 9.65 ± 1.59 A | 9.53 ± 2.21 B | 9.61 ± 1.04 A | 10.5 ± 1.9 B | 9.37 ± 1.31 A | 9.59 ± 0.92 A | 10.1 ± 1.8 B | 14.6 ± 1.0 B | 13.5 ± 0.7 B | 14.2 ± 1.6 B | 13.8 ± 1.3 B | 15.5 ± 3.1 B | 11.2 ± 1.1 B | 17.2 ± 3.5 B | 15.2 ± 1.2 B | 13.6 ± 2.0 B |
| tmA | 13.5 ± 3.5 A | 13.9 ± 4.9 A | 15.8 ± 2.4 A | 18.0 ± 4.4 A | 15.3 ± 3.0 A | 16.3 ± 2.1 A | 18.2 ± 4.1 A | 21.8 ± 2.2 A | 20.7 ± 1.5 A | 20.9 ± 3.4 A | 19.3 ± 2.7 A | 22.6 ± 6.6 A | 17.9 ± 2.5 A | 26.7 ± 7.2 A | 23.1 ± 2.5 A | 20.3 ± 4.4 A |
| R2 | 0.968 | 0.944 | 0.992 | 0.982 | 0.987 | 0.994 | 0.984 | 0.996 | 0.998 | 0.989 | 0.990 | 0.963 | 0.992 | 0.980 | 0.996 | 0.982 |
| He_Gr | He_Bo | He_Ha | He_AHM | He_Me | Wh_BW | Wh_RS | Wh_Ma | Wh_Po | Wh_Gu | Wh_Gr | Wh_Bo | Wh_Ha | Wh_Me | Wh_AHM | MRS2 | |
| Biomass (X) | ||||||||||||||||
| Xm | 4.26 ± 0.13 A | 4.65 ± 0.20 B | 4.55 ± 0.07 A | 4.40 ± 0.27 B | 4.61 ± 0.18 B | 4.59 ± 0.25 B | 4.89 ± 0.37 B | 4.50 ± 0.28 B | 4.80 ± 0.21 B | 4.88 ± 0.28 B | 4.75 ± 0.19 B | 5.08 ± 0.26 B | 5.08 ± 0.24 B | 4.92 ± 0.18 B | 4.62 ± 0.26 B | 4.89 ± 0.25 B |
| vm | 0.79 ± 0.17 A | 0.75 ± 0.19 A | 0.86 ± 0.10 B | 0.83 ± 0.34 A | 0.81 ± 0.21 A | 0.83 ± 0.28 A | 0.68 ± 0.28 A | 0.97 ± 0.48 A | 0.72 ± 0.18 A | 0.71 ± 0.23 A | 0.66 ± 0.15 A | 0.62 ± 0.17 A | 0.66 ± 0.16 A | 0.67 ± 0.13 A | 0.64 ± 0.20 A | 0.53 ± 0.12 A |
| λX | 6.23 ± 0.64 A | 7.09 ± 0.87 A | 6.19 ± 0.35 A | 7.21 ± 1.16 A | 6.17 ± 0.83 A | 7.43 ± 1.04 A | 6.94 ± 1.60 A | 7.18 ± 1.18 A | 7.13 ± 0.91 A | 6.43 ± 1.22 A | 6.30 ± 0.88 A | 4.91 ± 1.22 A | 6.07 ± 1.04 A | 6.17 ± 0.79 A | 6.13 ± 1.23 A | 6.84 ± 1.09 A |
| μX | 0.74 ± 0.16 A | 0.64 ± 0.17 B | 0.75 ± 0.09 A | 0.76 ± 0.32 B | 0.70 ± 0.19 A | 0.72 ± 0.25 B | 0.56 ± 0.24 B | 0.86 ± 0.44 B | 0.60 ± 0.16 B | 0.58 ± 0.20 B | 0.56 ± 0.13 B | 0.49 ± 0.14 B | 0.52 ± 0.13 B | 0.54 ± 0.11 B | 0.56 ± 0.18 B | 0.43 ± 0.10 B |
| τX | 8.95 ± 0.31 A | 10.2 ± 0.5 A | 8.85 ± 0.17 A | 9.84 ± 0.65 A | 9.03 ± 0.41 A | 10.2 ± 0.6 B | 10.5 ± 0.9 B | 9.50 ± 0.61 A | 10.5 ± 0.5 B | 9.89 ± 0.66 A | 9.91 ± 0.48 A | 9.00 ± 0.66 A | 9.94 ± 0.57 A | 9.86 ± 0.43 A | 9.73 ± 0.66 A | 11.5 ± 0.7 B |
| tmX | 11.7 ± 0.7 A | 13.3 ± 1.0 A | 11.5 ± 0.4 A | 12.5 ± 1.4 A | 11.9 ± 0.9 A | 13.0 ± 1.2 A | 14.1 ± 1.9 B | 11.8 ± 1.5 A | 13.8 ± 1.1 B | 13.3 ± 1.4 B | 13.5 ± 1.1 A | 13.1 ± 1.4 A | 13.8 ± 1.3 B | 13.6 ± 0.9 A | 13.3 ± 1.5 B | 16.2 ± 1.5 B |
| R2 | 0.998 | 0.996 | 0.999 | 0.992 | 0.997 | 0.994 | 0.989 | 0.991 | 0.996 | 0.994 | 0.997 | 0.994 | 0.996 | 0.997 | 0.994 | 0.996 |
| Cells (G) | ||||||||||||||||
| Gm | 13.0 ± 1.1 A | 13.0 ± 1.1 A | 12.7 ± 1.0 A | 12.3 ± 1.3 A | 12.6 ± 0.9 A | 12.9 ± 1.7 A | 12.8 ± 1.2 A | 13.0 ± 1.3 A | 12.9 ± 1.0 A | 13.0 ± 1.1 A | 13.3 ± 0.9 A | 12.9 ± 1.3 A | 13.0 ± 1.0 A | 12.9 ± 1.2 A | 13.1 ± 0.7 A | 12.2 ± 1.2 A |
| vG | 1.49 ± 0.62 A | 1.32 ± 0.53 A | 1.78 ± 0.80 A | 1.47 ± 0.81 A | 1.83 ± 0.77 A | 1.50 ± 0.98 A | 1.41 ± 0.63 A | 1.32 ± 0.60 A | 1.42 ± 0.54 A | 1.33 ± 0.54 A | 1.39 ± 0.44 A | 1.49 ± 0.79 A | 1.74 ± 0.72 A | 1.73 ± 0.89 A | 1.63 ± 0.48 A | 1.76 ± 0.97 A |
| λG | 4.08 ± 2.02 A | 3.93 ± 2.16 A | 4.40 ± 1.81 A | 4.00 ± 2.59 A | 4.21 ± 1.65 A | 4.22 ± 3.10 A | 3.72 ± 2.25 A | 3.45 ± 2.48 A | 3.74 ± 1.91 A | 3.30 ± 2.17 A | 3.08 ± 1.70 A | 3.80 ± 2.54 A | 3.58 ± 1.76 A | 4.02 ± 2.17 A | 3.71 ± 1.35 A | 4.89 ± 2.17 A |
| μG | 0.46 ± 0.20 A | 0.41 ± 0.18 A | 0.56 ± 0.26 A | 0.48 ± 0.28 A | 0.58 ± 0.26 A | 0.47 ± 0.32 A | 0.44 ± 0.21 A | 0.40 ± 0.20 A | 0.44 ± 0.18 A | 0.41 ± 0.18 A | 0.42 ± 0.14 A | 0.46 ± 0.26 A | 0.53 ± 0.21 A | 0.54 ± 0.23 A | 0.50 ± 0.16 A | 0.58 ± 0.33 A |
| τG | 8.44 ± 1.11 A | 8.84 ± 1.22 A | 7.96 ± 0.97 A | 8.19 ± 1.41 A | 7.66 ± 0.90 A | 8.50 ± 1.70 A | 8.27 ± 1.24 A | 8.41 ± 1.39 A | 8.28 ± 1.06 A | 8.18 ± 1.21 A | 7.87 ± 0.94 A | 8.12 ± 1.39 A | 7.32 ± 1.24 A | 7.75 ± 0.96 A | 7.74 ± 0.74 A | 8.35 ± 1.20 A |
| tmG | 12.8 ± 0.6 A | 13.8 ± 2.7 A | 11.5 ± 2.0 A | 12.4 ± 3.0 A | 11.1 ± 0.8 A | 12.8 ± 3.7 A | 12.8 ± 2.7 A | 13.4 ± 3.1 A | 12.8 ± 2.3 A | 13.1 ± 2.7 A | 12.6 ± 2.1 A | 12.4 ± 3.0 A | 11.1 ± 2.0 A | 11.5 ± 2.5 A | 11.8 ± 1.6 A | 11.8 ± 2.4 A |
| R2 | 0.984 | 0.984 | 0.985 | 0.974 | 0.986 | 0.964 | 0.982 | 0.980 | 0.986 | 0.983 | 0.989 | 0.975 | 0.986 | 0.979 | 0.992 | 0.979 |
| Lactic acid (L) | ||||||||||||||||
| Lm | 14.5 ± 1.0 A | 13.3 ± 0.6 A | 12.7 ± 1.0 A | 13.3 ± 1.1 A | 12.6 ± 0.9 A | 13.3 ± 0.9 A | 13.7 ± 1.0 A | 13.0 ± 0.9 A | 13.4 ± 1.0 A | 13.0 ± 0.5 A | 13.6 ± 0.7 A | 12.9 ± 1.3 A | 13.8 ± 0.7 A | 13.9 ± 1.0 A | 13.1 ± 0.7 A | 13.7 ± 0.9 A |
| vL | 1.81 ± 0.67 A | 1.64 ± 0.42 A | 1.79 ± 0.81 A | 1.63 ± 0.60 A | 1.83 ± 0.77 A | 1.47 ± 0.51 A | 1.72 ± 0.67 A | 1.50 ± 0.77 A | 1.49 ± 0.81 A | 1.84 ± 0.42 A | 1.74 ± 0.47 A | 1.49 ± 0.79 A | 1.78 ± 0.45 A | 1.63 ± 0.58 A | 1.63 ± 0.48 A | 1.39 ± 0.34 A |
| λL | 5.36 ± 1.64 A | 6.21 ± 1.02 A | 4.42 ± 1.81 A | 6.20 ± 1.84 A | 4.21 ± 1.65 A | 5.36 ± 1.45 A | 5.75 ± 1.64 A | 5.14 ± 1.65 A | 5.72 ± 1.81 A | 6.53 ± 0.89 A | 6.41 ± 1.14 A | 3.80 ± 2.54 A | 5.97 ± 1.07 A | 5.35 ± 1.66 A | 3.71 ± 1.35 B | 6.78 ± 1.25 A |
| μL | 0.50 ± 0.19 A | 0.49 ± 0.14 A | 0.57 ± 0.27 A | 0.49 ± 0.19 A | 0.58 ± 0.26 A | 0.44 ± 0.16 A | 0.50 ± 0.19 A | 0.46 ± 0.26 A | 0.45 ± 0.27 A | 0.57 ± 0.14 A | 0.51 ± 0.15 A | 0.46 ± 0.26 A | 0.51 ± 0.14 A | 0.47 ± 0.18 A | 0.50 ± 0.16 A | 0.41 ± 0.11 A |
| τL | 9.39 ± 0.90 A | 10.3 ± 0.6 B | 7.96 ± 0.98 A | 10.3 ± 1.1 B | 7.66 ± 0.90 A | 9.90 ± 0.80 A | 9.73 ± 0.90 A | 9.49 ± 0.90 A | 10.2 ± 1.0 B | 10.1 ± 0.5 A | 10.3 ± 0.6 B | 8.12 ± 1.39 A | 9.86 ± 0.59 A | 9.62 ± 0.92 A | 7.74 ± 0.74 A | 11.7 ± 0.8 B |
| tmL | 13.4 ± 2.0 A | 14.3 ± 1.2 A | 11.4 ± 2.0 B | 14.3 ± 2.4 A | 11.1 ± 1.9 B | 14.4 ± 1.8 A | 13.7 ± 2.0 A | 13.8 ± 1.9 A | 14.7 ± 2.0 A | 13.6 ± 1.1 B | 14.2 ± 1.4 A | 12.4 ± 3.0 A | 13.7 ± 1.3 A | 13.9 ± 2.0 A | 11.8 ± 1.6 B | 16.6 ± 1.7 A |
| R2 | 0.990 | 0.994 | 0.985 | 0.994 | 0.986 | 0.991 | 0.994 | 0.991 | 0.997 | 0.997 | 0.995 | 0.975 | 0.996 | 0.991 | 0.992 | 0.995 |
| Acetic acid (A) | ||||||||||||||||
| Am | 2.23 ± 0.24 A | 2.34 ± 0.21 A | 2.51 ± 0.49 A | 2.37 ± 0.45 A | 2.39 ± 0.47 A | 2.33 ± 0.28 A | 2.14 ± 0.26 A | 2.45 ± 0.46 A | 2.12 ± 0.18 A | 2.14 ± 0.26 A | 2.23 ± 0.12 A | 2.24 ± 0.27 A | 2.30 ± 0.12 A | 2.64 ± 0.37 A | 2.12 ± 0.18 A | 2.33 ± 0.21 A |
| vA | 0.20 ± 0.07 A | 0.18 ± 0.05 A | 0.17 ± 0.08 A | 0.15 ± 0.06 A | 0.15 ± 0.07 A | 0.16 ± 0.05 A | 0.18 ± 0.07 A | 0.16 ± 0.07 A | 0.21 ± 0.07 A | 0.18 ± 0.07 A | 0.19 ± 0.03 A | 0.17 ± 0.06 A | 0.27 ± 0.07 A | 0.16 ± 0.04 A | 0.21 ± 0.07 A | 0.21 ± 0.08 A |
| λA | 7.65 ± 2.17 A | 5.81 ± 1.85 A | 5.15 ± 3.91 A | 7.22 ± 3.20 A | 5.34 ± 3.78 A | 7.21 ± 2.14 A | 7.50 ± 2.42 A | 5.25 ± 3.70 A | 6.19 ± 1.88 A | 7.50 ± 2.42 A | 8.95 ± 1.01 B | 5.61 ± 2.55 A | 5.83 ± 1.20 A | 7.42 ± 2.18 A | 6.19 ± 1.88 A | 3.70 ± 2.18 A |
| μA | 0.36 ± 0.15 A | 0.32 ± 0.10 A | 0.26 ± 0.16 A | 0.25 ± 0.12 A | 0.25 ± 0.15 A | 0.28 ± 0.09 A | 0.34 ± 0.15 A | 0.26 ± 0.15 A | 0.40 ± 0.15 A | 0.34 ± 0.15 A | 0.34 ± 0.06 A | 0.31 ± 0.13 A | 0.48 ± 0.13 A | 0.24 ± 0.08 A | 0.40 ± 0.15 A | 0.37 ± 0.15 A |
| τA | 13.3 ± 1.5 A | 12.1 ± 1.3 A | 12.8 ± 3.0 B | 15.2 ± 2.8 A | 13.2 ± 3.0 B | 14.5 ± 1.7 A | 13.3 ± 1.7 A | 13.0 ± 2.9 B | 11.3 ± 1.1 B | 13.3 ± 1.7 A | 14.8 ± 0.7 A | 12.2 ± 1.8 B | 10.0 ± 0.7 B | 15.9 ± 2.0 A | 11.3 ± 1.1 A | 9.19 ± 1.26 B |
| tmA | 18.9 ± 3.2 A | 18.5 ± 2.8 A | 20.3 ± 6.6 A | 23.2 ± 6.0 A | 21.1 ± 6.6 A | 21.8 ± 3.7 B | 19.2 ± 3.7 A | 20.7 ± 6.4 A | 16.3 ± 2.6 A | 19.2 ± 3.7 A | 20.7 ± 1.5 B | 18.7 ± 4.0 A | 14.2 ± 1.5 A | 24.4 ± 4.3 B | 16.3 ± 2.6 A | 14.7 ± 2.8 A |
| R2 | 0.986 | 0.990 | 0.965 | 0.978 | 0.968 | 0.990 | 0.984 | 0.969 | 0.990 | 0.984 | 0.998 | 0.984 | 0.995 | 0.990 | 0.990 | 0.985 |
© 2020 by the authors. Licensee MDPI, Basel, Switzerland. This article is an open access article distributed under the terms and conditions of the Creative Commons Attribution (CC BY) license (http://creativecommons.org/licenses/by/4.0/).
Share and Cite
Vázquez, J.A.; Durán, A.I.; Menduíña, A.; Nogueira, M.; Gomes, A.M.; Antunes, J.; Freitas, A.C.; Dagá, E.; Dagá, P.; Valcarcel, J. Bioconversion of Fish Discards through the Production of Lactic Acid Bacteria and Metabolites: Sustainable Application of Fish Peptones in Nutritive Fermentation Media. Foods 2020, 9, 1239. https://doi.org/10.3390/foods9091239
Vázquez JA, Durán AI, Menduíña A, Nogueira M, Gomes AM, Antunes J, Freitas AC, Dagá E, Dagá P, Valcarcel J. Bioconversion of Fish Discards through the Production of Lactic Acid Bacteria and Metabolites: Sustainable Application of Fish Peptones in Nutritive Fermentation Media. Foods. 2020; 9(9):1239. https://doi.org/10.3390/foods9091239
Chicago/Turabian StyleVázquez, José Antonio, Ana I. Durán, Araceli Menduíña, Margarita Nogueira, Ana María Gomes, Joana Antunes, Ana Cristina Freitas, Esther Dagá, Paula Dagá, and Jesus Valcarcel. 2020. "Bioconversion of Fish Discards through the Production of Lactic Acid Bacteria and Metabolites: Sustainable Application of Fish Peptones in Nutritive Fermentation Media" Foods 9, no. 9: 1239. https://doi.org/10.3390/foods9091239