Article

Photocatalytic Decolorization of Dye with Self-Dye-Sensitization under Fluorescent Light Irradiation

1
Department of Chemistry for Materials, Graduate School of Engineering, Mie University, Tsu 514-8507, Japan
2
Mie Global Environment Center for Education & Research, Mie University, Tsu 514-8507, Japan
*
Author to whom correspondence should be addressed.
ChemEngineering 2017, 1(2), 8; https://doi.org/10.3390/chemengineering1020008
Submission received: 10 August 2017 / Revised: 16 September 2017 / Accepted: 30 September 2017 / Published: 5 October 2017

Abstract

:
A dye-sensitization technique was applied to effective catalysts—TiO2 and ZnO—under fluorescent light irradiation for Orange II (OII) and Methyl Orange (MO) degradations. Treatments were carried out at different time periods using 20 mg of catalysts and 30 mL of 5 mg/L of OII and MO. The degradation efficiency of OII and MO increased with increasing irradiation time under irradiation of fluorescent light. The photocatalytic activity of ZnO nanoparticles was better compared with that of TiO2 for MO; and the ZnO activity was the same as TiO2 for OII photodegradation. Kinetic behavior was evaluated in terms of the Langmuir–Hinshelwood model (pseudo-first order kinetic). The possible mechanism of photodegradation under fluorescent light was discussed.

Graphical Abstract

1. Introduction

Titanium dioxide (TiO2) and zinc oxide (ZnO) have drawn great attention, because they have become one of the most effective photocatalysts in the mineralization of toxic organic substances, owing their virtues of low cost, highly chemical stability, and nontoxicity [1,2]. However, these catalysts can only be excited by the irradiation of UV light, due to their wide band gaps. An artificial light source, for instance an Hg-Xe lamp, is particularly expensive, whereas a fluorescent lamp is cheap, has a longer life time, and uses less energy. The UV region occupies only a small fraction of a fluorescent lamp’s spectrum. This problem can be solved only by improving the light absorption capacity of photocatalysts [3,4]. Photocatalysts can be modified in order to expand their photoresponse to the visible region for pollutant degradation with several ways, including the doping with cations/anions or the coupling with another small band gap materials [5]. Most of these methods, however, are time-consuming and quite expensive. Dye sensitization, on the other hand, is a simpler method that can extend catalysts activation to longer wavelengths compared with those corresponding to its band gap. Dye sensitization begins with electron injection into the conduction band (CB) of a photocatalyst from the excited dye, followed by interfacial electron transfer [6,7].
Recently, the self-sensitized degradation of dye under visible light irradiation has been investigated. Wu et al. [8] studied self-photosensitized oxidative decolorization of rhodamine B under visible light irradiation in TiO2 dispersions with a halogen lamp and cutoff filter. The photosensitized degradation of a textile azo dye with TiO2 using visible light with a fiber optic illuminator was reported by Vinodgopal and Kamat [9]. Xing et al. [10] studied the enhanced self-sensitized degradation of colored pollutants under visible light with a mercury lamp and filter. The photocatalytic performance of ZnO for self-sensitized degradation of malachite green under solar light was investigated by Saikia et al. [11]. According to our knowledge, there is little information on the photocatalytic decolorization of dye in water with self-dye-sensitized photocatalysts under room fluorescent light irradiation with very weak intensity.
The present work deals with photocatalytic decolorization of dye in water with self-dye-sensitized TiO2 and ZnO under room fluorescent light irradiation.

2. Materials and Methods

2.1. Materials

All reagents were of analytical grade and were used without further treatment. Orange II and methyl orange used in this study were purchased from Nacalai Tesque Inc., Kyoto, Japan (grade >99%). TiO2 powder (P25, purity 99.9%) was obtained from Degussa Co., Essen, Germany. ZnO was purchased from Sigma-Aldrich, St. Louis, MO, USA. Ultrapure water (18 MΩ cm) was prepared by an ultrapure water system (Advantec MFS Inc., Tokyo, Japan). The detailed experimental conditions were shown in Table 1.

2.2. Characterization of Photocatalyst

In order to record the diffraction patterns of photocatalysts (TiO2 and ZnO), the powder X-ray diffractometer (XRD, RIGAKU Ultima IV, sample horizontal type) was used in the condition of Cu Kα radiation of wavelength 0.15406 nm with tube current of 50 mA at 40 kV in 2θ angle range from 10° to 80° with a scan speed of 4°/min and a step size of 0.02°. Figure S1 shows the X-ray diffraction (XRD) pattern of TiO2. Because P25 is a mixture of 20% rutile and 80% anatase, XRD pattern shows both anatase and rutile lines [12]. Figure S2 illustrates the XRD of ZnO. Three main distinct peaks at 31.76°, 34.42°, and 36.26° are observed in the patterns, which are indexed to the (100), (002), and (101) diffractions of the wurtzite ZnO, respectively [13]. The particle size of the TiO2 and ZnO have been obtained from the full width at half maximum (FWHM) of the most intense peaks of the respective crystals using the Scherrer equation, D = 0.9λ/βcosθ, where λ is the X-ray wavelength, D the average crystallite size, θ the Bragg diffraction angle, and β the full width at half-maximum. The crystal size of TiO2 and ZnO could be estimated as ~21 and ~38 nm, respectively.
The diffuse reflectance spectra (DRS) of photocatalysts were checked over a range of 200–800 nm using a Shimadzu UV-2450 UV–vis system equipped with an integrating sphere diffuse reflectance accessory with the reference material BaSO4. The diffuse reflectance spectra of the TiO2 and ZnO samples were studied, as shown in Figures S3 and S4. The reflectance data was converted to Kubelka–Munk equation which is expressed as F(R) = (1 − R)2/2R. The optical band gap of TiO2 was deduced by extrapolating the straight linear portion of the plot of [F(R)]0.5 versus the photon energy () to the phonon energy axis, which is shown in the interior of Figure S3. The band gap of ZnO was estimated from the Tauc plot of [F(R)]2 versus photon energy, which is presented in the interior of Figure S4.

2.3. Evaluation of Photocatalytic Activity

The photodegradation system is illustrated in Figure S5. The photocatalytic activities of TiO2 and ZnO were checked by the decolorization of two typical azo dyes, orange II (OII) and methyl orange (MO), under 450 nm LED light and fluorescent light irradiation. The photocatalytic reactions were performed in a Pyrex glass reactor. The catalyst powder (20 mg) was suspended in 30 mL of dye solutions with 5 mg/L without adjustment of pH. The luminous intensities were measured by a LI-COR light sensor (LI-250A), and were 5.1 mW/cm2 for LED lamp and 0.034 mW/cm2 for fluorescent light, respectively. The adsorption experiment was conducted with aluminum foil coverage to block the impact of radiation. Prior to light illumination, the catalyst suspension was dispersed by a magnetic stirrer for 30 min in the dark, to achieve adsorption equilibrium. During irradiation, the catalyst was kept in suspension state by a magnetic stirrer. After the illumination, the catalyst was separated through the Advantec membrane filter 0.45 μm. The catalysts could be almost removed by the filtration. The concentration of dye was measured using a UV–visible spectrometry (UV-1650PC, SHIMADZU Co., Tokyo, Japan). According to Beer–Lambert law, the relative concentration (C/C0) of the OII solution was calculated by the relative absorbance (A/A0) at 485 nm, where A0 and A are the absorbance of the OII solution at the beginning time (t0) of photocatalytic treatment and at time t, respectively. The photodegradation of OII under fluorescent light irradiation was similar to that under visible light irradiation except for the light source. The photodegradation of MO (5 mg/L) was similar to that of OII except that the detection wavelength was 464 nm.

3. Results and Discussion

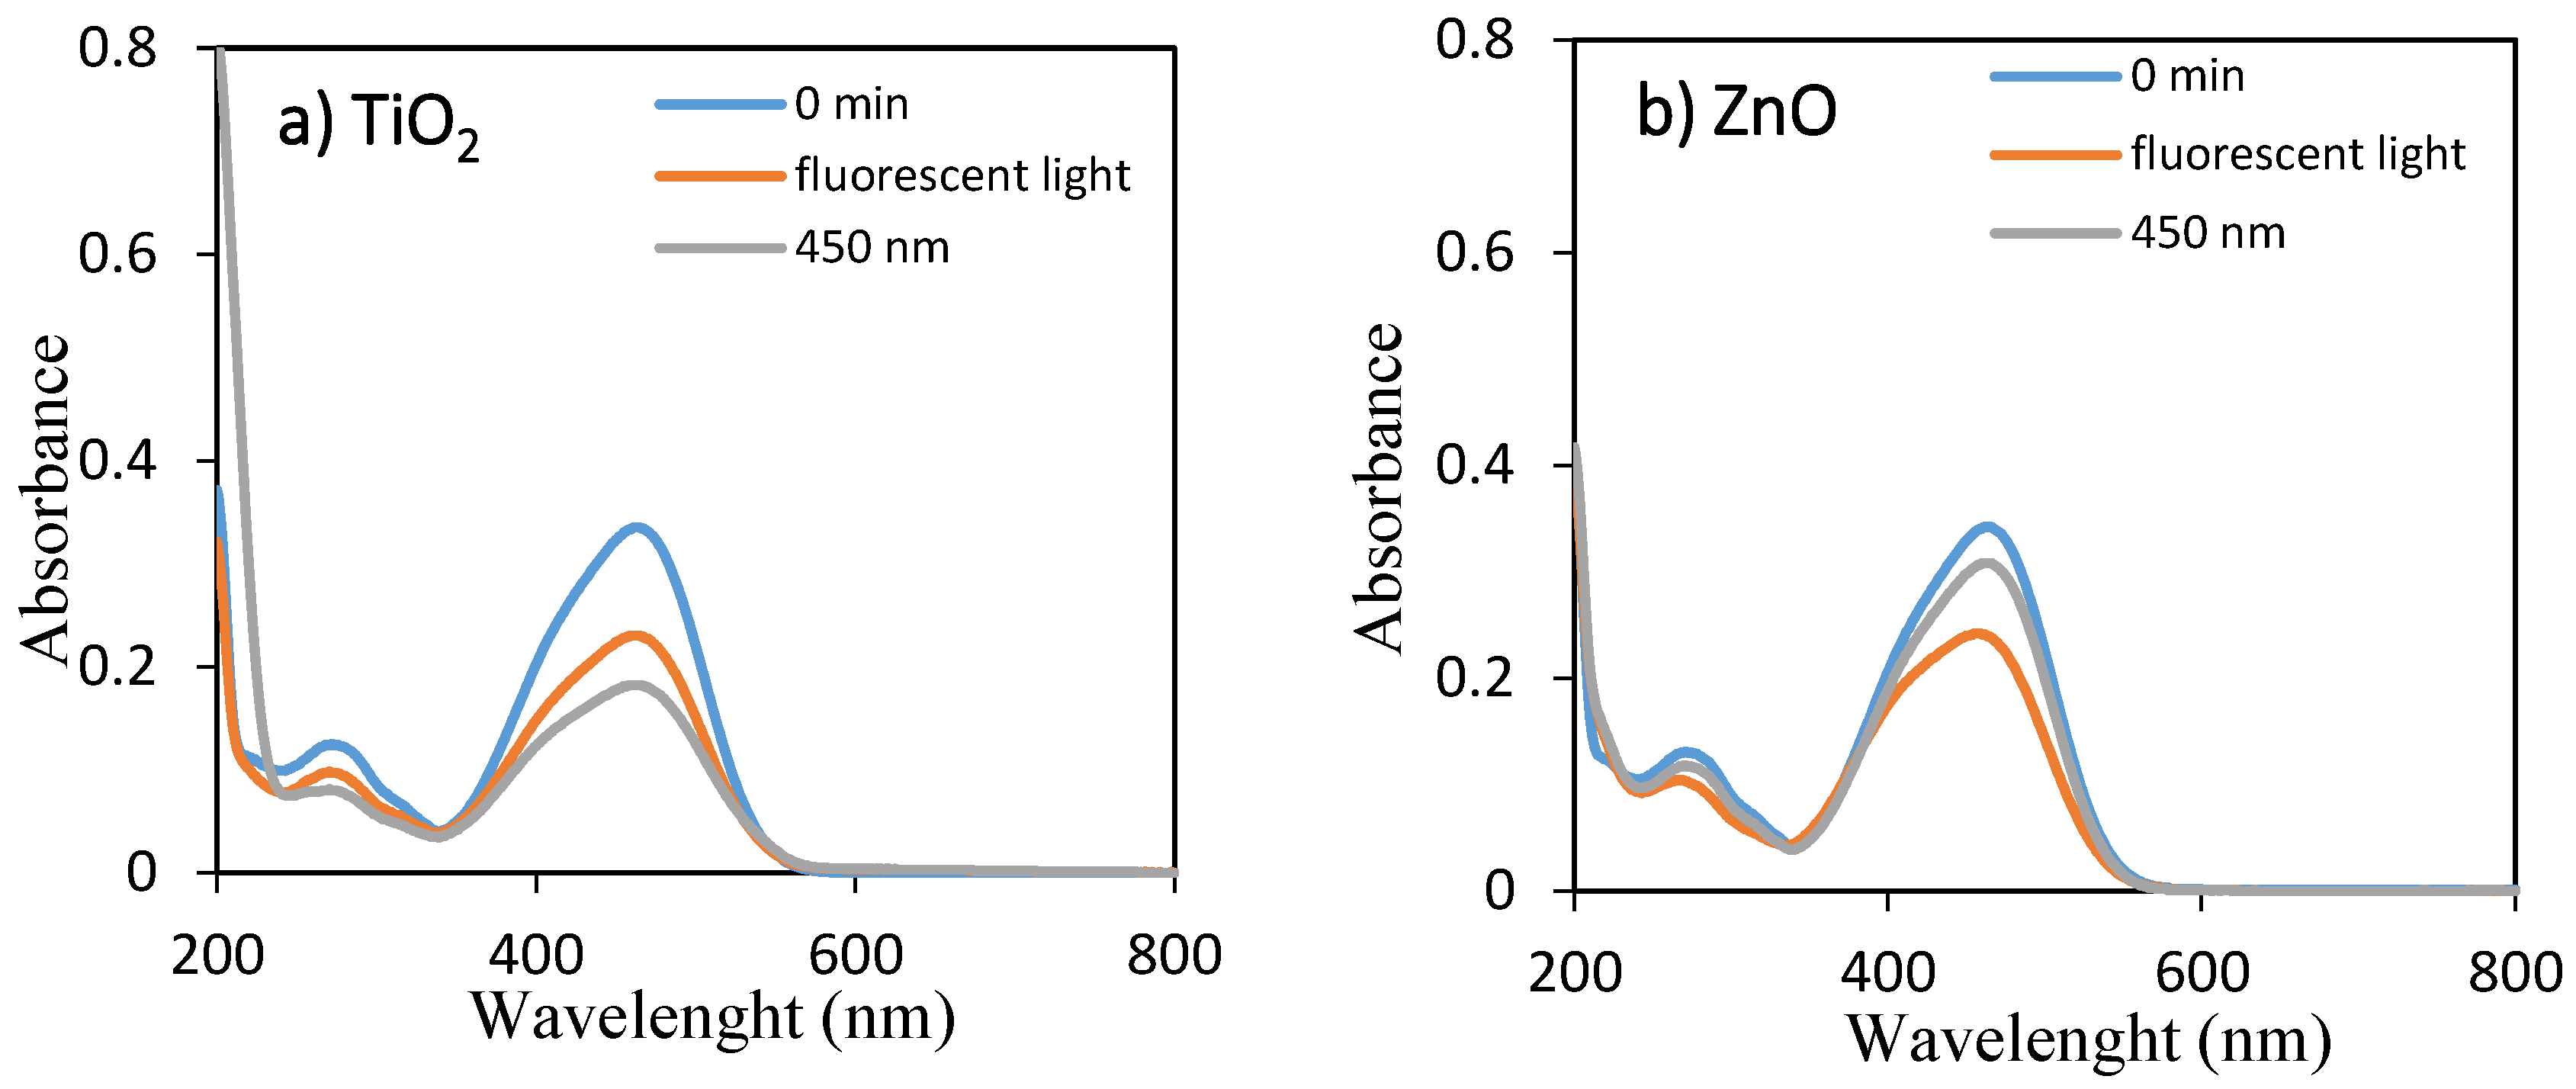
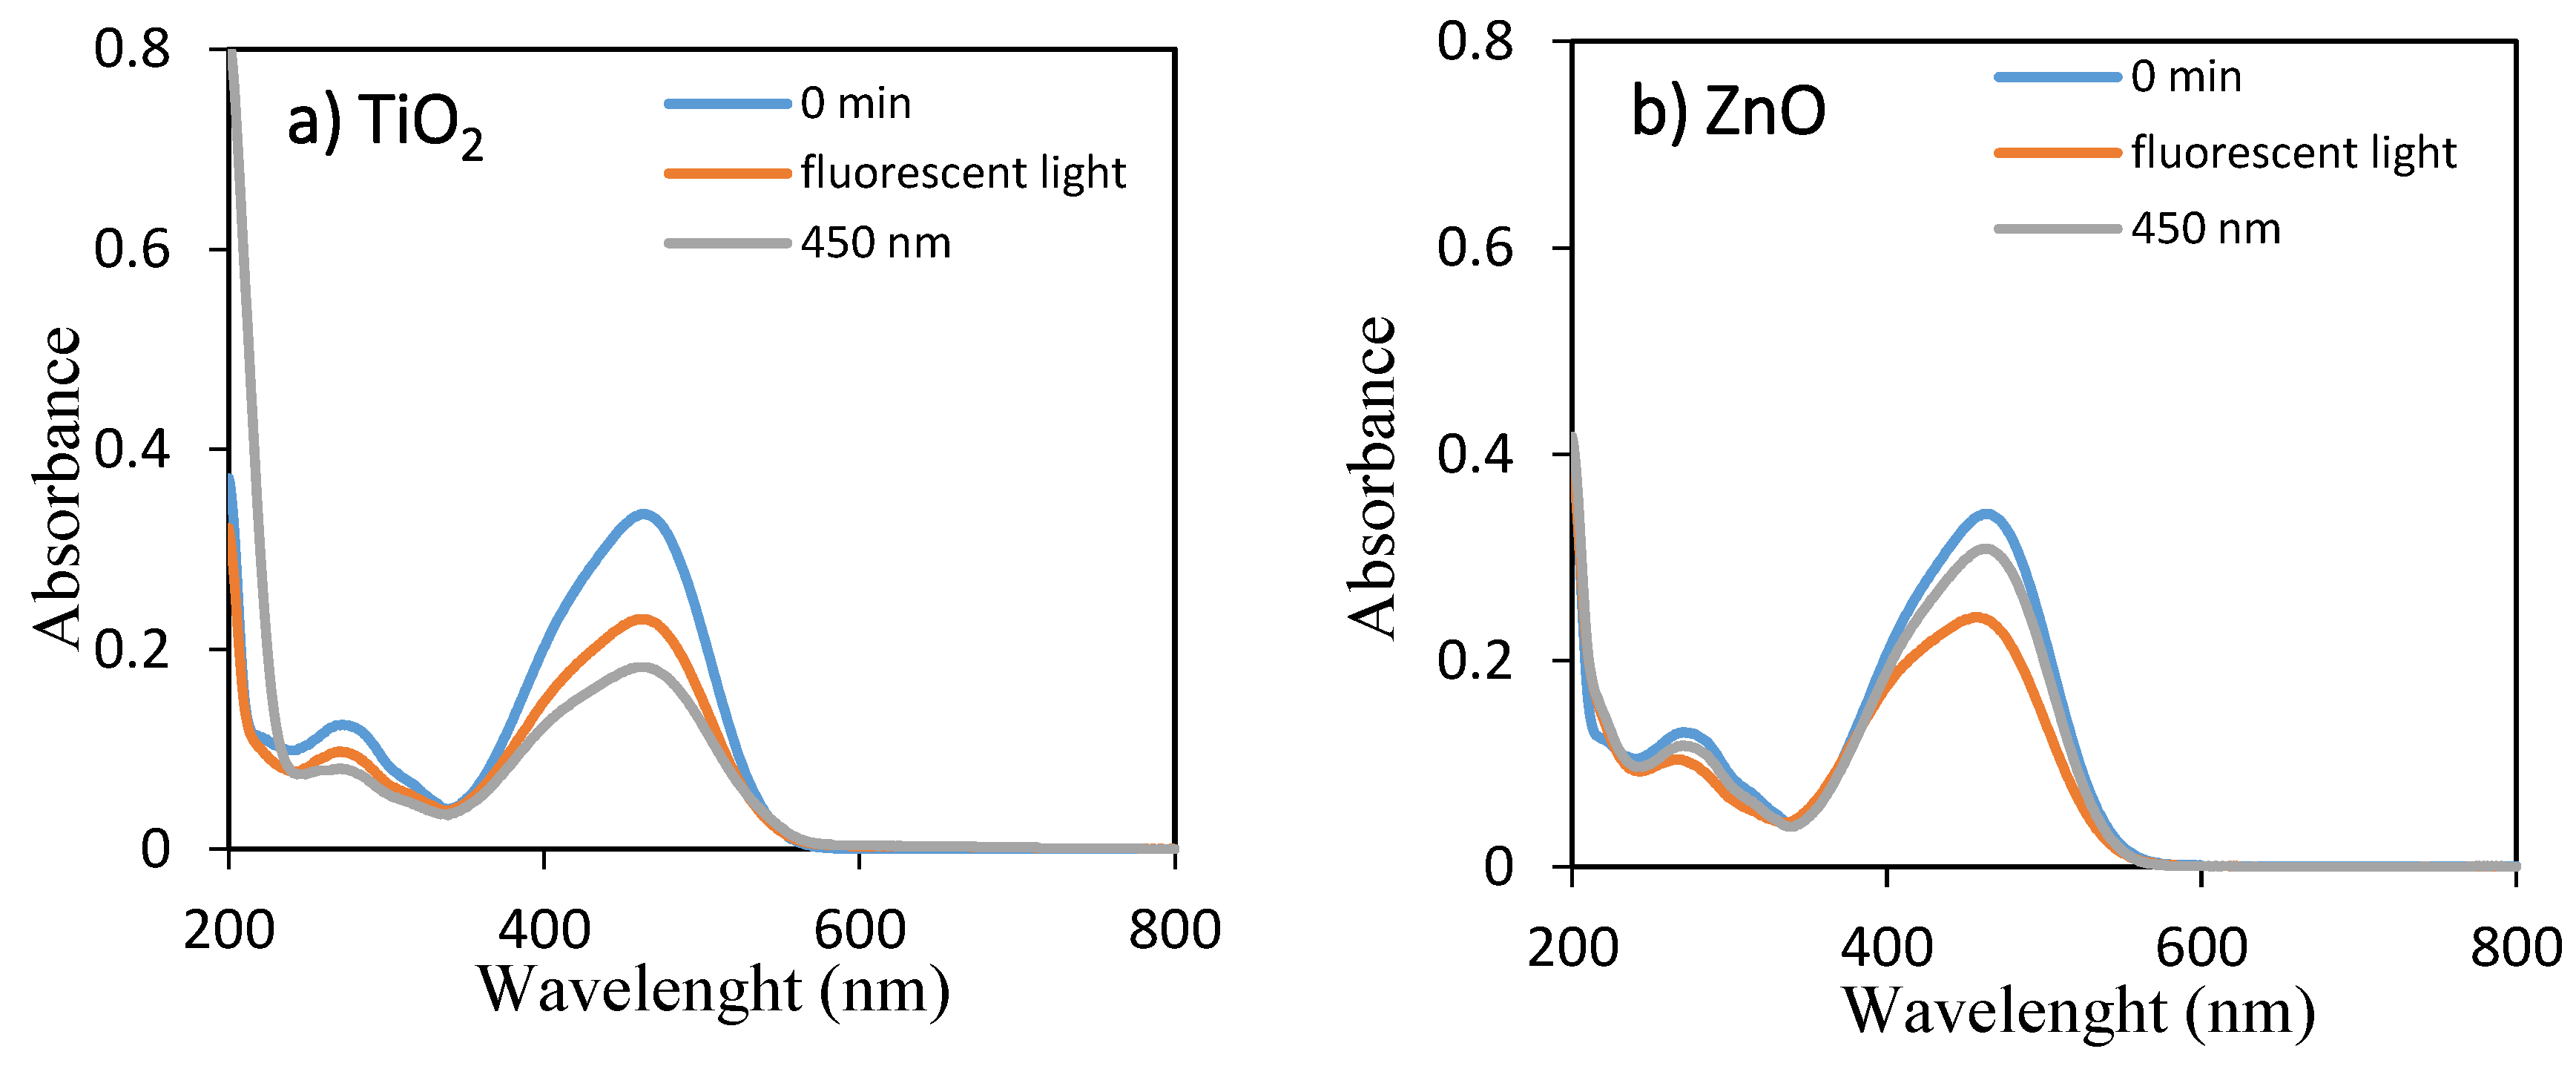
3.1. UV–Visible Analysis

The temporal absorption spectral changes during the photocatalytic decolorization of OII and MO with TiO2 and ZnO under fluorescent and 450 nm light illuminations were investigated, as shown in Figure 1 and Figure 2, respectively. As they can be seen, the intensities of the peak at 485 and 464 nm progressively decreased with increasing irradiation time up to 360 min. The well-defined absorption bands decreased after irradiation for 360 min, indicating that OII and MO had been decolored in the presence of TiO2 and ZnO with fluorescent light and 450 nm LED light irradiation. Therefore, the self-dye-sensitization was very effective for the decolorization of OII and MO under fluorescent and 450 nm light illuminations.

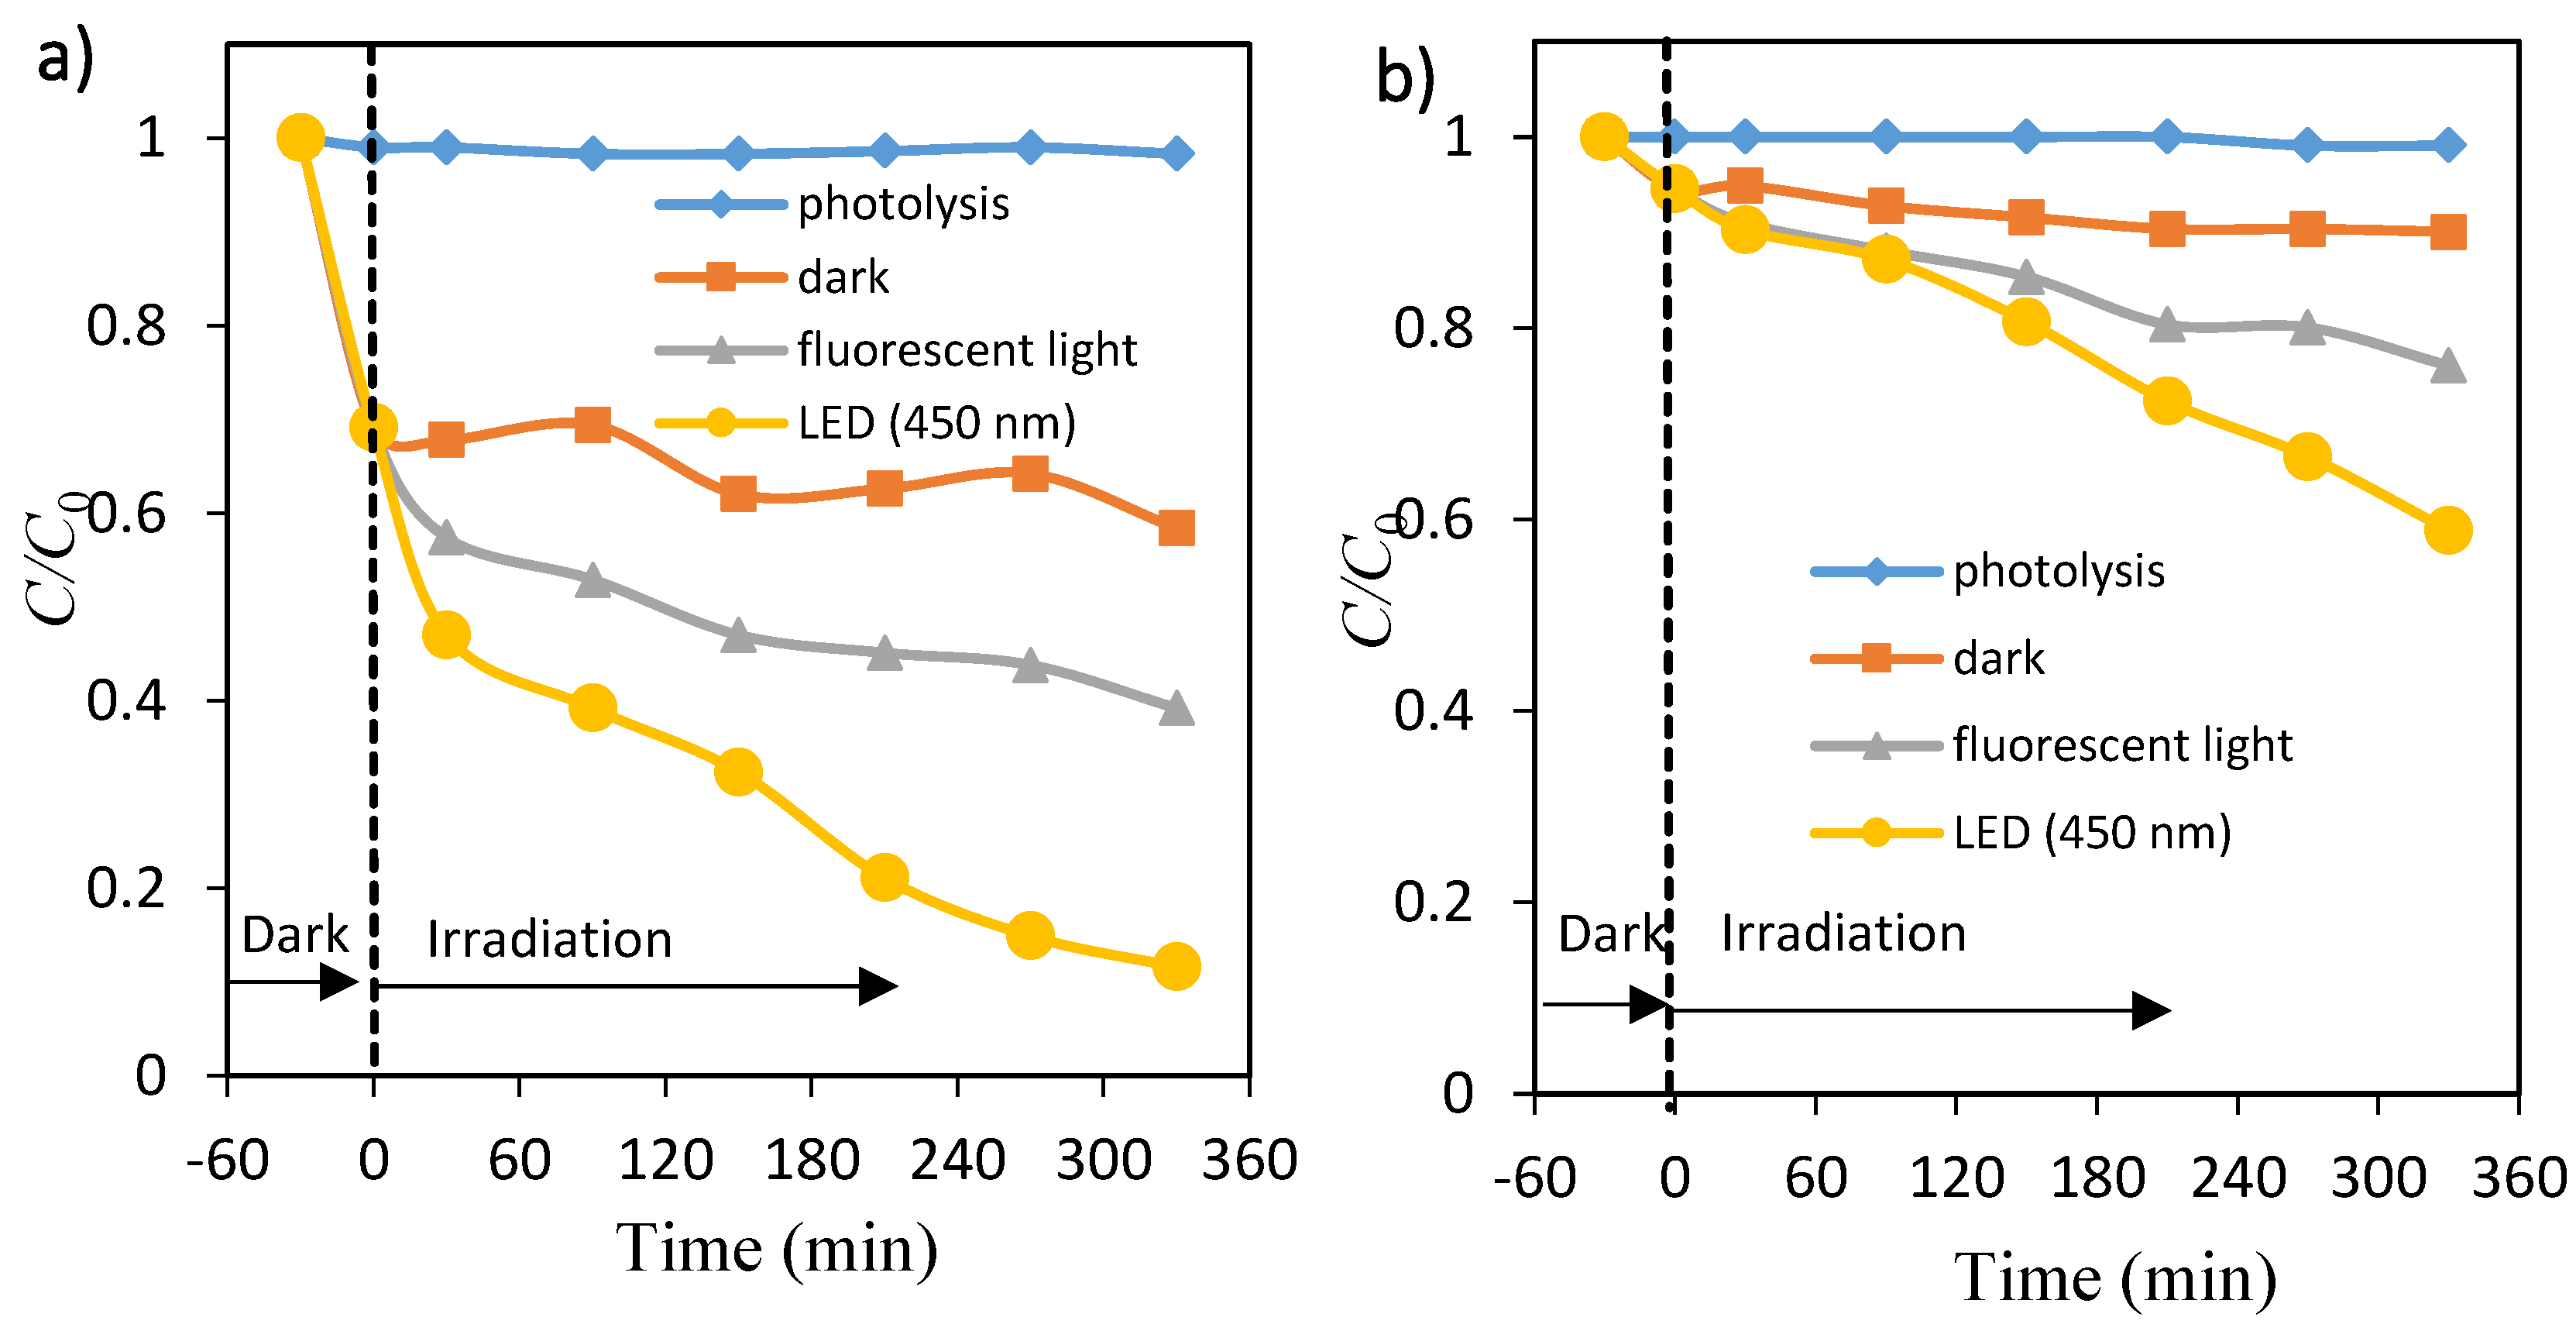
3.2. Photocatalytic Decolorization of OII and MO with TiO2

The effect of irradiation time on photocatalytic decolorization of dye (OII and MO) was performed by measuring the percentage of dye removal at different periods under fluorescent and 450 nm LED lights, as shown in Figure 3a,b, respectively. The percentage of OII and MO removal increased with an increase in irradiation time, and reached up to about 61% and 24% for fluorescent light and about 88% and 41% for LED light after 6 h, respectively. The adsorption (removal) percentage of OII on TiO2 particles was large up to 30 min, whereas MO adsorption was very little. There was little change in the OII and MO solutions during photolysis. The photocatalytic decolorization processes of both dyes under LED light were more effective compared with those obtained under fluorescent light radiation. These facts may be due to the light intensity, because the amounts of electron–hole pairs are dependent on them [14].

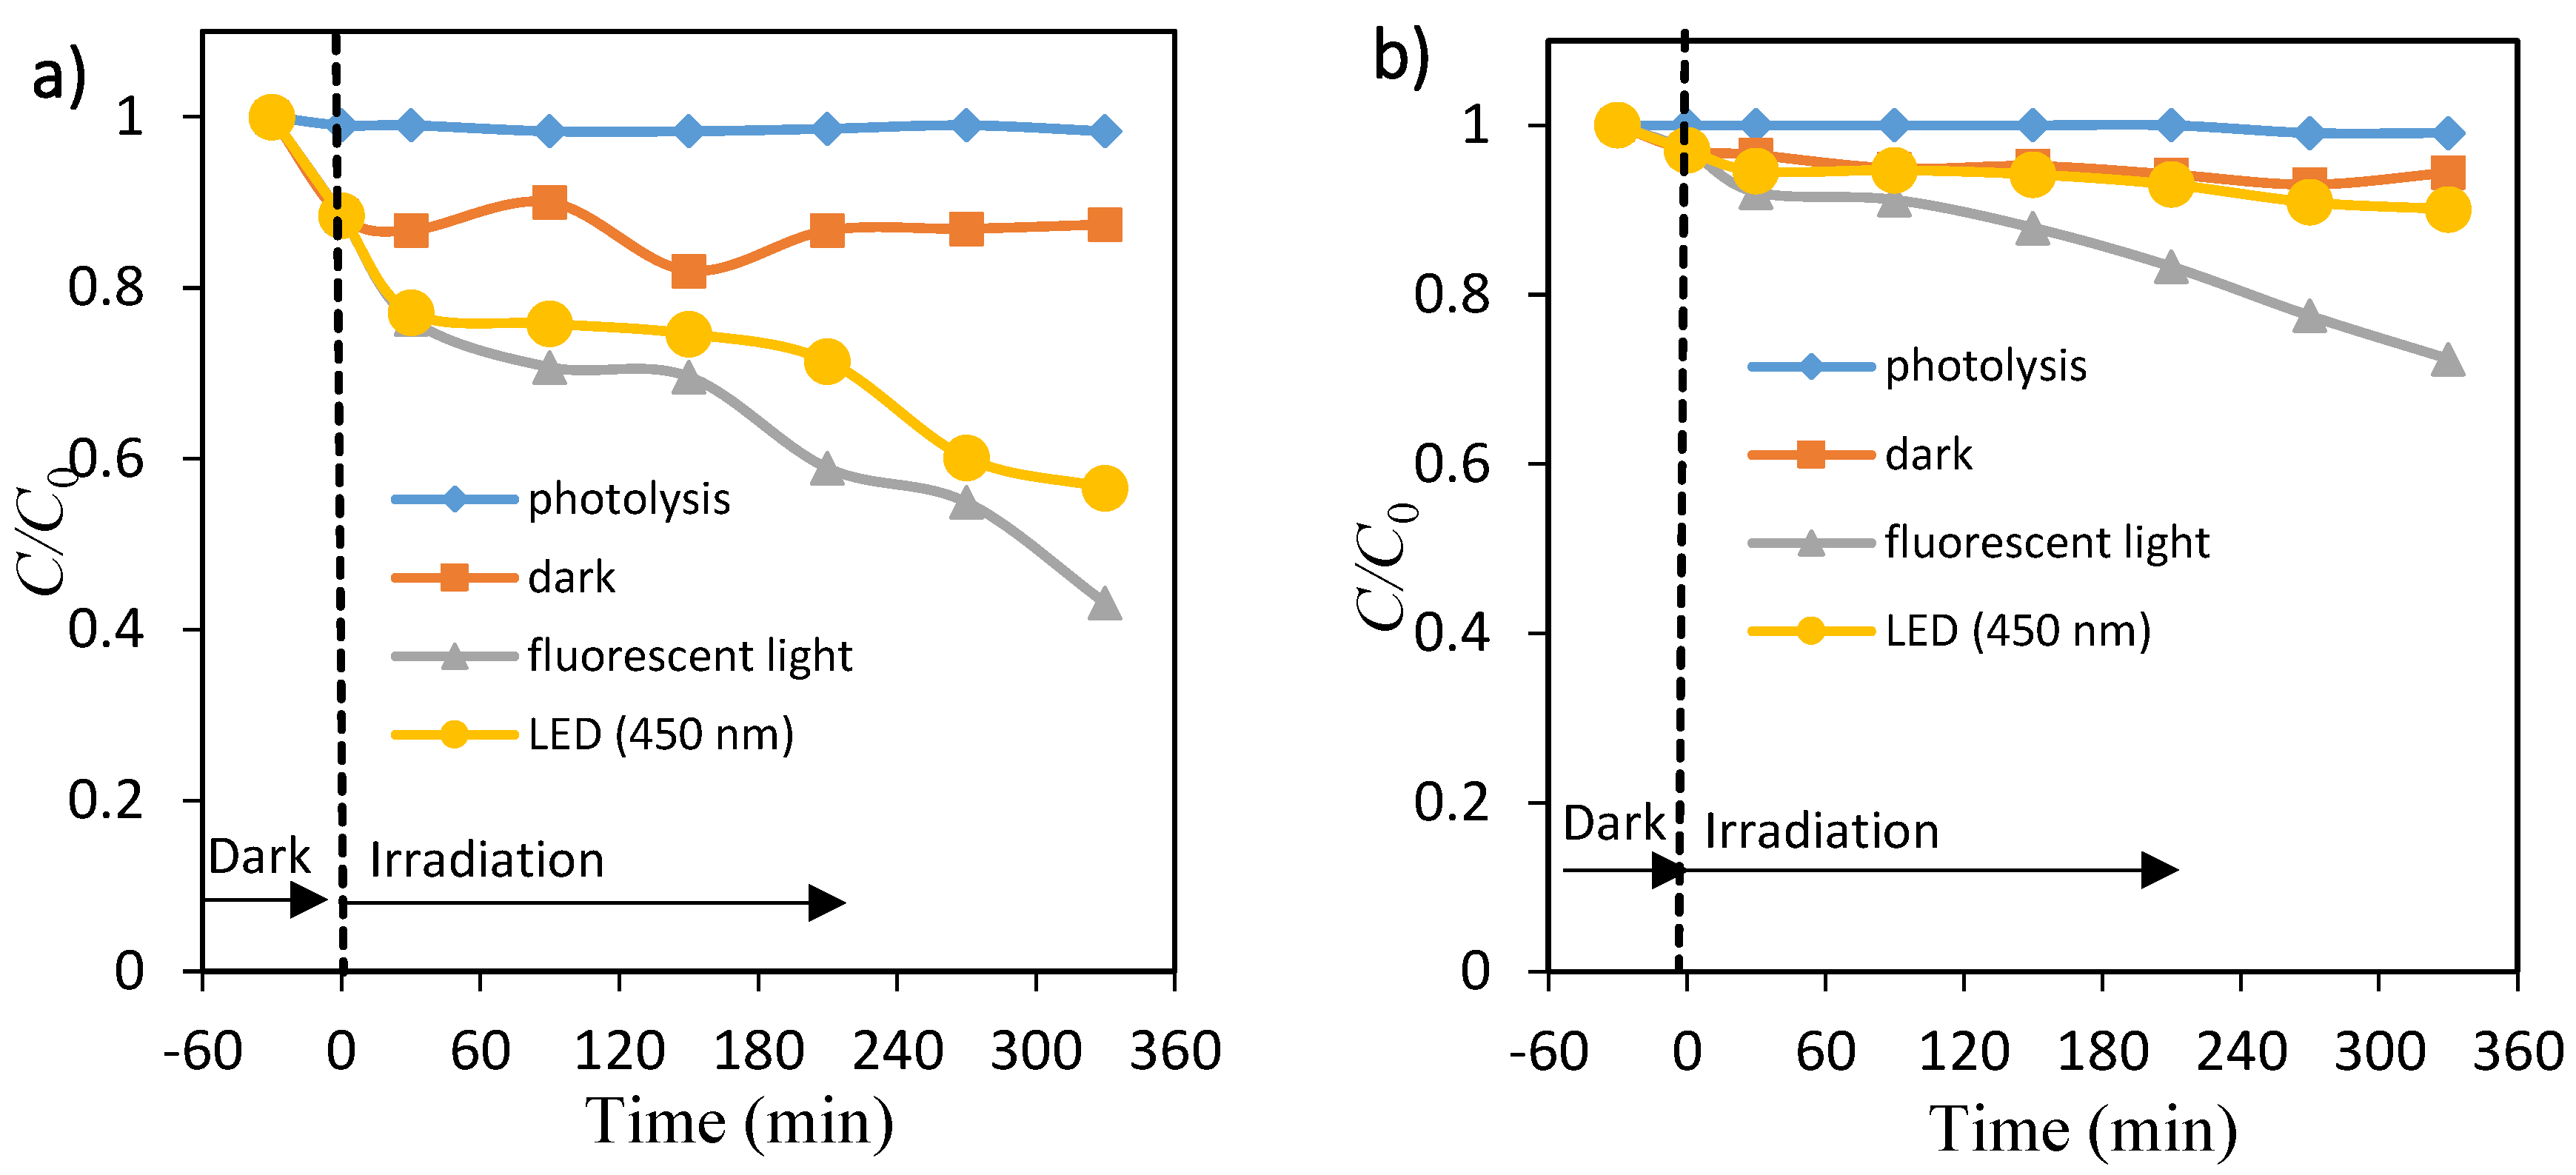
3.3. Photocatalytic Decolorization of OII and MO with ZnO

Figure 4a,b shows the percentage of dye (OII and MO) in the presence of ZnO nanopowders under fluorescent light and 450 nm LED light. About 57% and 28% degradation of OII and MO took place at 6 h under fluorescent light, whereas about 43% and 10% was eliminated under 450 nm LED light. Negligible decolorization occurred in the presence of fluorescent light and 450 nm LED light without any catalyst, as shown in Figure S6a,b. Without the presence of either photocatalysts (TiO2 and ZnO) or the light (fluorescent and 450 nm) radiation, little change in the absorbance values was observed. The adsorption (removal) percentage of OII on TiO2 and ZnO particles was large, whereas adsorption of MO on the same photocatalyst was very little in the time range. This weaker adsorption process of methyl orange compared to the OII dye could be due to the MO molecule having only one SO3 group while the OII molecule has one SO3 and one OH group. These observations reveal that visible light and a photocatalyst are needed for effective decolorization of dye.

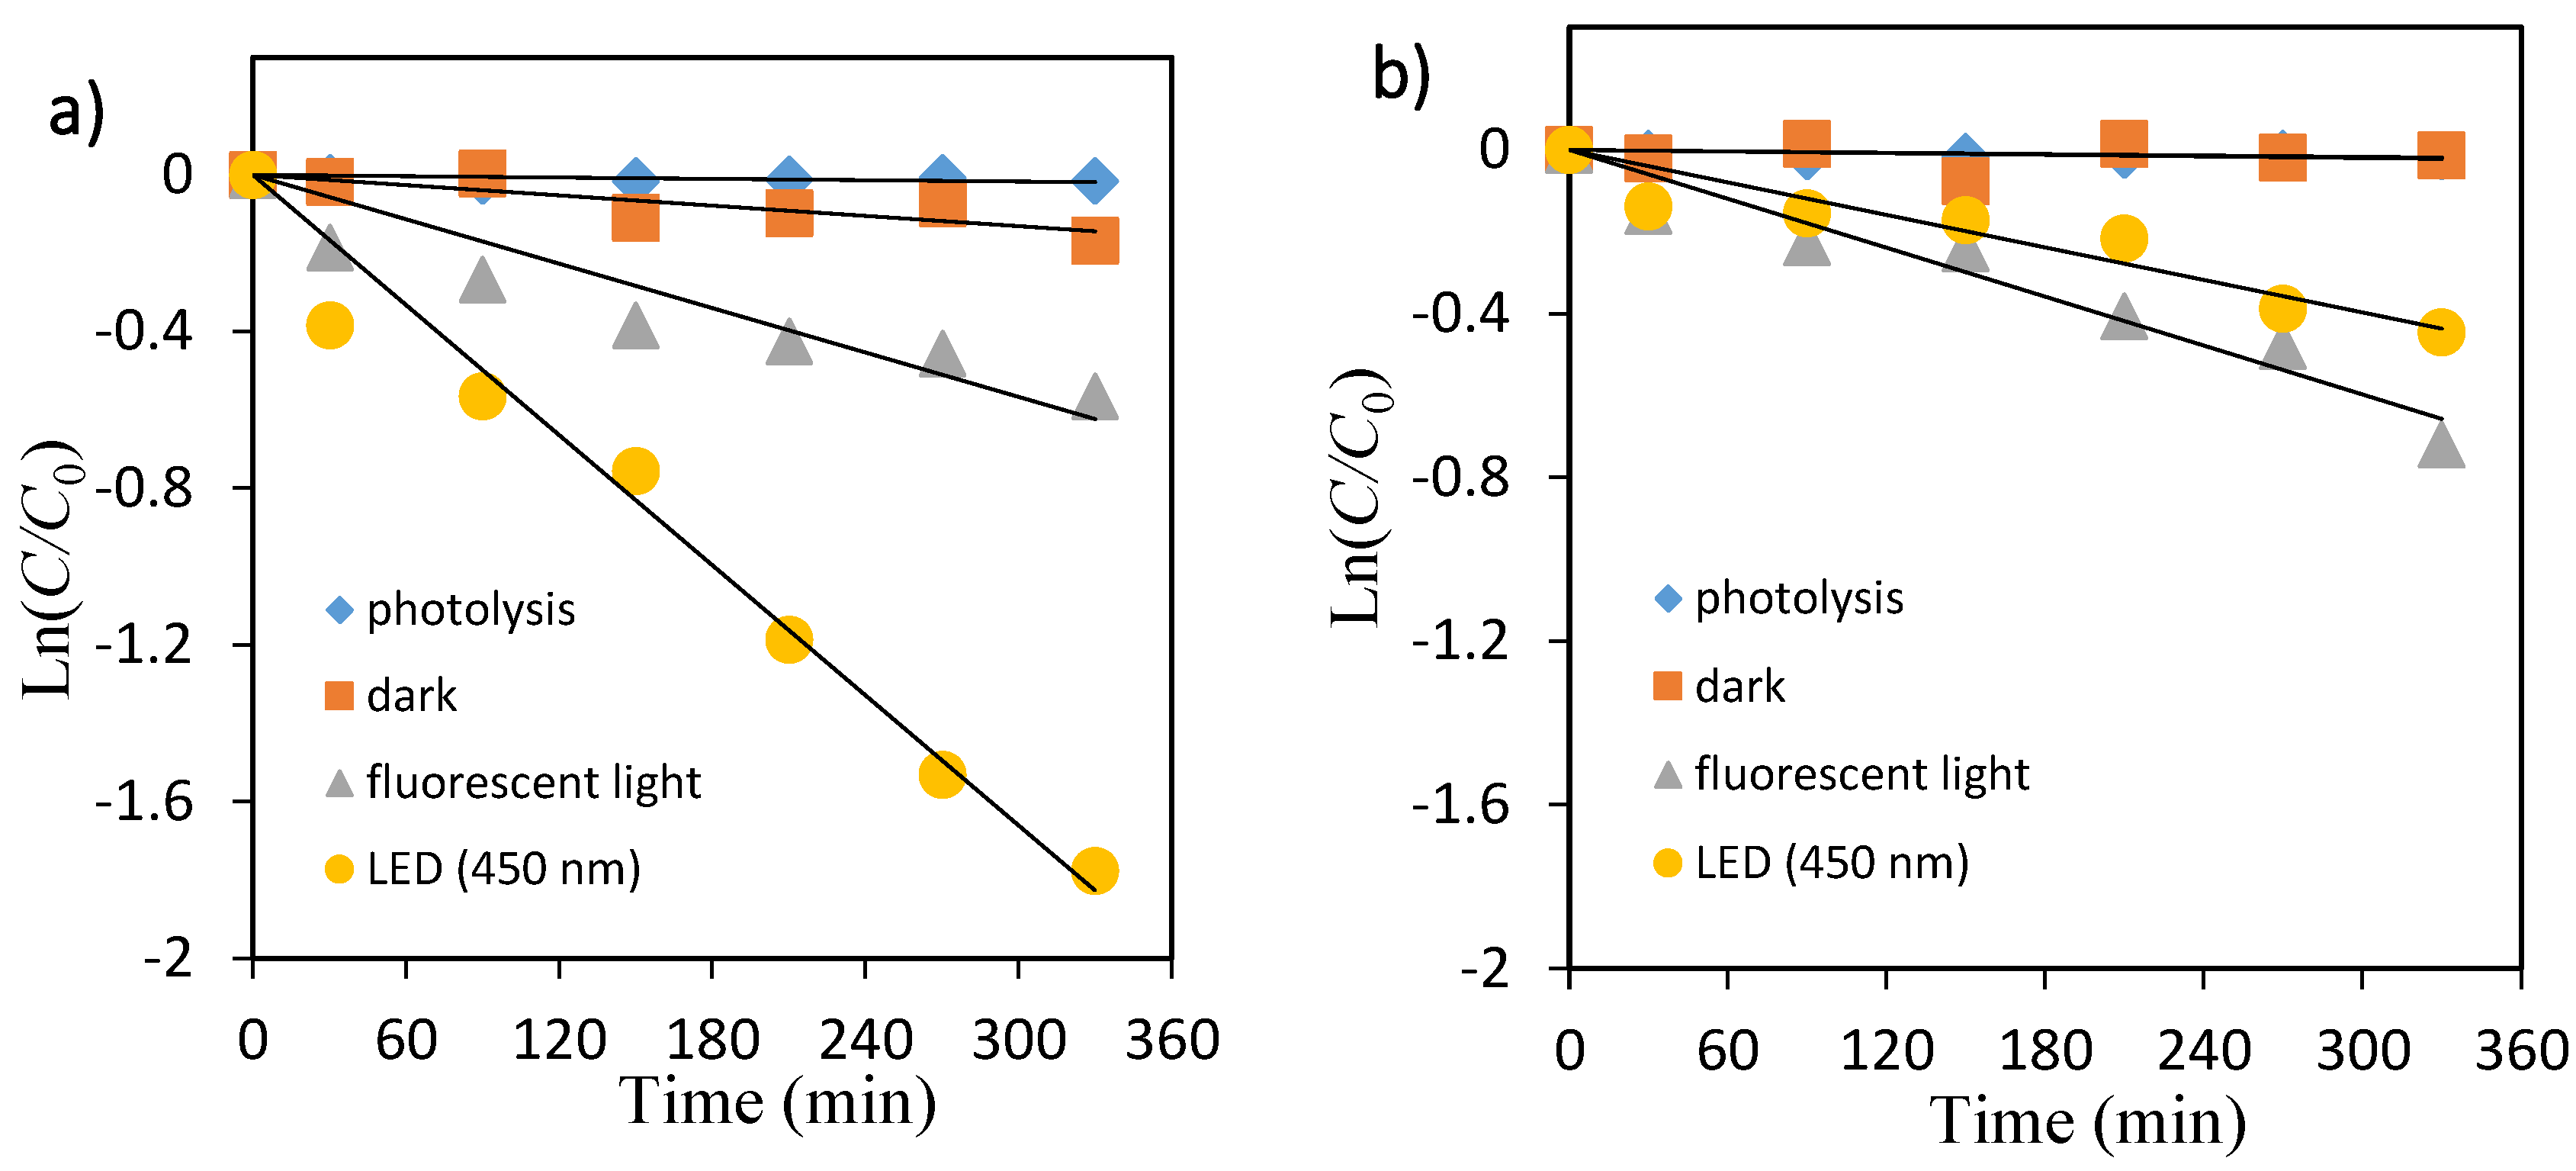
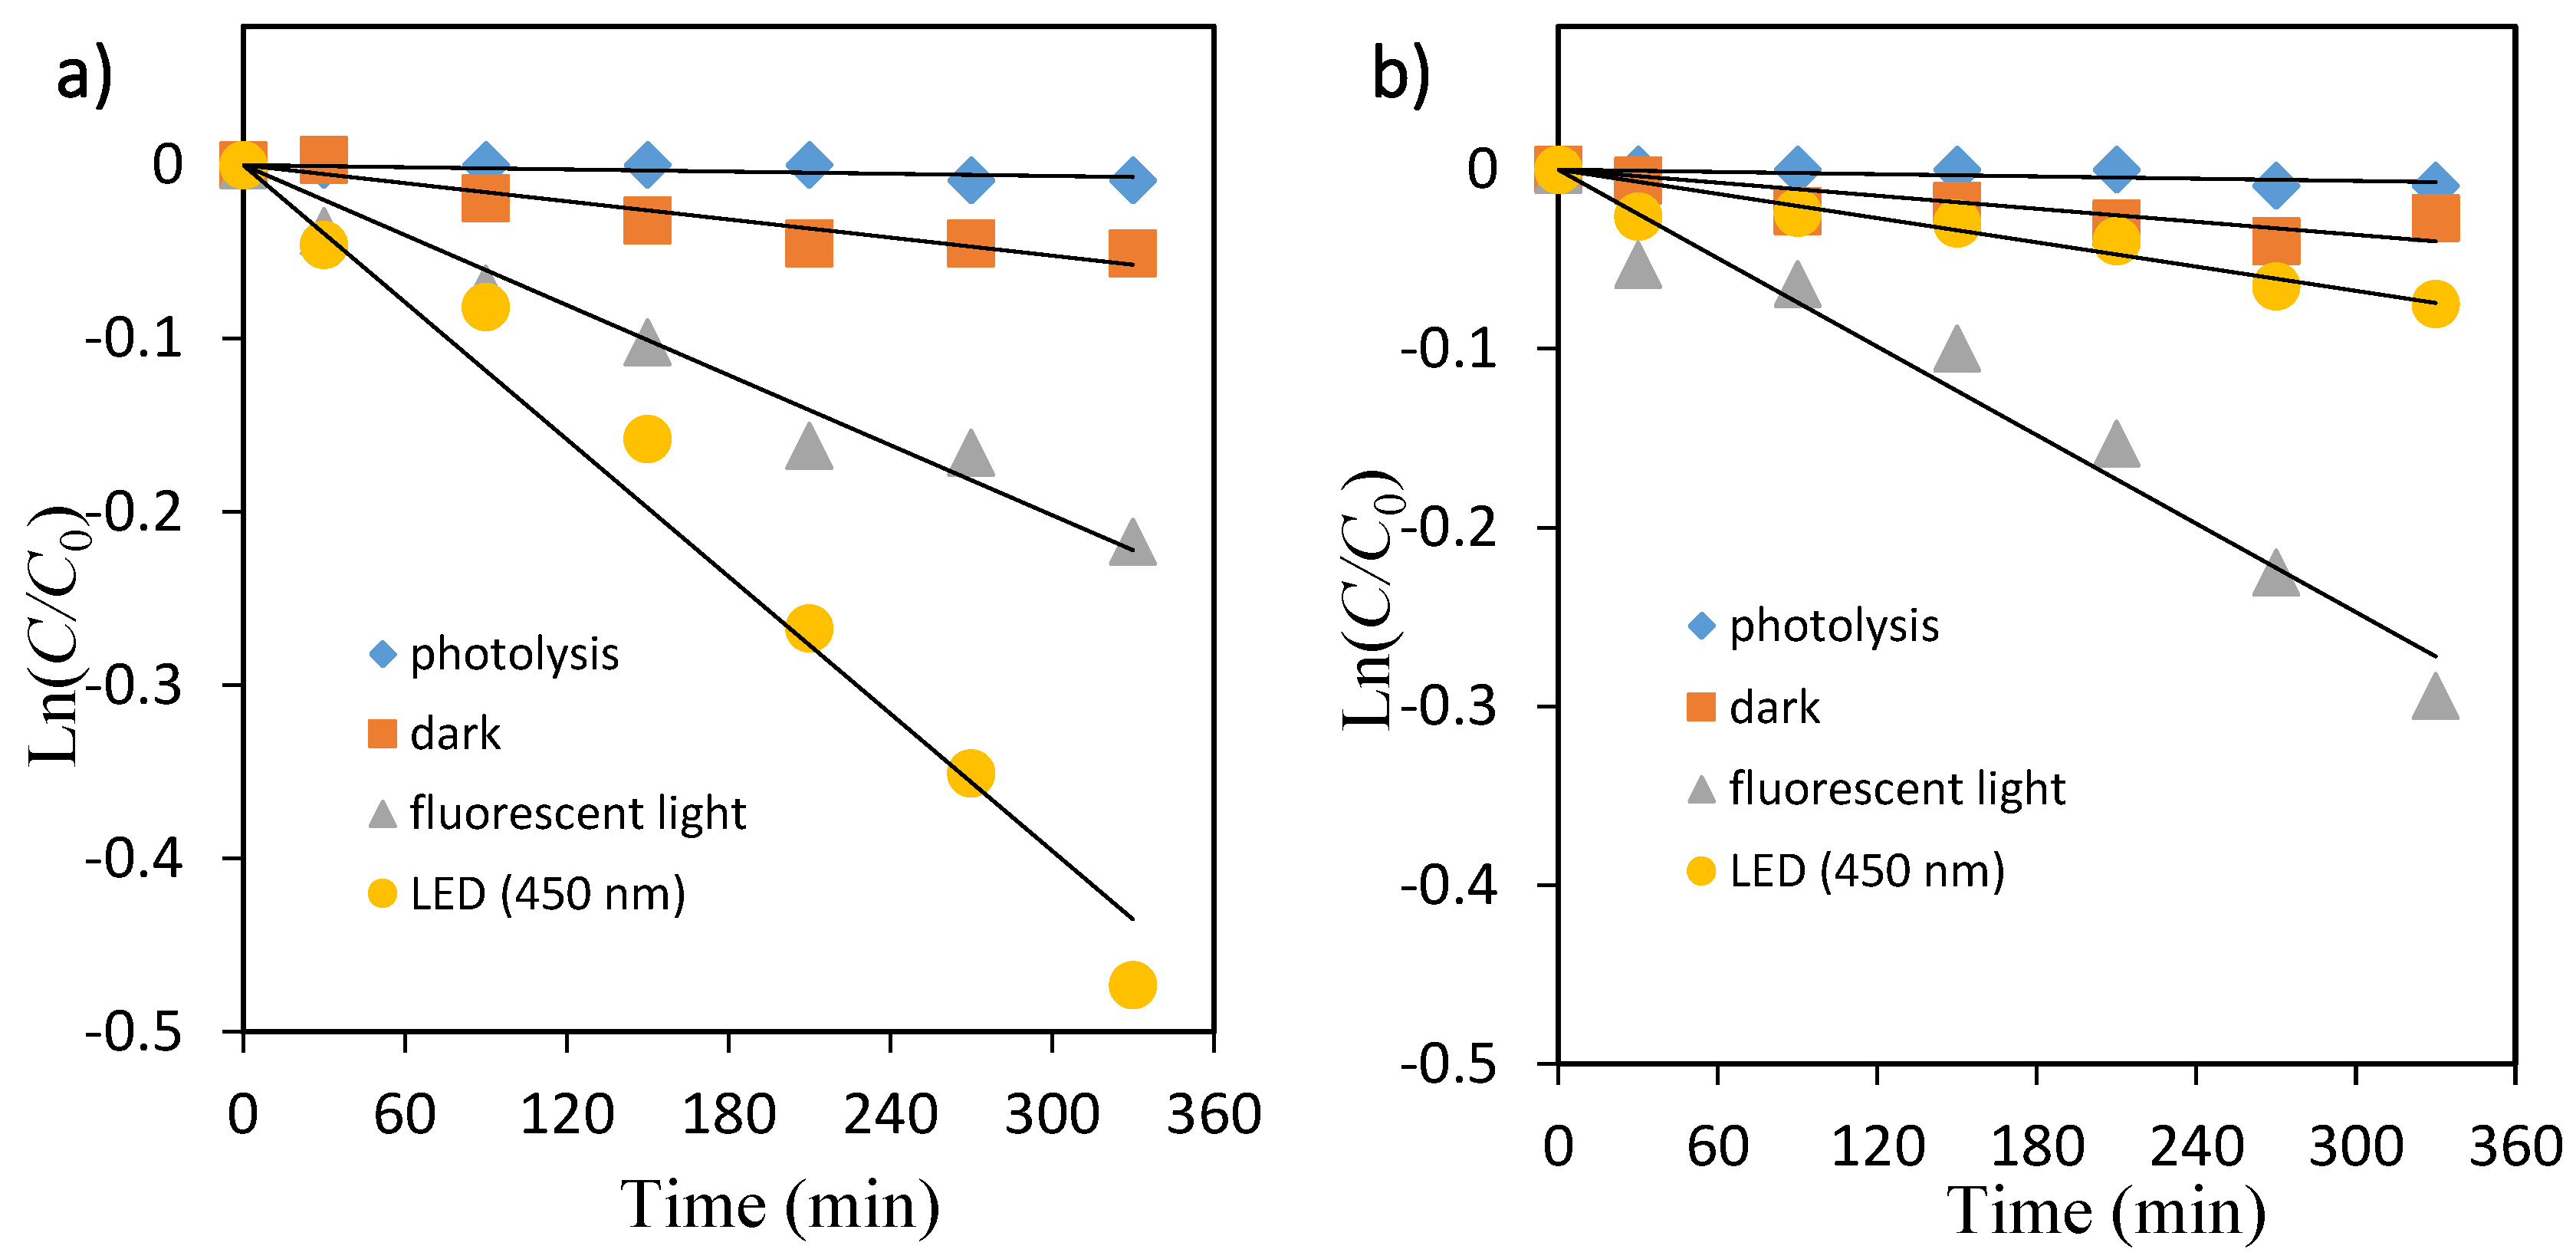
3.4. Kinetic Analysis

The photocatalytic oxidation process for many organic contaminants has often been modeled with the Langmuir–Hinshelwood (L–H) equation, which also covers the adsorption properties of the substrate on the photocatalyst surface. This model was developed by Turchi and Ollis [15] and expressed as Equation (1):
r 0 = d C d t = k K C 1 + K C
where r0 is the degradation rate of the reactant, k is the reaction rate constant, and K and C are the adsorption equilibrium constant and concentration for the reactant, respectively. If the concentration of reactant is very low, i.e., KC << 1, the L–H equation (Equation (1)) simplifies to a pseudo-first-order kinetic law (Equation (2)) where kobs is being the apparent pseudo-first-order rate constant.
d C d t = k K C = k obs C
Integration of the above equation with the limit of C = C0 at t = 0 with C0 gives the equation:
Ln C C 0 = k obs t
The primary degradation reaction is estimated to follow a pseudo first-order kinetic law, according to Equation (3). In order to confirm the speculation, Ln(C/C0) was replotted as a function of illumination time for OII and MO shown in Figure 5 and Figure 6, respectively. Because the linear plots were observed as expected, the kinetics of OII and MO in the TiO2 suspension solution followed the first-order degradation curve, which agreed with the L–H model resulting from the low coverage in the experimental concentration range (5 mg/L).
The photocatalytic decolorization kinetic parameters such as pseudo-first-order rate constant, correlation coefficient, and substrate half-life are shown in Table 2. The values of rate constants have been determined from the slope of these plots. As shown in Table 2, the rate constant values kobs (min−1) were lower in fluorescent light compared with that under LED light for both dyes.

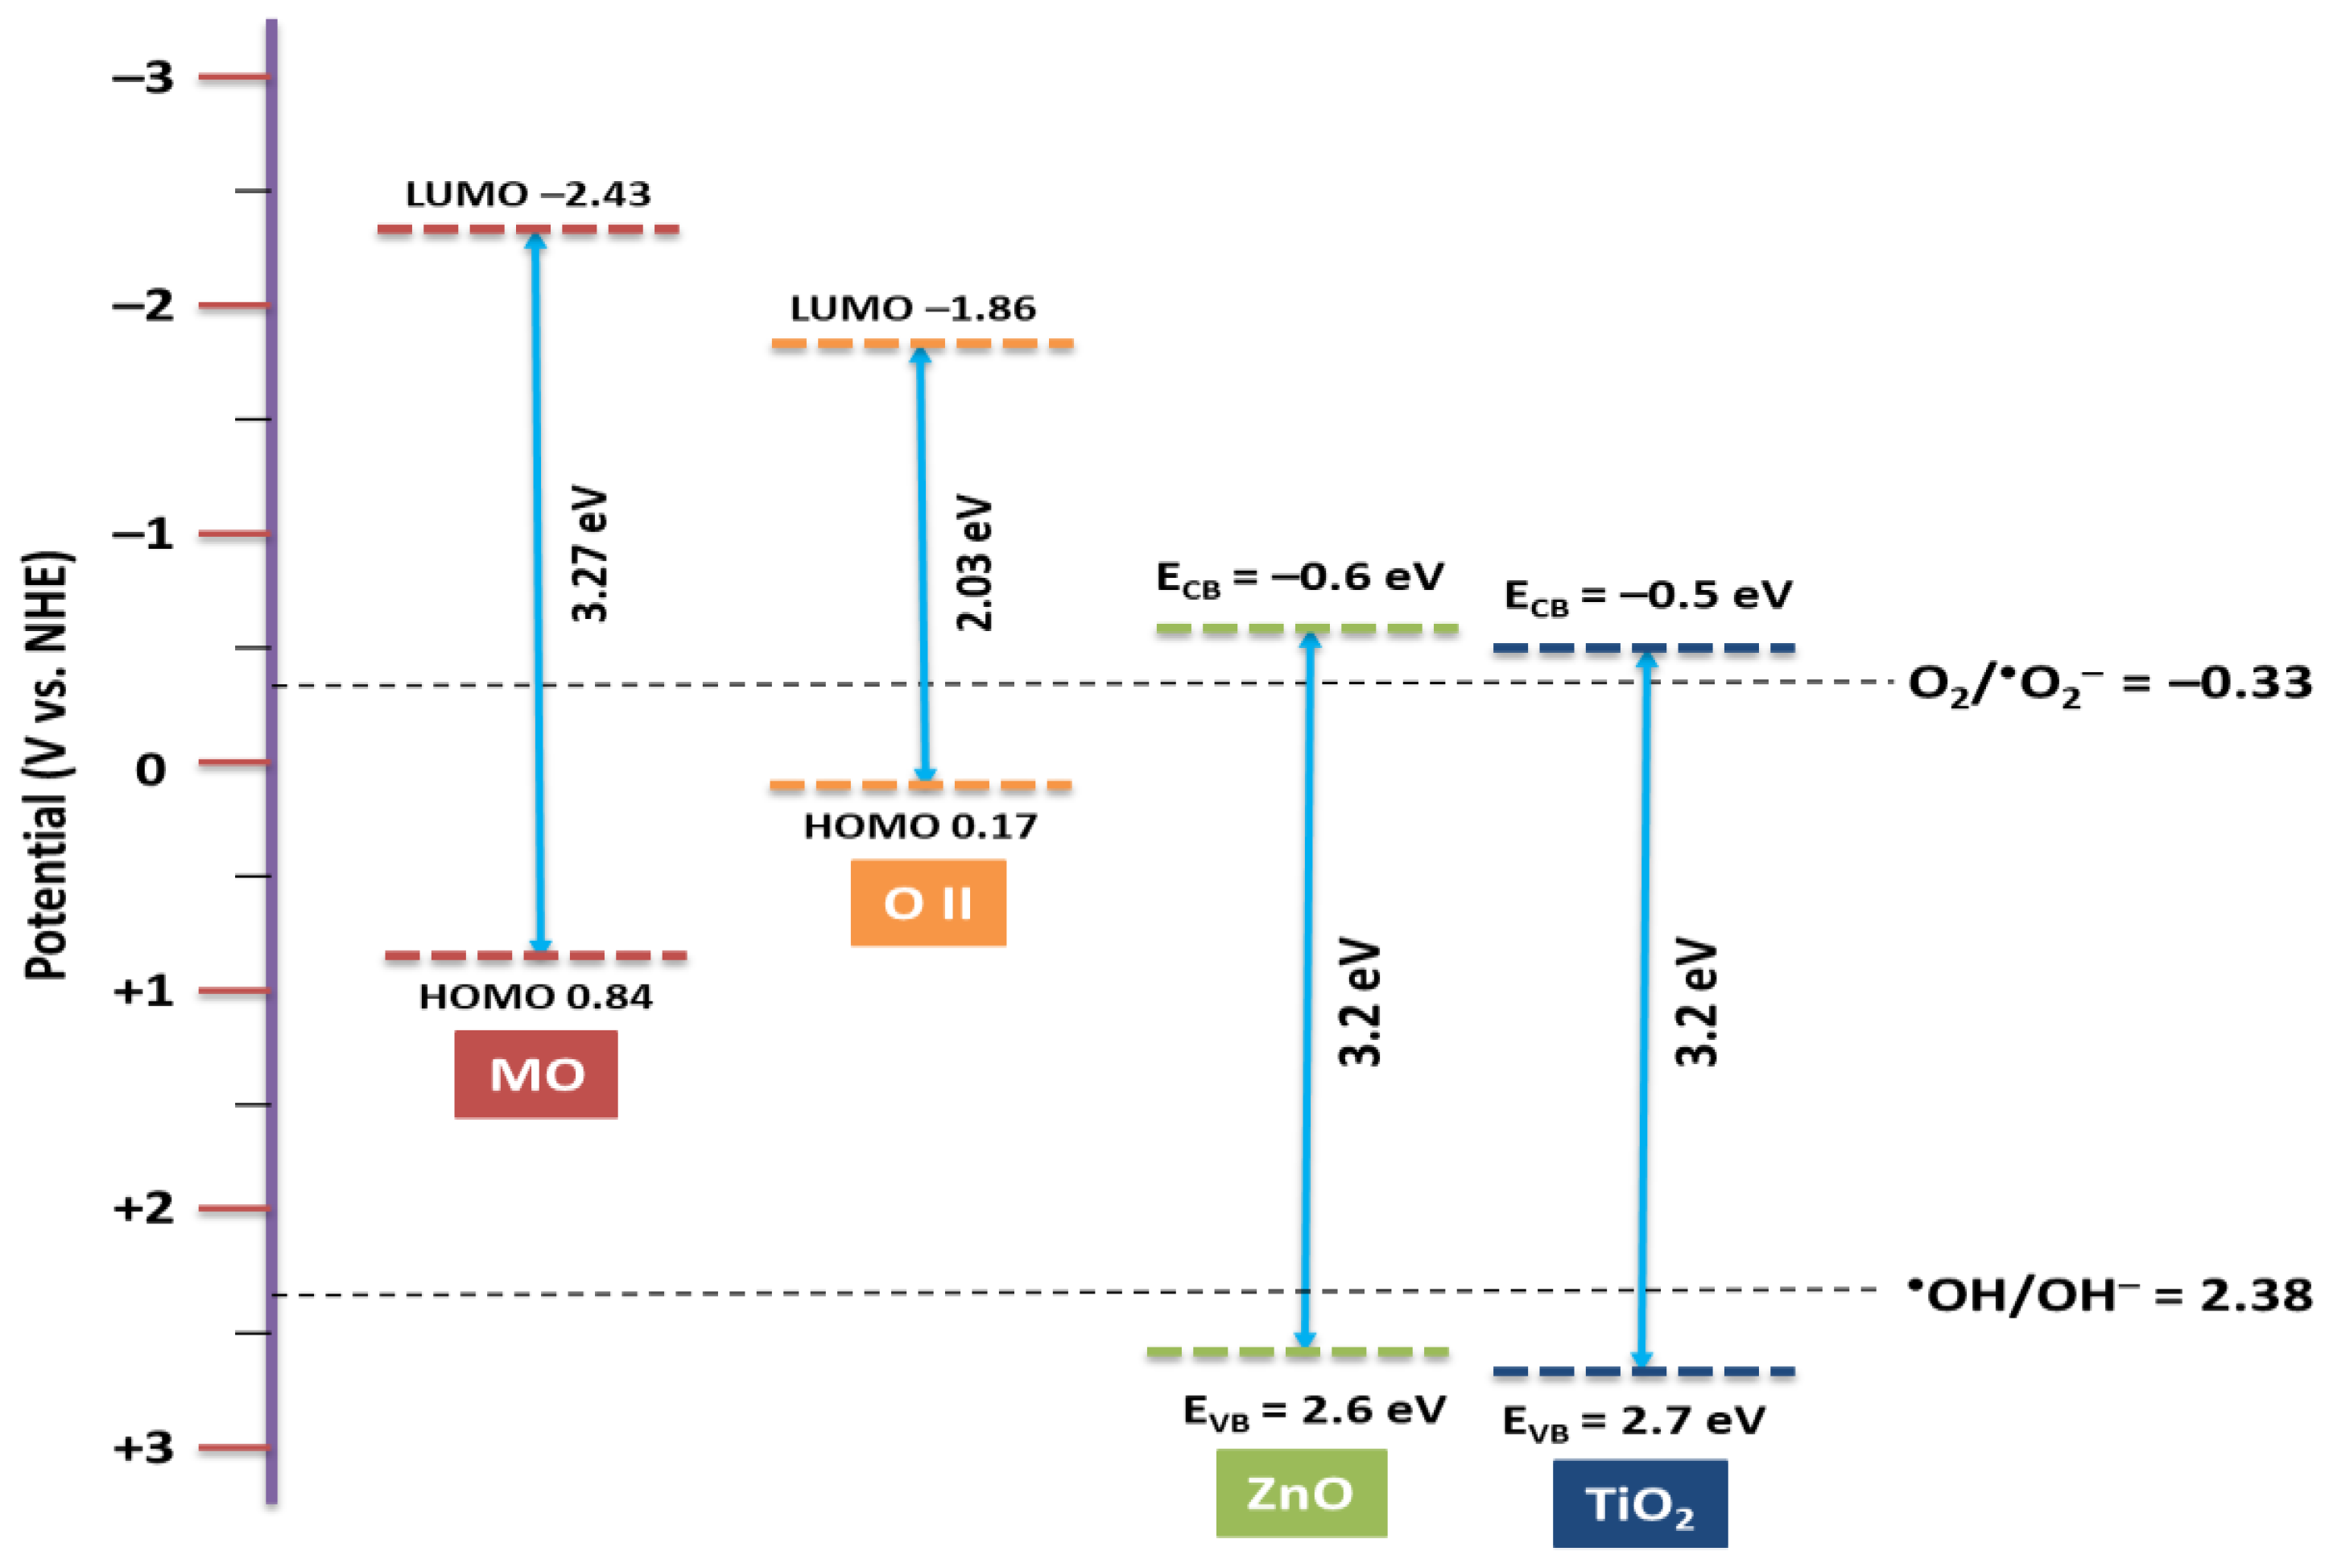
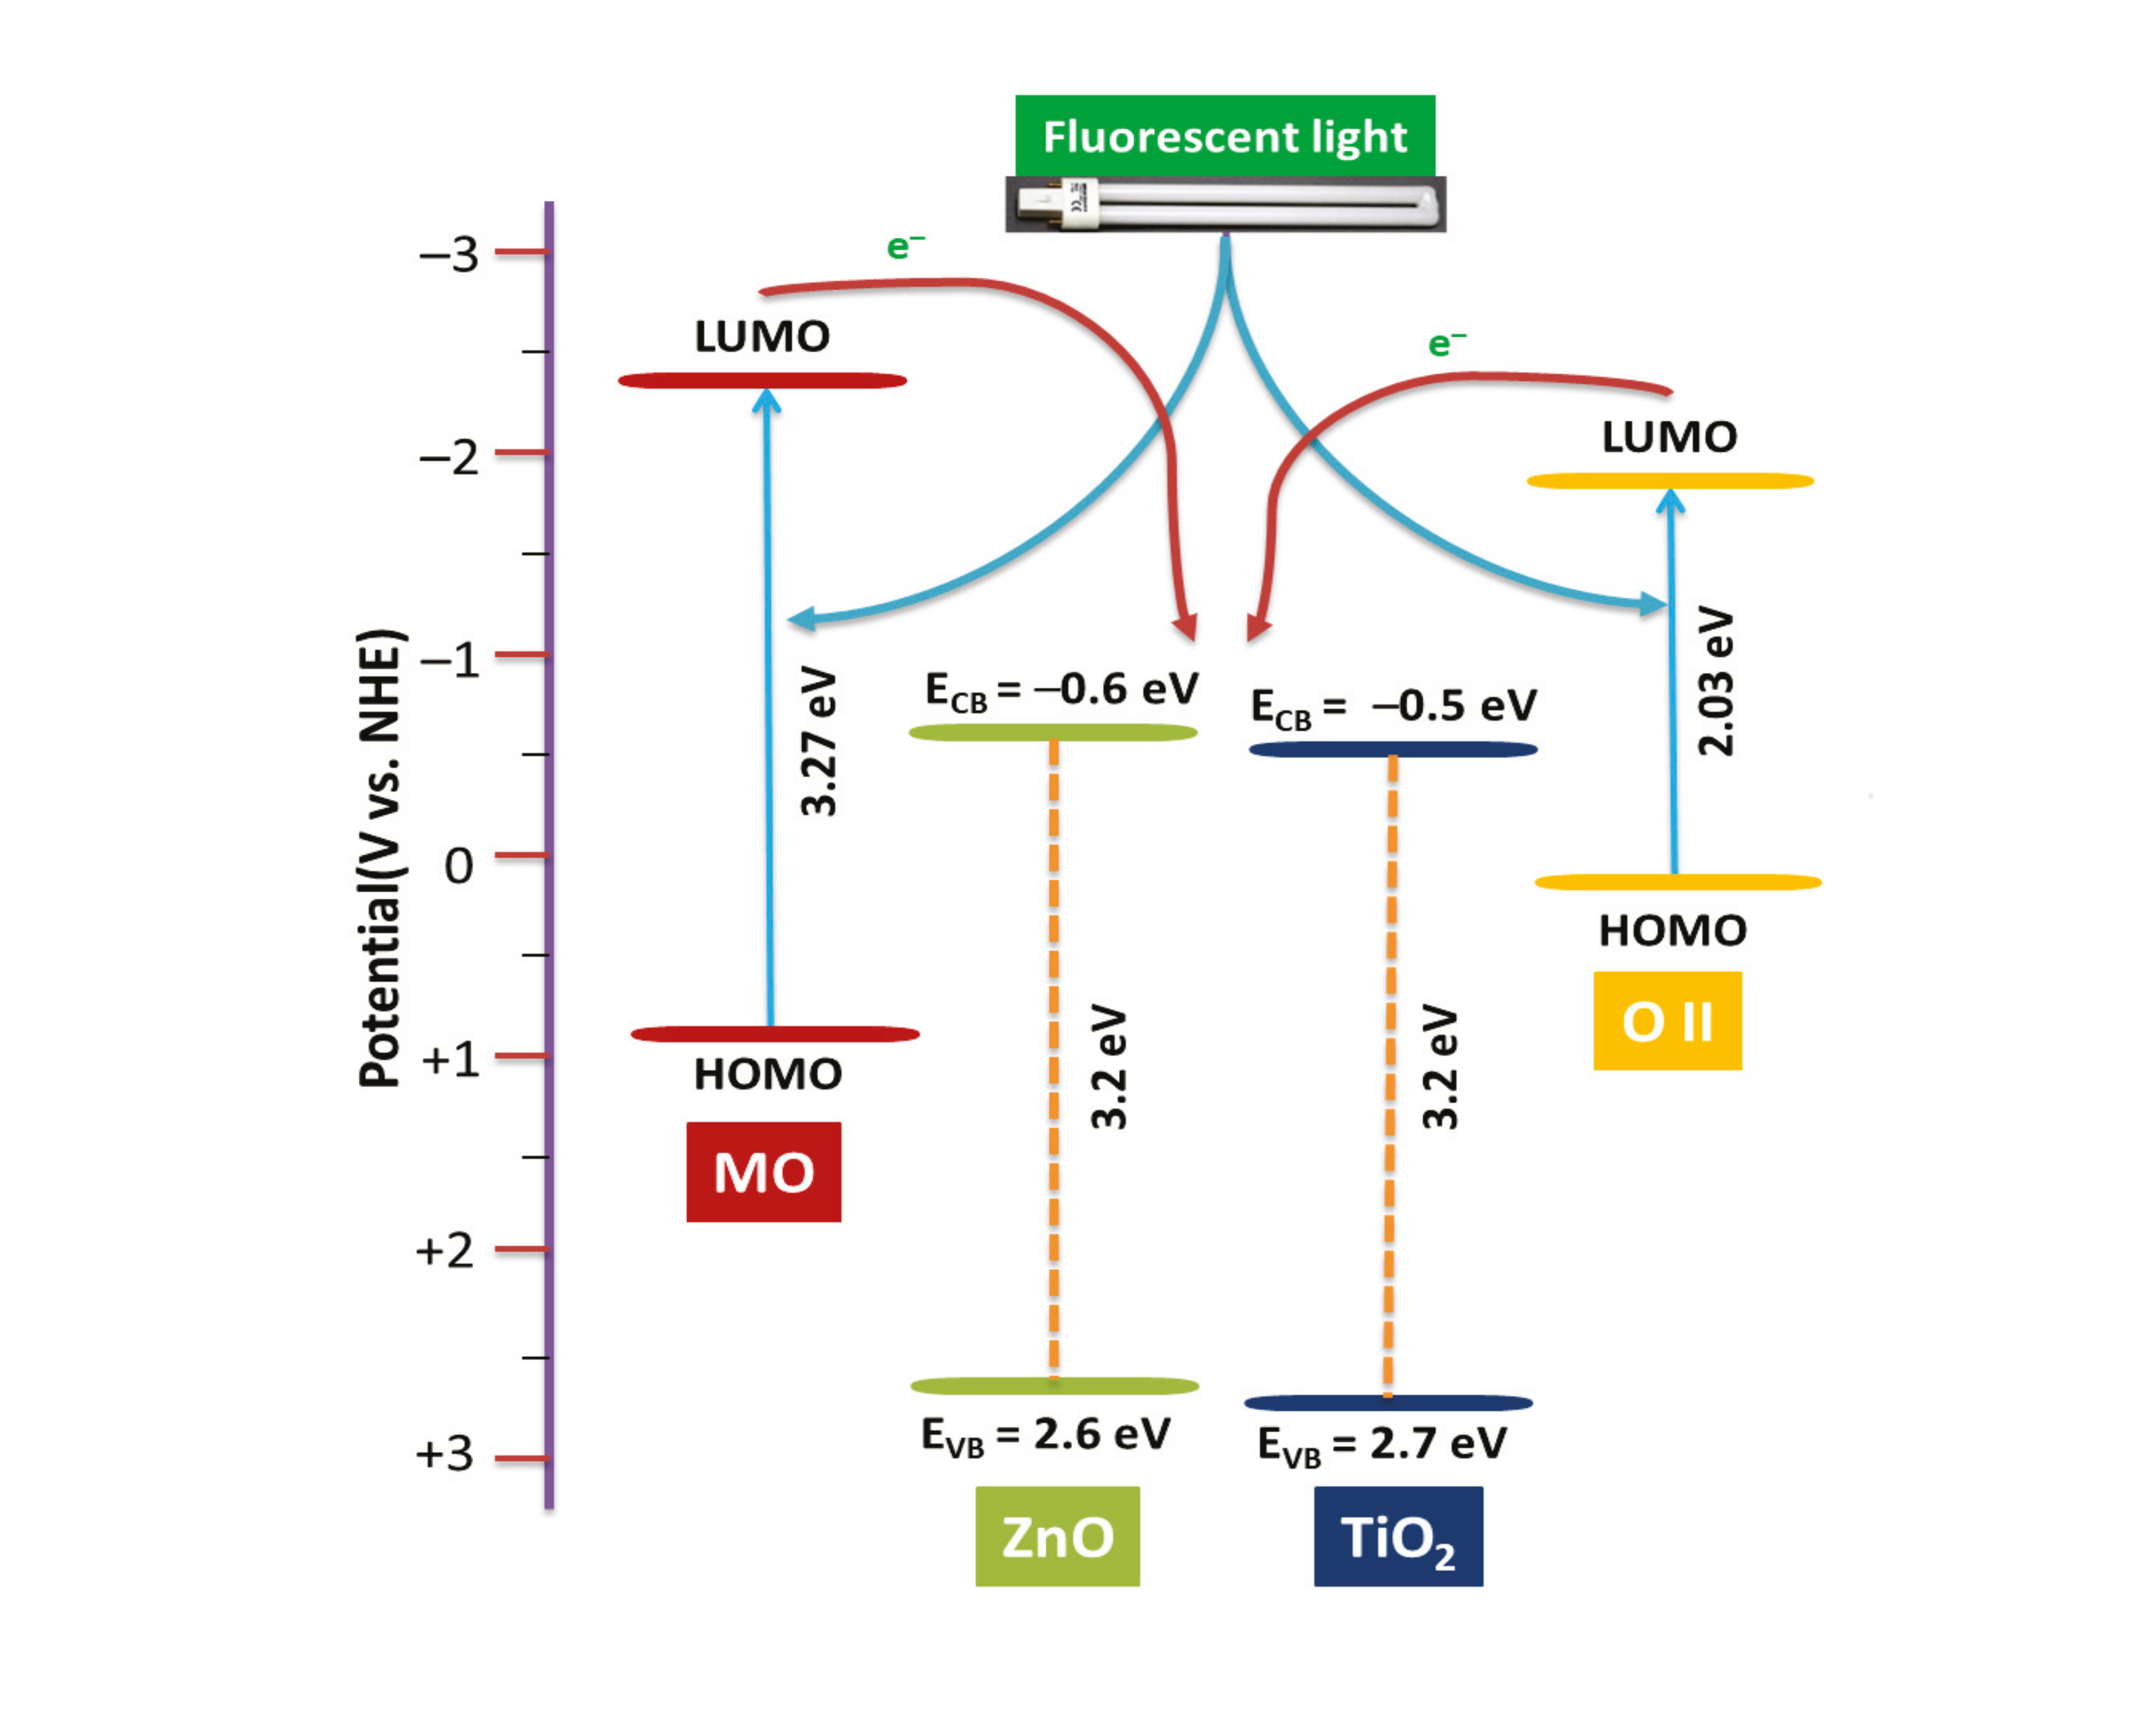
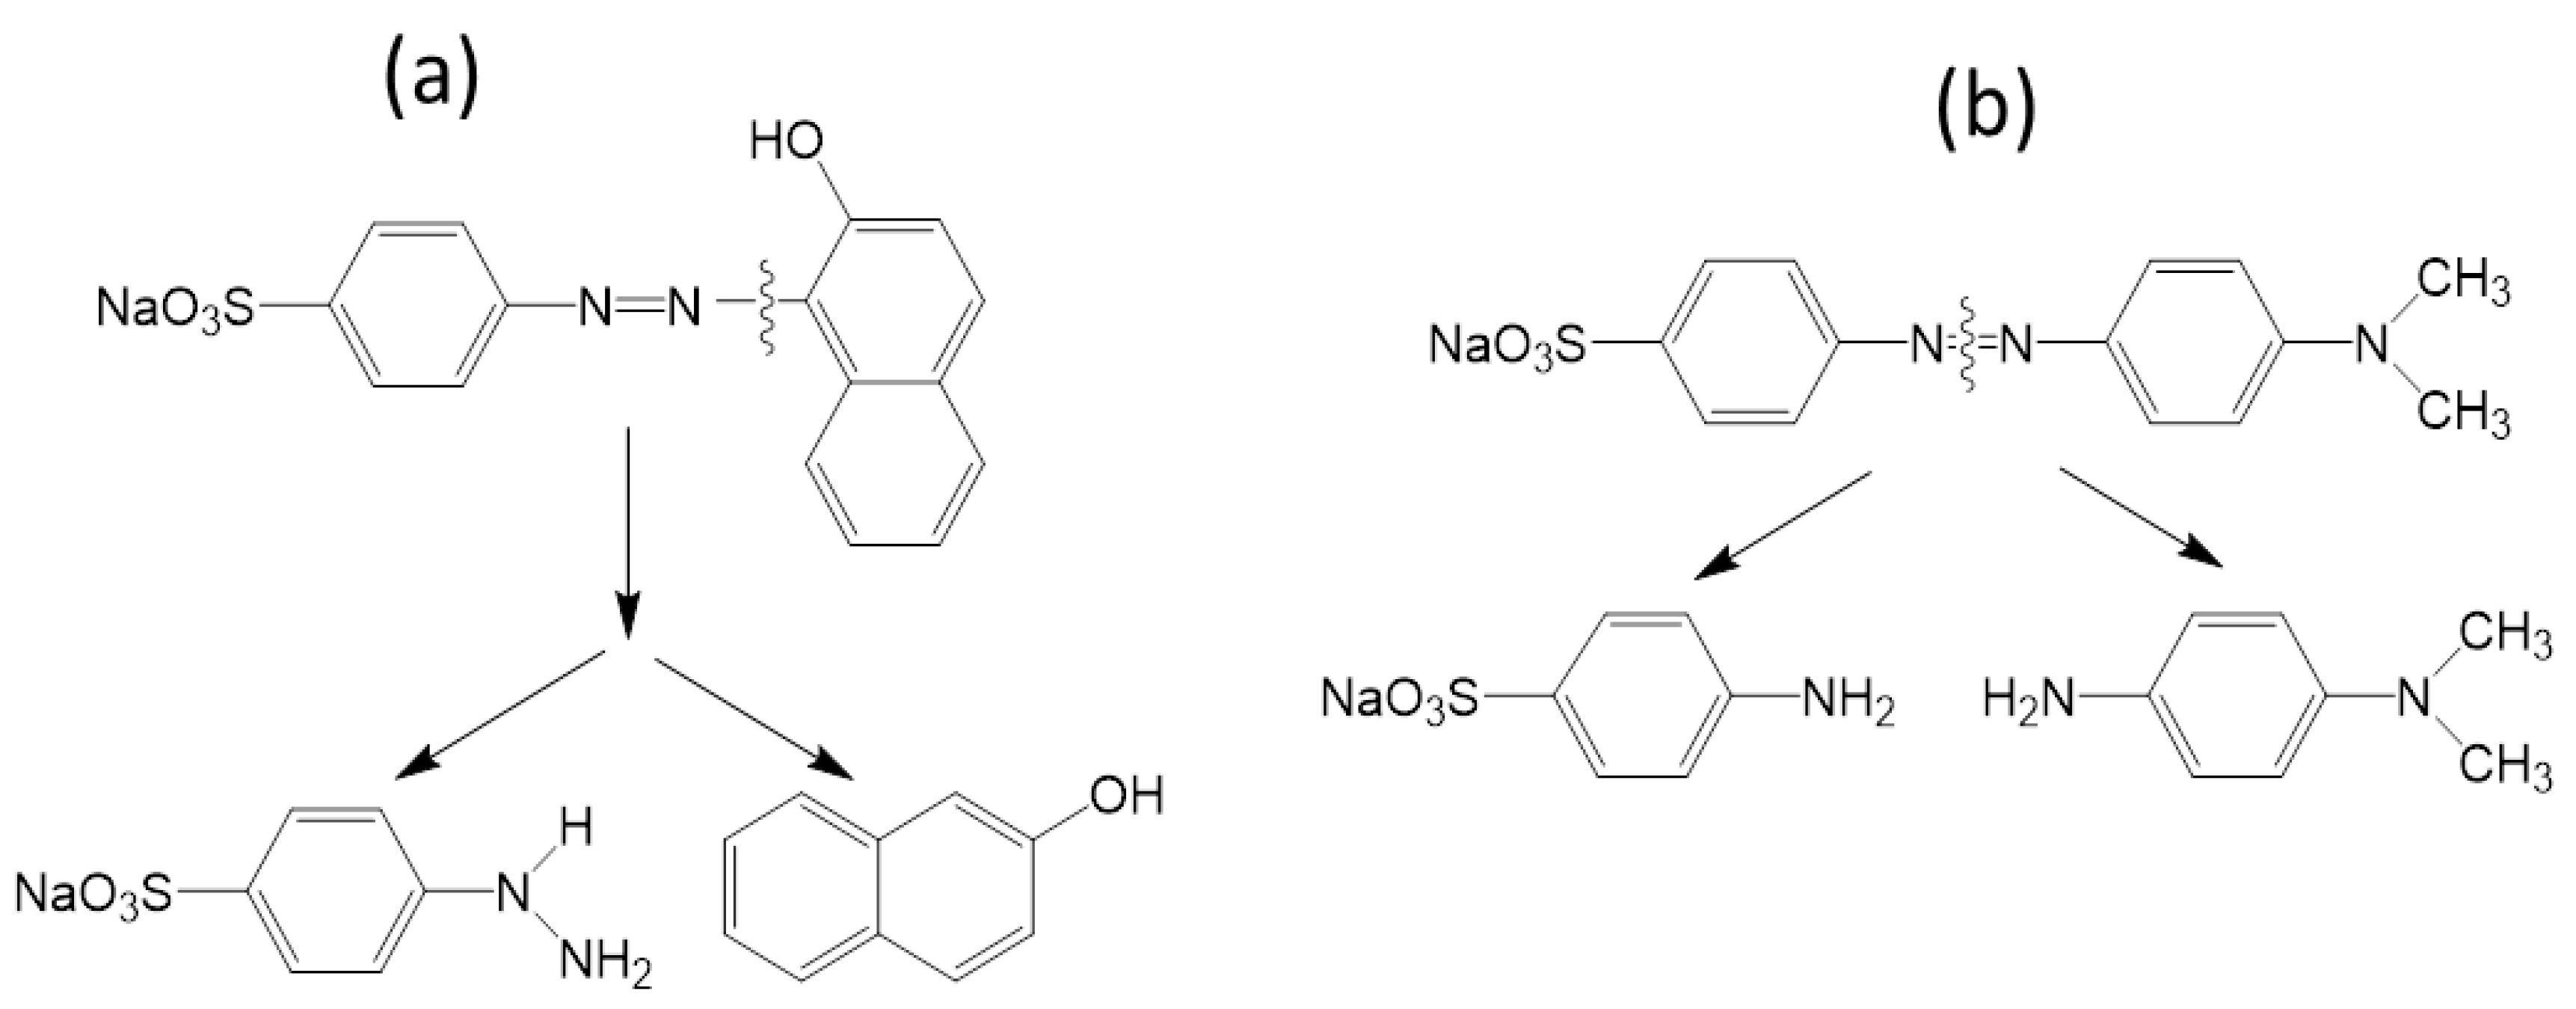
3.5. Proposed Degradation Mechanisms

TiO2 and ZnO cannot absorb visible light energy directly due to the band gap 3.2 eV (Supplementary Data Figures S3 and S4) [16]. On the contrary, when a colored organic compound is present, a sensitized photocatalytic process is possible. Huang et al. investigated dye sensitized photodegradation which follows the radical mechanism [17]. Molla et al. recently evaluated the reaction mechanism of photocatalytic degradation of dye with self-sensitized TiO2 under visible light [18]. Park et al. also mentioned that the dye-sensitization can be applied for the self-degradation of dyes. In dye-sensitization, a dye absorbing visible light excites an electron from the HOMO (highest occupied molecular orbital) of a dye to the LUMO (lowest unoccupied molecular orbital) [19]. The HOMO and LUMO levels and band gap energy of OII and MO were obtained from literature and the values are presented in Table 3.
Figure 7 demonstrates the valence band (VB) and conduction band (CB) levels and the energy gaps of catalyst vs. NHE reference electrodes. It is observed that the LUMO levels of OII and MO are more negative relative to the conduction band edge potential of TiO2 and ZnO. Otherwise, due to the more negative potential of the lowest unoccupied molecular orbital (LUMO) level for dye relative to the conduction band (CB) of the catalyst [22], the electron transfer from the LUMO of dyes to the CB of the catalyst is feasible. It is reported that the redox potential of O2/O2 is −0.33 V vs. NHE [23], which is more positive than conduction band potential of TiO2 and ZnO (−0.5 V vs. NHE) [24,25].
The surface adsorbed dyes were excited by absorbing visible light (fluorescent) and donated their electrons to the conduction band of the catalyst. As a result, the dyes are converted to a cationic radical (dye+•), and O2 radical specie were easily formed by the adsorbed oxygen through capturing electrons from the conduction band of the catalyst. The O2 can react with surface adsorbed H2O to form H2O2 which is ultimately converted to OH [26,27]. The surface adsorbed OII and MO radical cation or surface adsorbed dyes can undergo degradation by O2 and OH. As soon as a dye molecule degrades, another dye molecule will be adsorbed on TiO2 and ZnO surface and the photocatalytic cycle continues. The peak corresponding to the azo group of dye (OII and MO) decreased after 360 min of irradiation (Figure 1a,b and Figure 2a,b). This may be attributed to the fact that azo bonds are more reactive than the aromatic part of the molecule. They are easily oxidized by the photogenerated OH radicals. The cleavage of the azo (–N=N–) bond leads to decolorization of dyes [28]. According to the previous studies, a possible decolorization pathway of OII [29] and MO [30] was proposed in Figure 8.

4. Conclusions

Consequently, the photocatalytic activity of self-dye-sensitized TiO2 and ZnO in the degradation of OII and MO was studied under fluorescent light irradiation. The percentage of degradation of OII and MO increased with an increase in irradiation time under fluorescent light for TiO2 and ZnO catalyst. The photocatalytic activity of ZnO nanoparticles was better than that of TiO2 for MO, and of ZnO and TiO2 showed the same activity for OII photodegradation under fluorescent light. The kinetics of OII and MO photodegradation followed the pseudo-first order rate law, and could be described in terms of the Langmuir–Hinshelwood model. The photocatalytic degradation of waste dye in water with self-dye-sensitized TiO2 and ZnO under fluorescent light irradiation will become a promising technique.

Supplementary Materials

The following are available online at www.mdpi.com/2305-7084/1/2/8/s1. Figure S1: XRD patterns of P25 TiO2; Figure S2: XRD patterns of ZnO; Figure S3: UV-Vis DRS patterns of TiO2. Inset figure: Tauc plot of [F(R)]0.5 versus photon energy; Figure S4: UV-Vis DRS patterns of ZnO. Inset figure: Tauc plot of [F(R)]2 versus photon energy; Figure S5: Reactor for photocatalytic degradation of dye; Figure S6: UV-visible spectra of aqueous solutions of (a) OII and (b) MO before and after treatment under fluorescent light and 450 nm LED light.

Acknowledgments

The present research was partly supported by Grant-in-Aid for Scientific Research (C) 15K00602 from the Ministry of Education, Culture, Sports, Science, and Technology of Japan. All experiments were conducted at Mie University. Any opinions, findings, conclusions, or recommendations expressed in this paper are those of the authors and do not necessarily reflect the view of the supporting organizations.

Author Contributions

Md. Ashraful Islam Molla and Satoshi Kaneco conceived and designed the experiments. Md. Ashraful Islam Molla performed the experiments and wrote the paper. Ikki Tateishi, Mai Furukawa, Hideyuki Katsumata, and Tohru Suzuki analyzed the results and advised the project.

Conflicts of Interest

The authors declare no conflict of interest.

References

  1. Ong, W.J.; Tan, L.L.; Chai, S.P.; Yong, S.T.; Mohamed, A.R. Highly reactive {001} facets of TiO2-based composites: Synthesis, formation mechanism and characterization. Nanoscale 2014, 6, 1946–2008. [Google Scholar] [CrossRef] [PubMed]
  2. Zhang, Q.; Dandeneau, C.S.; Zhou, X.; Cao, G. ZnO nanostructures for dye sensitized solar cells. Adv. Mater. 2009, 21, 4087–4108. [Google Scholar] [CrossRef]
  3. Ni, M.; Leung, M.K.H.; Leung, D.Y.C.; Sumathy, K. A review and recent developments in photocatalytic water-splitting using TiO2 for hydrogen production. Renew. Sustain. Energy Rev. 2007, 11, 401–425. [Google Scholar] [CrossRef]
  4. Di Mauroa, A.; Cantarella, M.; Nicotra, G.; Privitera, V.; Impellizzeri, G. Low temperature atomic layer deposition of ZnO: Applications in photocatalysis. Appl. Catal. B Environ. 2016, 196, 68–76. [Google Scholar] [CrossRef]
  5. Impellizzeri, G.; Scuderi, V.; Romano, L.; Napolitani, E.; Sanz, R.; Carles, R.; Privitera, V. C ion–implanted TiO2 thin film for photocatalytic applications. J. Appl. Phys. 2015, 117, 105308. [Google Scholar] [CrossRef]
  6. Kim, W.; Tachikawa, T.; Majima, T.; Choi, W. Photocatalysis of dye–sensitized TiO2 nanoparticles with thin overcoat of Al2O3: Enhanced activity for H2 production and dechlorination of CCl4. J. Phys. Chem. C 2009, 113, 10603–10609. [Google Scholar] [CrossRef]
  7. Duncan, W.R.; Prezhdo, O.V. Theoretical studies of photoinduced electron transfer in dye-sensitized TiO2. Annu. Rev. Phys. Chem. 2007, 58, 143–184. [Google Scholar] [CrossRef] [PubMed]
  8. Wu, T.; Liu, G.; Zhao, J.; Hidaka, H.; Serpone, N. Photoassisted degradation of dye pollutants. V. Self-photosensitized oxidative transformation of rhodamine B under visible light irradiation in aqueous TiO2 dispersions. J. Phys. Chem. B 1998, 102, 5845–5851. [Google Scholar]
  9. Vinodgopal, D.; Kamat, P.V. Enhanced rates of photocatalytic degradation of an azo-dye using SnO2/TiO2 coupled semiconductor thin-films. Environ. Sci. Technol. 1995, 29, 841–845. [Google Scholar] [CrossRef] [PubMed]
  10. Xing, G.; Tang, C.; Zhang, B.; Zhao, L.; Su, Y.; Wang, X. A highly uniform ZnO/NaTaO3 nanocomposite: Enhanced self-sensitized degradation of colored pollutants under visible light. J. Alloy Compd. 2015, 647, 287–294. [Google Scholar] [CrossRef]
  11. Saikia, L.; Bhuyan, D.; Saikia, M.; Malakar, B.; Dutta, D.K.; Sengupta, P. Photocatalytic performance of ZnO nanomaterials for self-sensitized degradation of malachite green dye under solar light. Appl. Catal. A Gen. 2015, 490, 42–49. [Google Scholar] [CrossRef]
  12. Selvam, K.; Swaminathan, M. Photocatalytic synthesis of 2-methylquinolines with TiO2 Wackherr and Home Prepared TiO2-A comparative study. Arab. J. Chem. 2017, 10, S28–S34. [Google Scholar] [CrossRef]
  13. Liang, Y.; Guo, N.; Li, L.; Li, R.; Ji, G.; Gan, S. Fabrication of porous 3D flower-like Ag/ZnO heterostructure composites with enhanced photocatalytic performance. Appl. Surf. Sci. 2015, 332, 32–39. [Google Scholar] [CrossRef]
  14. Zhang, T.; Oyama, T.; Aoshima, A.; Hidaka, H.; Zhao, J. Serpone, hotooxidative N-demethylation of methylene blue in aqueous TiO2 dispersions under UV irradiation. J. Photochem. Photobiol. A Chem. 2001, 140, 163–172. [Google Scholar] [CrossRef]
  15. Turchi, C.S.; Ollis, D.F. Photocatalytic degradation of organic water contaminants: Mechanisms involving hydroxyl radical attack. J. Catal. 1990, 122, 178–192. [Google Scholar] [CrossRef]
  16. Lee, K.M.; Lai, C.W.; Ngai, K.S.; Juan, J.C. Recent developments of zinc oxide based photocatalyst in water treatment technology: A review. Water Res. 2016, 88, 428–448. [Google Scholar] [CrossRef] [PubMed]
  17. Huang, S.T.; Jiang, Y.R.; Chou, S.Y.; Dai, Y.M.; Chen, C.C. Synthesis, characterization, photocatalytic activity of visible-light-responsive photocatalysts BiOxCly/BiOmBrn by controlled hydrothermal method. J. Mol. Catal. A Chem. 2014, 391, 105–120. [Google Scholar] [CrossRef]
  18. Molla, M.A.I.; Tateishi, I.; Furukawa, M.; Katsumata, H.; Suzuki, T.; Kaneco, S. Evaluation of reaction mechanism for photocatalytic degradation of dye with self-sensitized TiO2 under visible light irradiation. Open J. Inorg. Non Met. Mater. 2017, 7, 1–7. [Google Scholar]
  19. Park, H.; Park, Y.; Kim, W.; Choi, W. Surface modification of TiO2 photocatalyst for environmental applications. J. Photochem. Photobiol. C Photochem. Rev. 2013, 15, 1–20. [Google Scholar] [CrossRef]
  20. Bessekhouad, Y.; Brahimi, R.; Hamdini, F.; Trari, M. Cu2S/TiO2 heterojunction applied to visible light Orange II degradation. J. Photochem. Photobiol. A Chem. 2012, 248, 15–23. [Google Scholar] [CrossRef]
  21. Prakash, O.; Kumar, S.; Singh, P.; Deckert, V.; Chatterjee, S.; Ghosh, A.K.; Singh, R.K. Surface-enhanced Raman scattering characteristics of CuO:Mn/Ag heterojunction probed by methyl orange: Effect of Mn2+ doping. J. Raman Spectrosc. 2016, 47, 813–818. [Google Scholar] [CrossRef]
  22. Pan, L.; Zou, J.; Liu, X.; Liu, X.; Wang, S.; Zhang, X.; Wang, L. Visible-light-induced photodegradation of rhodamine B over hierarchical TiO2: Effects of storage period and water-mediated adsorption switch. Ind. Eng. Chem. Res. 2012, 51, 12782–12786. [Google Scholar] [CrossRef]
  23. Su, Y.; Peng, L.; Guo, J.; Huang, S.; Lv, L.; Wang, X. Tunable optical and photocatalytic performance promoted by nonstoichiometric control and site-selective codoping of trivalent ions in NaTaO3. J. Phys. Chem. C 2014, 118, 10728–10739. [Google Scholar] [CrossRef]
  24. Fujishima, A.; Tao, T.N.; Tryk, D.A. Titanium dioxide photocatalysis. J. Photochem. Photobiol. C Photochem. Rev. 2000, 1, 1–21. [Google Scholar] [CrossRef]
  25. Maa, J.; Wang, K.; Li, L.; Zhang, T.; Kong, Y.; Komarnenib, S. Visible-light photocatalytic decolorization of Orange II on Cu2O/ZnO nanocomposites. Ceram. Int. 2015, 41, 2050–2056. [Google Scholar] [CrossRef]
  26. Vinodgopal, K.; Bedja, I.; Kamat, P.V. Nanostructured semiconductor films for photocatalysis. Photoelectrochemical behavior of SnO2/TiO2 composite systems and its role in photocatalytic degradation of a textile azo dye. Chem. Mater. 1996, 8, 2180–2187. [Google Scholar] [CrossRef]
  27. Iliev, V. Phthalocyanine-modified titania-catalyst for photooxidation of phenols by irradiation with visible light. J. Photochem. Photobiol. A Chem. 2002, 151, 195–199. [Google Scholar] [CrossRef]
  28. Turkten, N.; Cinar, Z. Photocatalytic decolorization of azo dyes on TiO2: Prediction of mechanism via conceptual DFT. Catal. Today 2017, 287, 169–175. [Google Scholar] [CrossRef]
  29. Konstantinou, I.K.; Albanis, T.A. TiO2-assisted photocatalytic degradation of azo dyes in aqueous solution: Kinetic and mechanistic investigations. A review. Appl. Catal. B Environ. 2004, 49, 1–14. [Google Scholar] [CrossRef]
  30. Xie, S.; Huang, P.; Kruzic, J.J.; Zeng, X.; Qian, H. A highly efficient degradation mechanism of methyl orange using Fe-based metallic glass powders. Sci. Rep. 2016, 6. [Google Scholar] [CrossRef] [PubMed]
Figure 1. UV–visible spectra of aqueous solutions of OII for 0 min and 360 min using (a) TiO2 and (b) ZnO under fluorescent and 450 nm LED lights.
Chemengineering 01 00008 g001
Figure 2. UV–visible spectra of aqueous solutions of MO for 0 min and 360 min using (a) TiO2 and (b) ZnO under fluorescent and LED lights.
Chemengineering 01 00008 g002
Figure 3. Time courses of concentration of orange II (a) and methyl orange (b). Photolysis: , TiO2 dispersions: under dark , under fluorescent light irradiation and under LED light irradiation .
Chemengineering 01 00008 g003
Figure 4. Time courses of concentration of orange II (a) and methyl orange (b). Photolysis: , ZnO dispersions: under dark , under fluorescent light irradiation and under LED light irradiation .
Chemengineering 01 00008 g004
Figure 5. Kinetic plot of Ln(C/C0) versus irradiation time for the photocatalytic degradation of orange II. (a) TiO2, (b) ZnO.
Chemengineering 01 00008 g005
Figure 6. Kinetic plot of Ln(C/C0) versus irradiation time for the photocatalytic degradation of methyl orange. (a) TiO2, (b) ZnO.
Chemengineering 01 00008 g006
Figure 7. Schematic energy level diagram of TiO2 and ZnO with respect to potential of O2/O2 and OH/OH and the HOMO–LUMO levels of dye.
Chemengineering 01 00008 g007
Figure 8. Proposed decolorization mechanism of OII (a) and MO (b) under visible light.
Chemengineering 01 00008 g008
Table 1. Experimental conditions.
SamplesOrange II (5 mg/L,30 mL)
Methyl orange (5 mg/L, 30 mL)
PhotocatalystP25 TiO2 (20 mg)
Aldrich ZnO (20 mg)
TemperatureRoom temperature (25 °C)
pH6
Light source450 nm LED light (5.14 mW/cm2)
Fluorescent light (0.034 mW/cm2)
λmaxOrange II (485 nm), methyl orange (464 nm)
Irradiation time6 h
Table 2. Rate constants, R2, and half-life values of OII and MO dyes using TiO2 and ZnO.
Light SourceCatalystskobs (min−1)R2t1/2 (min)
OIIMOOIIMOOIIMO
Fluorescent lightTiO20.00190.000670.800.973671029
ZnO0.00190.000830.930.96346866
LED lightTiO20.00550.00130.970.98125525
ZnO0.00130.000230.880.885333465
Table 3. HOMO and LUMO levels and energy gaps (eV) of dye molecules and λmax (nm).
MoleculesHOMOLUMOEnergy GapsλmaxReference
OII0.17−1.862.03485[20]
MO0.84−2.433.27464[21]

