Article

Experimental and CFD Studies of the Hydrodynamics in Wet Agglomeration Process

1
Department of Process Engineering, Stellenbosch University, Banghoek & Bosman Road, Stellenbosch 7600, South Africa
2
Department of Chemistry and Chemical Engineering, Chalmers University of Technology, 41296 Gothenburg, Sweden
*
Author to whom correspondence should be addressed.
ChemEngineering 2018, 2(3), 32; https://doi.org/10.3390/chemengineering2030032
Submission received: 28 May 2018 / Revised: 2 July 2018 / Accepted: 10 July 2018 / Published: 19 July 2018

Abstract

:
In this study, an experimentally validated computational model was developed to investigate the hydrodynamics in a rotor-stator vortex agglomeration reactor RVR having a rotating disc at the centre with two shrouded outer plates. A numerical simulation was performed using a simplified form of the reactor geometry to compute the 3-D flow field in batch mode operations. Thereafter, the model was validated using data from a 2-D Particle Image Velocimetry (PIV) flow analysis performed during the design of the reactor. Using different operating speeds, namely 70, 90, 110, and 130 rpm, the flow fields were computed numerically, followed by a comprehensive data analysis. The simulation results showed separated boundary layers on the rotating disc and the stator. The flow field within the reactor was characterized by a rotational plane circular forced vortex flow, in which the streamlines are concentric circles with a rotational vortex. Overall, the results of the numerical simulation demonstrated a fairly good agreement between the Computational Fluid Dynamics (CFD) model and the experimental data, as well as the available theoretical predictions. The swirl ratio β was found to be approximately 0.4044, 0.4038, 0.4044, and 0.4043 for the operating speeds of N = 70, 90, 110, and 130 rpm, respectively. In terms of the spatial distribution, the turbulence intensity and kinetic energy were concentrated on the outer region of the reactor, while the circumferential velocity showed a decreasing intensity towards the shroud. However, a comparison of the CFD and experimental predictions of the tangential velocity and the vorticity amplitude profiles showed that these parameters were under-predicted by the experimental analysis, which could be attributed to some of the experimental limitations rather than the robustness of the CFD model or numerical code.

1. Introduction

The removal of particulate solids from liquid process effluent is of great importance in environmental quality management. However, when the sizes of solid particles diminish and reach micron and submicron range, the particles tend to remain in suspension and cannot be removed by gravity settling [1,2]. In order to achieve an acceptable solid-liquid separation at a reasonable cost, the particles need to be agglomerated by flocculation, followed by a mechanical phase separation—sedimentation, floatation, filtration, etc. The agglomeration of suspended particles to form larger and settleable flocs form the basis of the upstream and downstream operations of many process industries, such as mining, water and wastewater treatment, as well as pulp and paper processing.
Mixing plays an important role in the agglomeration of fine particles in suspension, either in engineered or natural systems, and the choice of a particular stirrer-vessel configuration strongly influences the flow pattern in the treatment unit. Flow in the wheelspace or cavity between a stationary and rotating disc (rotor-stator system) is of great importance in many engineering applications, such as in mixing applications for food, chemical and pharmaceutical industries, and in the turbine and compressor blades for the aeronautical industry [3,4,5,6]. Flows of this nature have been the subject of many scientific investigations, both theoretically and experimentally [7,8]. Theoretical analysis of the nature of flow in rotor-stator systems resulted in the so called Batchelor-Stewartson controversy regarding the exact nature of the flow profile in the wheelspace between the rotor and the stator. It is now generally accepted that both models are valid, with Batchelor’s model giving a more accurate description of the flow in an enclosed or shrouded rotor-stator system that consists of separated boundary layers on the rotor and the stator and an inviscid rotating core in between the boundary layers [9,10].
The use of Computational Fluid Dynamics (CFD) for the investigation of complex fluid-particle interactions in many engineering designs of fluid flow applications has been steadily growing in popularity, both in academia and the industry over the past few decades [11,12]. Nowadays, numerical simulations complement the experimental and analytical techniques, and are increasingly being performed on a much bigger scale in many fluid engineering applications ranging from chemical and mineral processing to civil and environmental process engineering [11]. In any design-based CFD modelling, the main focus is to assess the hydrodynamics of the system and to determine the flow pattern, hydrodynamic profile velocity, vorticity, kinetic energy, dissipation rates, turbulence intensity, dead zones, and black spots, among other properties, which in turn, will help in improving and optimizing the engineering design and overall performance of the reactor [13,14]. In many technical applications of engineering design techniques to complex fluid flow problems, an understanding of the interacting physical, biological, and chemical processes within the reactor system is highly indispensable. This is particularly interesting as CFD offers a flexible and sophisticated platform for engineers and scientists in the investigation of complex engineering design problems. A quick survey of the literature in this field shows that many innovative fluid-particle multiphase reactors have been successfully designed and tested on different scales for a wide range of engineering applications ranging from particle separation and water purification, such as bacterial inactivation, to biological cell culture preparation [15,16,17,18,19,20,21,22]. For instance, the application of Taylor-vortex or Taylor-Couette flow for a wide range of beneficial physicochemical treatments have been reported with some encouraging results [23].
Buwa et al. [3,4] investigated the performance and optimization of different types of disc impellers as flow inducers in stirred tanks. Their two-part study compared the efficiency of the rotating disc to the conventional propeller as alternative flow inducers in mixing tank applications. A radial grid disc, square grid disc, solid discs, and a propeller were selected for the investigation. Laser Doppler Anemometry (LDA) measurements and the subsequent numerical simulation showed that there was no substantial variation in the axial flow pattern between the radial grid and the square grid disc. However, the flow near the impeller shows a strong dependence on the impeller configuration. The study also reported that the mixing performance of the radial grid disc and that of the propeller was roughly the same. Similarly, Dionysios et al. [19] investigated the application of a rotating disc photocatalytic reactor (RDPR) for the treatment of organic pollutants in water. A subsequent analysis of the mixing and treatment efficiency in terms of the degradation of the organic pollutants showed that the technique offers several benefits when compared to the existing ones, and the mixing regime is quite close to that of the continuous stirred tank reactor (CSTR). However, vital information on the hydrodynamic behavior of the reactor, either experimentally or numerically, was missing from the study. In the case of technical applications of a Batchelor vortex, it is the comprehensive study of a multi-inlet vortex reactor by Liu et al. [24,25] that has advanced research in this field to the greatest extent. Their two-part study reported that the flow structure of the vortex flow in the nanoparticle precipitation reactor consists of a spiral motion in the free-vortex region and a nearly homogeneous mixing in the forced-vortex region.
While there appears to be huge interest in rotor-stator flow among the scientific community from a theoretical perspective, it is very rare to find practical applications of this type of flow, especially in fluid-particle separation, with the exception of Taylor-Couette flow. Therefore, the aim of this study is to investigate the hydrodynamic performance of a rotor-stator vortex RVR agglomeration reactor for fluid-particle separation using a Batchelor flow in a shrouded cavity. A single rotating reference frame (SRF) approach was used to model the disc interaction with the fluid domain coupled with k-ε and Reynolds Stress Model (RSM) turbulence closure models. The validated CFD model is subsequently employed in analyzing the flow pattern and the spatial distribution of the hydrodynamic quantities within the reactor and in understanding the hydrodynamic behavior with respect to the reactor geometry.

2. Materials and Methods

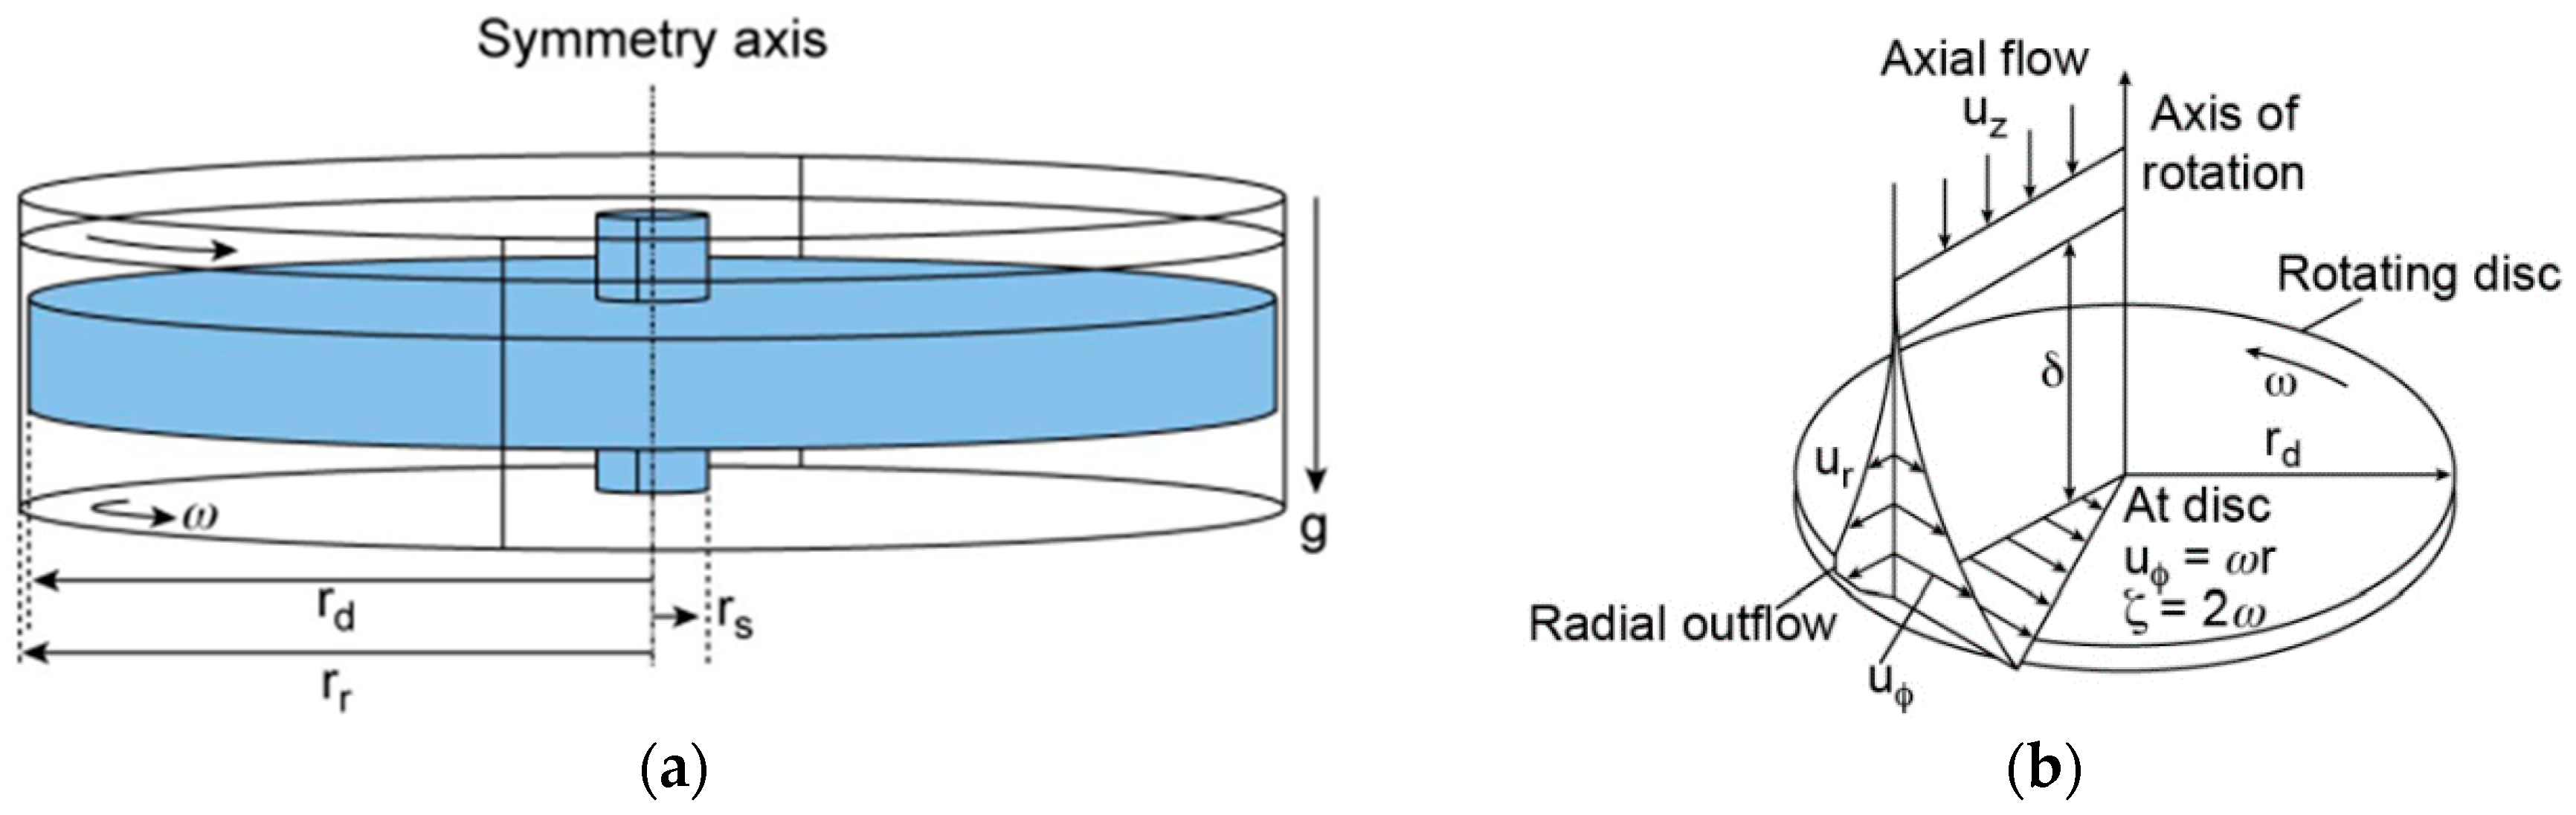
2.1. Description of the RVR Agglomeration Reactor

A patented rotating disc vortex reactor RVR made from perspex was designed for the agglomeration of dispersed fine particles in suspension, as shown schematically in Figure 1a with the design details available elsewhere [26]. It is a cylindrical rotor-stator configuration with a shrouded outer casing. The working slurry is a mixed synthetic kaolin suspension fed into the reactor through an opening at the top. Mixing of the synthetic suspension—kaolin slurry and the flocculating agents (synthetic polyacrylamide PAM—Superfloc® C-492 and N-300) is provided by the spinning disc powered by a rotating shaft. The rotating disc made from Polyvinyl chloride (PVC) generates both radial swirling flow at the immediate vicinity of the disc and an axial pumping flow at some distance away from the disc towards the stator, which eventually drives the agglomerated flocs towards the shroud of the reactor, as shown schematically in Figure 1b. The axial flow away from the rotating disc towards the shroud facilitates the collection of densified agglomerates on either side of the reactor in batch mode operations.

2.2. Theoretical Analysis of the Fluid Flow

The flow in the reactor wheelspace or cavity is characterized by an axis-symmetrical forced-vortex Batchelor flow with separated boundary layers at the rotor and the stator. The velocity profile of the flow on the disc boundary layer is illustrated in Figure 1b with radial, tangential, and axial velocity flow profiles. The circumferential velocity in a forced vortex flow increases radially outwards with the radius attaining a maximum at the tip of the disc (tip velocity), while the vorticity magnitude is nearly constant with its amplitude twice the angular velocity of the rotating disc. The flow in the reactor system on the boundary layers may be characterized by a certain degree of flow instability when it is above the critical Reynolds number Reϕ, critical ≈ 2 × 10⁵ with small patches of turbulence or oscillating vortex disturbance [7,8]. This can be expressed mathematically for the boundary layer near the rotor using the local rotational Reynolds number Reϕ, local (Equation (1)). The gap ratio G of the reactor is defined as the ratio of the wheelspace width to the outer disc radius, and is approximately 0.2206 for this reactor system (Equation (2)). The theoretical hydrodynamic characteristic values are given in Table 1.
Re ϕ ,   local   =   ( r r d 2 ) ρ ω r 2 μ =   ρ ω r 2 μ  
G   =   s r

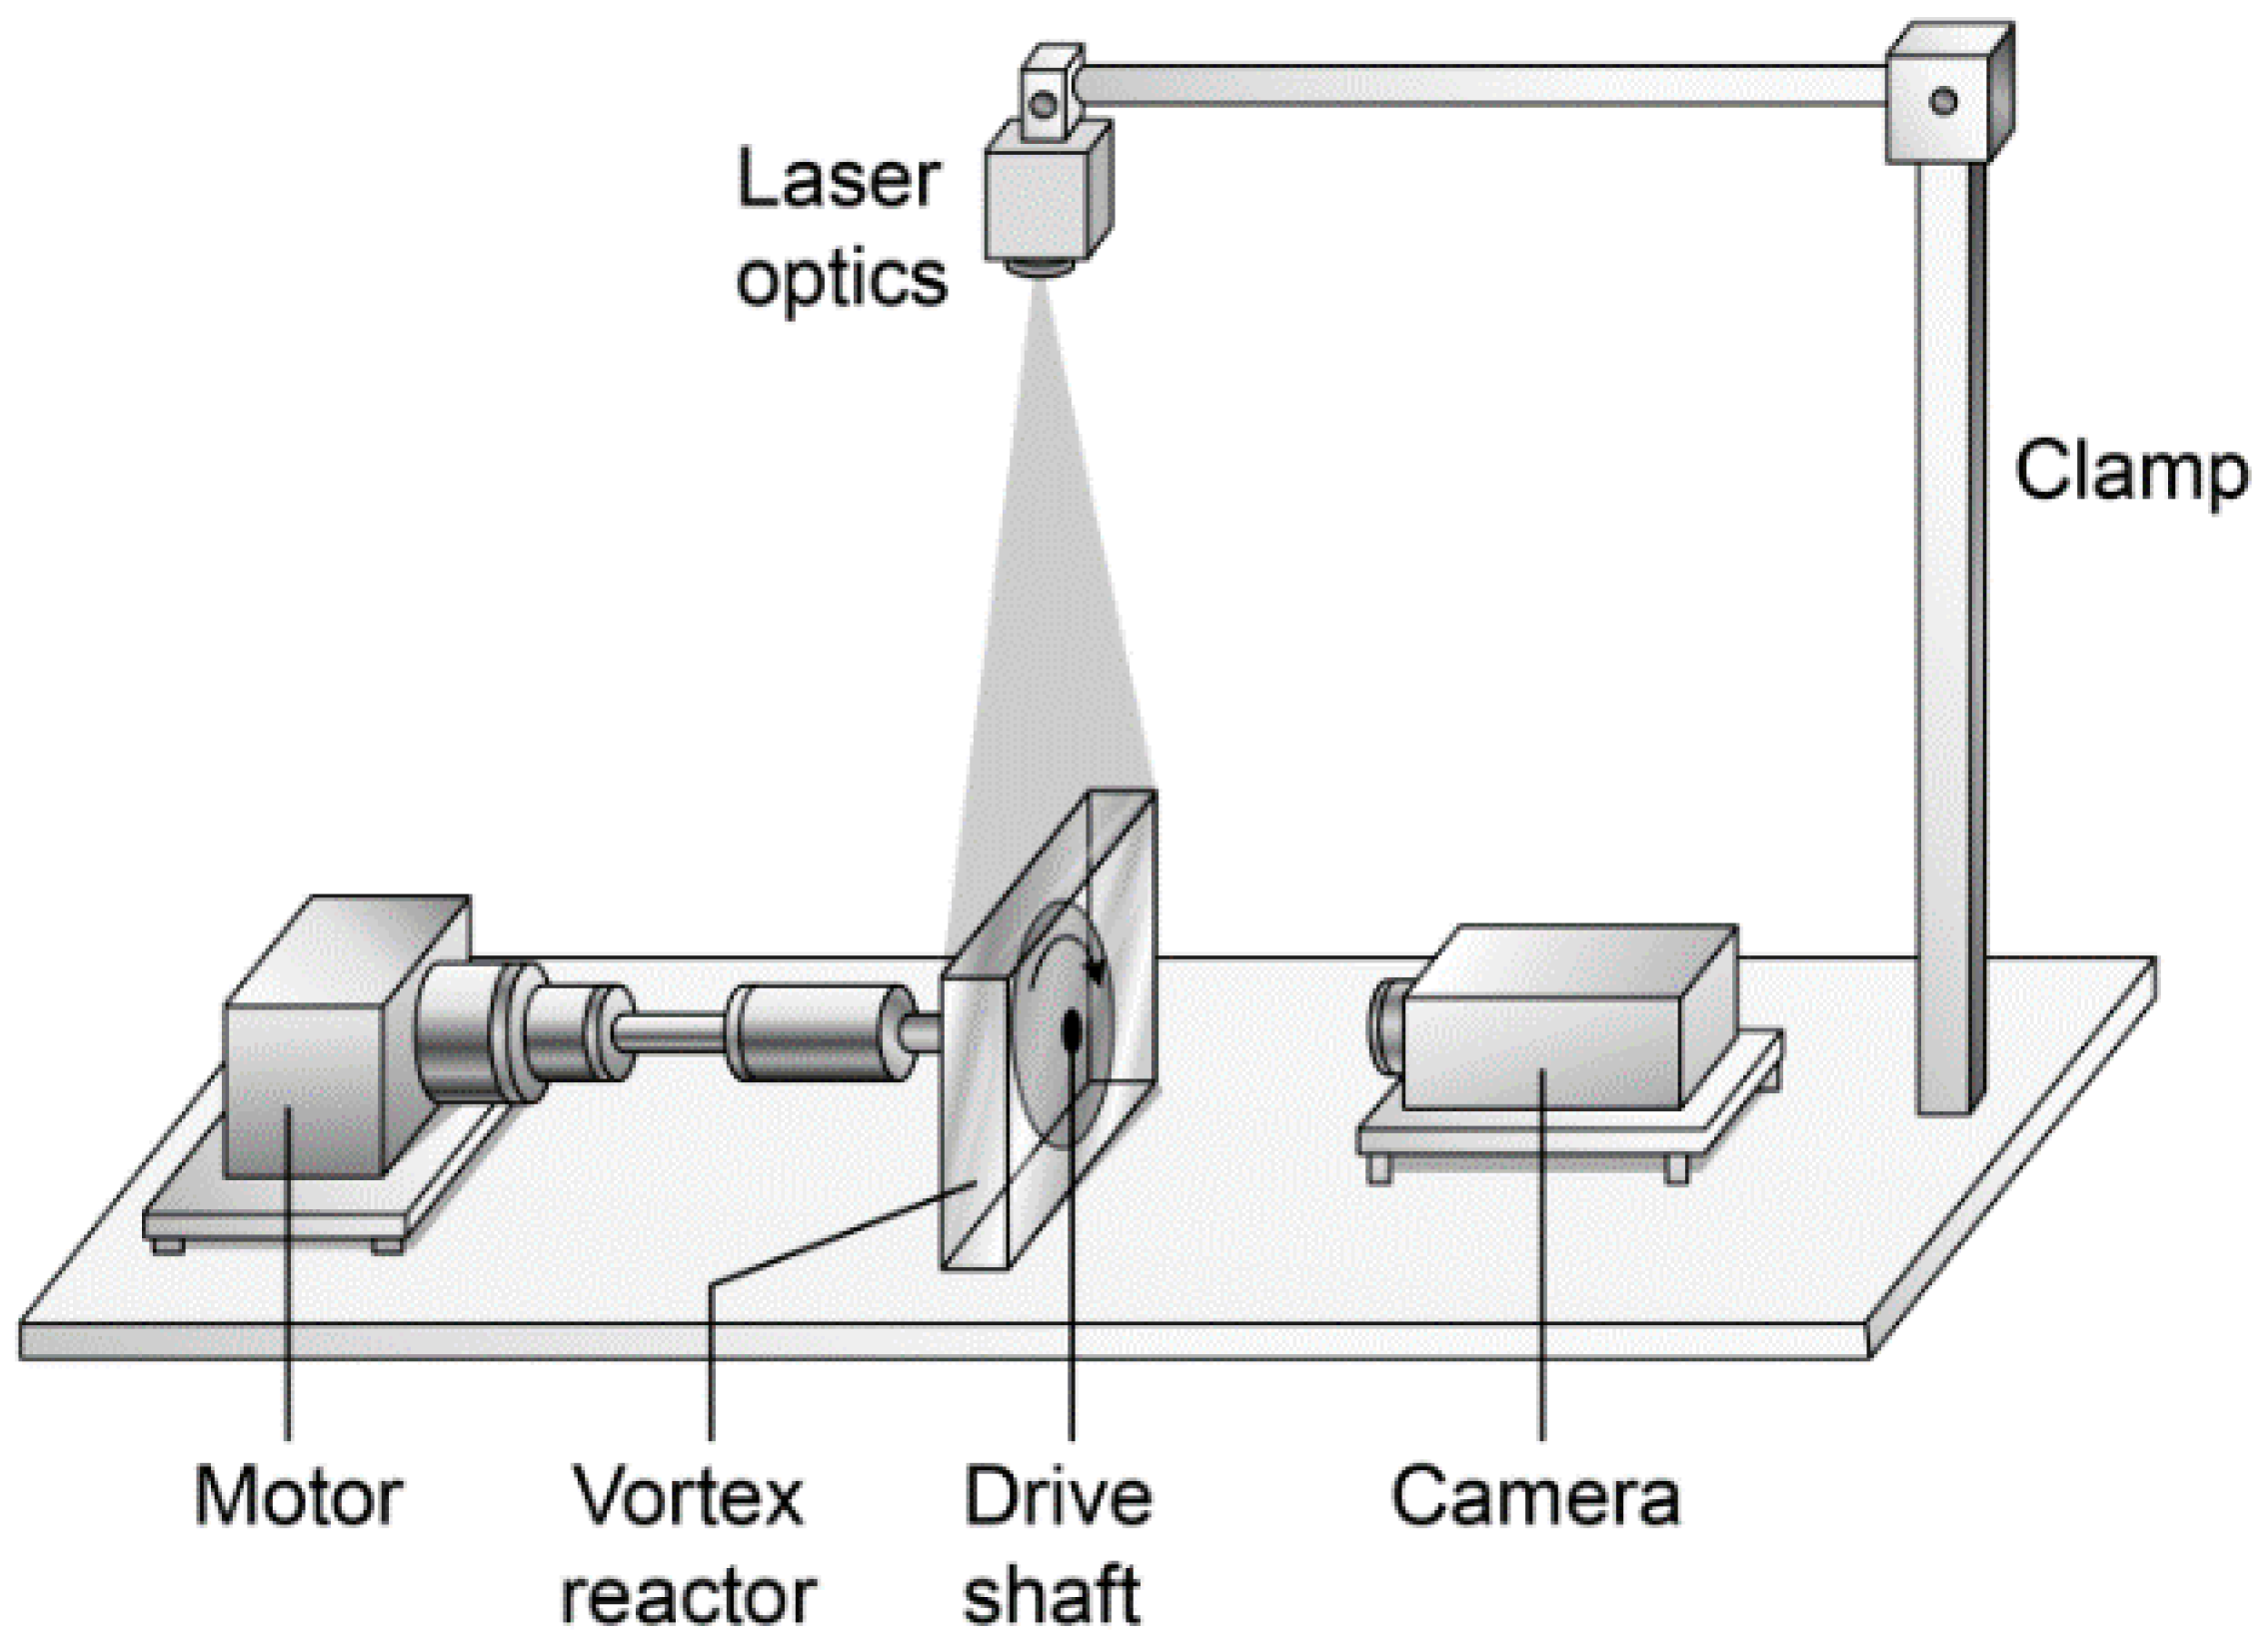
2.3. Experimental Fluid Flow Measurements

The flow measurement commences after running the reactor for a period of time in which the fluid flow had reached a steady state. In our case, we assume a time longer than t = tGϕ = 25 as the time at which the system has reached a pseudo-steady state condition [27]. The 2-D PIV measurements, which are described in detail elsewhere [15], consist of an RVR reactor system seeded with tracing particles and distilled water at standard conditions as a working fluid (Figure 2). The geometry of the reactor presented some measurement constraints, which was taken into account in the post-processing and analysis of the experimental data. The laser system for the experimental measurements consist of a LINOS Nano 259-532-100 (Qioptic GmbH & Co. KG, Munich, Germany) providing illumination for a cross section of the reactor under investigation. A high-resolution complementary metal-oxide semiconductor (CMOS) camera was used to capture the steady state fluid flow behaviour for post-processing and cross-correlation in MATLAB R2015a (Mathworks GmbH, Germany). The seeding particles is a mixture (1:1) of silver-coated and hollow glass spheres (Dantec Dynamics, A/S, Denmark) measuring 10 μm in average diameter with a good light scattering efficiency and sufficiently small velocity lag [28,29].

3. Numerical Simulation

3.1. Model Description

3.1.1. Governing Equations

The general form of the governing equations of mass and momentum conservation, or the so called Reynolds-Averaged Navier-Stokes (RANS) equation, can be written in a simplified form for a steady-state single phase fluid flow, which is given in Equations (3) and (4), where ρ is the density, p is the static pressure, v is the velocity component, τ = represents the stress tensor due to viscous stress, ρ g is the gravitational force, and F is the exerted body forces. The Reynolds-Averaged form of the continuity and momentum conservation equations was used along with k-ε eddy-viscosity and RSM turbulence models to close the RANS momentum equation. In the case of standard and RNG k-ε models, this is done by calculating the turbulent or eddy-viscosity μ t , or effective viscosity μ eff , from the transport equations of turbulent kinetic energy k and its dissipation rate ε [4,30,31]. The effective viscosity μ eff and the stress tensor τ = can be written as follows in Equations (5) and (6), where μ represent the molecular viscosity, and the constant C μ   =   0.09 ,   and   0.0845 for the standard k-ε and RNG k-ε models, respectively, while the last terms on the right represent the local turbulent or eddy-viscosity [4,32,33,34,35]:
ρ t   +   · ( ρ v )   =   0
t   ( ρ v )   +   · ( ρ v v )   =   p   +   · ( τ = )   +   ρ g   +   F
  μ eff   =   μ   +   ρ C μ k 2 ε
τ =   =   μ [ ( v )   +   ( v ) T ] 2 3 μ δ v

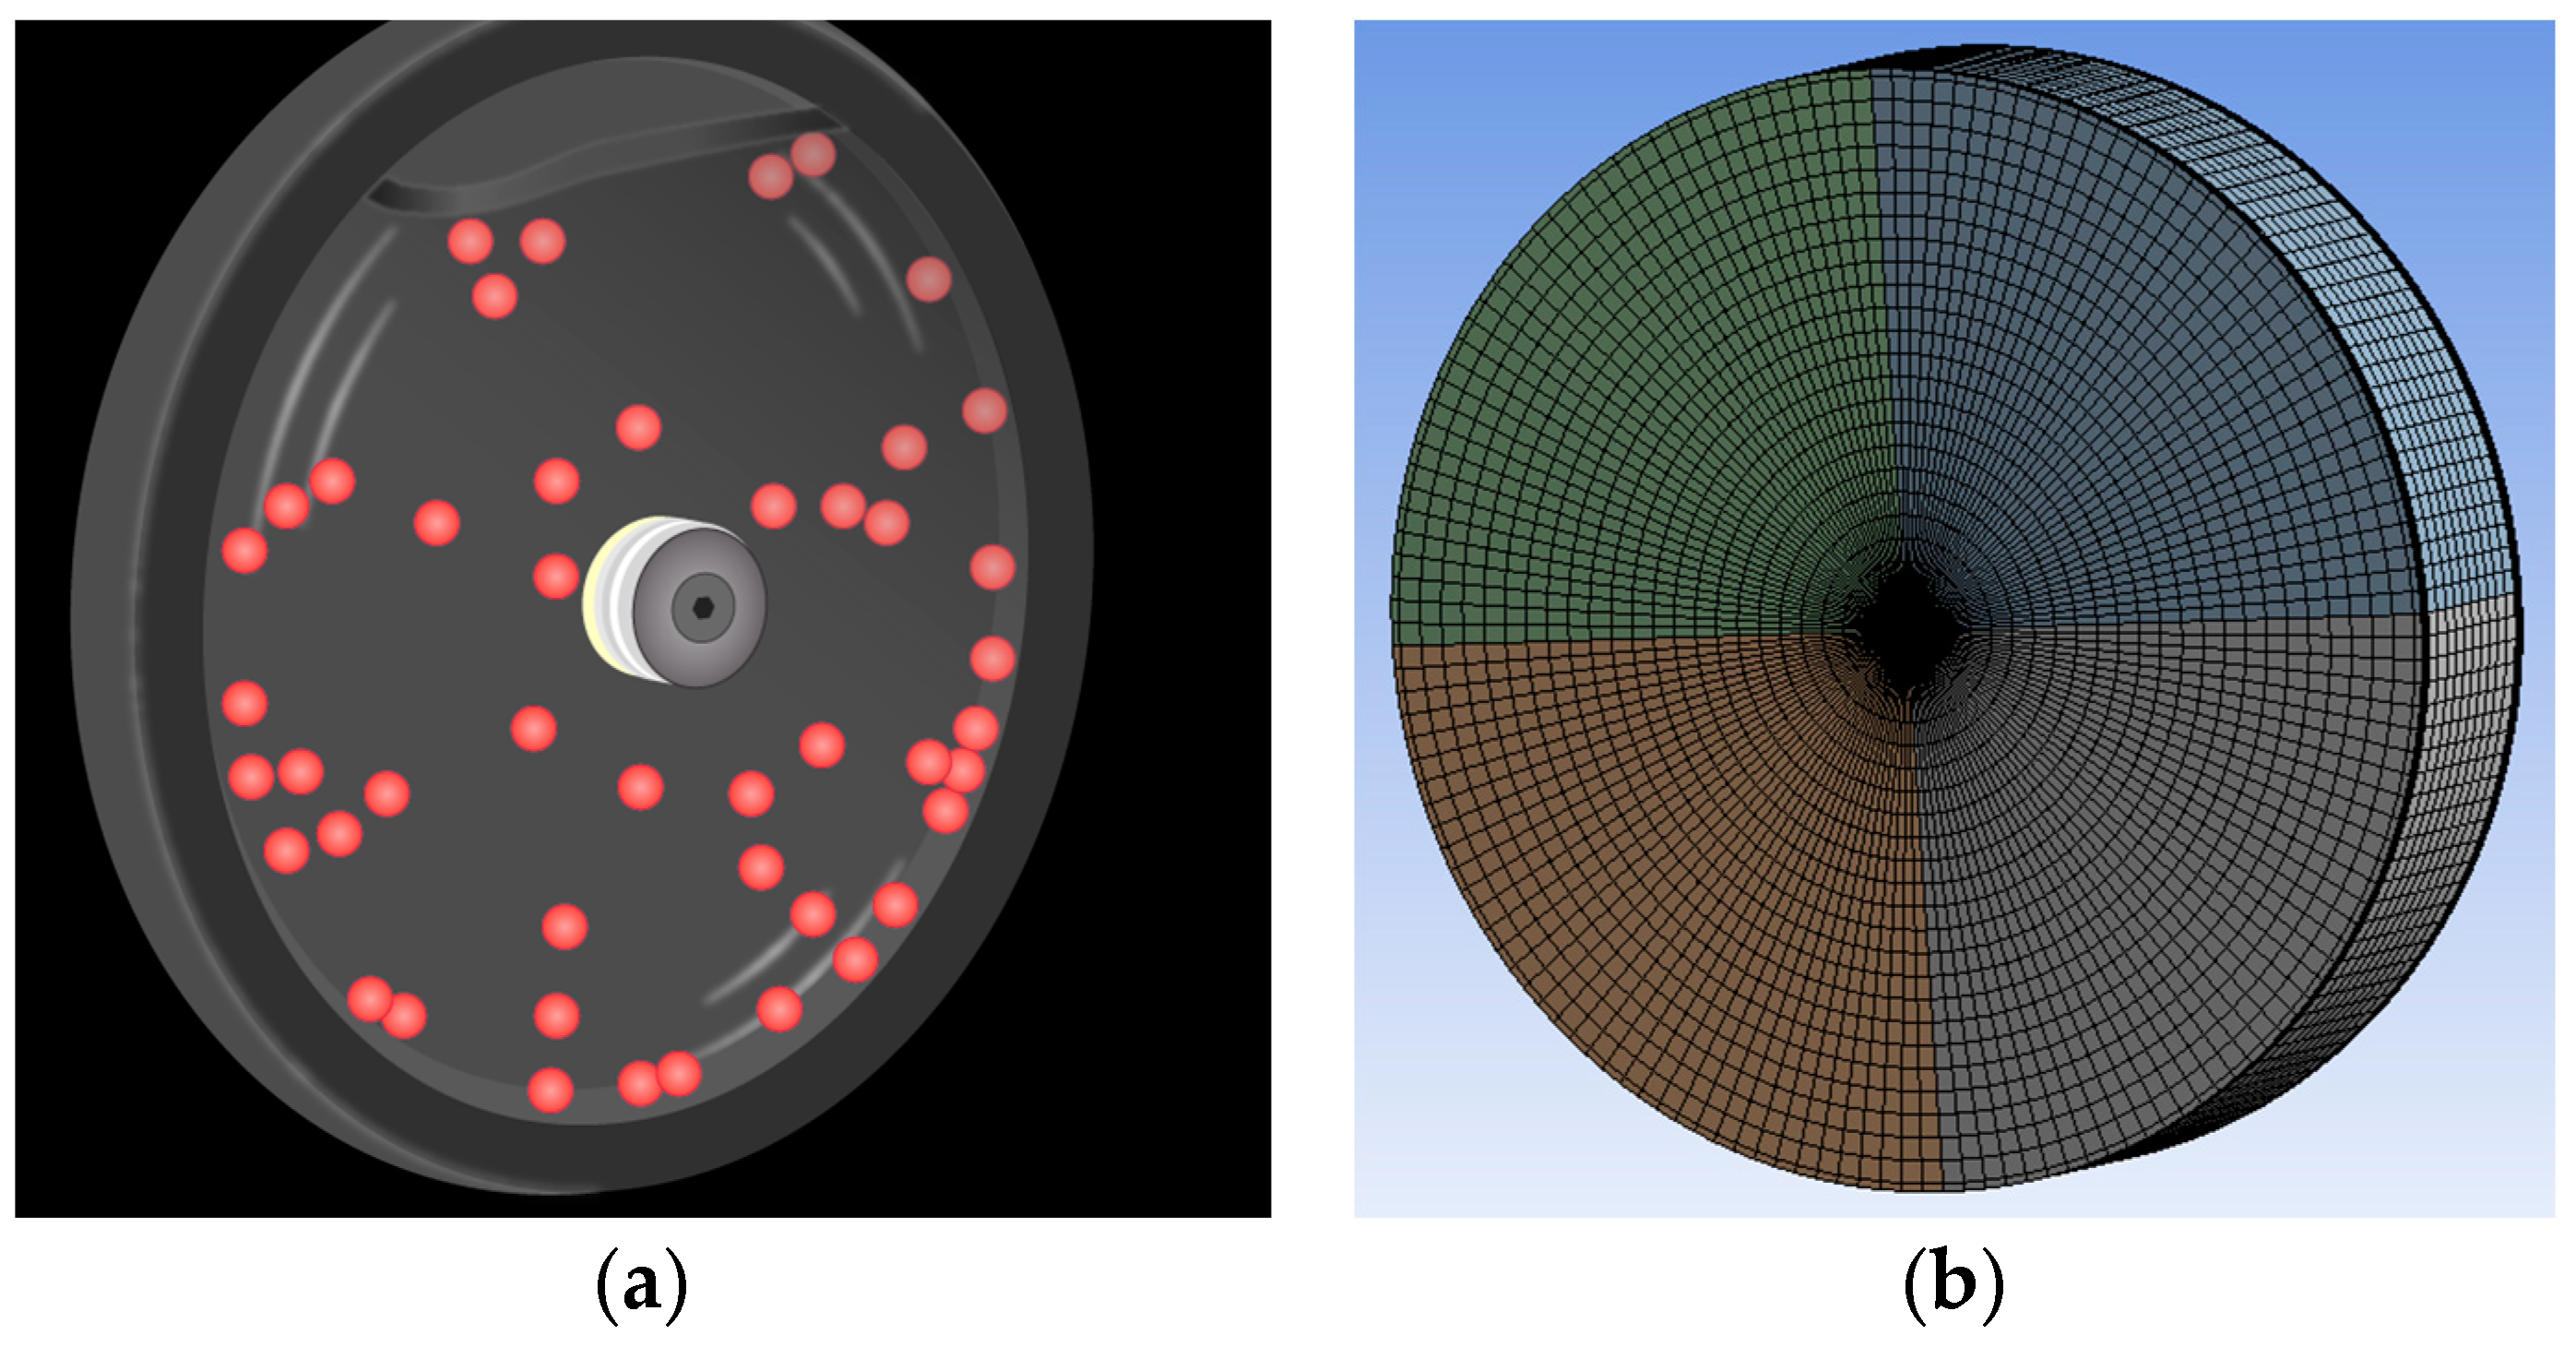
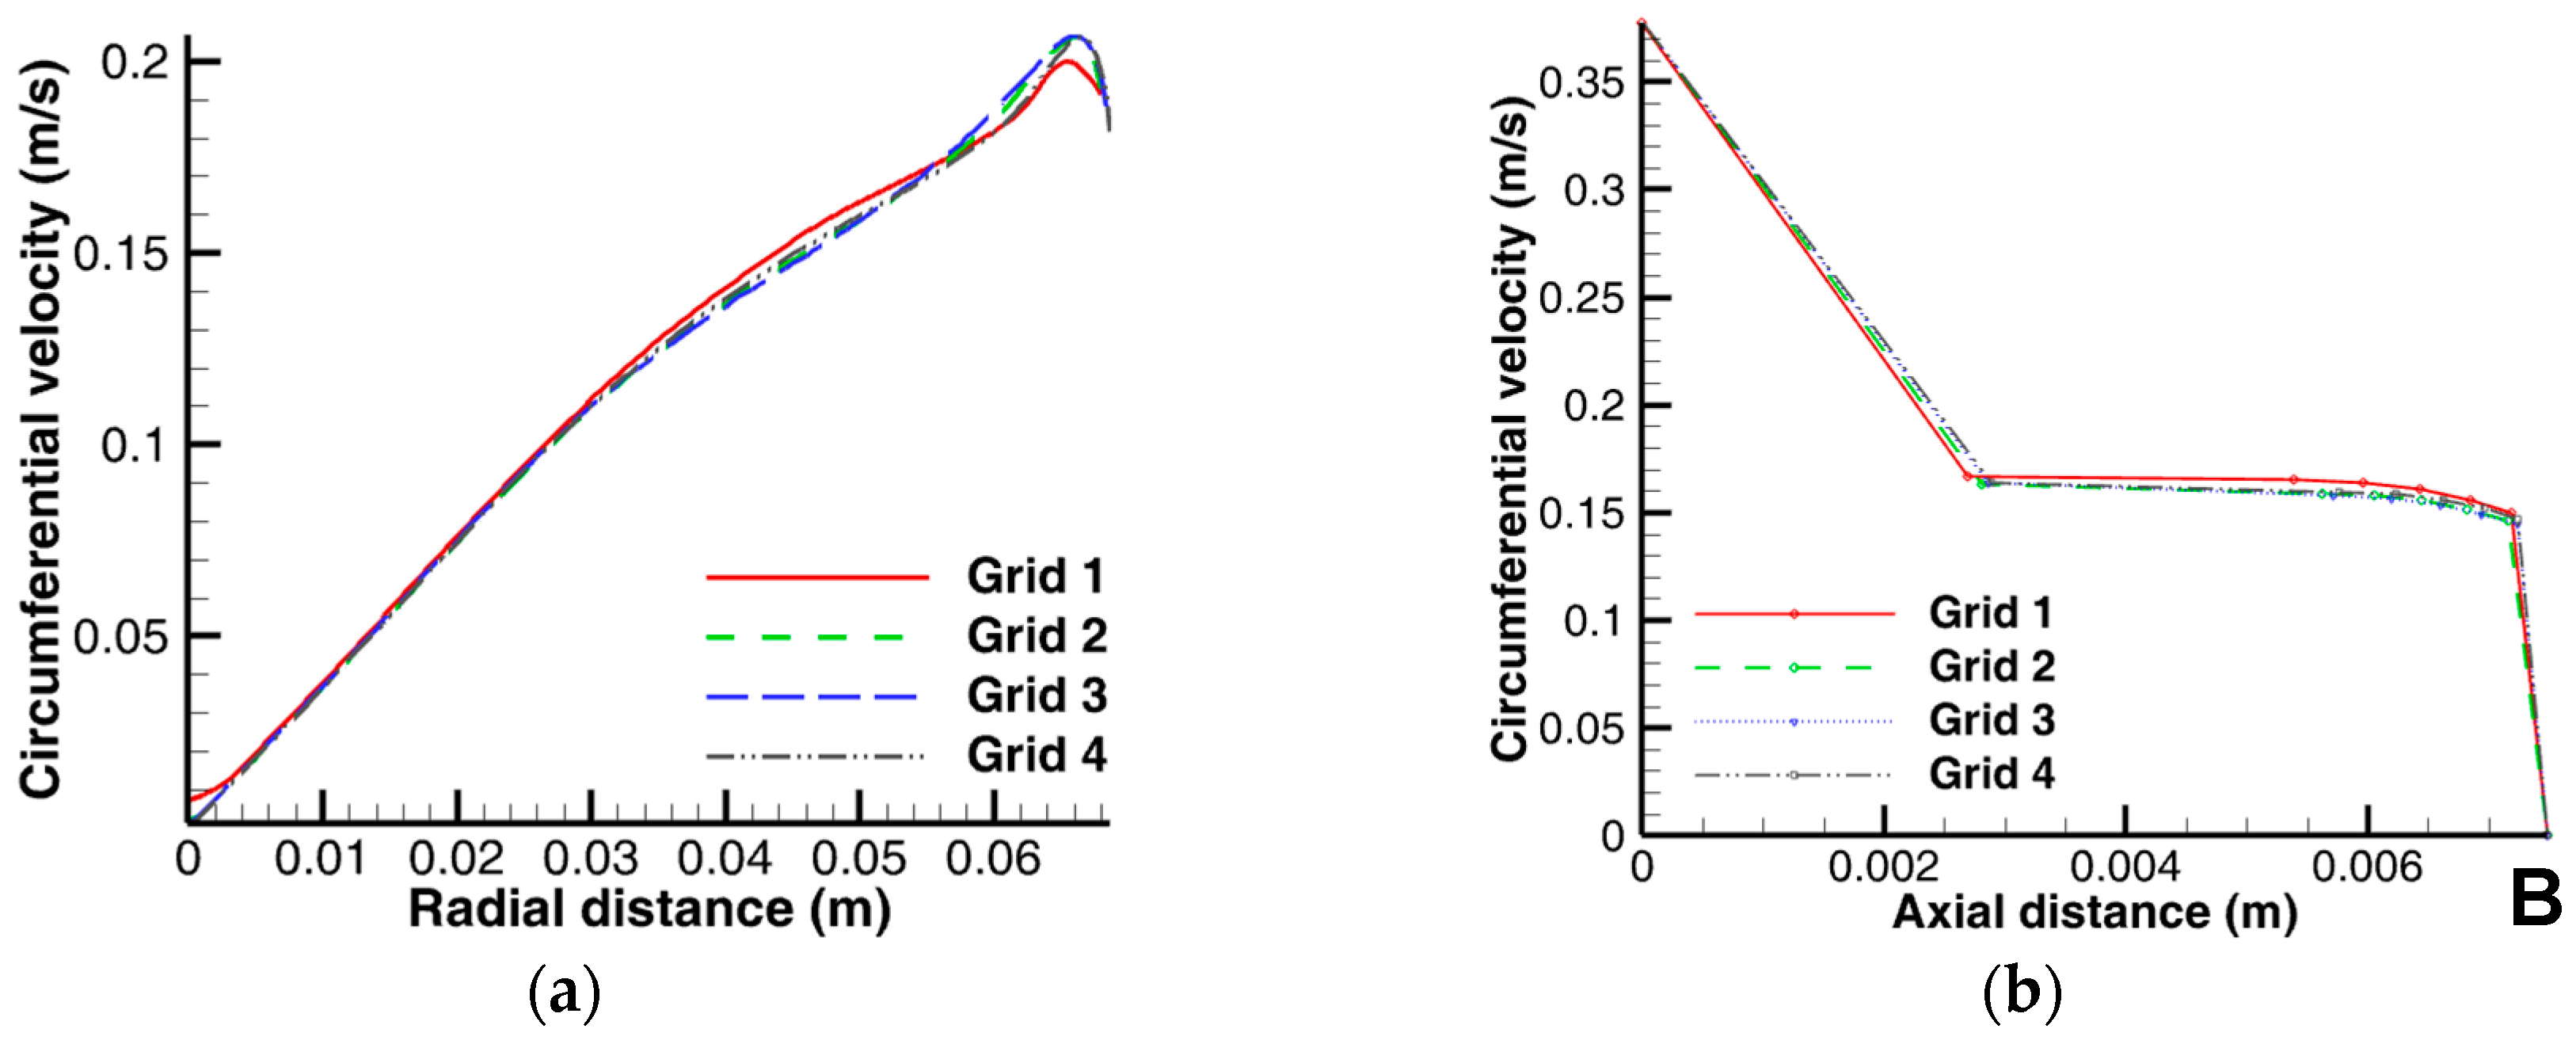
3.1.2. Fluid Flow Domain, Mesh and Grid Convergence

A solid modelling software (ANSYS DesignModeler 18.2, ANSYS Inc.) was used to create the simplified CAD model of the reactor along with the rotating disc to describe the fluid domain (Figure 3). Thereafter, a computational mesh was generated from the solid model for the computational study which consisted of structured hexahedral mesh using the commercial grid generation software ANSYS Meshing 18.2 (ANSYS Inc.). Four grids of different mesh densities of approximately 0.042 × 10⁶, 0.431 × 10⁶, 0.86 × 10⁶, and 1.3 × 10⁶ elements were created for the grid independence study. The grid independence study was conducted by carrying out the numerical simulation on successively finer grids. Thereafter, the results of the circumferential velocities were compared for all the grids to establish that they are grid-independent. Finally, a mesh containing approximately half a million elements was thereafter chosen on the basis of a trade-off between the required computational accuracy and CPU time needed to run the simulation to a converged solution. This optimized mesh was thereafter used for subsequent computations of all parameters of interest with a computation time of approximately 15 h for the highest operating speed. Figure 4 shows the radial and axial circumferential velocity profiles along the Y-Z and X-Z planes at x = 0.003725 and y = 0.045, respectively, for a rotation speed of 70 rpm for all the four grids employed for the convergence study and clearly demonstrates that the results are grid-independent.

3.2. Numerical Methods and Boundary Conditions

The hydrodynamics of the wet agglomeration process was investigated by obtaining numerically the steady-state flow field of a single-phase flow in the reactor. This flow field was then compared to the experimentally derived one based on the assumption that the seeding particles in the PIV measurement faithfully follow the flow and do not have any impact on the continuous phase (one-way coupling). This assumption, which is obviously not the case in practice, especially at high solids loading, was deemed sufficient to match the PIV experimental conditions in which the flow is a dilute suspension. However, this simplified approach is rarely the case in practice as the agglomeration, growth, and breakage of particle cluster—flocs ultimately led to an exchange of momentum and energy between the carrier and the particulate phase through contacts and collisions, especially for high particle concentrations or dense flows [36,37]. In modelling the single-phase flow in the agglomeration reactor, the Single Reference Frame (SRF) approach was employed with relative velocity formulation. This is due to the fact that most of the flow in the fluid domain is rotating as the flow inducer is in close proximity to the reactor wall. No slip condition was imposed on the walls, with the choice of a relative reference frame to describe the zones relative to one another. The pressure-based coupled algorithms were used to obtain a steady-state numerical solution of the Navier-Stokes equation. This algorithm has been shown to offer a more robust and efficient single-phase implementation for steady-state flows [33].
In order to ensure the accuracy of the numerical solution, the scaled residuals, moment on the revolving plate about the axis of rotation, and the average turbulent kinetic energy k, these values were monitored until these parameters reduced to minimal or constant values, and this forms the basis for assessing the convergence of the solution. In verifying the accuracy of the numerical solution, the theoretical values of some hydrodynamic quantities, such as the tip velocity Ω of the rotating disc, the induced vorticity ζ on the disc boundary layer, the flow swirl ratio β, and the gap ratio G were also calculated and compared to the numerically derived and literature values (Figure 1b, Equations (7)–(9)). Finally, validation of the numerical results was carried out by comparing some of the CFD results with the PIV data and the Batchelor model.
Ω   =   ω r   =   2 π nr
ζ   =   2 ω
β   =   ω Ω

4. Results and Discussion

The results of the CFD analysis showing the distribution of the mean flow parameters is hereby presented in the following sections. Only the data from one side of the reactor is analyzed as the flow is fully symmetrical about the axis of rotation. The symmetrical nature of the flow was also confirmed in the course of the data analysis by comparing data points on either side of the reactor and other points of symmetry. It can be clearly seen that the flow fields are generally similar in structure, but mainly differ in terms of the flow quantities’ magnitudes.

4.1. Analysis of the Mean Flow Characteristics

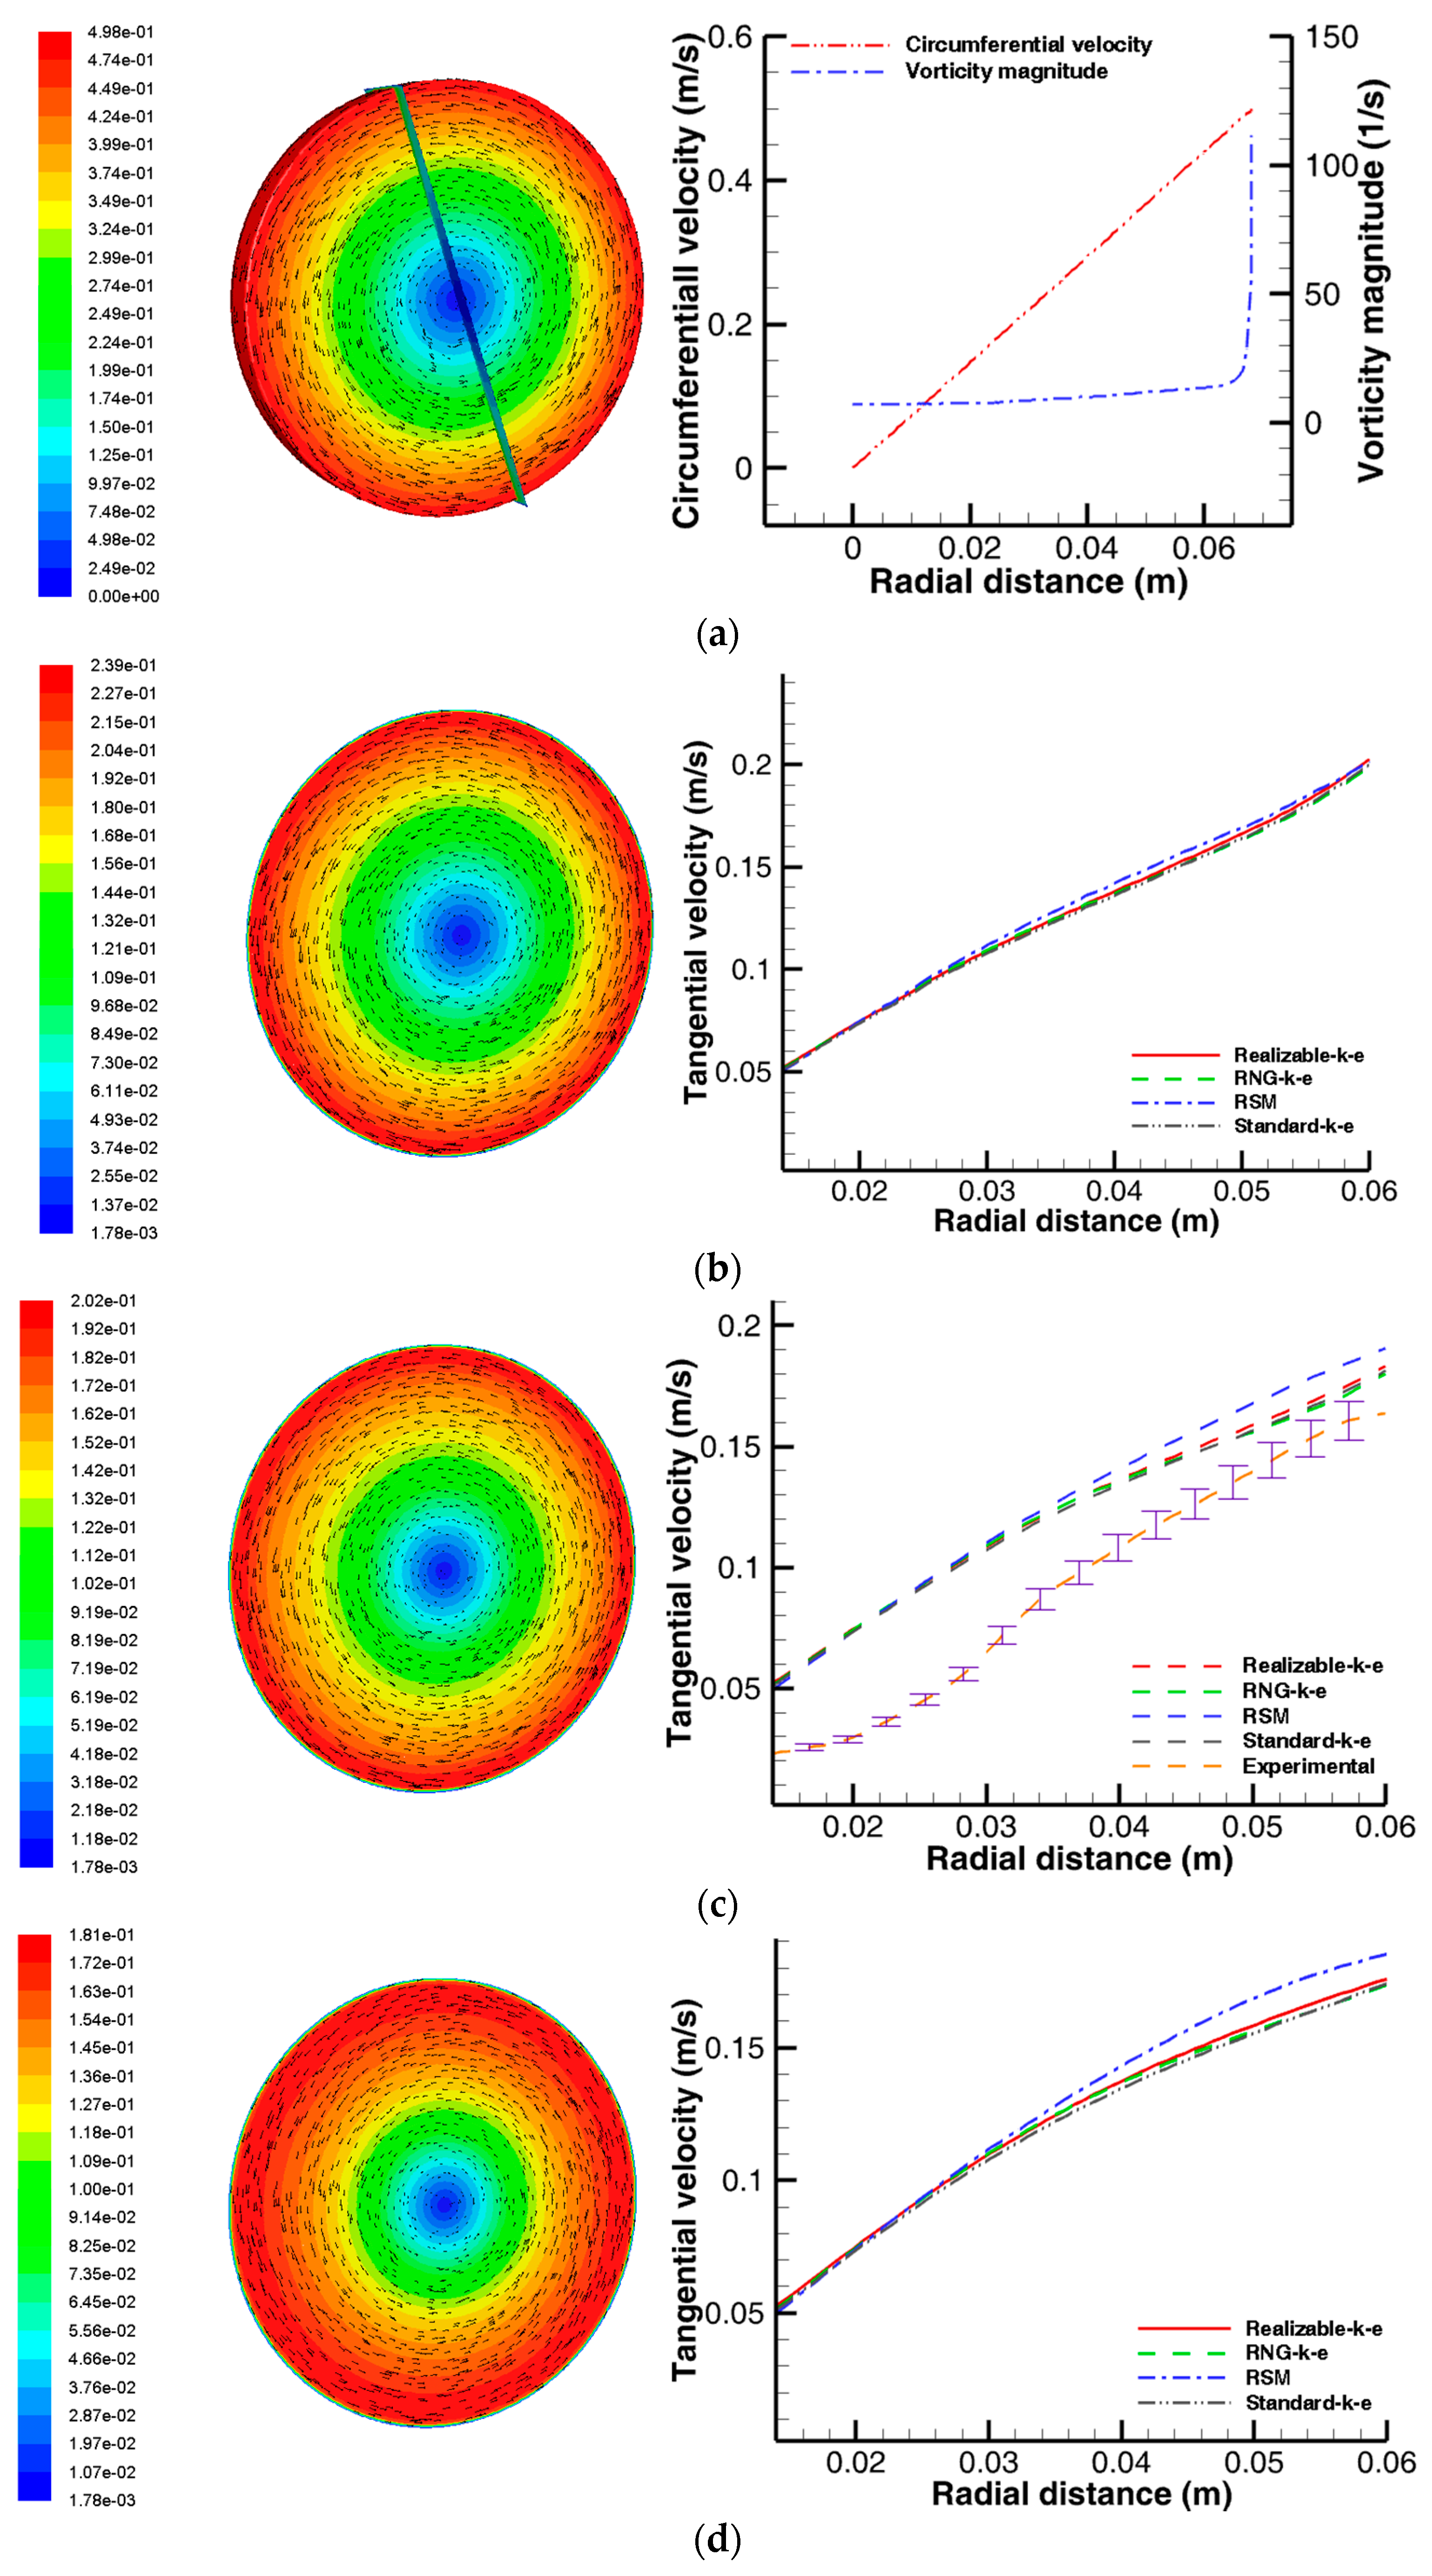
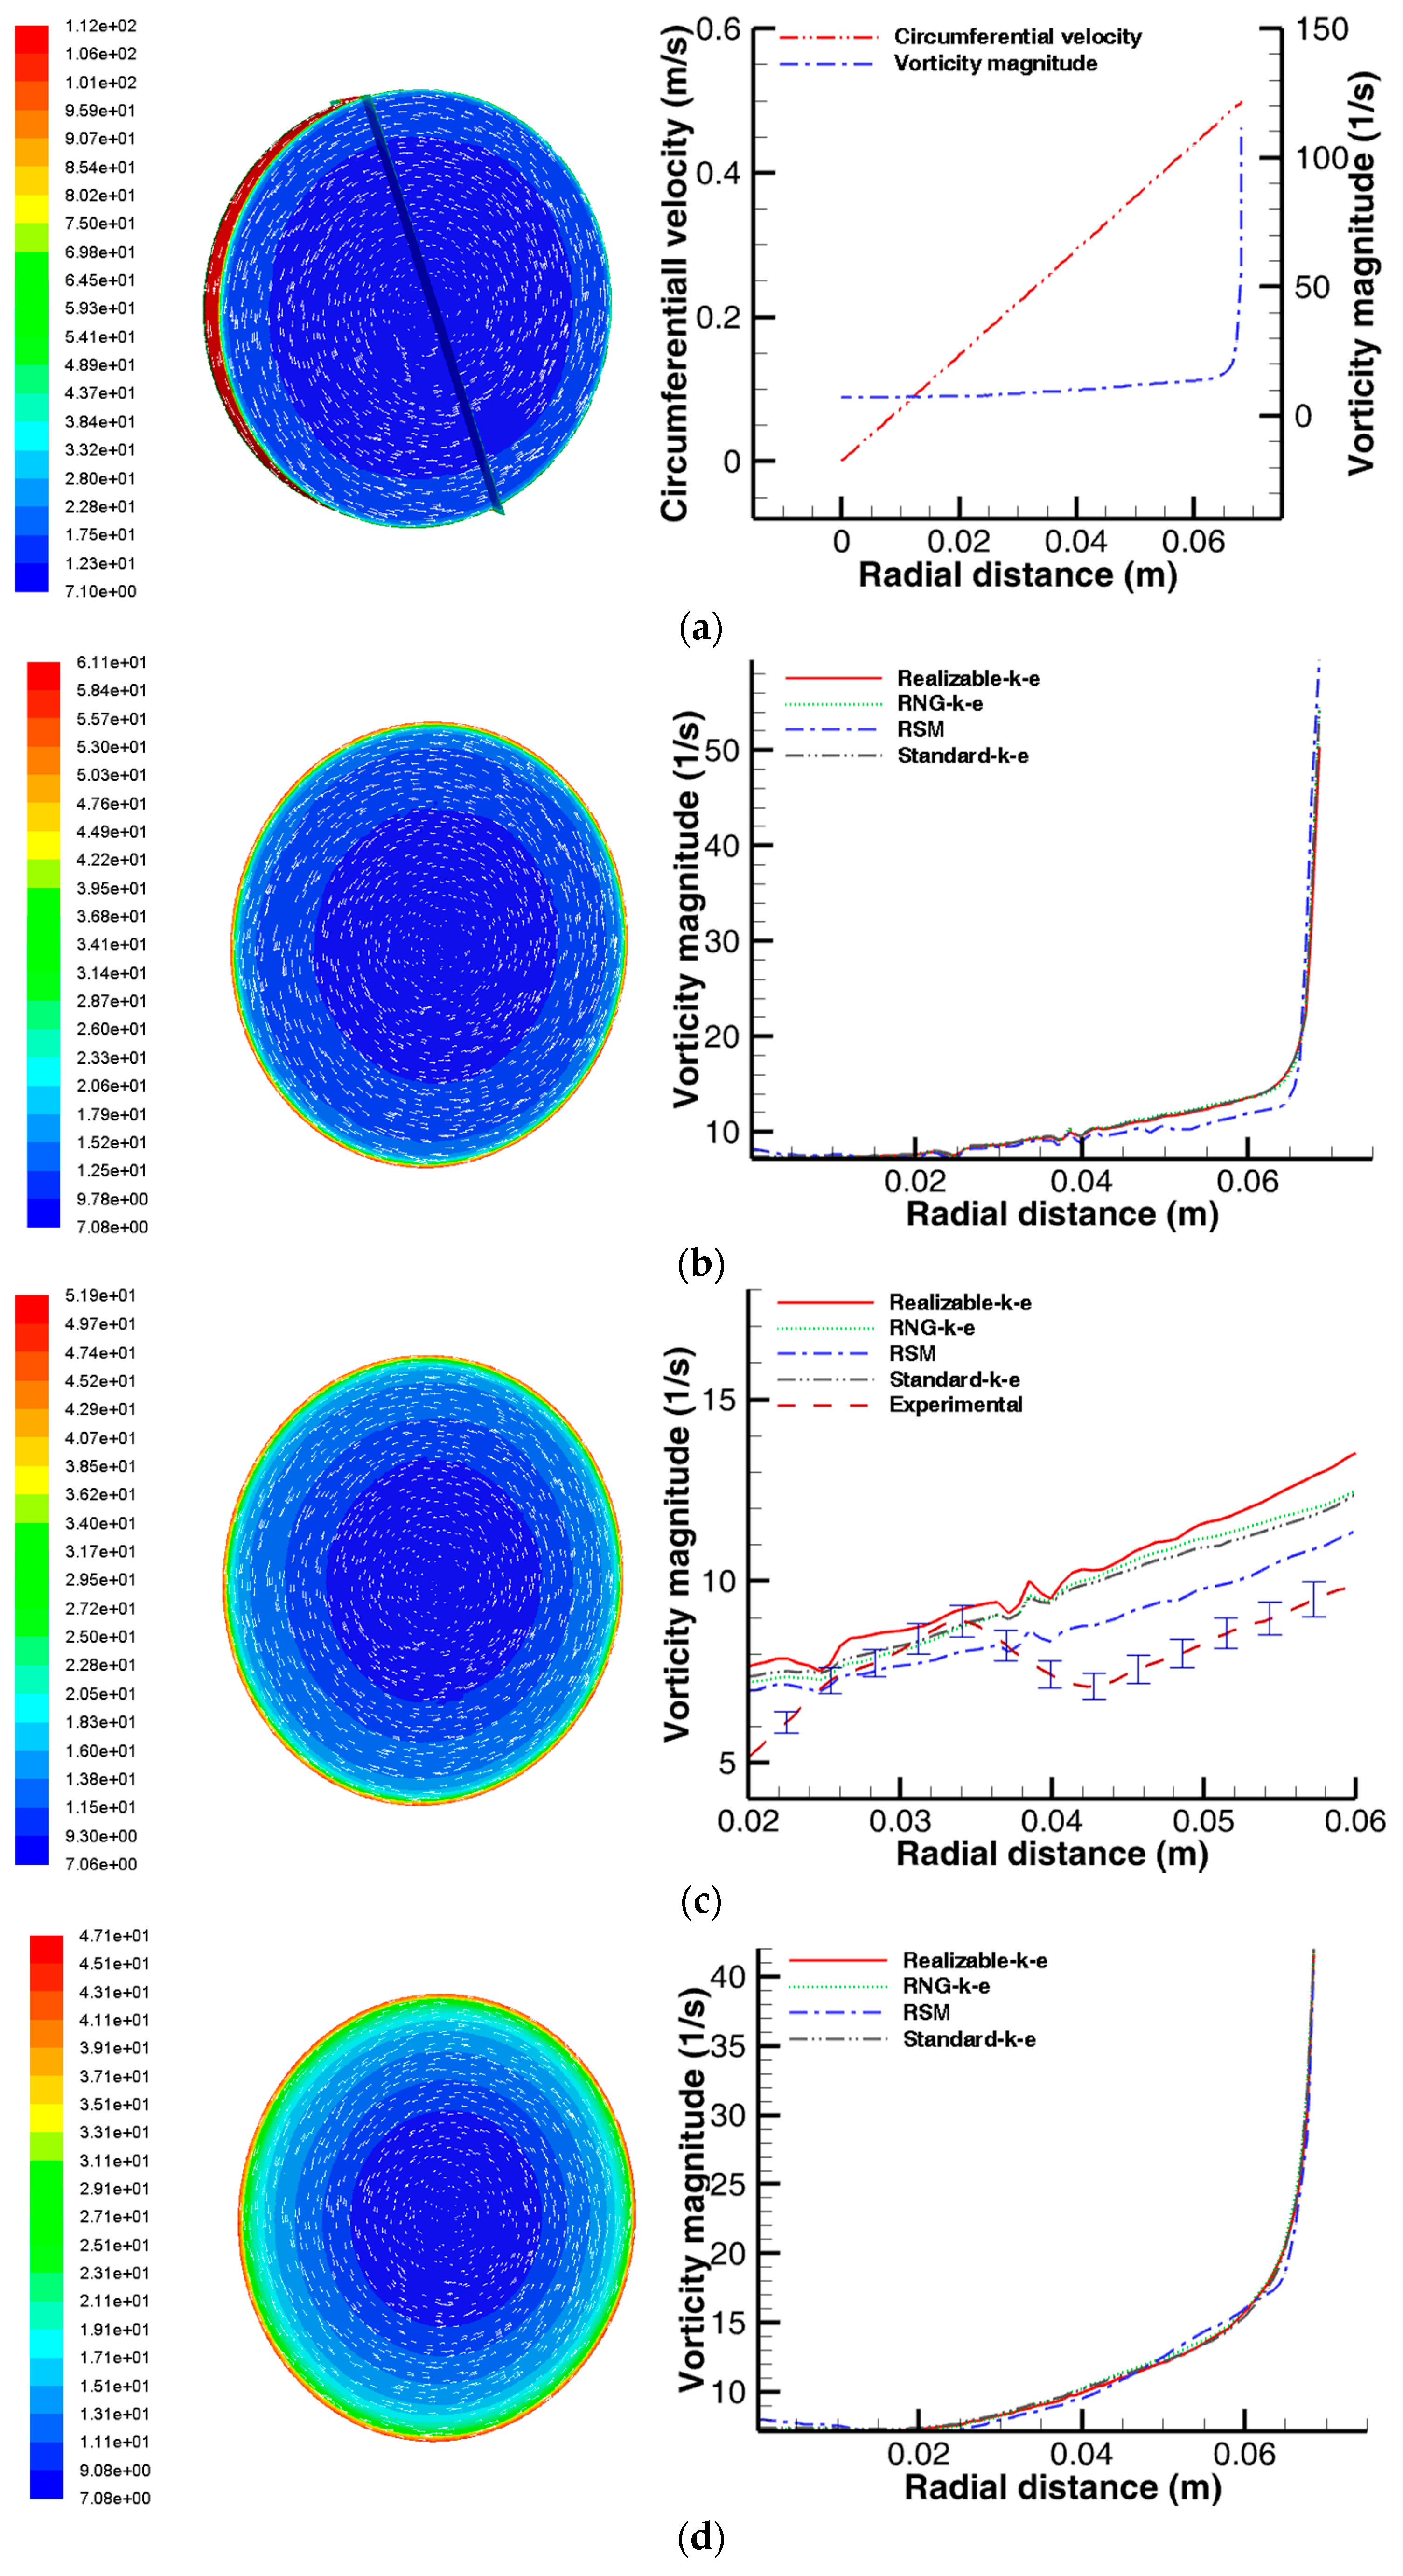
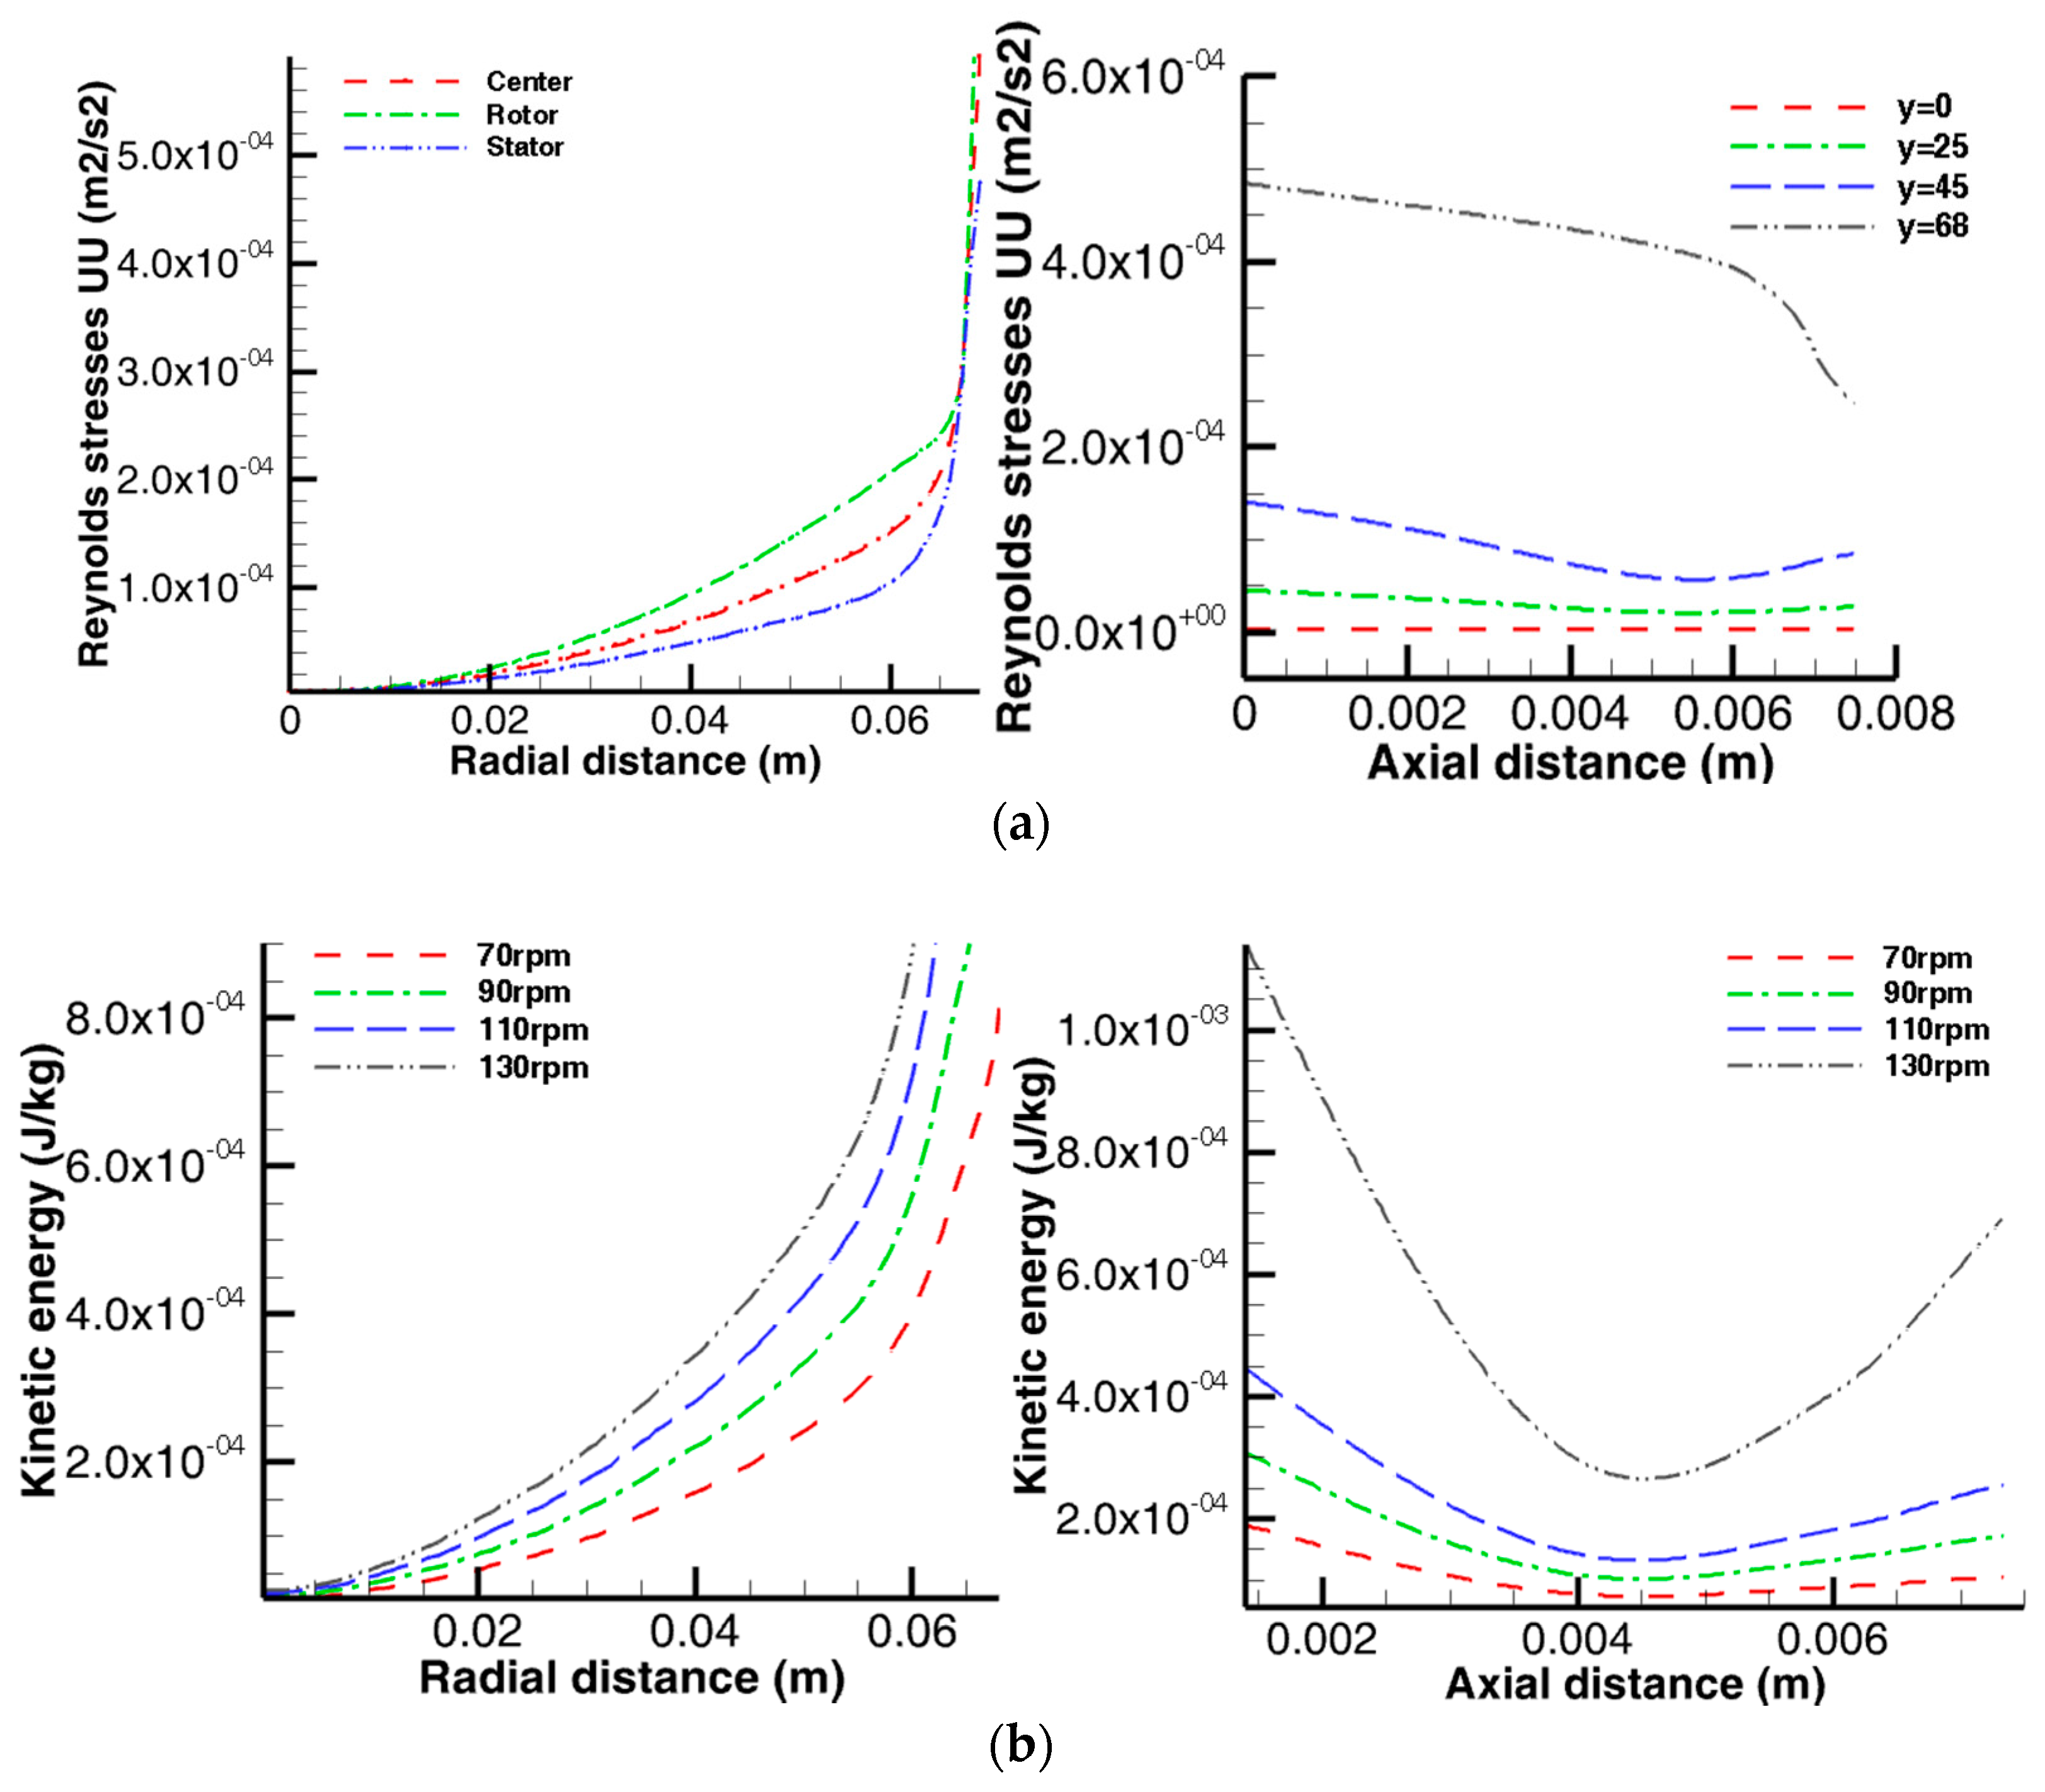
4.1.1. Radial Distribution of the Hydrodynamic Quantities

The flow streamlines in the rotor-stator system could be analyzed on the basis of the Batchelor flow model. The flow structure in the RVR reactor broadly agreed with the Batchelor’s predictions and other similar studies [9,10]. The Batchelor’s prediction was arrived at by solving a simplified form of Navier-Stokes equation to obtain an approximate flow field Figure 5a–d and Figure 6a–d shows the radial profiles of the circumferential velocity vector fields and contours, and the vorticity vector maps and contours on the rotating disc boundary layer and on three Y-Z planes along the reactor wheelspace, which seems to be consistent with the theoretical descriptions given in Figure 1b and Equations (6) and (7). Away from the boundary layer near the rotor in the radial direction, there was a sharp increase the radial vorticity profile with respect to the radial distance (Figure 6b–d). In addition, the radial circumferential velocity profile showed a somewhat lower magnitude than the tip velocity close to the wall of the reactor (Figure 4a). However, in the case of the vorticity magnitude profile, it is observed that there is a small region of high vorticity, mostly around the outer edge of the rotating disc and the fluid rotating core, as shown in the vorticity magnitude contour in Figure 6a–d. Apart from this region, the CFD results were consistent with the theoretical prediction of vorticity as twice the magnitude of the rotating disc angular velocity (Figure 1b, Table 1). It had been shown by previous studies that a region of high vortex and vorticity tends to promote the wet agglomeration of particles and floc densification [38,39]. However, owing to the nature of the clearance between the rotating disc and the reactor wall, which is quite narrow, it was not possible to take advantage of this rotational effect for further densification of the formed flocs and this will be a factor to be considered in future optimization of the reactor system. The velocity distribution across the wheelspace was characterized by the Batchelor flow with separated boundary layers and an inviscid core that rotated at a fraction of the rotor angular velocity with an axial pumping effect towards the shroud. The swirl ratio β, which is a measure of the ratio of the rotating core tangential velocity to that of the disc tip velocity or boundary layer velocity, was found to be approximately 0.4044, 0.4038, 0.4044, and 0.4043 for operating speeds of N = 70, 90, 110, and 130 rpm, respectively, which are quite similar to the values reported by Daily et al. [8].
The basic outline of the flow pattern was also consistent with the PIV results, which are available elsewhere [15]. The velocity profiles at two selected Y-Z cross sections on the model were validated by comparing them with the PIV experimental data obtained with a measurement error of ±0.05. (Figure 5b,c). In general, the velocity profile showed a fairly good agreement with the PIV data except at the outer edge of the cross section of the PIV velocity profile. This region on the outer edge of the cross section had to be masked out in the post-processing of the PIV data owing to some measurement limitations encountered during the PIV analysis. The high fluctuation of the laser signal on the fluid surface made the measurement quite a challenge. Compared with the PIV results, the maximum tangential velocity predicted by the CFD differed by a value of approximately 10%. However, it is worth pointing out that the observed deviations of the CFD data from the experimental results were mainly due to the experimental limitations encountered in the PIV analysis rather than the accuracy of the numerical predictions. A quick comparison of the CFD data with theoretical calculations in Table 1 seems to suggest that the PIV analysis under-predicted the flow characteristics. In terms of the accuracy of the turbulence models, the RSM model seemed to give better predictions of the flow profile. The RSM model had been reported in several studies involving swirl and rotating flows to be more efficient in capturing the salient turbulence characteristics of the flow [31,40]. One way to improve the predictions of the two-equation eddy-viscosity models is by introducing curvature correction using a modified turbulence production term [32,33]. The standard k-ε gives the least accurate prediction due to the absence of curvature correction in this model.

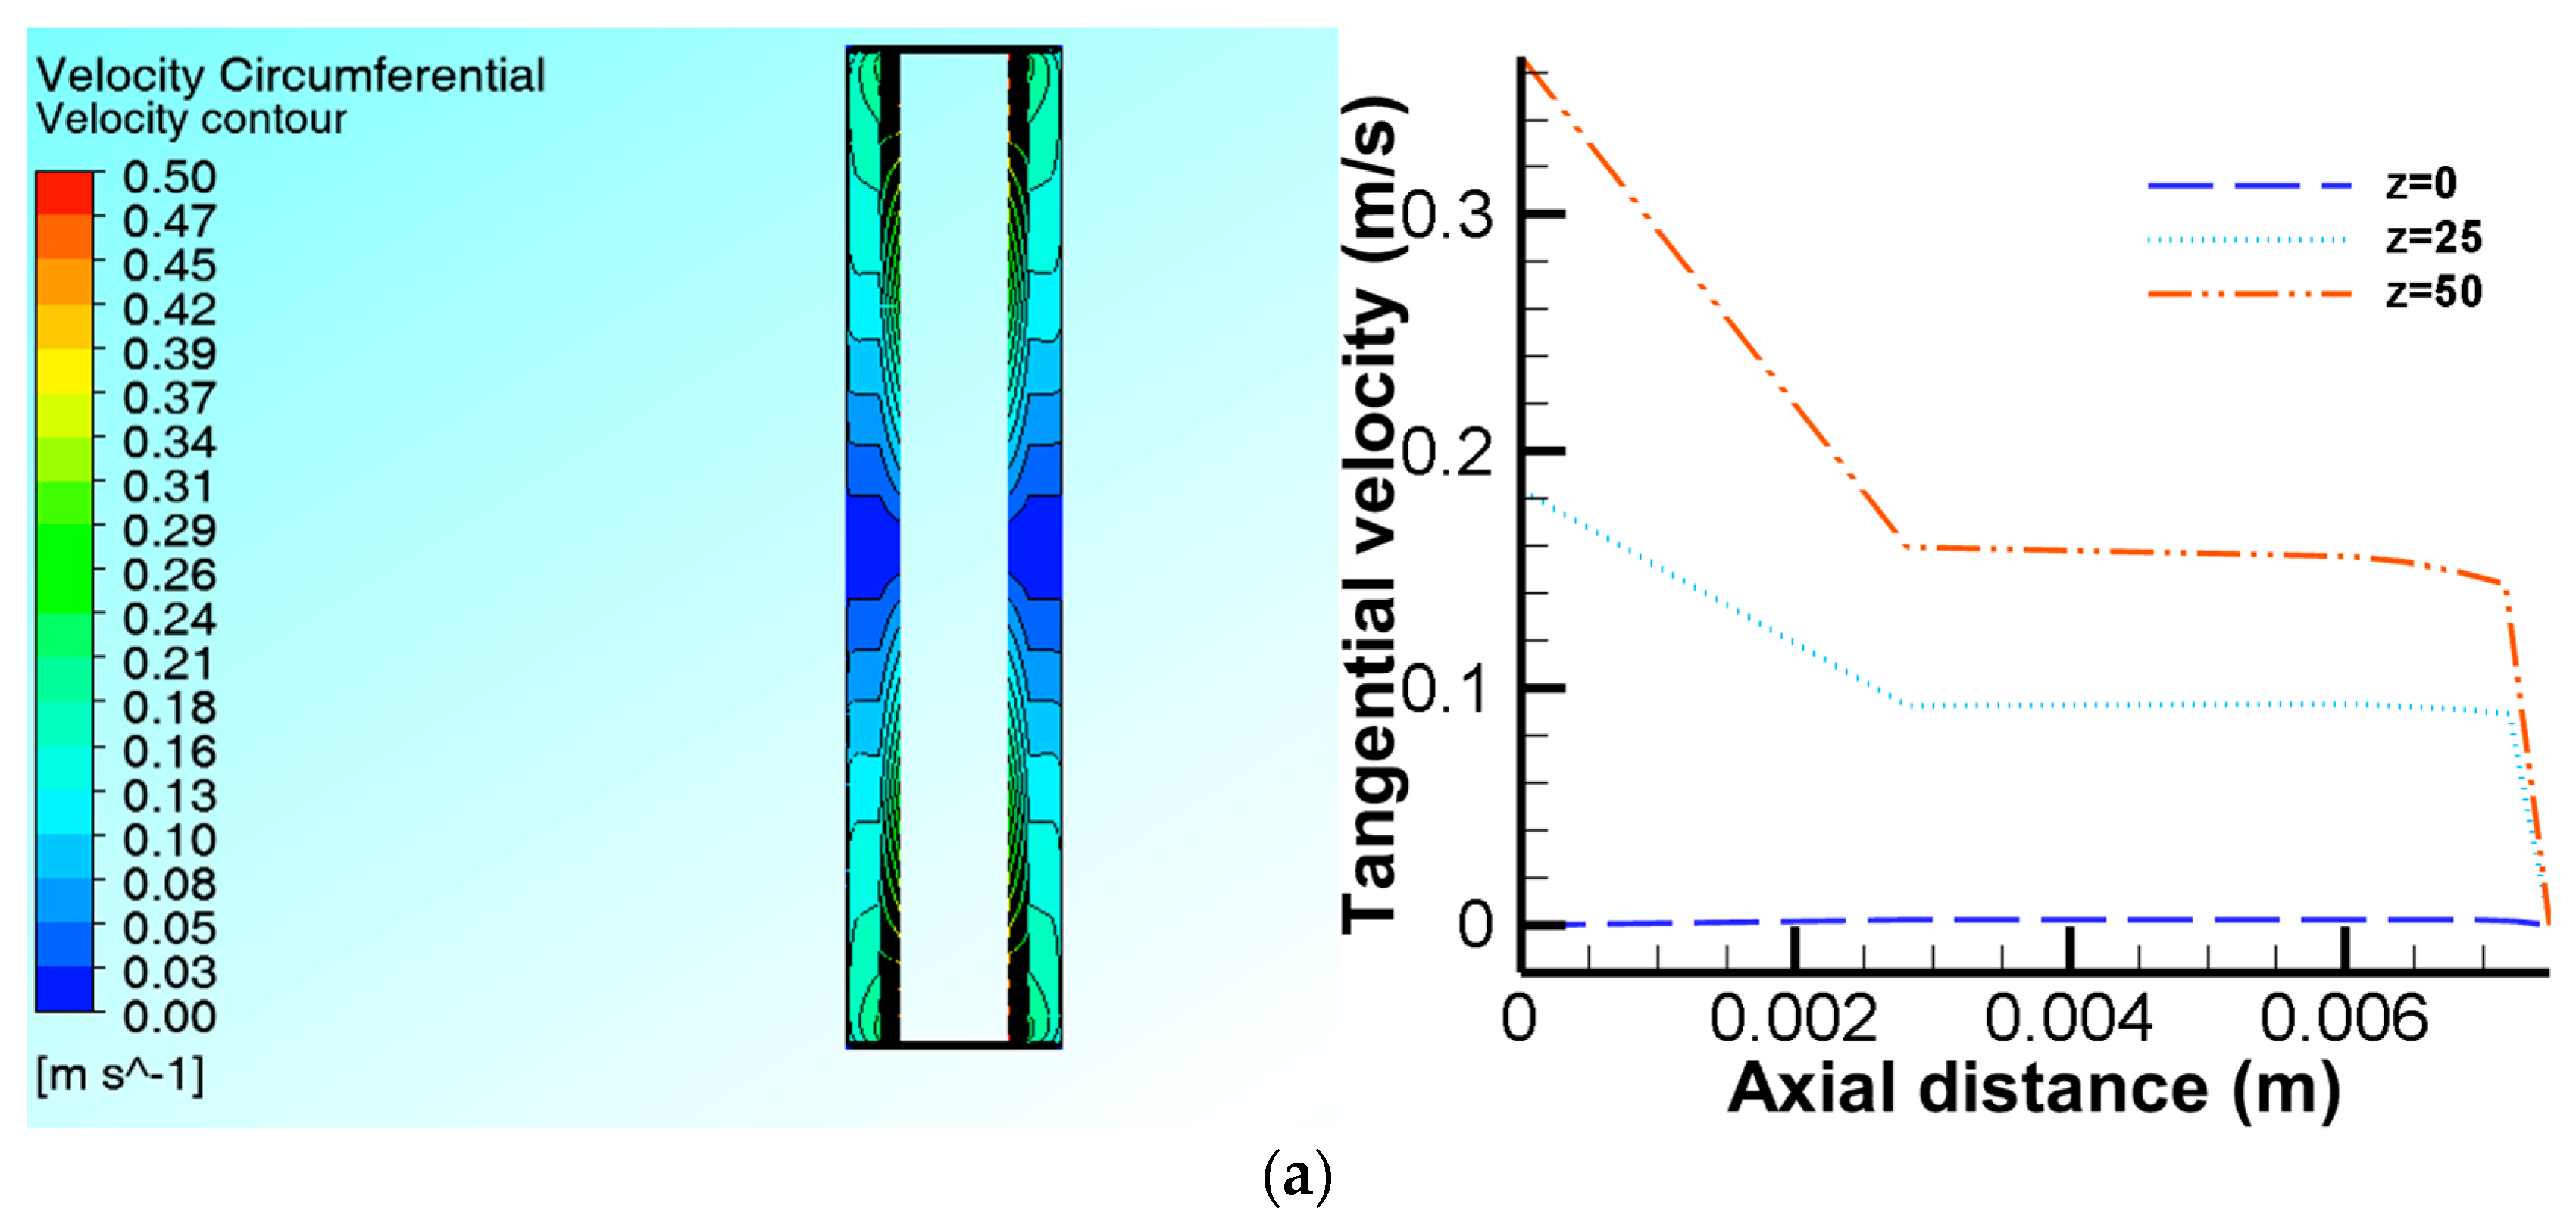
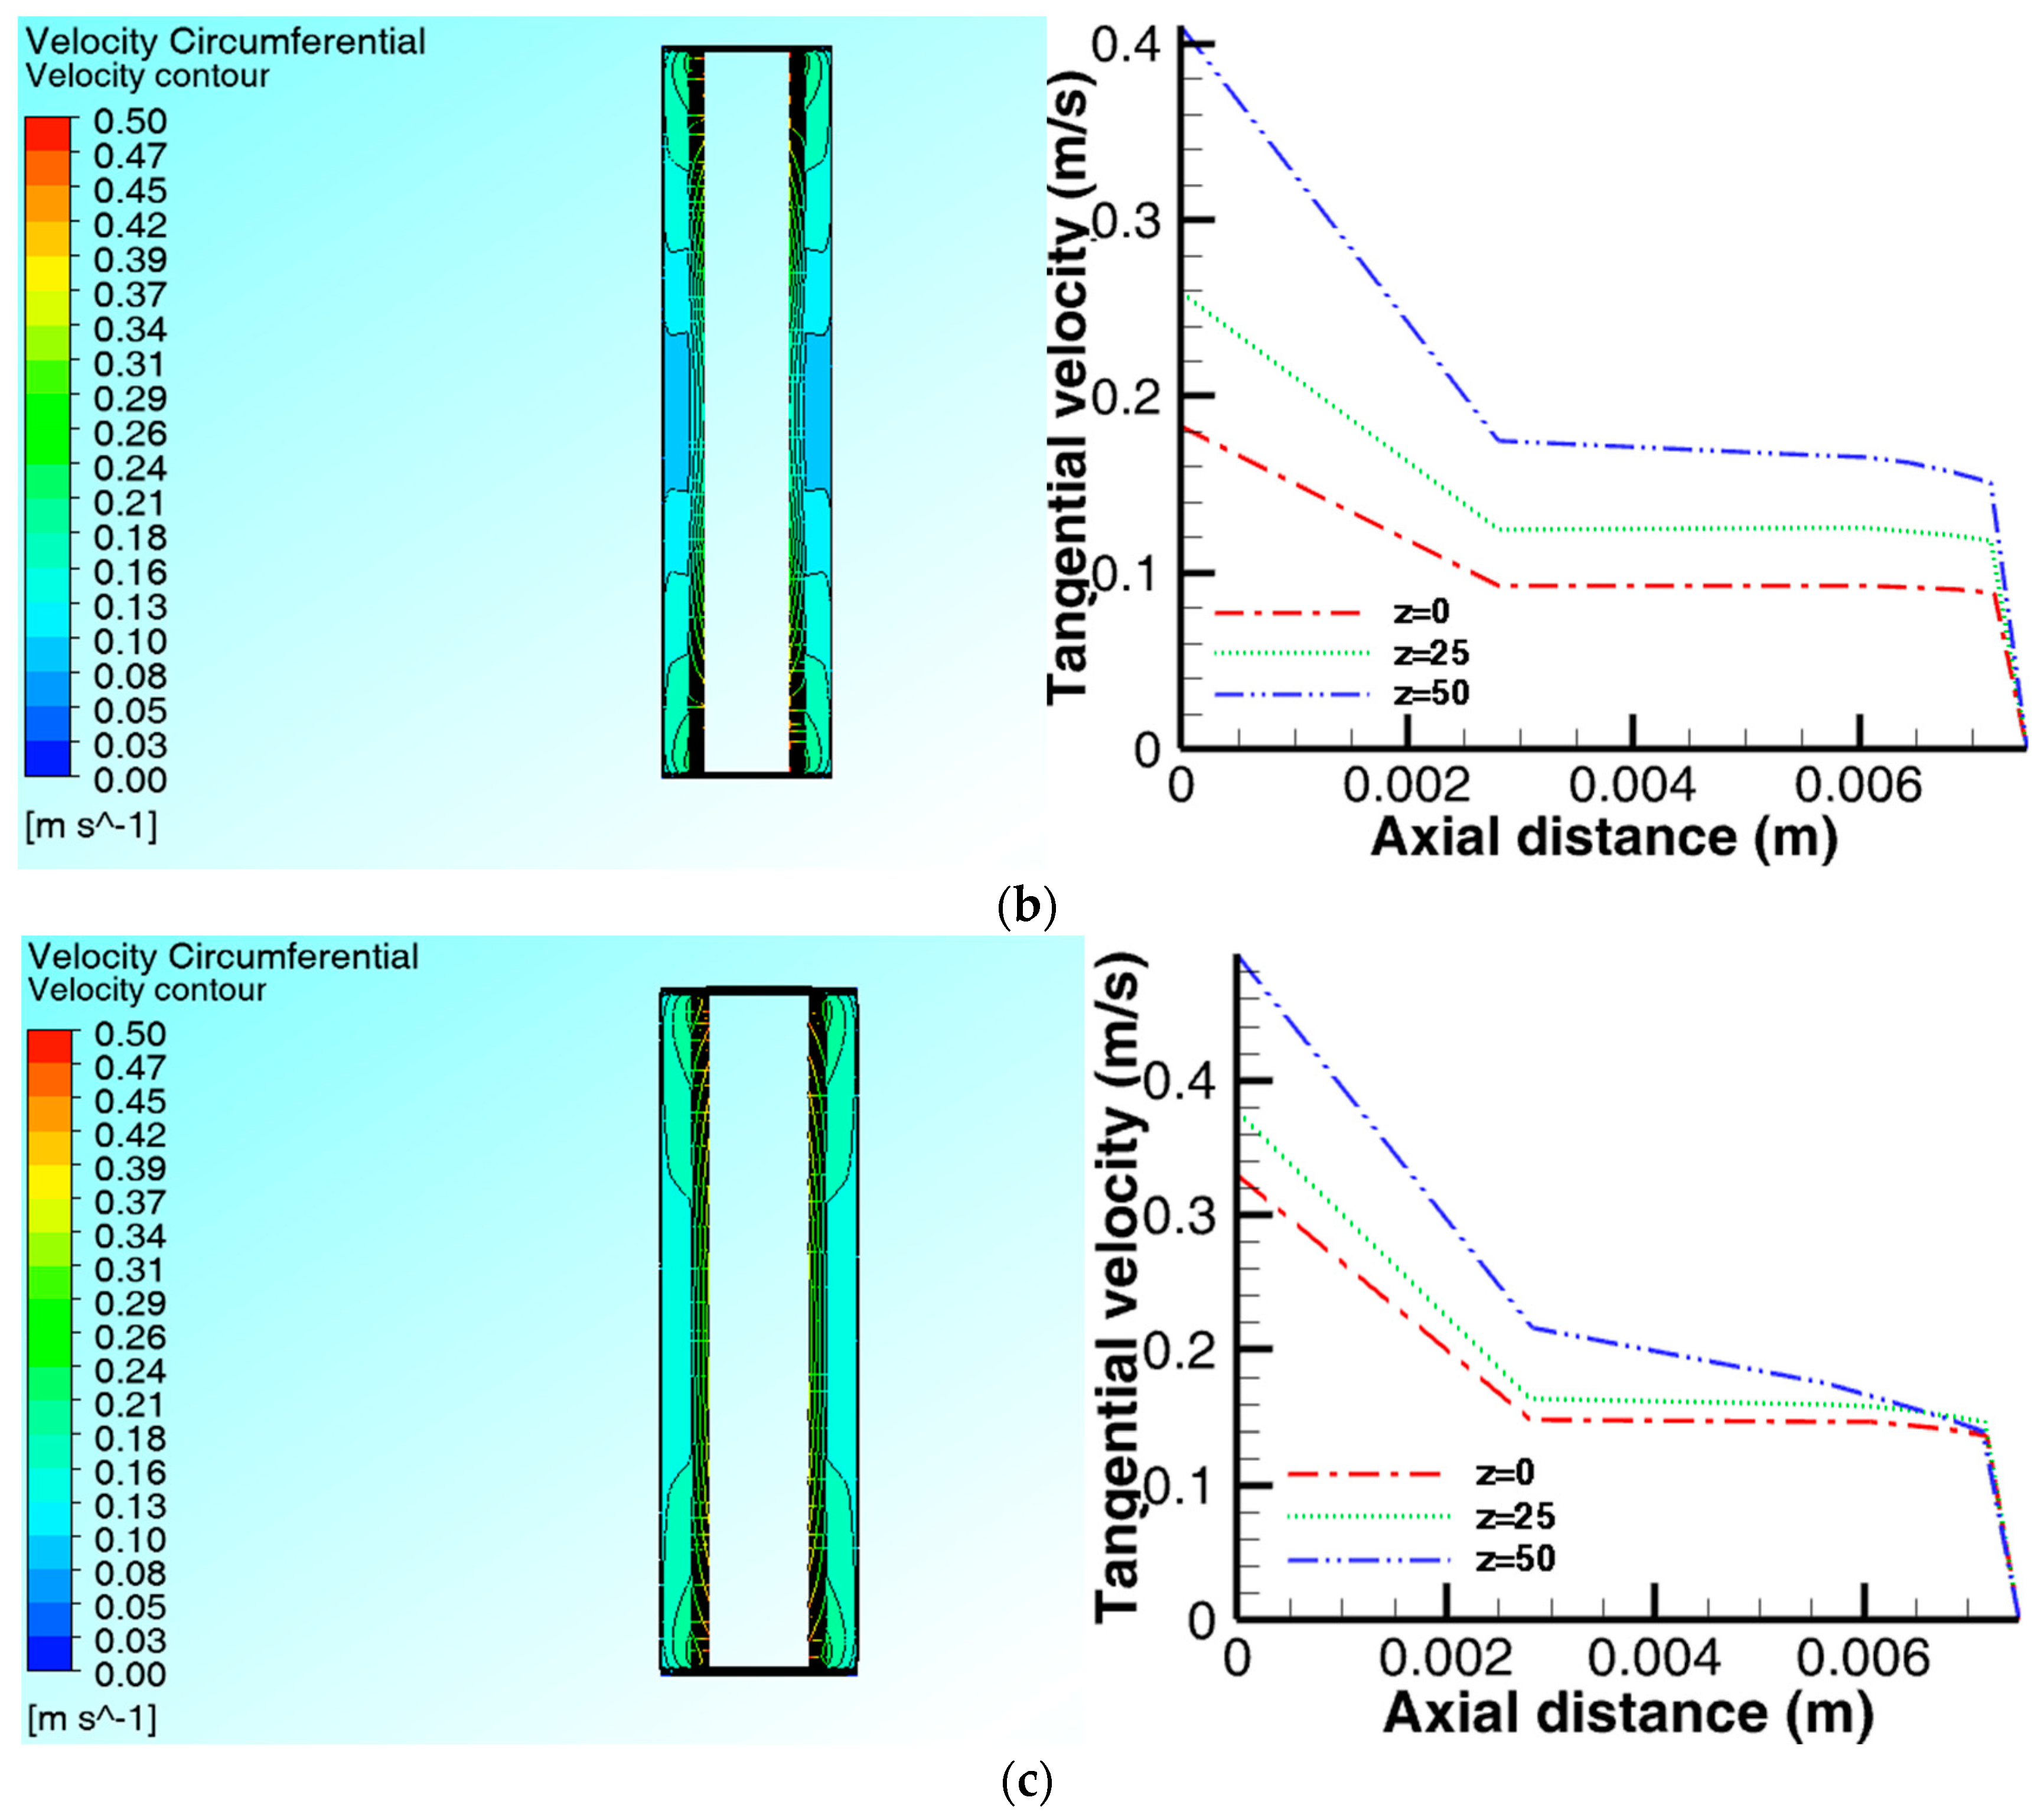
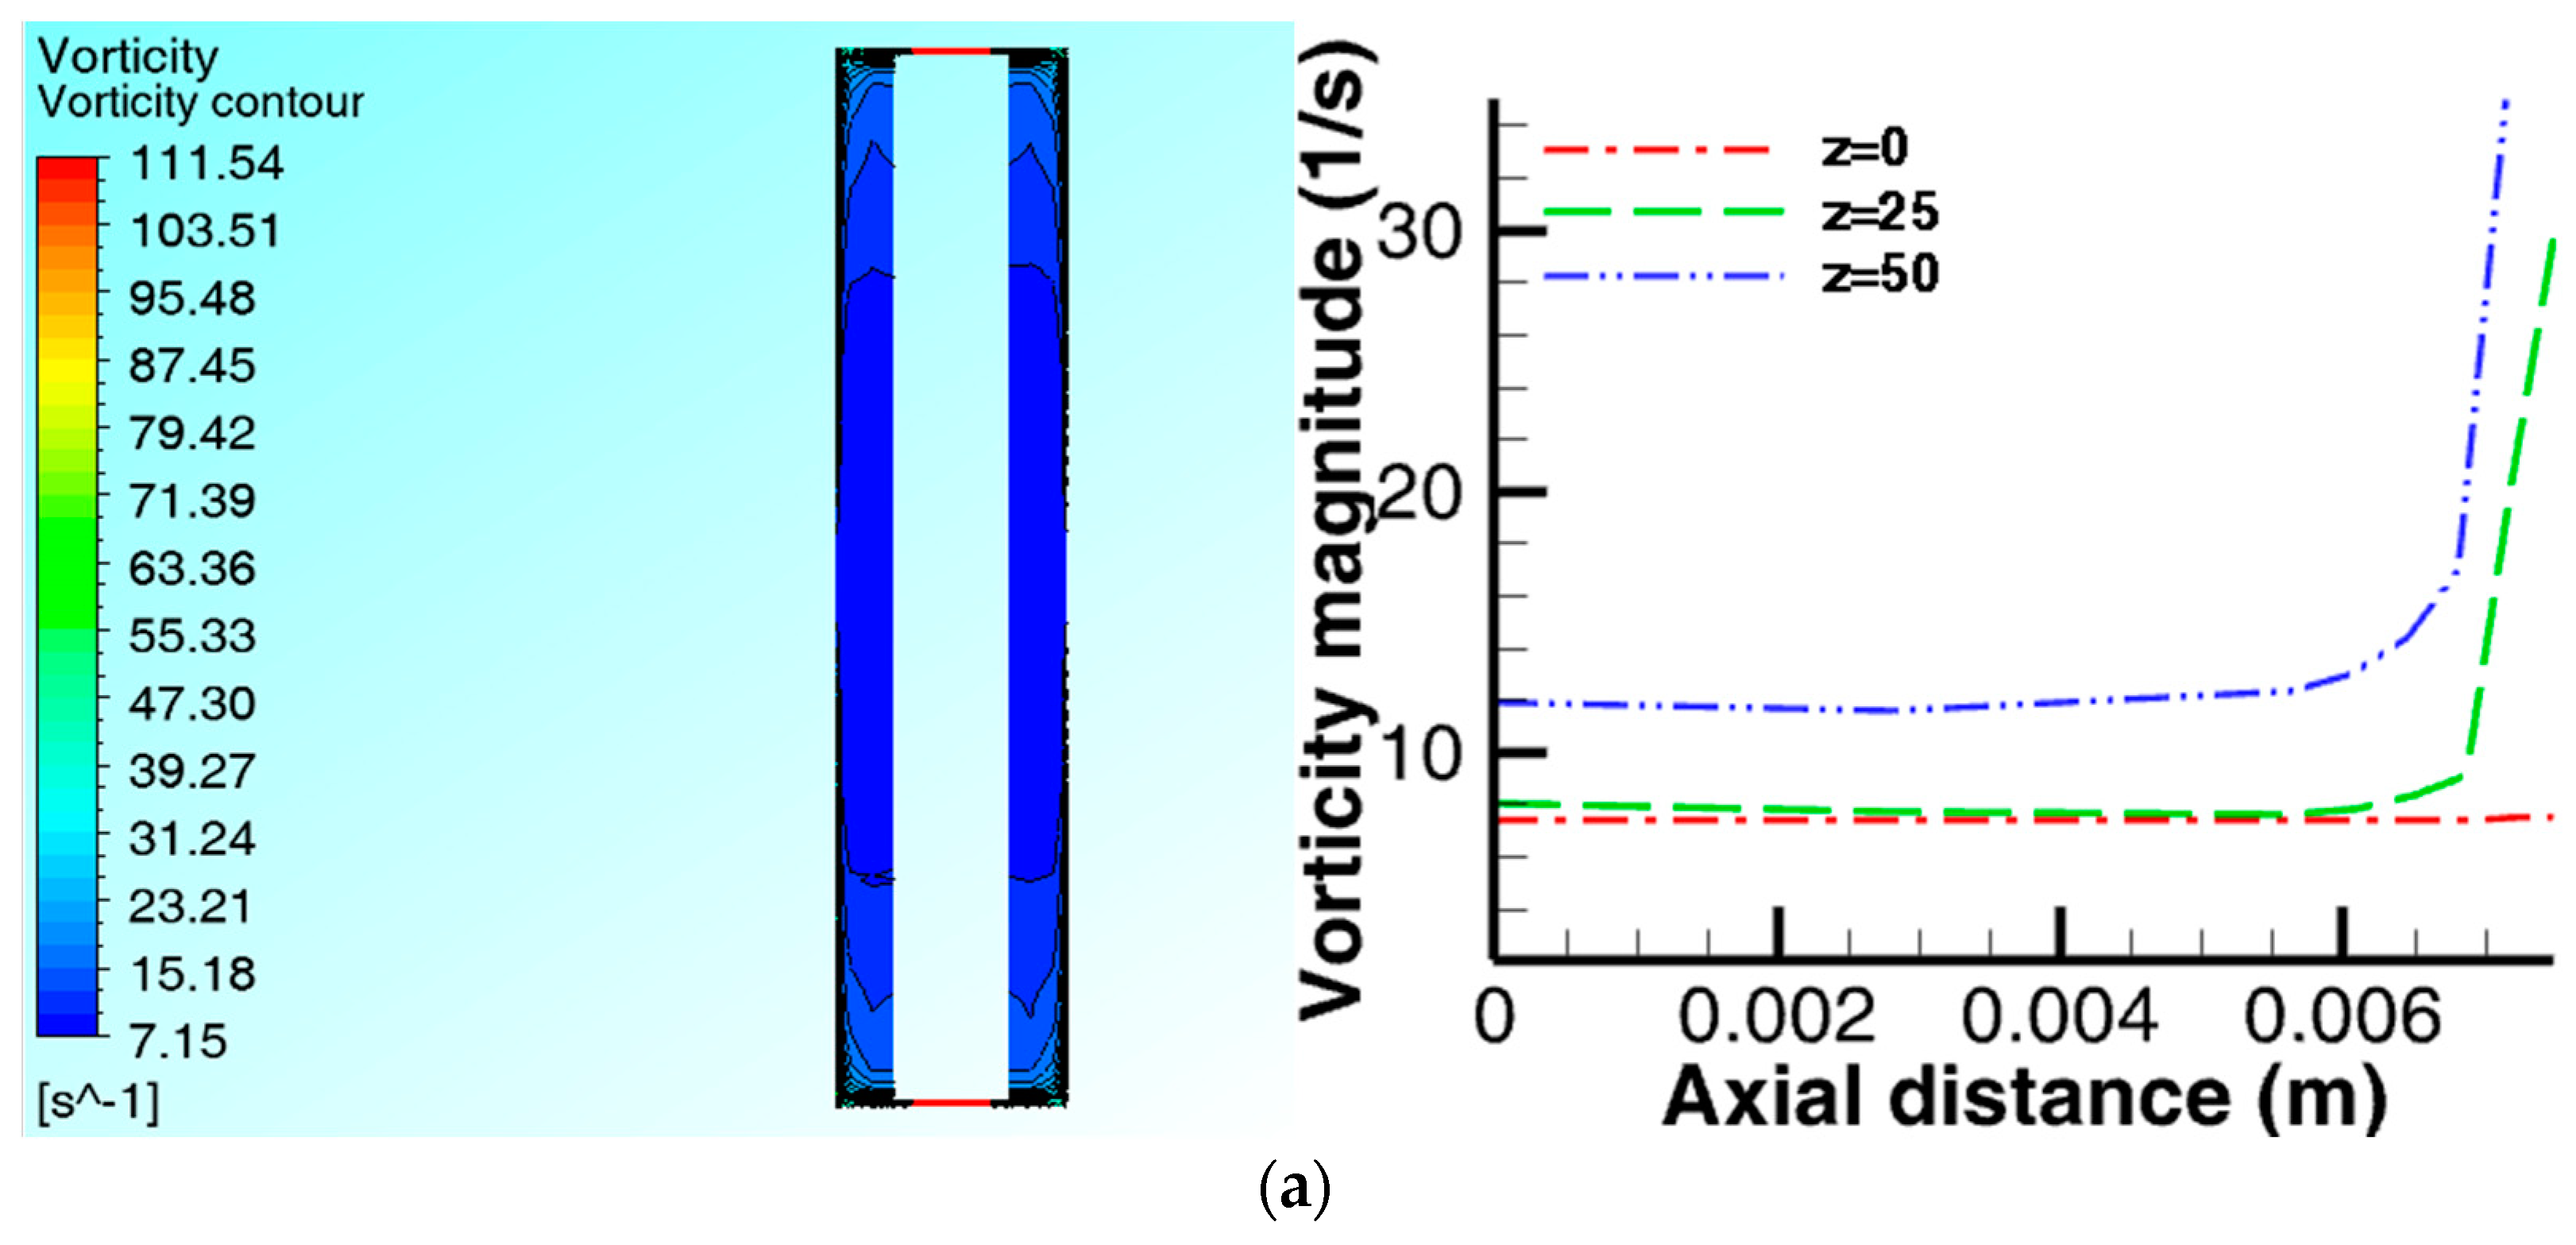
4.1.2. Axial Distribution of the Hydrodynamic Quantities

The tangential velocity Uφ contours and profiles, and the vorticity amplitude ζ contours and profiles on the X-Z plane are shown in Figure 7a–c and Figure 8a–c respectively. The axial tangential velocity distribution shows a pattern consistent with a Batchelor flow profile, except on plane y = 0 near the shaft where the velocity is zero as expected. Figure 7a–c shows a varying pattern of Batchelor velocity profiles, but with distinct separated boundary layers and a central rotating core. By contrast, the width of the rotor boundary layer is slightly longer and the rotating core slightly shorter when compared to the Batchelor profile (Figure 10b). In terms of the axial vorticity amplitude, all the profiles seem to be identical, except on plane y = 0 at the region close to the shaft where the vorticity amplitude remains constant throughout the plane (Figure 8a). Overall, the velocity and the vorticity amplitude increases with the axial plane height with the plane y = 45 recording the highest magnitude. However, there is a region of high vorticity mostly on the outer edge of the rotating disc close to the reactor wall. This observation is quite interesting as it suggests that the clearance between the disc and the reactor wall might strongly influence the vorticity magnitude. The influence of the gap ratio G on the fluid flow cannot be ruled out, and a detailed geometry parametric investigation prior to the scale-up of the reactor in future can yield some useful data for design optimization.

4.1.3. Spatial Distribution of Mixing and Turbulence Intensities

The transport phenomena in any engineered system is often controlled by the fluid properties. In the case of a stirred tank, the turbulence kinetic energy, intensity, or mixing rate of the fluid is the controlling factor [41]. Therefore, in the design of flocculation reactors, it is desirable to have uniform mixing intensities in the agitation vessel. A quantification of spatial turbulence distribution and mixing efficiency is often carried out on the basis of parameters, such as turbulent kinetic energy per unit mass and Reynolds stresses, with the Reynolds stress defined as the time-averaged product of the velocity signal fluctuations in the fluid flow, while the turbulent kinetic energy is the mean kinetic energy per unit mass associated with the turbulent eddies or flow vortex [1,16]. It has been suggested that there is a strong correlation between the stirring behavior in a mixing tank and the turbulence amplitude [16,23]. Flow turbulence within the reactor was investigated at different radial and axial planes to evaluate the mixing efficiency in the reactor. The spatial distribution of the mixing intensities within the reactor expressed as a function of the normal time-averaged Reynolds stresses u u ¯ is shown quantitatively in Figure 9a, while Figure 9b represents the turbulent kinetic energy per unit mass k in terms of the operating speeds at some specific locations in the fluid domain.
In turbulence modelling, the RSM model has been shown to give a better prediction of the turbulence effect when compared to the eddy-viscosity based models, especially for flows in which the assumption of isotropic turbulence does not hold, such as in swirling and rotating flows with strong rotation and streamline curvature [11,42]. However, it is by far more computationally expedient to use the k-ε models and their accuracy can be improved by applying higher order discretization schemes as well as curvature corrections. The radial distribution of the mixing intensity could be seen to increase with the radius, with the highest intensities concentrated on the outer edge of the rotating core, while the axial distribution is almost uniform for the lower planes except at y = 45 and y = 68, where there appeared to be variations in the mixing intensity. In terms of the operating speeds, the mixing intensities increased with the radius and the operating speeds as expected in the radial direction. However, there seemed to be a region of lower mixing intensities at the reactor wheelspace in the rotating core, which means that there was only a marginal improvement in mixing at this location when the operating speed is increased. Overall, the mixing appears to be fairly good except in the region close to the shaft, which showed somewhat low mixing intensities, and in the small area in the outer region of the rotating core with high mixing intensities. One design modification to improve mixing in the region close to the shaft might be the introduction of baffles on the disc to induce more swirling effect. Similarly, in the outer region with high mixing intensities, the clearance between the disc and the wall can be adjusted to make the mixing more uniform.

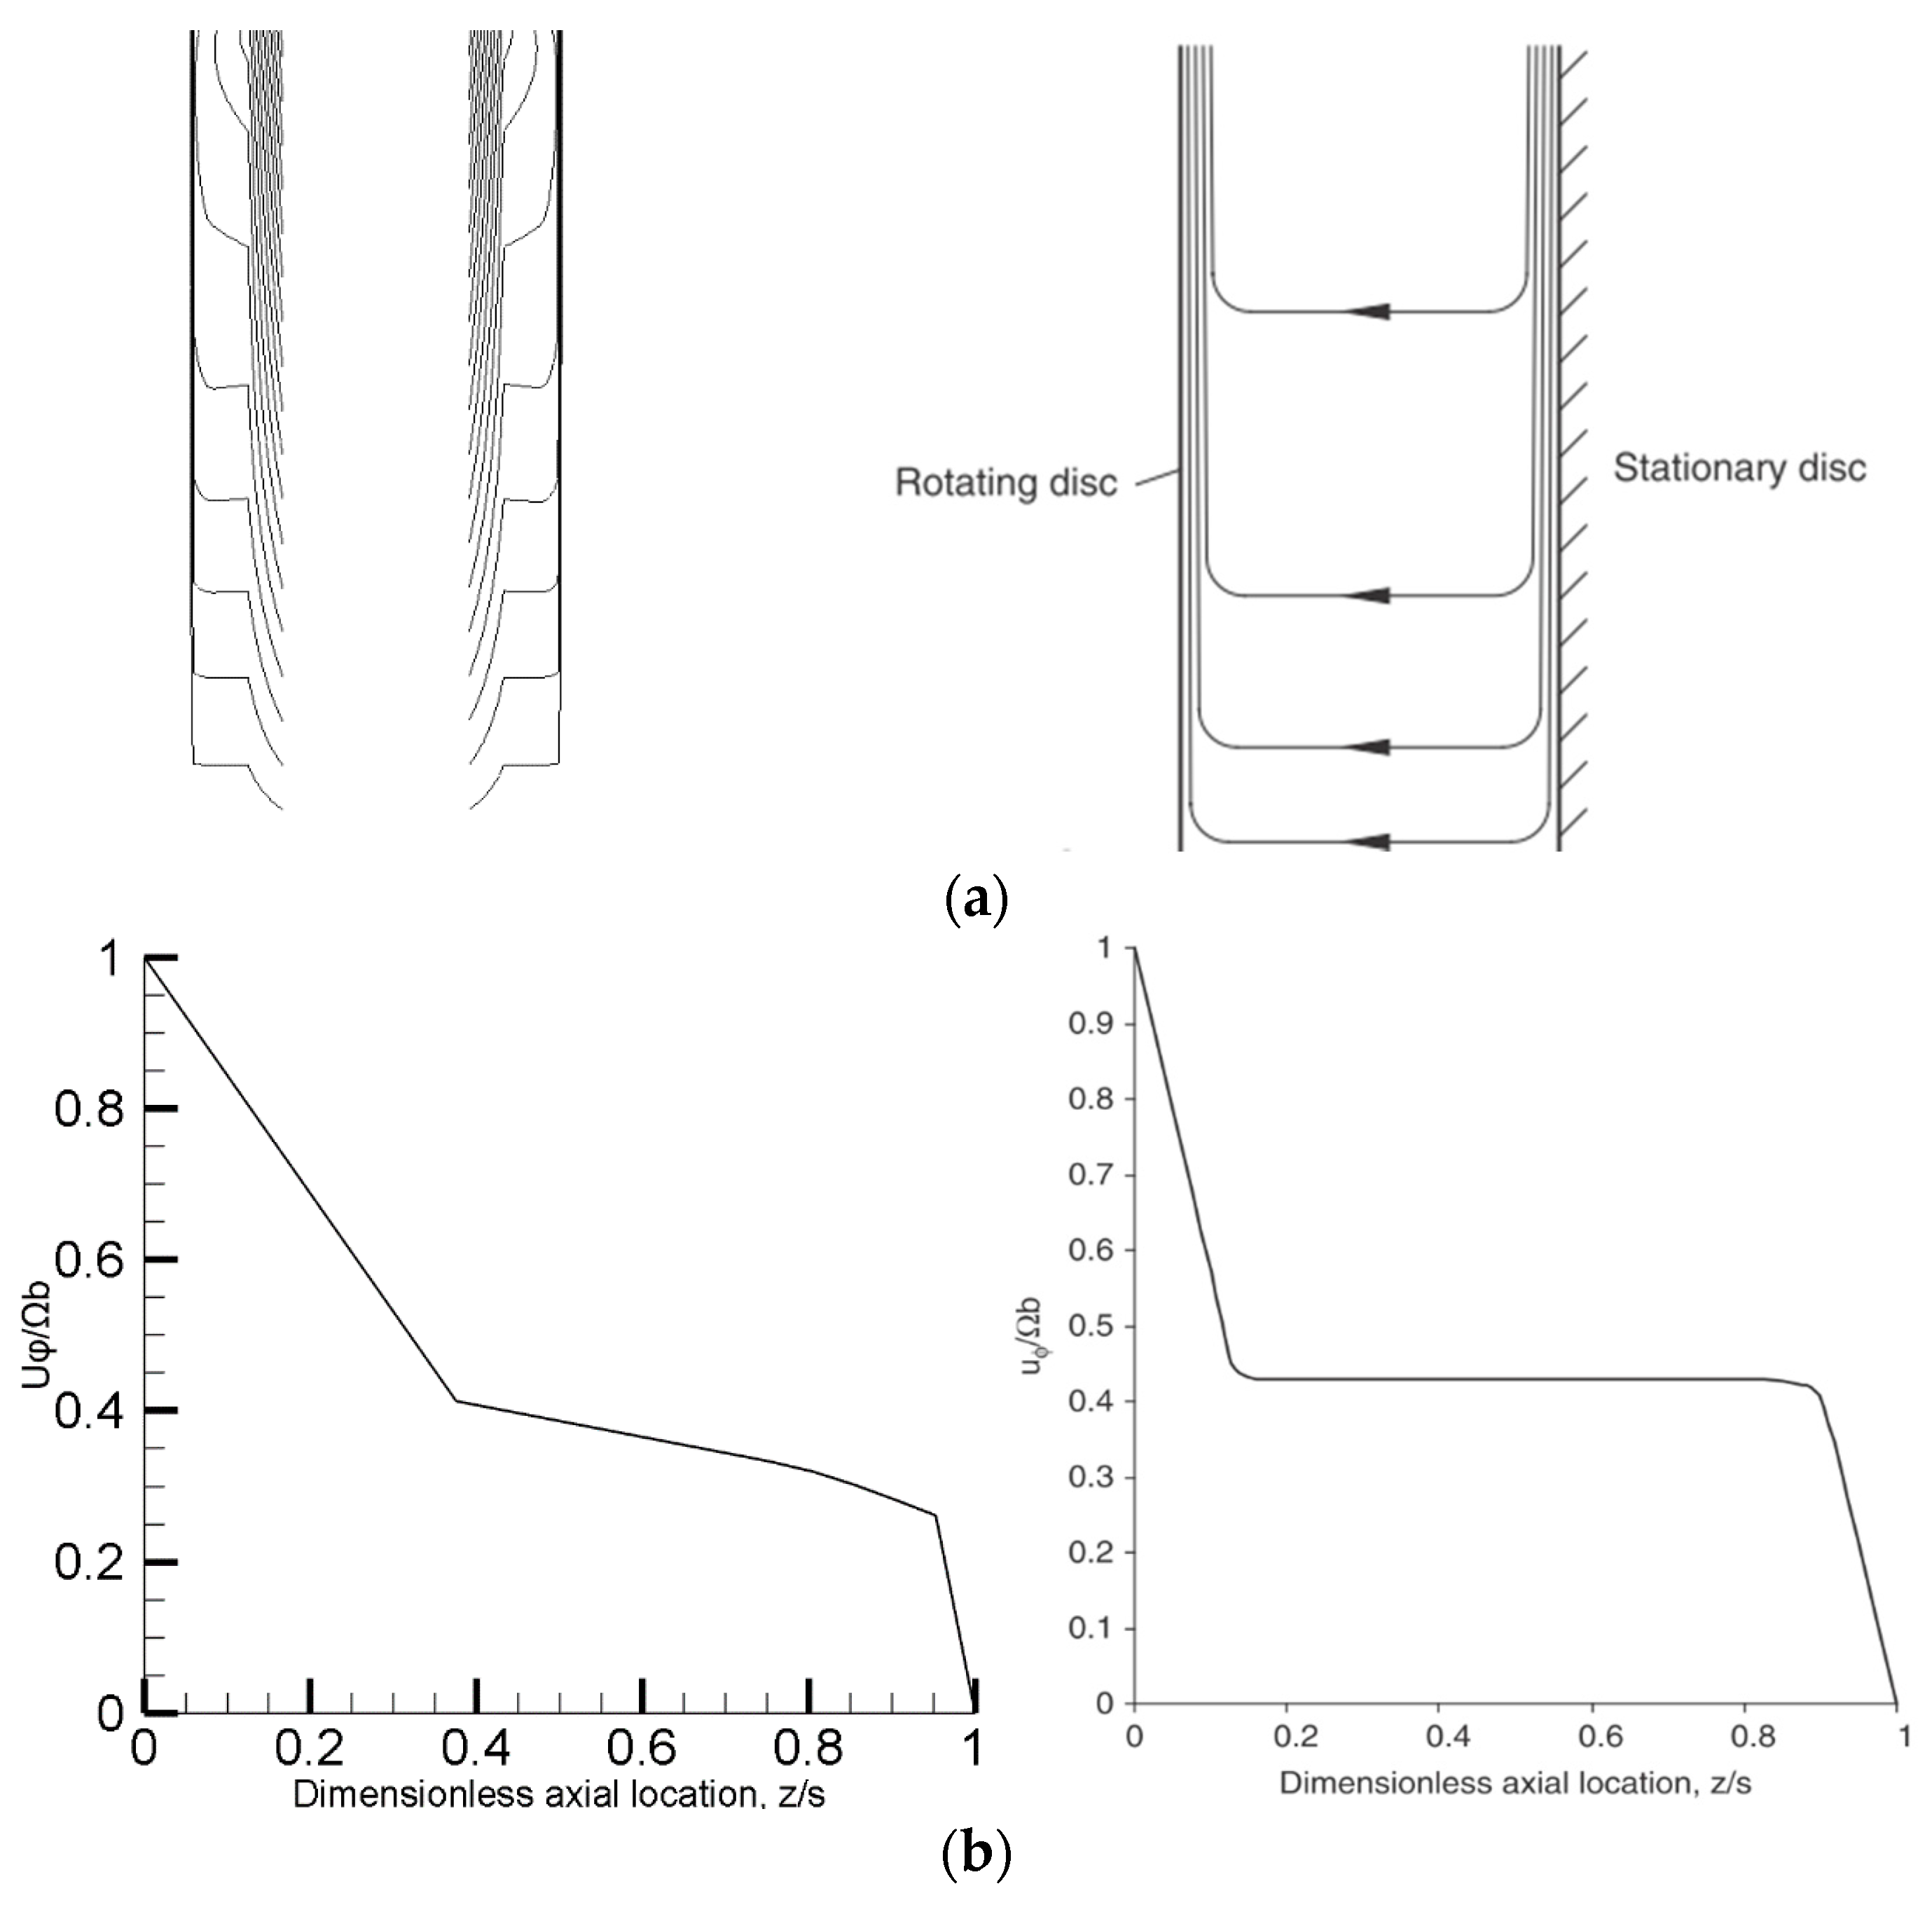
4.1.4. Theoretical Validation of the CFD Model

Figure 10 shows a comparison of the axial tangential velocity distribution on the X-Z plane with the Batchelor model predictions. The axial flow streamline in the agglomeration reactor differed somewhat from the Batchelor model, and it was assumed that this might be due to differences in the configuration of the rotor-stator systems employed for the studies. The streamlines can be significantly influenced by the vessel geometry and the stirrer configuration thereby resulting in different gap ratios and flow streamlines. However, Figure 10b shows the presence of separated boundary layers on the rotor and the stator, and a rotating core is clearly visible, which is consistent with the Batchelor predictions, although with minor variation in terms of the extent of the boundary layers. Overall, all the axial tangential velocity profiles (Figure 7a–c and Figure 10b) of the agglomeration reactor confirm the presence of separated boundary layers on the rotor and the stator, and an inviscid rotating core.

5. Conclusions

A 3-D computational model has been developed to investigate the hydrodynamic characteristics and flow pattern in a rotating disc vortex reactor RVR. A steady state numerical simulation was performed using a single reference frame (SRF) approach to describe the hydrodynamic interaction between the rotating disc and the mixing vessel. A fairly good agreement was obtained between the results of the CFD and the available theoretical and experimental data. A subsequent analysis of the spatial distribution of the hydrodynamic quantities showed that the tangential velocity increased as expected radially across the rotating disc, while decreasing in the axial direction with the vorticity magnitude showing only a marginal increase in the radial direction, except at the annular space between the disc and the reactor wall, while it increased marginally in the axial direction except close to the stator where there was a high vorticity values. With respect to the operating speed, the flow parameters’ values increased as expected with the operating speed across the fluid domain. The investigation was able to meet the study objectives by identifying regions of high vorticity, rotation, and poor mixing within the reactor, which is quite useful information in optimizing the reactor performance.
In terms of the fluid flow pattern, the axial velocity distribution across the wheelspace was characterized by laminar Batchelor flow with separated boundary layers and an inviscid core that rotates at a fraction of the rotor angular velocity with an axial pumping effect towards the shroud. However, the radial tangential velocity profile taken on three planes along the reactor wheelspace shows an almost linear distribution with a somewhat lower magnitude between the tip of the disc and the reactor wall, while the radial vorticity amplitude is nearly constant, except around the tip of the disc. It is anticipated that future studies will address the fluid-particle interactions within the reactor towards a parametric optimization of the wet agglomeration process. A multiphase investigation of the fluid-particle interactions within the reactor will provide an insight into the influence of the hydrodynamics on the temporal and spatial evolution of the species concentration in the reactor. This information will help in understanding the interplay between the micro-hydrodynamics and the physicochemical processes occurring within the reactor.

6. Patents

The reported rotor-stator RVR agglomeration reactor is a patented device registered with the German Patent and Trademark Office, Berlin, Germany, with Patent No. DE10 2015 107 682 A1.

Author Contributions

Conceptualization, B.O. and G.A.; Methodology, B.O. and G.A.; Software, B.O. and M.K.; Validation, B.O. and M.K., Formal Analysis, B.O.; Investigation, Data Curation, B.O. and M.K.; Writing-Original Draft Preparation, B.O.; Writing-Review and Editing, B.O.; Visualization, M.K.; Project Administration, G.A.; Funding Acquisition, B.O. and G.A.

Funding

This research was funded by The World Academy of Sciences TWAS and the National Research Foundation (NRF) under the funding instrument number UID: 105553.

Conflicts of Interest

The authors declare no conflict of interest.

Notations

ReφRotational Reynolds number (-)
ζVorticity magnitude (s−1)
GGap ratio (-)
βSwirl ratio (-)
ρDensity (kg·m−3)
δBoundary layer thickness (m)
nDisc rotational speed (s−1)
xRadial coordinate (m)
zAxial coordinate (m)
rdRotating disc outer radius (m)
sWheelspace or cavity width (m)
µDynamic viscosity (kg·m−1·s−1)
ωDisc or plate angular velocity (rad·s−1)
ωAngular velocity of the rotating core (m·s−1)
ΩDisc tangential or tip velocity (m·s−1)
UφTangential velocity component (m·s−1)
UrRadial velocity component (m·s−1)
UzAxial velocity component (m·s−1)
rDistance along the r-axis (m)
rsShaft radius (m)
rrReactor shroud radius (m)
ϕInitial particle volume fractions (-)

References

  1. Oyegbile, B. Optimization of Micro Processes in Fine Particle Agglomeration by Pelleting Flocculation; CRC Press: Leiden, The Netherlands, 2016; ISBN 978-1-138-02861-6. [Google Scholar]
  2. Bache, D.H.; Gregory, R. Flocs in Water Treatment; IWA Publishing: London, UK, 2007; ISBN 978-1-84339-063-3. [Google Scholar]
  3. Buwa, V.; Dewan, A.; Nassar, A.F.; Durst, F. Fluid Dynamics and Mixing of Single-Phase Flow in a Stirred Vessel with a Grid Disc Impeller: Experimental and Numerical Investigations. Chem. Eng. Sci. 2006, 61, 2815–2822. [Google Scholar] [CrossRef]
  4. Dewan, A.; Buwa, V.; Durst, F. Performance Optimizations of Grid Disc Impellers for Mixing of Single-Phase Flows in a Stirred Vessel. Chem. Eng. Res. Des. 2006, 84, 691–702. [Google Scholar] [CrossRef]
  5. Utomo, A.T.; Baker, M.; Pacek, A.W. Flow Pattern, Periodicity and Energy Dissipation in a Batch Rotor–Stator Mixer. Chem. Eng. Res. Des. 2008, 86, 1397–1409. [Google Scholar] [CrossRef]
  6. Utomo, A.; Baker, M.; Pacek, A.W. The Effect of Stator Geometry on the Flow Pattern and Energy Dissipation Rate in a Rotor-Stator Mixer. Chem. Eng. Res. Des. 2009, 87, 533–542. [Google Scholar] [CrossRef]
  7. Shevchuk, I.V. Modelling of Convective Heat and Mass Transfer in Rotating Flows; Springer: Heidelberg, Germany, 2016; ISBN 978-3-319-20960-9. [Google Scholar]
  8. Childs, R.N.P. Rotating Flow; Elsevier: Oxford, UK, 2011; ISBN 978-0-12-382098-3. [Google Scholar]
  9. Gan, X.P.; MacGregor, S.A. Experimental Study of the Flow in the Cavity between Rotating Disks. Exp. Therm. Fluid Sci. 1995, 10, 379–387. [Google Scholar] [CrossRef]
  10. Cheah, S.C.; Iacovides, H.; Jackson, D.C.; Ji, H.; Launder, B.E. Experimental Investigation of Enclosed Rotor-Stator Disk Flows. Exp. Therm. Fluid Sci. 1994, 9, 445–455. [Google Scholar] [CrossRef]
  11. Tu, J.; Yeoh, G.H.; Liu, C. Computational Fluid Dynamics: A Practical Approach, 3rd ed.; Butterworth-Heinemann: Oxford, UK, 2018; ISBN 978-0-08-101127-0. [Google Scholar]
  12. Crowe, C.T.; Schwarzkopf, J.D.; Sommerfeld, M.; Tsuji, Y. Multiphase Flows with Droplets and Particles, 2nd ed.; CRC Press: Boca Raton, FL, USA, 2011; ISBN 978-1-4398-4050. [Google Scholar]
  13. Naessens, W.; Maere, T.; Nopens, I. Critical Review of Membrane Bioreactor Models—Part 1: Biokinetic and Filtration Models. Bioresour. Technol. 2012, 122, 95–106. [Google Scholar] [CrossRef] [PubMed]
  14. Naessens, W.; Maere, T.; Ratkovich, N.; Vedantam, S.; Nopens, I. Critical Review of Membrane Bioreactor Models—Part 2: Hydrodynamic and Integrated Models. Bioresour. Technol. 2012, 122, 107–118. [Google Scholar] [CrossRef] [PubMed]
  15. Oyegbile, B.; Hoff, M.; Adonadaga, M.; Oyegbile, B. Experimental Analysis of the Hydrodynamics, Flow Pattern and Wet Agglomeration in Rotor-Stator Vortex Separators. J. Environ. Chem. Eng. 2017, 5, 2115–2127. [Google Scholar] [CrossRef]
  16. Thomas, S.F.; Rooks, P.; Rudin, F.; Cagney, N.; Balabani, S.; Atkinson, S.; Goddard, P.; Bransgrove, R.M.; Mason, P.T.; Allen, M.J. Swirl Flow Bioreactor Containing Dendritic Copper-Containing Alginate Beads: A Potential Rapid Method for the Eradication of Escherichia Coli from Waste Water Streams. J. Water Process Eng. 2015, 5, 6–14. [Google Scholar] [CrossRef]
  17. Sievers, M.; Stoll, S.M.; Schroeder, C.; Niedermeiser, M.; Onyeche, T.I. Sludge Dewatering and Aggregate Formation Effects through Taylor Vortex Assisted Flocculation. Sep. Sci. Technol. 2008, 43, 1595–1609. [Google Scholar] [CrossRef]
  18. Wang, X.C.; Jin, P.K.; Yuan, H.L.; Wang, E.R.; Tambo, N. Pilot Study of a Fluidized-Pellet-Bed Technique for Simultaneous Solid/Liquid Separation and Sludge Thickening in a Sewage Treatment Plant. Water Sci. Technol. 2004, 49, 81–88. [Google Scholar] [CrossRef] [PubMed]
  19. Dionysiou, D.D.; Balasubramanian, G.; Suidan(M), M.T.; Khodadoust, A.P.; Baudin, I.; Laîné, J.-M. Rotating Disk Photocatalytic Reactor: Development, Characterization, and Evaluation for the Destruction of Organic Pollutants in Water. Water Res. 2000, 34, 2927–2940. [Google Scholar] [CrossRef]
  20. Loraine, G.; Chahine, G.; Hsiao, C.-T.; Choi, J.-K.; Aley, P. Disinfection of Gram-Negative and Gram-Positive Bacteria Using DynaJets® Hydrodynamic Cavitating Jets. Ultrason. Sonochem. 2012, 19, 710–717. [Google Scholar] [CrossRef] [PubMed]
  21. Kaiser, S.C.; Eibl, R.; Eibl, D. Engineering Characteristics of a Single-Use Stirred Bioreactor at Bench-Scale the Mobius Cellready 3L Bioreactor as a Case Study. Eng. Life Sci. 2011, 11, 359–368. [Google Scholar] [CrossRef]
  22. Gao, X.; Kong, B.; Vigil, R.D. Comprehensive Computational Model for Combining Fluid Hydrodynamics, Light Transport and Biomass Growth in a Taylor Vortex Algal Photobioreactor: Lagrangian Approach. Bioresour. Technol. 2017, 224, 523–530. [Google Scholar] [CrossRef] [PubMed]
  23. Escamilla-Ruíz, I.A.; Sierra-Espinosa, F.Z.; García, J.C.; Valera-Medina, A.; Carrillo, F. Experimental Data and Numerical Predictions of a Single-Phase Flow in a Batch Square Stirred Tank Reactor with a Rotating Cylinder Agitator. Heat Mass Transf. 2017, 53, 2933–2949. [Google Scholar] [CrossRef]
  24. Liu, Z.; Mahdi, R.; Fox, R.O.; Hill, J.C.; Olsen, M.G. Flow Characteristics in a Scaled-Up Multi-Inlet Vortex Nanoprecipitation Reactor. Ind. Eng. Chem. Res. 2015, 54, 4512–4525. [Google Scholar] [CrossRef]
  25. Liu, Z.; Fox, R.O.; Hill, J.C.; Olsen, M.G. A Batchelor Vortex Model for Mean Velocity of Turbulent Swirling Flow in a Macroscale Multi-Inlet Vortex Reactor. J. Fluids Eng. 2015, 137. [Google Scholar] [CrossRef]
  26. Oyegbile, B.; Ay, P.; Narra, S. Optimisation of Micro-Processes for Shear Assisted Solid-Liquid Separation in a Rotatory Batch Flow Vortex Reactor. J. Water Reuse Desalination 2016, 6, 125–136. [Google Scholar] [CrossRef]
  27. Serra, T.; Colomer, J.; Logan, B.E. Efficiency of Different Shear Devices on Flocculation. Water Res. 2008, 42, 1113–1121. [Google Scholar] [CrossRef] [PubMed]
  28. Raffel, M.; Willert, C.E.; Wereley, S.T.; Kompenhans, J. Particle Image Velocimetry: A Practical Guide; Springer: Heidelberg, Germany, 2007; ISBN 978-3-540-72307-3. [Google Scholar]
  29. Adrian, R.J.; Westerweel, J. Particle Image Velocimetry; Cambridge University Press: New York, NY, USA, 2011; ISBN 978-0-521-44008-0. [Google Scholar]
  30. Bridgeman, J.; Jefferson, B.; Parsons, S.A. Computational Fluid Dynamics Modelling of Flocculation in Water Treatment: A Review. Eng. Appl. Comput. Fluid Mech. 2009, 3, 220–241. [Google Scholar] [CrossRef] [Green Version]
  31. Marshall, E.M.; Bakker, A. Computational Fluid Mixing. In Handbook of Industrial Mixing: Science and Practice; Paul, E.L., Atiemo-Obeng, V.A., Kresta, S.M., Eds.; John Wiley & Sons: Hoboken, NJ, USA, 2004; pp. 257–343. ISBN 978-0-471-45145-7. [Google Scholar]
  32. ANSYS, Inc. ANSYS Fluent Theory Guide; 18 February 2017; ANSYS, Inc.: Cannonsburg, PA, USA, 2017. [Google Scholar]
  33. ANSYS, Inc. ANSYS Fluent User’s Guide; 18 February 2017; ANSYS, Inc.: Cannonsburg, PA, USA, 2017. [Google Scholar]
  34. Lian, G.; Moore, S.; Heeney, L. Population Balance and Computational Fluid Dynamics Modelling of Ice Crystallisation in a Scraped Surface Freezer. Chem. Eng. Sci. 2006, 61, 7819–7826. [Google Scholar] [CrossRef]
  35. Das, S.; Bai, H.; Wu, C.; Kao, J.-H.; Barney, B.; Kidd, M.; Kuettel, M. Improving the Performance of Industrial Clarifiers Using Three-Dimensional Computational Fluid Dynamics. Eng. Appl. Comput. Fluid Mech. 2016, 10, 130–144. [Google Scholar] [CrossRef]
  36. Schellander, D. CFD Simulations of Particle Laden Flow: Particle Transport and Separation; Anchor Academic Publishing: Hamburg, Germany, 2014; ISBN 978-3-95489-171-9. [Google Scholar]
  37. Norouzi, H.R.; Zarghami, R.; Sotudeh-Gharebagh, R.; Mostoufi, N. Coupled CFD-DEM Modeling: Formulation, Implementation and Application to Multiphase Flows; John Wiley & Sons: Chichester, UK, 2016; ISBN 978-1-119-00513-1. [Google Scholar]
  38. Higashitani, K.; Shibata, T.; Matsuno, Y. Formation of Pellet Flocs from Kaolin Suspension and Their Properties. J. Chem. Eng. Jpn. 1987, 20, 152–157. [Google Scholar] [CrossRef]
  39. Walaszek, W.; Ay, P. Pelleting Flocculation—An Alternative Technique to Optimise Sludge Conditioning. Int. J. Miner. Process. 2005, 76, 173–180. [Google Scholar] [CrossRef]
  40. Liu, M. CFD Modeling of Stirred Tank Reactors. In Advances in Industrial Mixing: A Companion to the Handbook of Industrial Mixing; Etchells, A.W., Dickey, D.S., Atiemo-Obeng, V.A., Eds.; John Wiley & Sons: Hoboken, NJ, USA, 2016; ISBN 978-0-470-52382-7. [Google Scholar]
  41. Oyegbile, B.; Ay, P.; Narra, S. Flocculation Kinetics and Hydrodynamic Interactions in Natural and Engineered Flow Systems—A Review. Environ. Eng. Res. 2016, 21, 1–14. [Google Scholar] [CrossRef]
  42. Michaelides, E.; Crowe, C.T.; Schwarzkopf, J.D. (Eds.) Multiphase Flow Handbook, 2nd ed.; CRC Press: Boca Raton, FL, USA, 2016; ISBN 978-1-4987-0100-6. [Google Scholar]
Figure 1. Schematic illustration of the reactor configuration and flow profiles: (a) RVR reactor, and (b) rotor-stator flow boundary layers showing the tangential velocity and vorticity amplitude profiles on the rotating disc (Reproduced from [8] with permissions © 2011 Elsevier).
Chemengineering 02 00032 g001
Figure 2. Schematic illustration of the Particle Image Velocimetry (PIV) set-up.
Chemengineering 02 00032 g002
Figure 3. Graphical illustration of the simplified reactor solid model and the generated computational grid for the numerical simulation. (a) CAD model; (b) Hex mesh.
Chemengineering 02 00032 g003
Figure 4. Influence of the computational grid size on the computed tangential velocity profiles on radial Y-Z and axial X-Z planes for the RNG k-ε model at 70 rpm for (a) x = 0.003725; (b) y = 0.045.
Chemengineering 02 00032 g004
Figure 5. Reactor cross sections showing the velocity vector fields and contours for the RNG-k-ε model and the radial tangential velocity profiles along the Y-Z plane at N = 70 rpm: (a) rotating disc boundary layer; (b) x = 0.0015; (c) x = 0.003725; (d) x = 0.006.
Chemengineering 02 00032 g005
Figure 6. Reactor cross sections showing the vorticity vector maps and contours RNG-k-ε model and radial vorticity magnitude profiles along Y-Z plane at N = 70 rpm (a) rotating disc boundary layer; (b) x = 0.0015; (c) x = 0.003725; (d) x = 0.006.
Chemengineering 02 00032 g006
Figure 7. Reactor cross-sections showing the velocity contours and axial tangential velocity profiles along three horizontal lines in the X-Z plane at N = 70 rpm with the RNG model: (a) y = 0; (b) y = 0.025; (c) y = 0.045.
Chemengineering 02 00032 g007aChemengineering 02 00032 g007b
Figure 8. Reactor cross-sections showing the vorticity contours and axial vorticity magnitude profiles along three horizontal lines on X-Z plane at N = 70 rpm with the RNG model: (a) y = 0; (b) y = 0.025; (c) y = 0.045.
Chemengineering 02 00032 g008aChemengineering 02 00032 g008b
Figure 9. Spatial distribution of the turbulence and mixing intensities (a) Reynolds stress distributions on the Y-Z plane at x = 0.0015, 0.003725, and 0.006, and X-Z plane parallel to the shaft at y = 0, 0.025, 0.045, and 0.068. (b) Turbulent kinetic energy distribution on the Y-Z plane at x = 0.003725 and X-Z plane parallel to the shaft at y = 0.025 for N = 70–130 rpm.
Chemengineering 02 00032 g009
Figure 10. Flow streamlines for a cross sections of the reactor wheelspace and normalized axial tangential velocity profiles on X-Z plane at N = 70 rpm: (a) cross sections of the CFD and Batchelor models; (b) tangential velocity profile of the CFD and Batchelor models at y = 0.068 [8].
Chemengineering 02 00032 g010
Table 1. Theoretical values of the flow quantities at different operating speeds near the rotating disc boundary layer.
Operating ConditionHydrodynamic Parameters
Operating Speeds (rpm)Disc Rotational Reynolds Number (-)Disc Tip Velocity (m·s−1)Disc Vorticity (s−1)
702.59 × 1040.498514.662
903.33 × 1040.641018.852
1104.07 × 1040.783423.041
1304.81 × 1040.925827.231

