Abstract
Some contaminants of emerging concern (CECs) are known to survive conventional wastewater treatment, which introduces them back to the environment, allowing them to potentially cycle into drinking water. This is especially concerning because of the inherent ability of some CECs to induce physiological effects in humans at very low doses. Advanced oxidation processes (AOPs) such as TiO2-based photocatalysis are of great interest for addressing CECs in aqueous environments. Natural water resources often contain dissolved metal cation concentrations in excess of targeted CEC concentrations. These cations may significantly adversely impact the degradation of CECs by scavenging TiO2 surface generated electrons. Consequently, simple pseudo-first-order or Langmuir-Hinshelwood kinetics are not sufficient for reactor design and process analysis in some scenarios. Rhodamine Basic Violet 10 (Rhodamine B) dye and dissolved [Cu2+] cations were studied as reaction surrogates to demonstrate that TiO2-catalyzed degradation for very dilute solutions is almost entirely due to the homogeneous reaction with hydroxyl radicals, and that in this scenario, the hole trapping pathway has a negligible impact. Chemical reaction kinetic studies were then carried out to develop a robust model for RB-[Cu2+] reactions that is exact in the electron pathways for hydroxyl radical production and electron scavenging.
1. Introduction
There is a critical need for highly-efficient, new methods for the treatment of toxic and biologically persistent compounds that are not efficiently removed by conventional water treatment processes. This need has led to a large amount of interest in semiconductor photooxidative degradation. Semiconductor-based photocatalysis is an advanced oxidation process (AOP) that shows promise for the removal of organic pollutants from water [1,2,3]. Ultra Violet (UV) enhanced photocatalysis is also an effective method for disinfection, similar in application to existing UV enhanced chlorination water disinfection processes [4,5].
Semiconductor photocatalysis can be more appealing than the more conventional chemical oxidation methods because semiconductors are inexpensive, nontoxic, and capable of extended use without substantial loss of photocatalytic activity [6]. The development of photocatalytic routes that rely on light as an energy source to drive chemical reactions under mild reaction conditions is highly desirable. Furthermore, semiconductor particles recovered by filtration or centrifugation retain much of their native activity after repeated catalytic cycles. The term photodegradation is usually used to refer to complete oxidative mineralization, i.e., the conversion of organic compounds to CO2, H2O, NO3 or other oxides, halide ions, phosphates, etc. It has been widely demonstrated that the semiconductor TiO2 is an effective photocatalyst for the destruction of many organic contaminates. [7,8,9,10,11]. Halogenated substrates [12] have been decomposed successfully on irradiated semiconductor suspensions. When fluoroalkenes [13] or fluoroaromatics [14] were exposed to an irradiated, air-saturated, aqueous suspension of anatase TiO2 with UV light at room temperature, CO2 and HF were formed. The irradiation of a solution of chlorobenzene over TiO2 similarly leads to complete mineralization to CO2, H2O, and HCl [15]. Extensive studies of the photocatalytic degradation of organochlorine compounds have been undertaken because of their known carcinogenicity, and because they are formed during water purification by chlorination. Perchloroethylenes, chloroethanes, chlorinated acetic acids, and chlorobenzenes, for example, are all readily mineralized on irradiated TiO2 suspensions. Chloroform and carbon tetrachloride, other common contaminants of municipal water supplies, are also mineralized [16,17,18,19] by UV irradiated TiO2. The primary photochemical processes occurring upon irradiation of a semiconductor are now well established [20,21,22,23]. Many of the intermediates leading to mineralization of organic substrates on aqueous TiO2 suspensions are hydroxylated [24,25]. Numerous studies have assumed competing roles for photo-generated OH radicals and for trapped holes in photocatalysis [26,27,28,29,30,31]. Reaction kinetic mechanisms have been proposed that suggest that at low substrate coverages associated with low concentrations, the photo-generated hydroxy radical diffuses into the homogeneous solution where it effects photooxidation, while it reacts at the surface when the substrate is present at higher coverages. This suggests that for low concentrations, the homogeneous OH radical production by the electron pathway is favored over the surface mediated hole pathway [32]. Furthermore, the OH radical dye degradation pathway is also favored over the direct hole pathway in a similar fashion.
The class of contaminants targeted by our reactor design includes Pharmaceuticals and Personal Care Products (PPCP) and other contaminants of emerging concern (CECs) which are environmentally significant at low part-per-billion (ppb) levels [33]. Rhodamine B (RB) dye was used as a surrogate for our chemical reaction kinetics for contaminants at these levels. We used [Cu2+] as the metal cation scavenger, specifically in order to compare our results with Aarthi and Madras, 2004 [34]. Rhodamine dye, a significant water contaminant in its own right, is easily measured at nanogram per liter levels due to its fluorescence properties, making it an ideal candidate for this concentration range.
Simple pseudo first order or Langmuir-Hinshelwood kinetics may be used to model a particular CEC/scavenger system, but these approximations do not necessarily inform a broader application to CECs in aqueous environments. The role of substrate adsorption in photocatalysis can be modeled by use of the Langmuir-Hinshelwood (LH) kinetics model applied to reactions occurring at a solid-liquid interface. LH model kinetics assume that the surface coverage of the substrate (θ) is related to the initial concentration and the apparent adsorption equilibrium constant K as:
Therefore, the pseudo first order rate of degradation of the dye can be written in terms of single component LH kinetics as:
The following expression has been suggested to account for reactions involving competition between two or more species for a single adsorption site:
Generally, the linearity of the plot of 1/r[LH] versus 1/C tests the validly of the LH model and the parameters k and K are derived from the slope and y intercept of the linear fit to the plot. This linearity is often interpreted as proof of preadoption of the substrate before reaction, but this is often not the case, and clearly not the sole reaction pathway for our model. As a matter of fact, studies have shown that the same LH rate expression is obtained for adsorbed and free substrates [35]. Consequently, while the LH model avoids the necessity for a complex mathematical treatment and the need for several experimentally undeterminable parameters, it has severe limitations for probing the underlying chemical kinetics and mass transfer mechanisms.
The kinetic model reported in this work for the photocatalytic degradation of dyes is an extension of the models reported in previous studies [34,36,37]. The substrate concentrations studied here are an order of magnitude lower than these studies, with the specific goal of going a step beyond the lumped parameter models of these studies for the low concentration regime. The resulting model is robust, and its parameters are the chemical reaction rate constant for the dye degradation and the adsorption equilibrium constants for the dye and Cu2+ respectively. This is notable importance because these parameters can be determined individually, independent of intermediate parameters that cannot be determined experimentally; this is not the case with lumped parameter approaches. The detailed mechanisms for the chemical kinetics and mass transfer are provided in Appendix A. The kinetics and mass transfer mechanisms in Appendix A are exhaustive in the possible pathways for the degradation of organic water contaminants by TiO2 catalyzed photocatalysis, and the low concentration regime model is generic, in that its parameters are specific to a particular contaminant retardant system. Contaminants that degrade in this manner are therefore surrogated by the Rhodamine B/[Cu2+] experiments. The results below support our hypotheses, i.e., that a mechanistic approach of the surrogate reaction kinetics based on the limiting nature of the kinetics for dilute solutions would provide a more robust model for the reaction kinetics than a simple curve fitting or lumped parameter approach. In other words, it provides additional insight into the underlying complex interaction of reaction kinetics and adsorption equilibrium processes. This was especially important since our study also addressed the impact of transition metal cations typically present in drinking water supplies.
2. Materials and Methods
Titanium (IV) oxide, in the form of anatase nano-powder with particle size <25 nm and 99.7% purity basis from Sigma-Aldrich Chemistry, St. Louis, MO, USA, was used as the photocatalytic material. Serial dilutions of 20% aqueous solution of Acros Organics’ Rhodamine B and reagent grade Fisher Scientific CuSO4 were used for all experimental runs. Solutions of RB concentrations [D] ranging from 0.1–0.5 mg/L and copper cation concentration [Cu2+] ranging from 0.0–0.5 mg/L with 0.02 mg/L suspended P-25 catalyst were irradiated in a 2.0 L, cylindrical quartz glass bench scale reactor equipped with 365 nm LED lamps [38]. The inside diameter and reaction depth of the cylindrical reactor were 15 and 20 cm respectively; it was equipped with 300, 3 mW, 365 nm output lamps (NSHU5518), evenly distributed over its approximately 1000 cm2 surface. The reaction system temperature was monitored and kept approximately constant at 298 K by fan cooling. Magnetic stirring was used to maintain homogeneity and catalyst suspension. The water supply was distillated and deionized. The reaction volume was 1 L, and stirring speed was approximately 100 rpm for all experiments. The reactor was initially stirred for 20 min without UV irradiation to reach the equilibrium adsorption/desorption of the dye on the catalyst. After 20 min, the UV light was turned on and an initial sample was taken; subsequent samples were taken hourly. The sample volume was 2.0 mL. Samples were centrifuged and pipetted for before measurement. A Turner Designs fluorimeter model TD-700 was used to measure the concentration of the dye in each sample. The fluorimeter was calibrated every day with freshly prepared standards. Samples were diluted to remain in the linear range for the TD-700 for Rhodamine B of 0.001 to 0.100 mg/L [39].
3. Results and Discussion
The detailed stoichiometric balances in Appendix A, and application of the quasi-steady state assumption (QSSA) for all species, leads to [34,36,37]:
where rD is the dye degradation rate and K2 and K6 are adsorption equilibrium constants for the RB and [Cu2+] respectively as described by Equations (A18a) and (A20b). k1, k3 and k4 are chemical reaction rate constants for various intermediate species described in Appendix A as Equations (A17b), (A18b) and (A18c) respectively. Throughout Appendix A and Equations (4)–(7), the constants designated by lower-case k’s designate reaction rate constants and upper-case K’s designate adsorption equilibrium constants. The reaction rate constants and adsorption equilibrium constants are derived from the detailed stoichiometry equations given by Equations (A1)–(A8c). The reaction between the substrate and a photo-generated oxidant can occur while both species are adsorbed, with an adsorbed substrate and a free oxidant, with a bound oxidant and a free substrate, or with both the oxidant and substrate freely dissolved. Unfortunately, an experimental distinction between these pathways, based on chemical kinetics alone (fitting reaction data to Equation (4)), is not possible. Our model addresses this by providing a robust parametrization of Equation (4) by capitalizing on the preference of the electron pathway for dilute solutions with low surface substrate coverage.
Equation (4) can be simplified by inverting both sides and then neglecting the squared [D] terms to give:
where k0, koh and k7 are given by Equations (A17a), (A22a) and (A22b) respectively. A further simplification to Equation (5) is obtained by setting [Cu2+] equal to zero:
where is the initial dye degradation reaction rate.
The above parameters, that were determined from the experimental data in order to parameterize the model, were k0, K2, k7 and K6. Equation (6) represents a linear relationship between the inverse of the initial reaction rate (1/rD0) and the inverse of the dye concentration (1/[D]) with slope 1/k0 and intercept K2/k0 for the case where [Cu2+] = 0. A series of experimental runs were then conducted with [Cu2+] = 0 and for various initial values of [D] ranging from 0.1 to 0.5 mg/L. The initial reaction rates for these runs was fit to Equation (6), as shown in Figure 1. The slope and intercept of the plot gave k0 = 0.008 min−1 and K2 = 0.019 L/mg. A series of runs was then conducted with the initial concentration of the dye [D] at 0.5 mg/L and for [Cu2+] ranging from 0.0625 to 0.5 mg/L. Using the values of k0 and K2 obtained from Equation (6), the data was regressed non-linearly to fit Equation (5) as shown in Figure 2. The resulting values K6 = 5.5 L/mg and k7 = 0.0001 min−1 respectively.
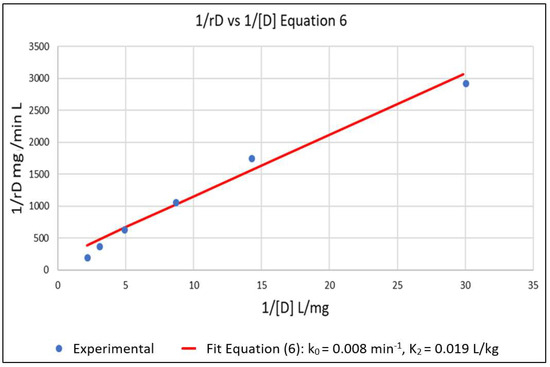
Figure 1.
Setting [Cu2+] = 0 in Equation (5) gives Equation (6) which is linear in 1/rD versus 1/[D]. This allowed for the estimation of k0 and K2 from the slope and intercept of the plot. k0 = 0.008 min−1 and K2 = 0.019 L/mg.
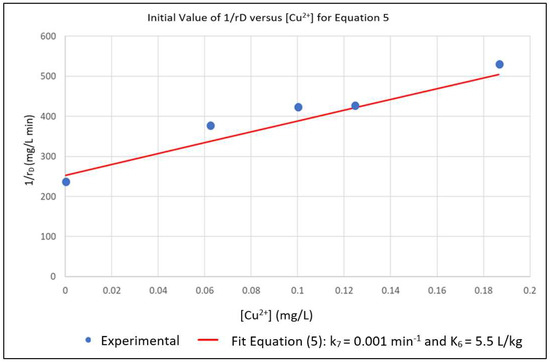
Figure 2.
Nonlinear Multiple Regression of Experimental rD in Terms of k7 and K6.
Setting the small value for k7 obtained from the numerical fit of the experimental data to zero has a cascade effect when interpreted in terms of the stoichiometric equations in Appendix A. Firstly, Equation (A22a) immediately gives kOH = 0, indicating that the reaction rate constants khr,a and khr,b in Equations (A7a) and (A7b), representing the direct hole dye degradation pathway, are negligibly small. Secondly, combining Equations (A22a) and (A22b) gives k0 = k1k4; finally, interpretation of Equation (A22b) in terms of these results gives k3 = 0, indicating that the reaction rate constants ktr,a and ktr,b in Equations (A3a) and (A3b) representing the direct hole hydroxyl radical production pathway are also negligibly small. Incorporating these results into Equation (4) leads to the desired low concentration regime model:
which that is first order in [D] and limited by [D] and [Cu2+] TiO2 surface adsorption. The resulting electron pathway for RB degradation shown by the green arrows in Scheme 1 is an exact mechanism for the limiting conditions and assumptions.
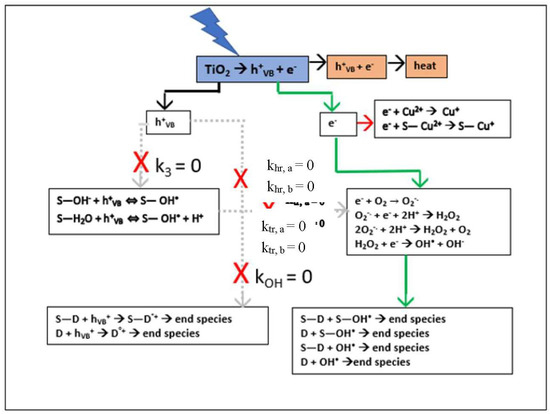
Scheme 1.
Simplified Electron Pathway Model (Equation (7)) for Low Concentration and [Cu2+] as Scavenger.
The model is validated by fitting it to the experimental data in Figure 3. The concentration versus time plots for [Cu2+] ranging from 0–0.375 mg/L are shown in Figure 4. The experimental concentration data are accurately fitted by the pseudo-first-order reaction kinetics constants, ranging from 0.002–0.008 min−1; the three parameter LH model (Equation (3)) would give an even more accurate representation of the data. Furthermore, Equation (7) is very similar to the LH result in Equation (3), rewritten here in terms of [D] and [Cu2+] and using the nomenclature of Equation (7) as:
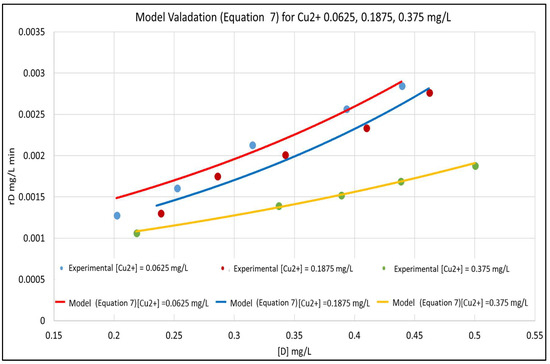
Figure 3.
Model Validation for [Cu2+]: 0.0625, 0.1875, and 0.375 mg/L.
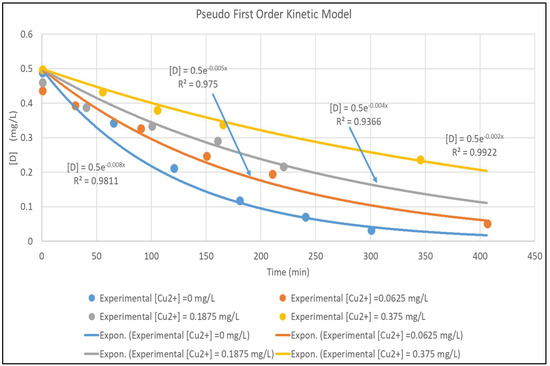
Figure 4.
Pseudo First Order Fit for [Cu2+] for [Cu2+] 0–0.375 mg/L.
The presence of the lumped parameter in the numerator of Equation (8) is significant, but the critical difference between LH model kinetics and the mechanistic result given by Equation (7) is the information contained in the cross-term in the denominator of the model that is lost due to the simplifying assumption of the LH model that there is no interaction (competition) between the RB and [Cu2+] molecules at a particular catalyst adsorption site. Expanding the denominator of Equation (8) gives:
It is obvious, due to the magnitude of K6, that the (K6 [Cu2+]) term is controlling for adsorption of [Cu2+], but that the controlling factors for [D] adsorption are more complex. Figure 5 shows the magnitude of the (K2 [D]) and (K2 (K6 [D][Cu2+]) terms as a function of rD for [Cu2+] of 0.0625 and 0.375 mg/L. The Figure shows that for the more dilute [Cu2+], the interaction term is practically negligible and that the K2 [D] term is predominant. At the higher [Cu2+], the (K2 (K6 [D][Cu2+]) term that is not modeled is dominant.
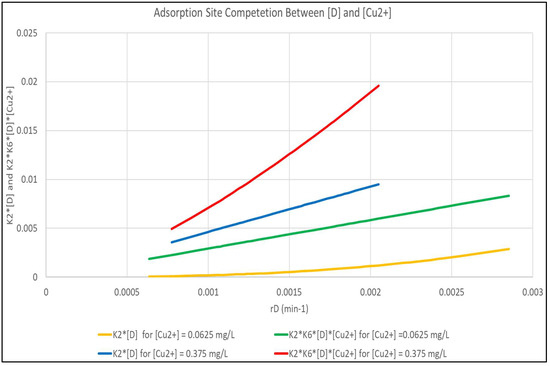
Figure 5.
Analysis of the Interaction Term in Equation (7) Between [D] and [Cu2+] Molecules.
4. Conclusions
In this study, a robust kinetics model for the degradation of Rhodamine B dye in the presences of Cu2+ was developed. The model is an extension of the models reported in previous studies [34,36,37], but specifically targets substrate concentrations an order of magnitude lower, in order to address the concentration regimes of CECs in drinking water supplies. Within these concentration constraints, the chemical kinetics and mass transfer mechanisms developed are exhaustive of all the degradation pathways available for any organic CEC/scavenger system, thus supporting the concept of a surrogate approach. The model was contrasted to the LH kinetics model that is widely used to accurately model chemical reactions at the solid-liquid interface. It was analytically demonstrated that the LH model does not address interaction between the adsorbing substrate and scavenger molecules, while our model does. The model indicates that the impact of this interaction is negligible for low [Cu2+], but becomes a predominant rate-limiting controller for higher [Cu2+].
Author Contributions
Conceptualization, H.A.A., A.E.A. and R.P.; methodology, H.A.A., A.E.A. and R.P.; investigation, H.A.A., A.E.A. and R.P.; writing—original draft preparation, H.A.A., A.E.A. and R.P.; writing—review and editing, H.A.E.A., A.A., R.P., L.S., and S.K.H.; funding acquisition, L.S., and S.K.H.
Funding
Massie Chair of Excellence at Tennessee State University
Conflicts of Interest
The authors declare no conflict of interest.
Appendix A
The step by step chemical reaction mass transfer mechanism is provided as follows [33,35]:
When TiO2 is exposed to UV light, electrons (e−) and holes () are generated:
When the hole and electron recombine, they generate heat:
Electrons and holes result in the formation of Hydroxyl radicals. S denotes TiO2 surface adsorption sites and S- represents an adsorbed species. For example, S-H2O represents an adsorbed water molecule.
a. Holes:
b. Electrons:
Hydroxyl radicals, dye molecules and scavengers, if any, are then adsorbed by TiO2.
c. Dye:
d. Hydroxyl radical:
e. Cu2+:
In this case copper ions are reduced to Cu+:
Dye that is adsorbed by TiO2 and unreacted dye molecules react with holes and radical hydroxyl groups.
f. Direct holes attack:
g. Hydroxyl radicals attack:
The balance of the total hydroxyl group is given as:
The electron concentration balance is given as:
The dye degradation rate is given by:
Adsorption equilibrium surface concentrations are given by:
[S-OH•] = KOH[S][OH•]
[S-D] = KD[S][D]
Hydroxyl radical concentration can be expressed as:
Electron concentration is expressed as:
Because [] is invariant, the degradation rate can be rewritten as:
where
−rd = koh [D] + k1 [D] [OH]
k1 = kra KD KOH [S]2 +krb KOH [S] + krc KD [S] + krd
Therefore, [OH•] is expressed as:
where,
where again upper-case K’s are equilibrium constants, and lower-case k’s are reaction rates.
Substituting Equation (A18) in Equation (A17) gives:
from Equation (16)
where
Substituting Equation (A20) into Equation (A19), gives:
Inverting Equation (A21) and neglecting the quadratic term of [D] gives:
where
References
- Ibhadon, A.O.; Fitzpatrick, P. Heterogeneous Photocatalysis: Recent Advances and Applications. Catalysts 2013, 3, 189–218. [Google Scholar] [CrossRef]
- Salimi, M.; Esrafili, A.; Gholami, M.; Jonidi Jafari, A.; Rezaei Kalantary, R.; Farzadkia, M.; Kermani, M.; Sobhi, H.R. Contaminants of emerging concern: A review of new approach in AOP technologies. Environ. Monit. Assess. 2017, 189, 414. [Google Scholar] [CrossRef] [PubMed]
- Lazar, M.; Varghese, S.; Nair, S. Photocatalytic Water Treatment by Titanium Dioxide: Recent Updates. Catalysts 2012, 2, 572–601. [Google Scholar] [CrossRef]
- Mills, A.; LeHunte, S. An overview of semiconductor photocatalysis. J. Photochem. Photobiol. A 1997, 108, 1–35. [Google Scholar] [CrossRef]
- Sunada, K.; Watanabe, T.; Hashimoto, K. Studies on photo-killing of bacteria on TiO2 thin film. J. Photochem. Photobiol. A 2003, 156, 227–233. [Google Scholar] [CrossRef]
- Paleologou, A.; Marakas, H.; Xekoukoulotakis, N.P.; Moya, A.; Vergara, Y.; Kalogerakis, N.; Gikas, P.; Mantzavinos, D. Disinfection of water and wastewater by TiO2 photocatalysis, sonolysis and UV-C irradiation. Catal. Today 2007, 129, 136–142. [Google Scholar] [CrossRef]
- Khairy, M.; Zakaria, W. Effect of metal-doping of TiO2 nanoparticles on their photocatalytic activities toward removal of organic dyes. Egypt. J. Pet. 2014, 23, 419–426. [Google Scholar] [CrossRef]
- Chan, P.Y.; El-Din, M.G.; Bolton, J.R. A solar-driven UV/Chlorine advanced oxidation process. Water Res. 2012, 46, 5672–5682. [Google Scholar] [CrossRef] [PubMed]
- Oller, I.; Malato, S.; Sánchez-Pérez, J. Combination of Advanced Oxidation Processes and biological treatments for wastewater decontamination—A review. Sci. Total Environ. 2011, 409, 4141–4166. [Google Scholar] [CrossRef] [PubMed]
- Sharma, V.K.; Triantis, T.M.; Antoniou, M.G.; He, X.; Pelaez, M.; Han, C.; Song, W.; O’Shea, K.E.; Armah, A.; Kaloudis, T.; et al. Destruction of microcystins by conventional and advanced oxidation processes: A review. Sep. Purif. Technol. 2012, 91, 3–17. [Google Scholar] [CrossRef]
- Cortez, P.; Teixeira, P.; Oliveira, R.; Mota, M. Evaluation of Fenton and ozone-based advanced oxidation processes as mature landfill leachate pre-treatments. Environ. Manag. 2011, 92, 749–755. [Google Scholar] [CrossRef] [PubMed]
- Blake, D. Bibliography of Work on the Heterogeneous Photocatalytic Removal of Hazardous Compounds from Water and Air; National Renewable Energy Laboratory: Denver, CO, USA, 2001; pp. 1–158. [Google Scholar]
- Hisanaga, T.; Harada, K.; Tanaka, K. Photocatalytic degradation of organochlorine compounds in suspended TiO2. J. Photochem. Photobiol. A Chem. 1990, 56, 113–118. [Google Scholar] [CrossRef]
- Ohtani, B.; Ueda, Y.; Nishimoto, S.; Kagiya, T.; Hachisuka, H. Photocatalytic oxidative decomposition of fluoroalkenes by titanium dioxide. J. Chem. Soc. Perkin Trans. 2 1990, 11. [Google Scholar] [CrossRef]
- Minero, C.; Aliberti, C.; Pelizzetti, E.; Terzian, R.; Serpone, N. Kinetic studies in heterogeneous photocatalysis. 6. AM1 simulated sunlight photodegradation over titania in aqueous media: A first case of fluorinated aromatics and identification of intermediates. Langmuir 1991, 7, 928–936. [Google Scholar] [CrossRef]
- Matthews, R. Photocatalytic oxidation of chlorobenzene in aqueous suspensions of titanium dioxide. J. Catal. 1986, 20, 569–578. [Google Scholar] [CrossRef]
- Pruden, A.L.; Ollis, D.F. Photoassisted heterogeneous catalysis: The degradation of trichloroethylene in water. J. Catal. 1983, 82, 404–417. [Google Scholar] [CrossRef]
- Ollis, D.F.; Hsiao, C.Y.; Budiman, L.; Lee, C.L. Heterogeneous photoassisted catalysis: Conversions of perchloroethylene, dichloroethane, chloroacetic acids, and chlorobenzenes. J. Catal. 1984, 88, 89–96. [Google Scholar] [CrossRef]
- Bahnemann, D.W.; Moenig, J.; Chapman, R. Efficient photocatalysis of the irreversible one-electron and two-electron reduction of halothane on platinized colloidal titanium dioxide in aqueous suspension. J. Phys. Chem. 1987, 91, 3782–3788. [Google Scholar] [CrossRef]
- Serphone, N.; Pelizzetti, E. (Eds.) Photocatalysis—Fundamentals and Applications; Wiley Interscience: New York, NY, USA, 1989. [Google Scholar]
- Fox, M.A. Organic heterogeneous photocatalysis: Chemical conversions sensitized by irradiated semiconductors. Account. Chem. Res. 1983, 16, 314–321. [Google Scholar] [CrossRef]
- Hoffmann, M.R.; Martin, S.T.; Choi, W.; Bahnemann, D.W. Environmental Applications of Semiconductor Photocatalysis. Chem. Rev. 1995, 95, 69–96. [Google Scholar] [CrossRef]
- Nosaka, Y.; Marye, A.F. Kinetics for Electron Transfer from Laser-Pulse Irradiated Colloidal Semiconductors to Adsorbed Methylviologen: Dependence of the Quantum Yield on Incident Pulse Width. J. Phys. Chem. 1988, 92, 1893–1897. [Google Scholar] [CrossRef]
- Al-Sayyed, G.; D’Oliveira, J.-C.; Pichat, P. Semiconductor-Sensitized Photodegradation of 4-Chlorophenol in Water. J. Photochem. Photobiol. A Chem. 1991, 58, 99–114. [Google Scholar] [CrossRef]
- Sclafani, A.; Palmisano, L.; Schiavello, M. Influence of the preparation methods of titanium dioxide on the photocatalytic degradation of phenol in aqueous dispersion. J. Phys. Chem. 1990, 94, 829–832. [Google Scholar] [CrossRef]
- Qu, P.; Zhao, J.; Shen, T.; Hidaka, H. TiO2-assisted photodegradation of dyes: A study of two competitive primary processes in the degradation of RB in an aqueous TiO2 colloidal solution. J. Mol. Catal. A Chem. 1998, 129, 257–268. [Google Scholar] [CrossRef]
- Fox, M.; Dulay, M. Hetrogeneous Photocatalysis. Chem. Rev. 1993, 93, 341–357. [Google Scholar] [CrossRef]
- Brezova, V.; Stasko, A.; Lapcik, L., Jr. Electron paramagnetic resonance study of photogenerated radicals in titanium dioxide powder and its aqueous suspensions. J. Photochem. Photobiol. A Chem. 1991, 59, 115–121. [Google Scholar] [CrossRef]
- Howe, R.F.; Gratzel, M. Electron-Paramagnetic-Res Study of Hydrated Anatase under UV Irradiation. J. Phys. Chem. 1987, 91, 3906–3909. [Google Scholar] [CrossRef]
- Soria, J.; Conesa, J.C.; Auguliaro, V.; Palmisano, L.; Schiavello, M.; Sclafani, A. Dinitrogen photoreduction to ammonia over titanium dioxide powders doped with ferric ions. J. Phys. Chem. 1991, 95, 274–282. [Google Scholar] [CrossRef]
- Tanaka, K.; White, J.M. Characterization of Species Adsorbed on Oxidized and Reduced Anatase. J. Phys. Chem. 1982, 86, 4708–4714. [Google Scholar] [CrossRef]
- Peral, J.; Casado, J.; Doménech, J. Light-Induced Oxidation of Phenol over ZnO Powder. J. Photochem. Photobiol. A Chem. 1988, 44, 209–217. [Google Scholar] [CrossRef]
- Weir, A.; Westerhoff, P.; Fabricus, L.; Hristovski, K.; von Goetz, N. Titanium dioxide nanoparticles in food and personal care products. Environ. Sci. Technol. 2012, 46, 2242–2250. [Google Scholar] [CrossRef] [PubMed]
- Aarthi, T.; Madras, G. Photocatalytic Degradation of Rhodamine Dyes with Nano-TiO2. Ind. Eng. Chem. Res. 2007, 46, 7–14. [Google Scholar] [CrossRef]
- Turchi, C.S.; Ollis, D.F. Photocatalytic degradation of organic water contaminants: Mechanisms involving hydroxyl radical attack. J. Catal. 1990, 122, 178–192. [Google Scholar] [CrossRef]
- Nagaveni, K.; Sivalingam, J.; Hegde, M.S.; Giridhar, M. Photocatalytic Degradation of Organic Compounds over Combustion-Synthesized Nano-TiO2. Environ. Sci. Technol. 2004, 38, 1600–1604. [Google Scholar] [CrossRef] [PubMed]
- Chen, C.; Li, X.; Ma, W.; Zhao, J. Effect of Transition Metal Ions on the TiO2-Assisted Photodegradation of Dyes under Visible Irradiation: A Probe for the Interfacial Electron Transfer Process and Reaction Mechanism. J. Phys. Chem. B 2002, 106, 318–324. [Google Scholar] [CrossRef]
- Yu, L.; Achari, G.; Langford, C.H. Photocatalytic degradation of 2,4-D with a LED based photoreactor. In Proceedings of the 12th International Environmental Specialty Conference, Edmonton, Canada, 12–16 March 2012. [Google Scholar]
- Available online: http://www.comm-tec.com/Prods/mfgs/TurnerDesigns/application_notes_pdf/TD-700%20FAQ.pdf (accessed on 20 October 2017).
© 2018 by the authors. Licensee MDPI, Basel, Switzerland. This article is an open access article distributed under the terms and conditions of the Creative Commons Attribution (CC BY) license (http://creativecommons.org/licenses/by/4.0/).