Dry Reforming of Methane in a Pd-Ag Membrane Reactor: Thermodynamic and Experimental Analysis


1
Institute on Membrane Technology, National Research Council (ITM-CNR), Via P. Bucci, Cubo 17C, 87036 Rende (CS), Italy
2
Department of Environmental and Chemical Engineering (DIATIC), University of Calabria, Via P. Bucci, Cubo 44A, 87036 Rende (CS), Italy
*
Author to whom correspondence should be addressed.
ChemEngineering 2018, 2(4), 48; https://doi.org/10.3390/chemengineering2040048
Submission received: 13 September 2018
/
Revised: 2 October 2018
/
Accepted: 9 October 2018
/
Published: 10 October 2018
(This article belongs to the Special Issue Membrane and Membrane Reactors Operations in Chemical Engineering)
Abstract
:The present work is a study of CO2 Reforming of Methane (DRM) carried out in a catalytic Pd-based membrane reactor. A detailed thermodynamic analysis is carried out, calculating the chemical equilibrium parameters in two different cases: (a) DRM along with the Reverse Water Gas Shift (RWGS) reaction and (b) DRM along with both RWGS and the Boudouard Reaction (BR). The performance of membrane reactor is then experimentally analyzed in terms of methane conversion, hydrogen recovery and H2/CO reaction selectivity by varying feed pressure and CO2/CH4 feed molar ratio and 500 °C and GHSV = 100 h−1. Among the obtained results, a CH4 conversion of about 26% and a H2 recovery of 47% are achieved at low feed pressures, exceeding the traditional reactor equilibrium conversion. This effect can be attributed to the favorable thermodynamics coupled to the hydrogen permeation through the membrane. This study further demonstrates the general effectiveness of membrane-integrated reaction processes, which makes the production of syngas more efficient and performing, providing important environmental benefits.
1. Introduction
In the last decade, the energy demand has been growing by 1.2% a year and fossil fuels still maintain a production share of ca. 75%. However, the ever-stricter problems connected to a sustainable growth and to a lower environmental impact lead to the conclusion that the time of easy oil consumption is finished. Nowadays, the necessity to release energy production from oil and natural gas as primary energy sources is becoming more and more pressing [1,2,3]. Indeed, more in general, diversifying such sources in order to assure supply, and in the meantime increase effort dedicated to the reduction of environmental problems, has led to the development of alternative technologies designed to enhance both the efficiency and environmental acceptability of energy production, storage and use, in particular for power generation [4]. Among these technologies, the exploitation of light hydrocarbons is surely the main realistic energy source, since they allow both power generation and environmentally-friendly fuel production [5,6].
Actually, converting CO2 into valuable hydrocarbons seems to be one of the most recent advances in CCU (Carbon Capture and Utilization), being one of the best solutions to both global warming and energy lacking problems. Several technologies have recently been explored and are reported in literature for CO2 conversion [7]. These technologies are based on hydrogenation, electrochemical, thermochemical or biocatalytic processes, and photocatalytic reduction. Among these, photocatalytic conversion is growing faster in the development not only of more active catalysts but also in the design of innovative process units [8,9]. In addition, biochemical and bio-mimetic approaches are also reaching interesting results although they are still to be applied at large scale. [10,11]. A very active research area is the development of an “artificial leaf” [12] that collects energy in a similar way as a natural one [13,14], combining water oxidation and CO reduction to produce liquid fuels by artificial photosynthesis; however, the development of this technology is also far from real scale, owing to limitations on solar energy-to-chemical conversion efficiency, costs, robustness and of easy construction [13].
Dry reforming of methane (DRM) is a reaction that has led significant interest owing to the possibility to convert greenhouse gases, CO2 and CH4 to produce valuable products. The resulting synthesis gas has, in fact, a CO/H2 ratio close to 2, which is more appropriate for forming hydrocarbons by Fischer-Tropsch synthesis and for carbonylation and hydroformylation reactions [15]. Moreover, natural gas and biogas from fields having high carbon dioxide content can be directly used for reaction, avoiding separation and purification stages. Although the undoubted benefits, DRM development on large scale is still limited owing to the usual rapid deactivation of catalysts due to coke formation and the occurrence of side reactions, which decrease the yield of syngas [16,17,18,19].
A common overbearing problem is the reverse water-gas shift (RWGS) associated with dry reforming, which consumes the hydrogen produced by the reaction to form water. This is much more evident at high pressure, because the reaction (2) is favoured with respect to reaction (1) owing to the much higher reactivity of H2 over CH4 [20].
Membrane reactors (MRs) are a promising solution to overcome these limitations, combining the reaction and H2 separation by means of a selective membrane. The presence of a hydrogen-selective membrane allows the removal of hydrogen from reaction side with a contemporary recovery a hydrogen rich/pure stream [21] and the shifting of the reaction toward further conversion. In addition, as the permeation is a pressure driven process, the negative effect of reaction pressure, which favors RWGS, is counterbalanced by the promotion of hydrogen removal from reaction volume. In addition, MR operates below 600 °C, thus, below the temperature range at which coke deposition readily occurs [22]. In most cases, the MRs used for DRM are constituted by a selective membrane—usually Pd-based—having only the separating function, whereas the catalyst is packed in the annulus between the membrane and reactor shell [23,24,25,26,27,28,29].
As it is well known, Ni-based is the most used commercial catalyst for DRM. However, it suffers from severe loss of catalytic activity mainly due to the coke formation. Industrial steam reformers are fed with steam-to-carbon ratios close to 3 to suppress the coking, resulting in less efficient operation. To enable operation with lower steam-to-carbon ratios, new catalysts need to be developed that are simultaneously highly active, resistant to coking, and low cost. Such catalysts can be based on novel materials based on platinum group metals (Ru, Rh, Pt, Pd, etc.) [30,31]. Very recently, Simak and Leshkov [32] demonstrated the advantages obtained by using a 0.15 wt % Ru/-Al2O3 catalyst in methane steam reforming coupled with a Pd-Ag membrane (5 micrometer thick). This MR, operated at 650 °C and 8 bar of feed pressure, showed high catalytic activity with a methane conversion higher than 50% and hydrogen yield of about 70%. At the same time, the MR showed stable performance over a total of 400 h on stream, including operation with low steam-to-carbon ratios of 1 and 2, and combined dry-steam reforming. On the basis of these positive results, we decided to carry out DRM in a Pd-Ag MR at 500 °C in the presence of a 0.5 wt % Ru/Al2O3 catalyst. As also observed by Simak and Leshkov [32], conversions achievable are quite low (<50%) owing to RWGS and the coke formation. This latter can affect not only the catalyst activity but also the membrane stability. For this purpose, we decided to use a Pd-Ag commercial membrane (100 micron thick), which exhibits high chemical and mechanical resistance, good permeability and infinite H2 selectivity [21], circumventing the various issues that usually could affect ultrathin membranes. The coupling of the selective hydrogen removal offered by the membrane with the stability of an Ru-based catalyst could provide interesting insight in DRM reaction development.
CH4 conversion, hydrogen recovery and reaction selectivity were analyzed as a function of feed pressure and CO2/CH4 feed molar ratio. In addition, the experimental analysis was coupled with a detailed thermodynamic study of DRM reaction, calculating the chemical equilibrium parameters in two different cases: (a) DRM along with the Reverse Water Gas Shift (RWGS) reaction, and (b) DRM along with both RWGS and the Boudouard Reaction.
2. Materials and Methods
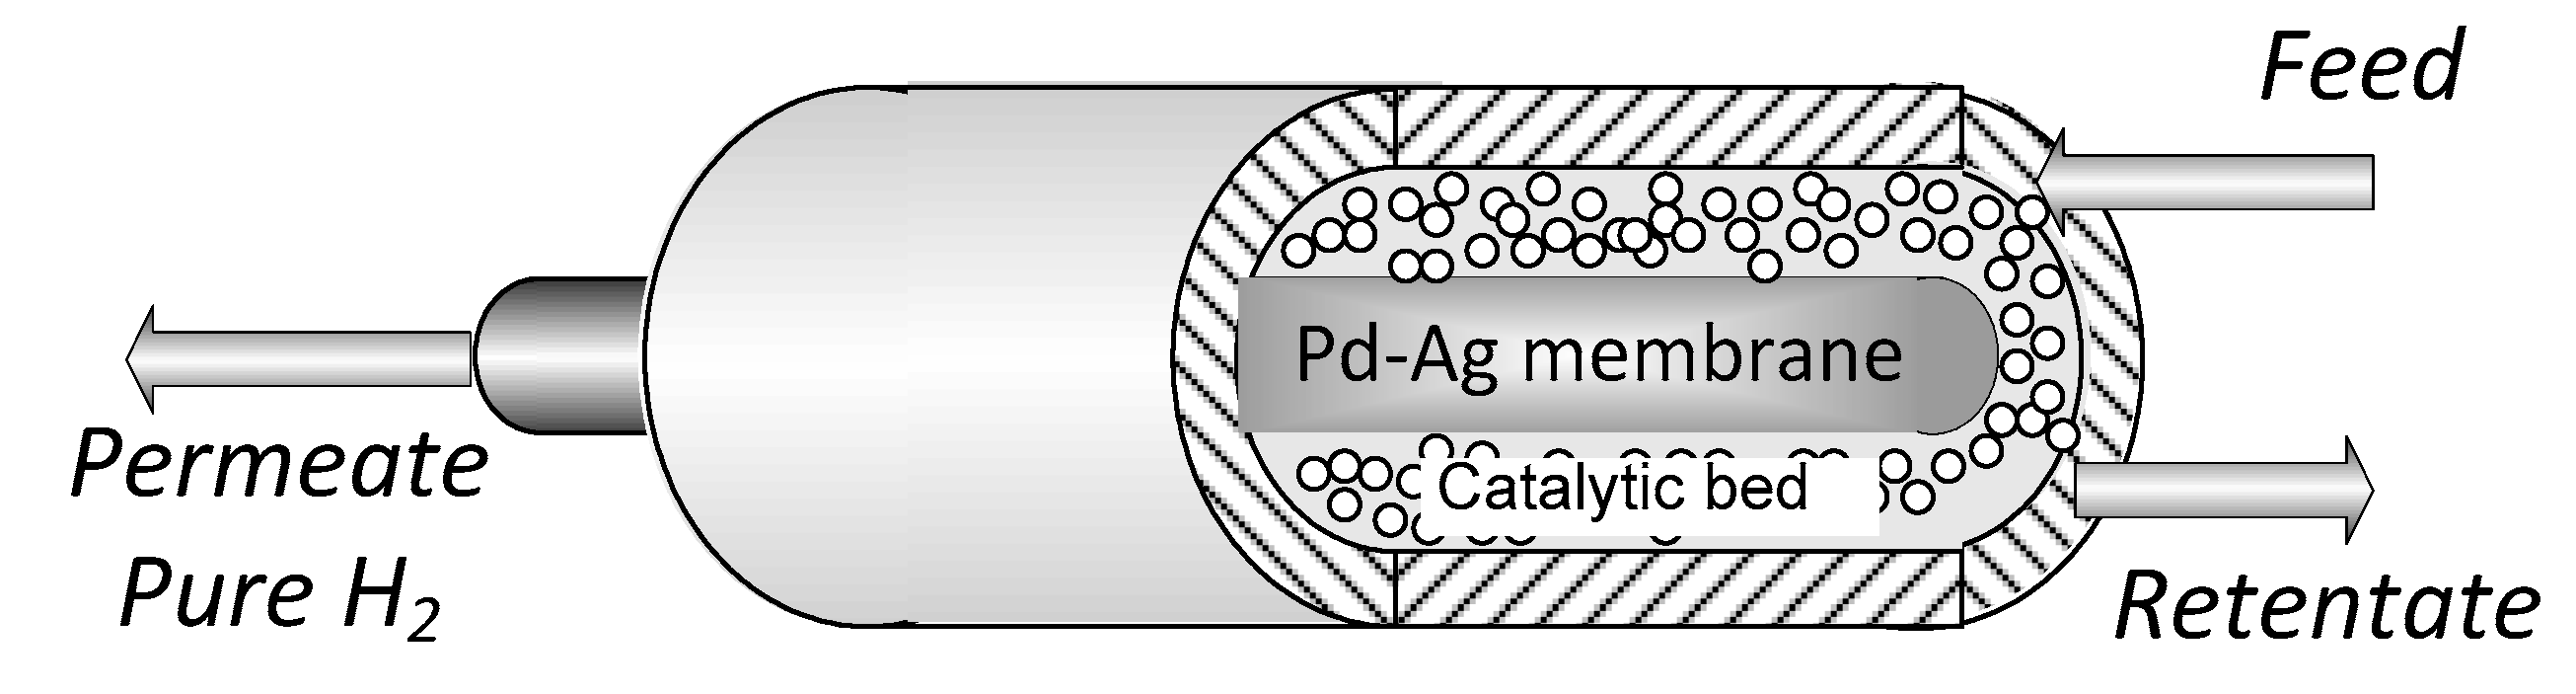
The experiments were carried out in a tube in tube MR (Figure 1) where the outer tube is a stainless-steel shell, whereas the inner tube is the Pd-alloy self-supported membrane, blind on one end. The catalytic bed was 0.5% Ru/Al2O3 commercial catalytic pellets, packed in the annulus and the permeated stream is recovered in the core of the membrane (permeate side). The sealing between the membrane and the reactor shell was obtained with a graphite O-ring via compression. Both the membrane and MR characteristics are summarized in Table 1.
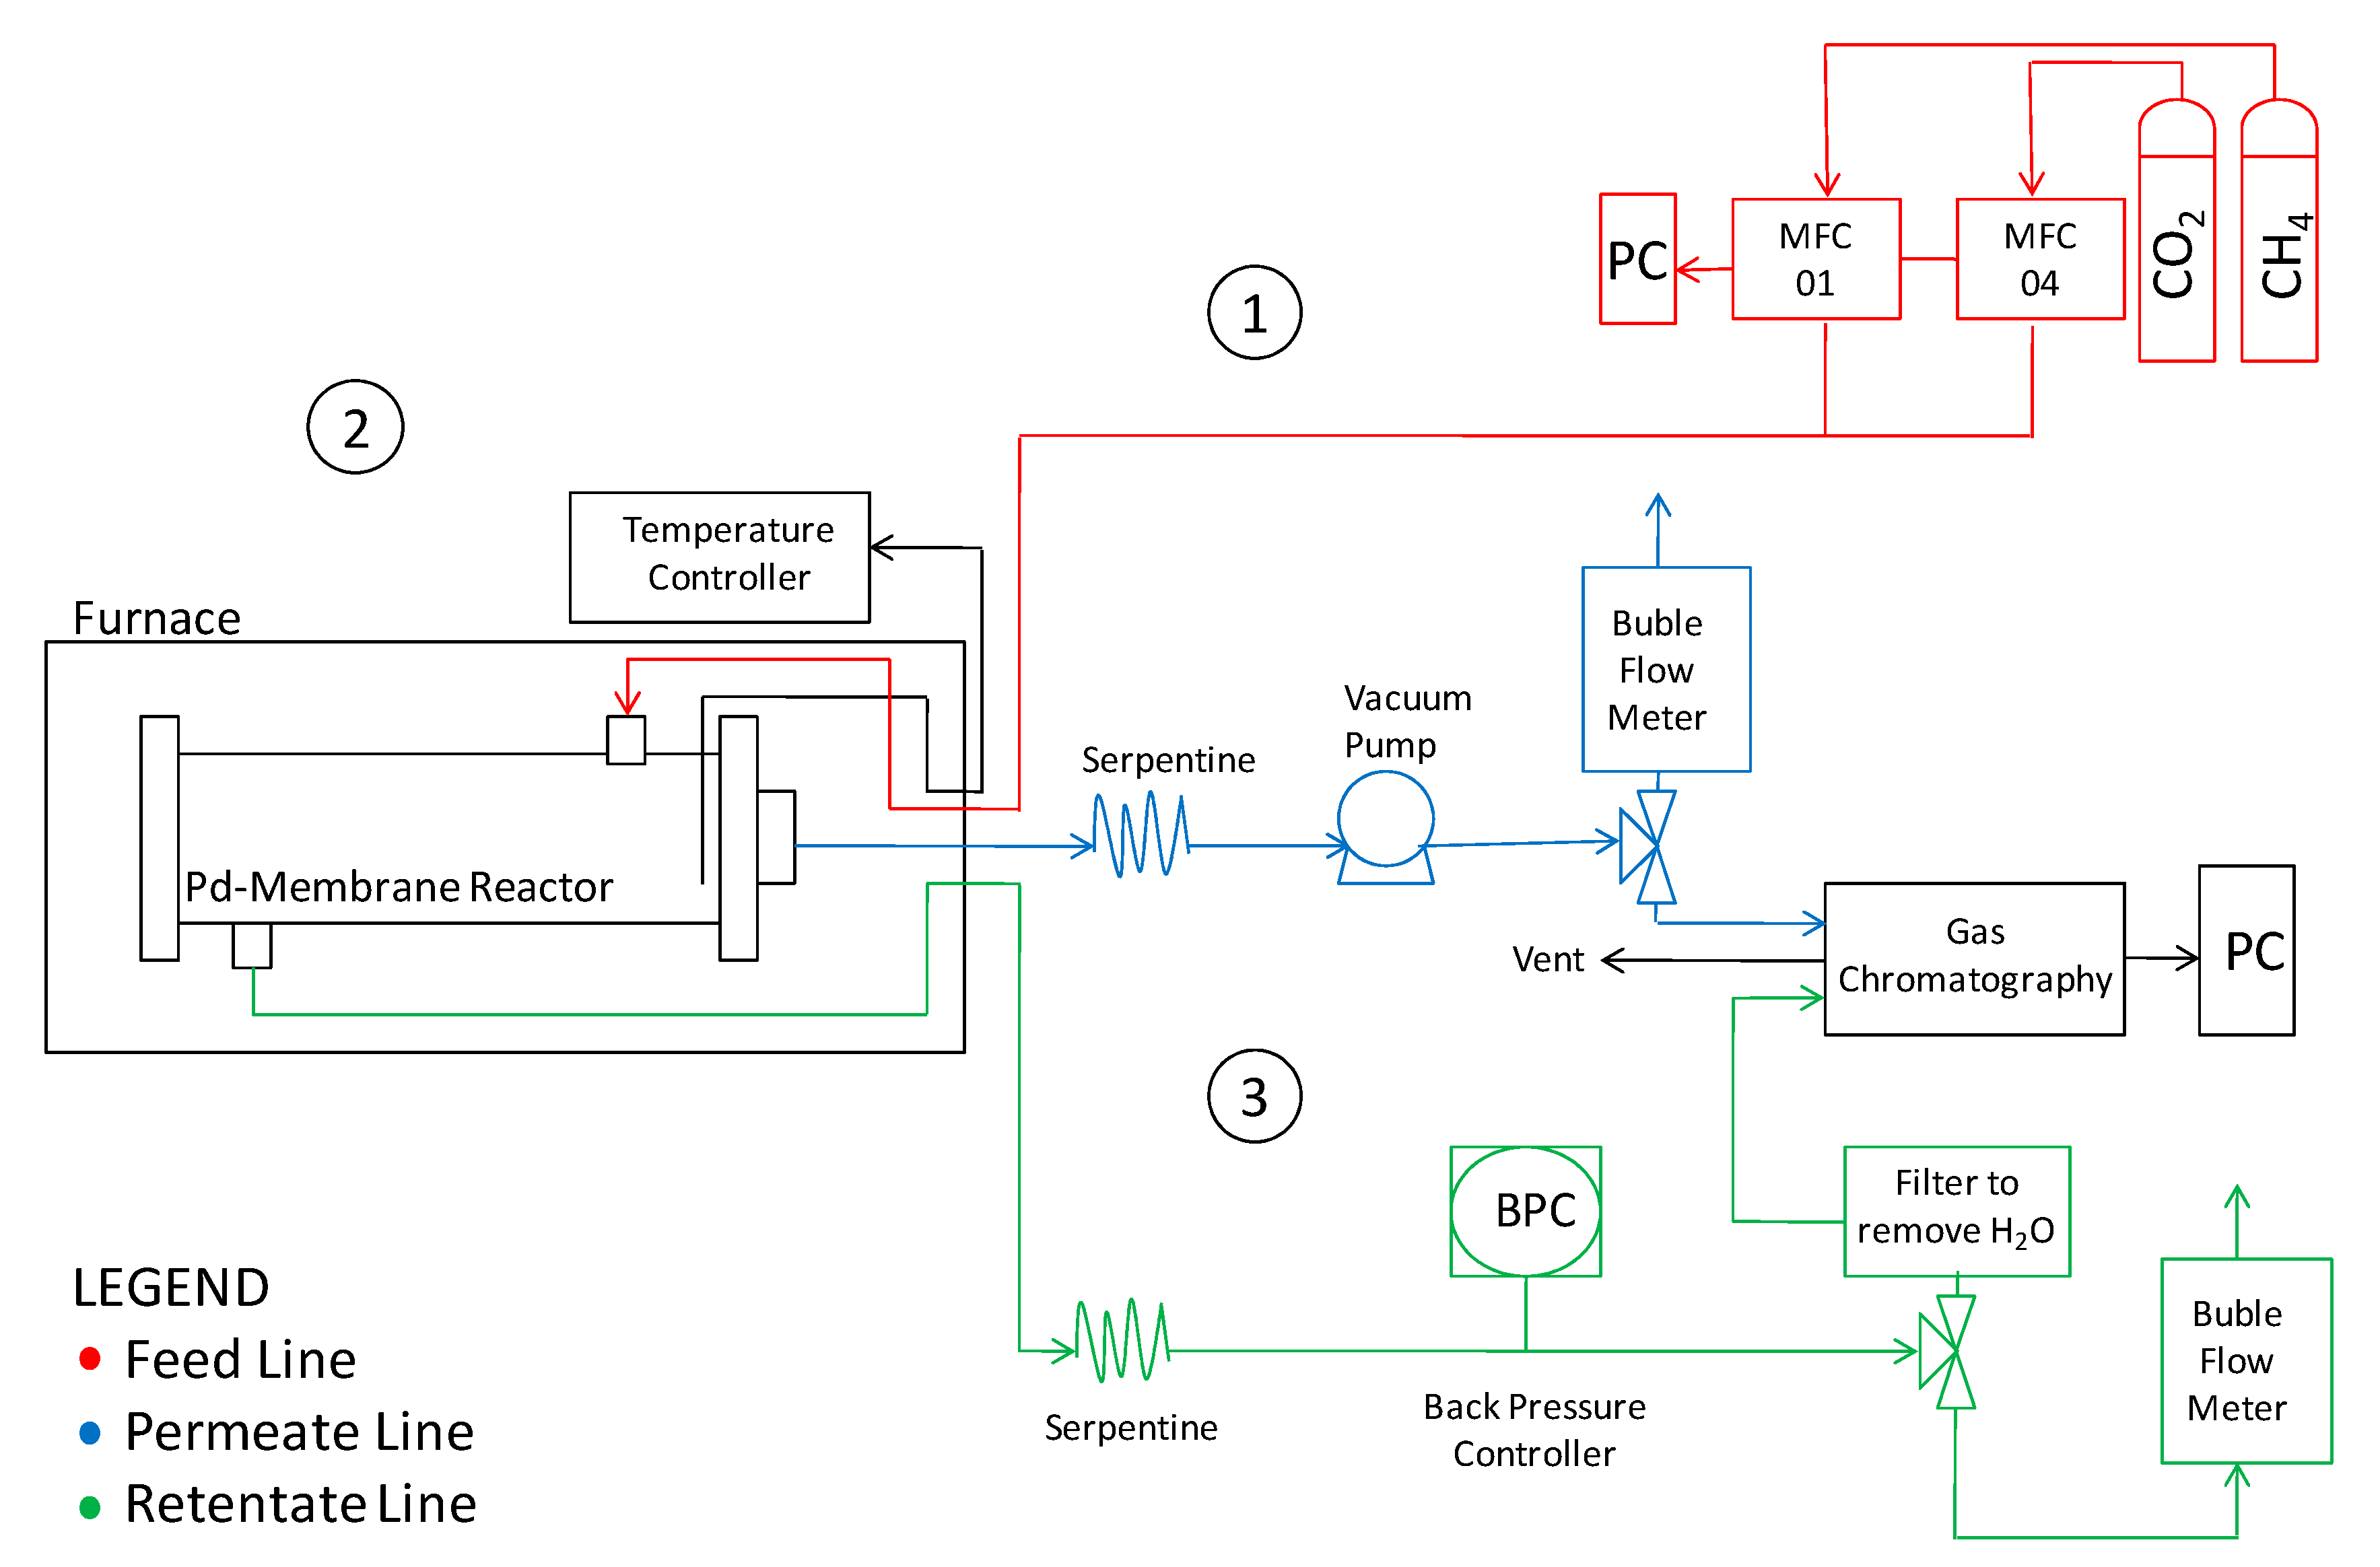
The laboratory plant assembled to perform the present investigation is sketched in Figure 2.
The reactor was placed inside an electric furnace to keep the desired temperature. The gas mixture was fed into the module by two mass flow controllers (Brooks Instrument 5850S, Hatfield, PA, USA). The outlet streams were fed to two bubble soap flow meters in order to measure the gas flow rates and, thus, to evaluate the permeating flux. A pressure gauge with a backpressure controller was placed on the retentate stream to keep and measure the feed pressure; whereas permeate pressure was regulated by a vacuum pump. The retentate and permeate streams compositions were analyzed by means of a gas chromatograph (Agilent 7890N, Santa Clara, CA, USA) with two parallel analytical lines. Each line was equipped with two columns: An HP-Plot-5A (to separate permanent gases such as H2, N2 and CO) and an HP-Poraplot-Q (for other species) allowing the retentate and permeate streams to be analyzed at the same time. The temperature was measured by using a thermocouple positioned in the middle of the reactor shell (inside the catalyst bed). After assembly, the membrane reactor was charged under nitrogen pressure at 8 bar on the feed side, closing the retentate. No pressure falls were detected after one hour, confirming the absence of leakages. The same procedure was repeated at 500 °C, before starting reaction measurements. Before reaction experiments, the membrane was assembled in the module without packing the catalyst and permeation measurements were carried out with H2 single gases at different temperatures and pressures. For this purpose, the feed-side absolute pressure was set at 4, 6 and 8 bar, whilst the permeation-side pressure was fixed at atmospheric pressure during each series of permeation measurements. Afterwards, a CO2:CH4 stream was fed for reaction experiments at 500 °C, analyzing, in particular, the effects of the feed molar ratio, and the feed and permeate pressures. A summary of the operating conditions are reported in Table 2.
Generally, as also done in the present work, the H2 permeating flux through Pd-alloy membranes can be described by Sieverts’ law (Equation (4)) when the diffusion through the metal bulk is the rate-determining step. Under these conditions, the hydrogen permeating flux is considered a linear function of the permeation driving force, which is given by the difference of the square root of the H2 partial pressure on both membrane sides. This assumption has been done since, as it can be seen in the next section, the permeating flux is fully linear with the square root of the H2 partial pressure on both membrane sides.
As for the reactor performance, CH4 conversion in both TR and MR was calculated using Equation (5) including CH4 present in the feed and retentate streams. In particular, the conversion was calculated as the average value between the CH4 fed to the MR and that detected in the retentate. Each value of conversion reports an error bar taking into account the carbon balance. It was calculated for each measurement and it is comprised in the range −8.7% to 5%.
The recovery capability of the MR was quantified in terms of H2 recovery (Equation (6)), which is defined as the H2 fraction permeated through the membrane with respect to all of the H2 present in both outlets of MR.
Catalyst is periodically regenerated with a diluted stream of 10% H2 in argon after each set of reaction experiments. The reverse methane decomposition is an exothermic reaction favoured at low temperatures. If coke is present, it would react with hydrogen to produce methane. Based on this fact, it is possible to calculate the coke reacted from the methane produced. For this purpose, the retentate stream was analyzed by gas chromatography, measuring at the same time the outlet flow rate by bubble flow meter. From such methanation tests, the total coke content in the catalyst after the reaction experiment was calculated from the amount of CH4 formed and crosschecked with carbon balance calculations. Each measurement was repeated three times, alternated by methanation, for a total experimental campaign that lasted about 500 h. The measurements are reproducible, confirming a good stability of catalyst for the whole period of experiments.
3. Results and Discussion
3.1. Thermodynamic Analysis
The understanding of the thermodynamic behavior of DRM for syngas and hydrogen production is important to determine the most favorable reaction conditions. The theoretical background of thermodynamic analysis is reported in Appendix A. The thermodynamic equilibrium of DRM along with some side-reactions is evaluated by minimization of the total Gibbs free energy, which is carried out in the MATLAB® environment (see Appendix A for calculation details). As mentioned above, the independent reactions considered are the following: The DRM, RWGS and Boudouard reaction. More specifically, the analysis of the Boudouard reaction is important because coke is formed by it. To the best of our knowledge, there are no references in the open literature about equilibrium calculation in the co-presence of coke.
3.1.1. Calculation Validation
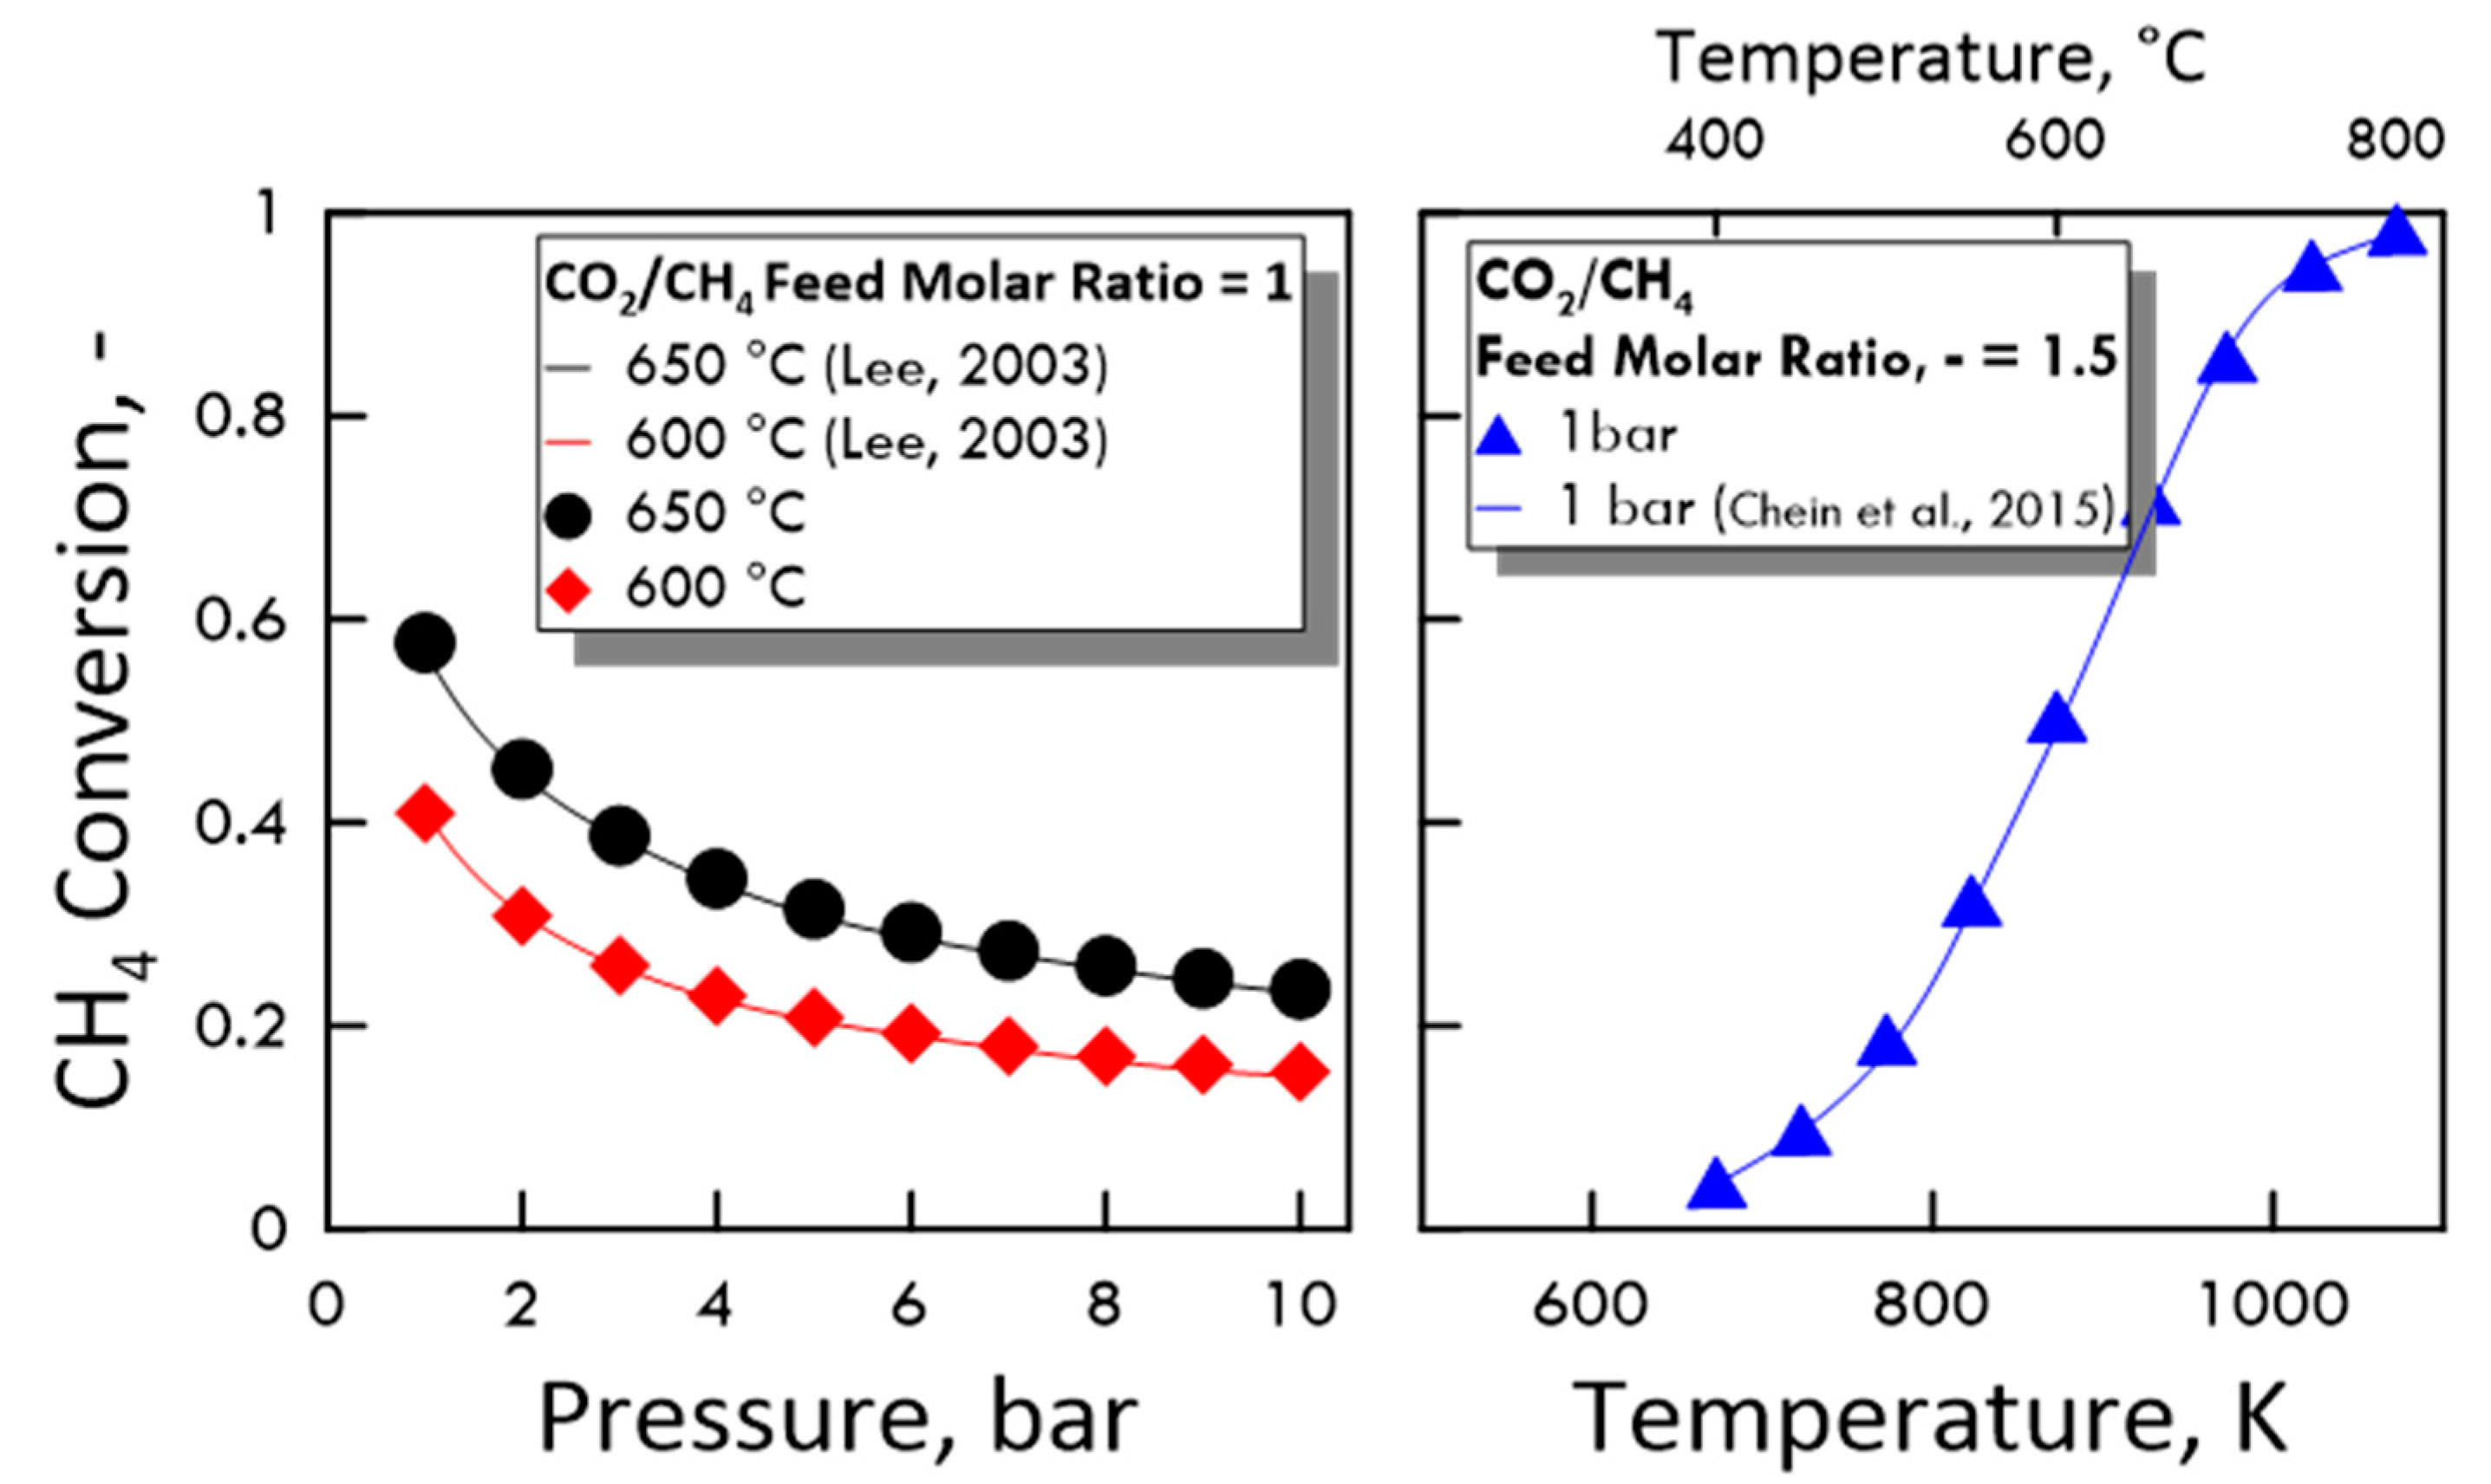
To verify the accuracy of the calculated values, the equilibrium of DRM and reverse WGS reaction was preliminarily studied comparing the obtained results with some present in the literature in terms of CH4 conversion and equilibrium constant. As shown in Figure 3 (equilibrium conversion) and in Table 3 (equilibrium constant), the results from both MATLAB code and literature data agree very well.
3.1.2. Equilibrium Calculation: DRM and RWGS
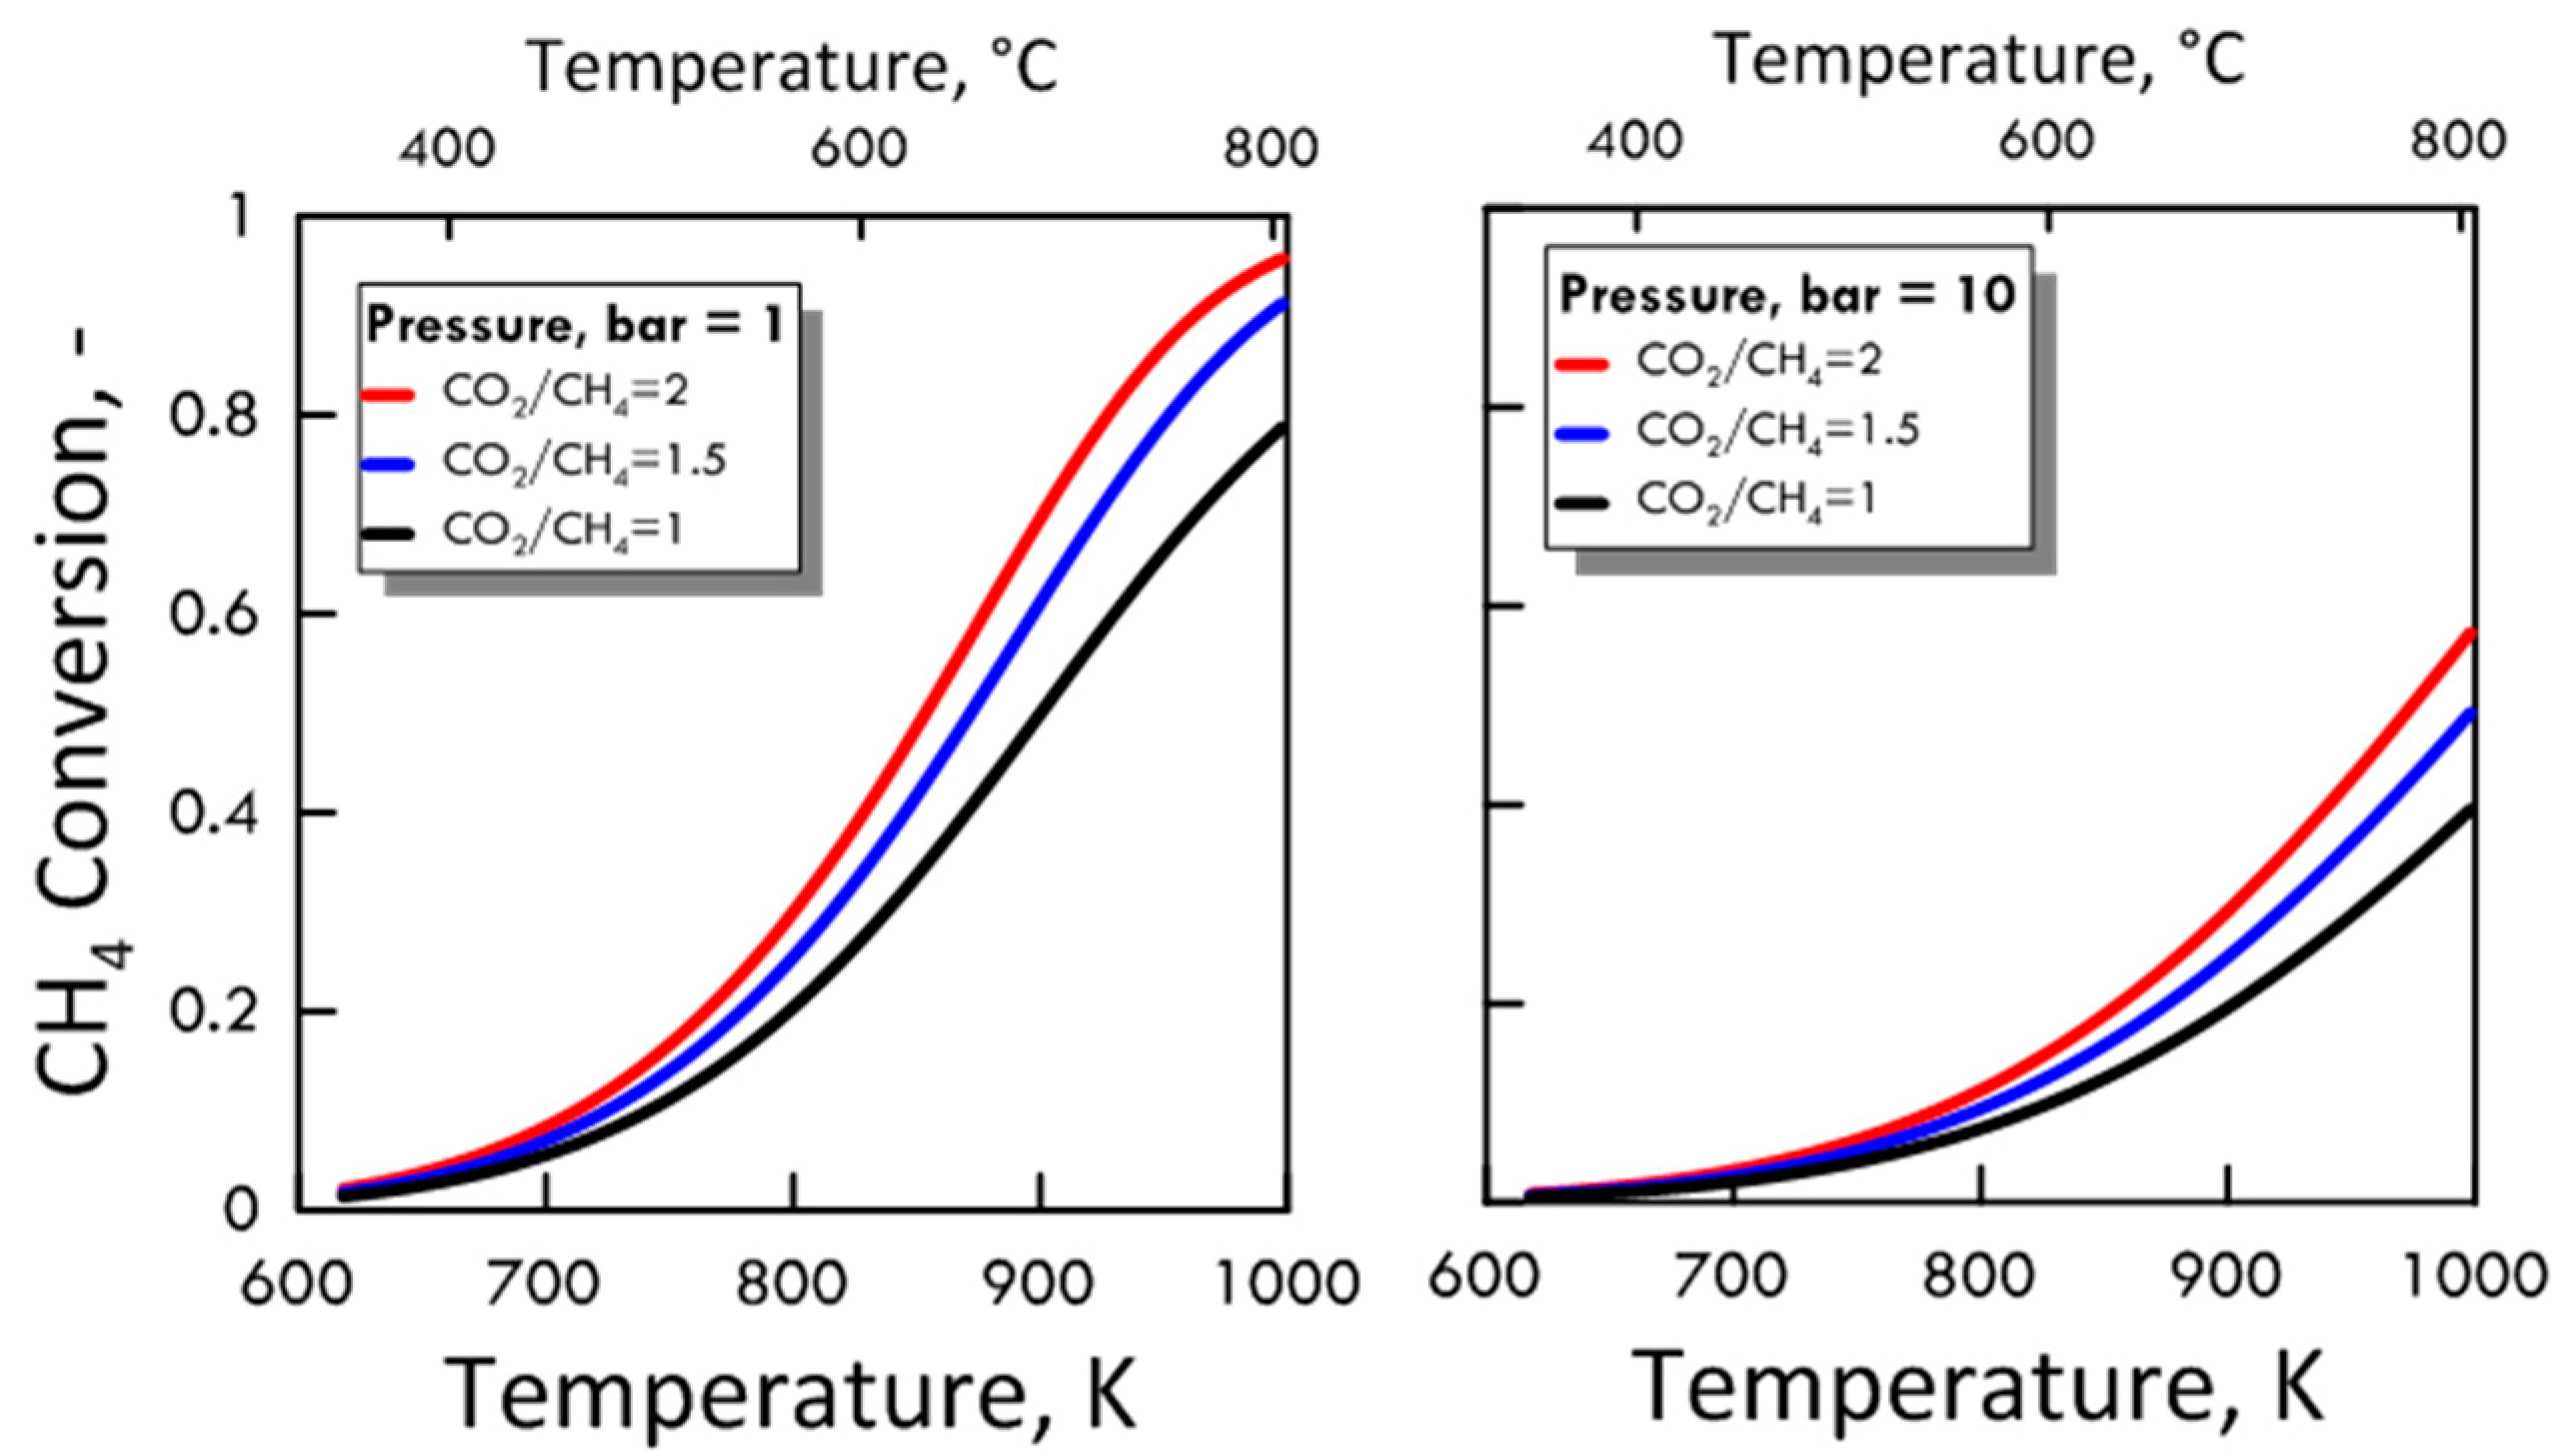
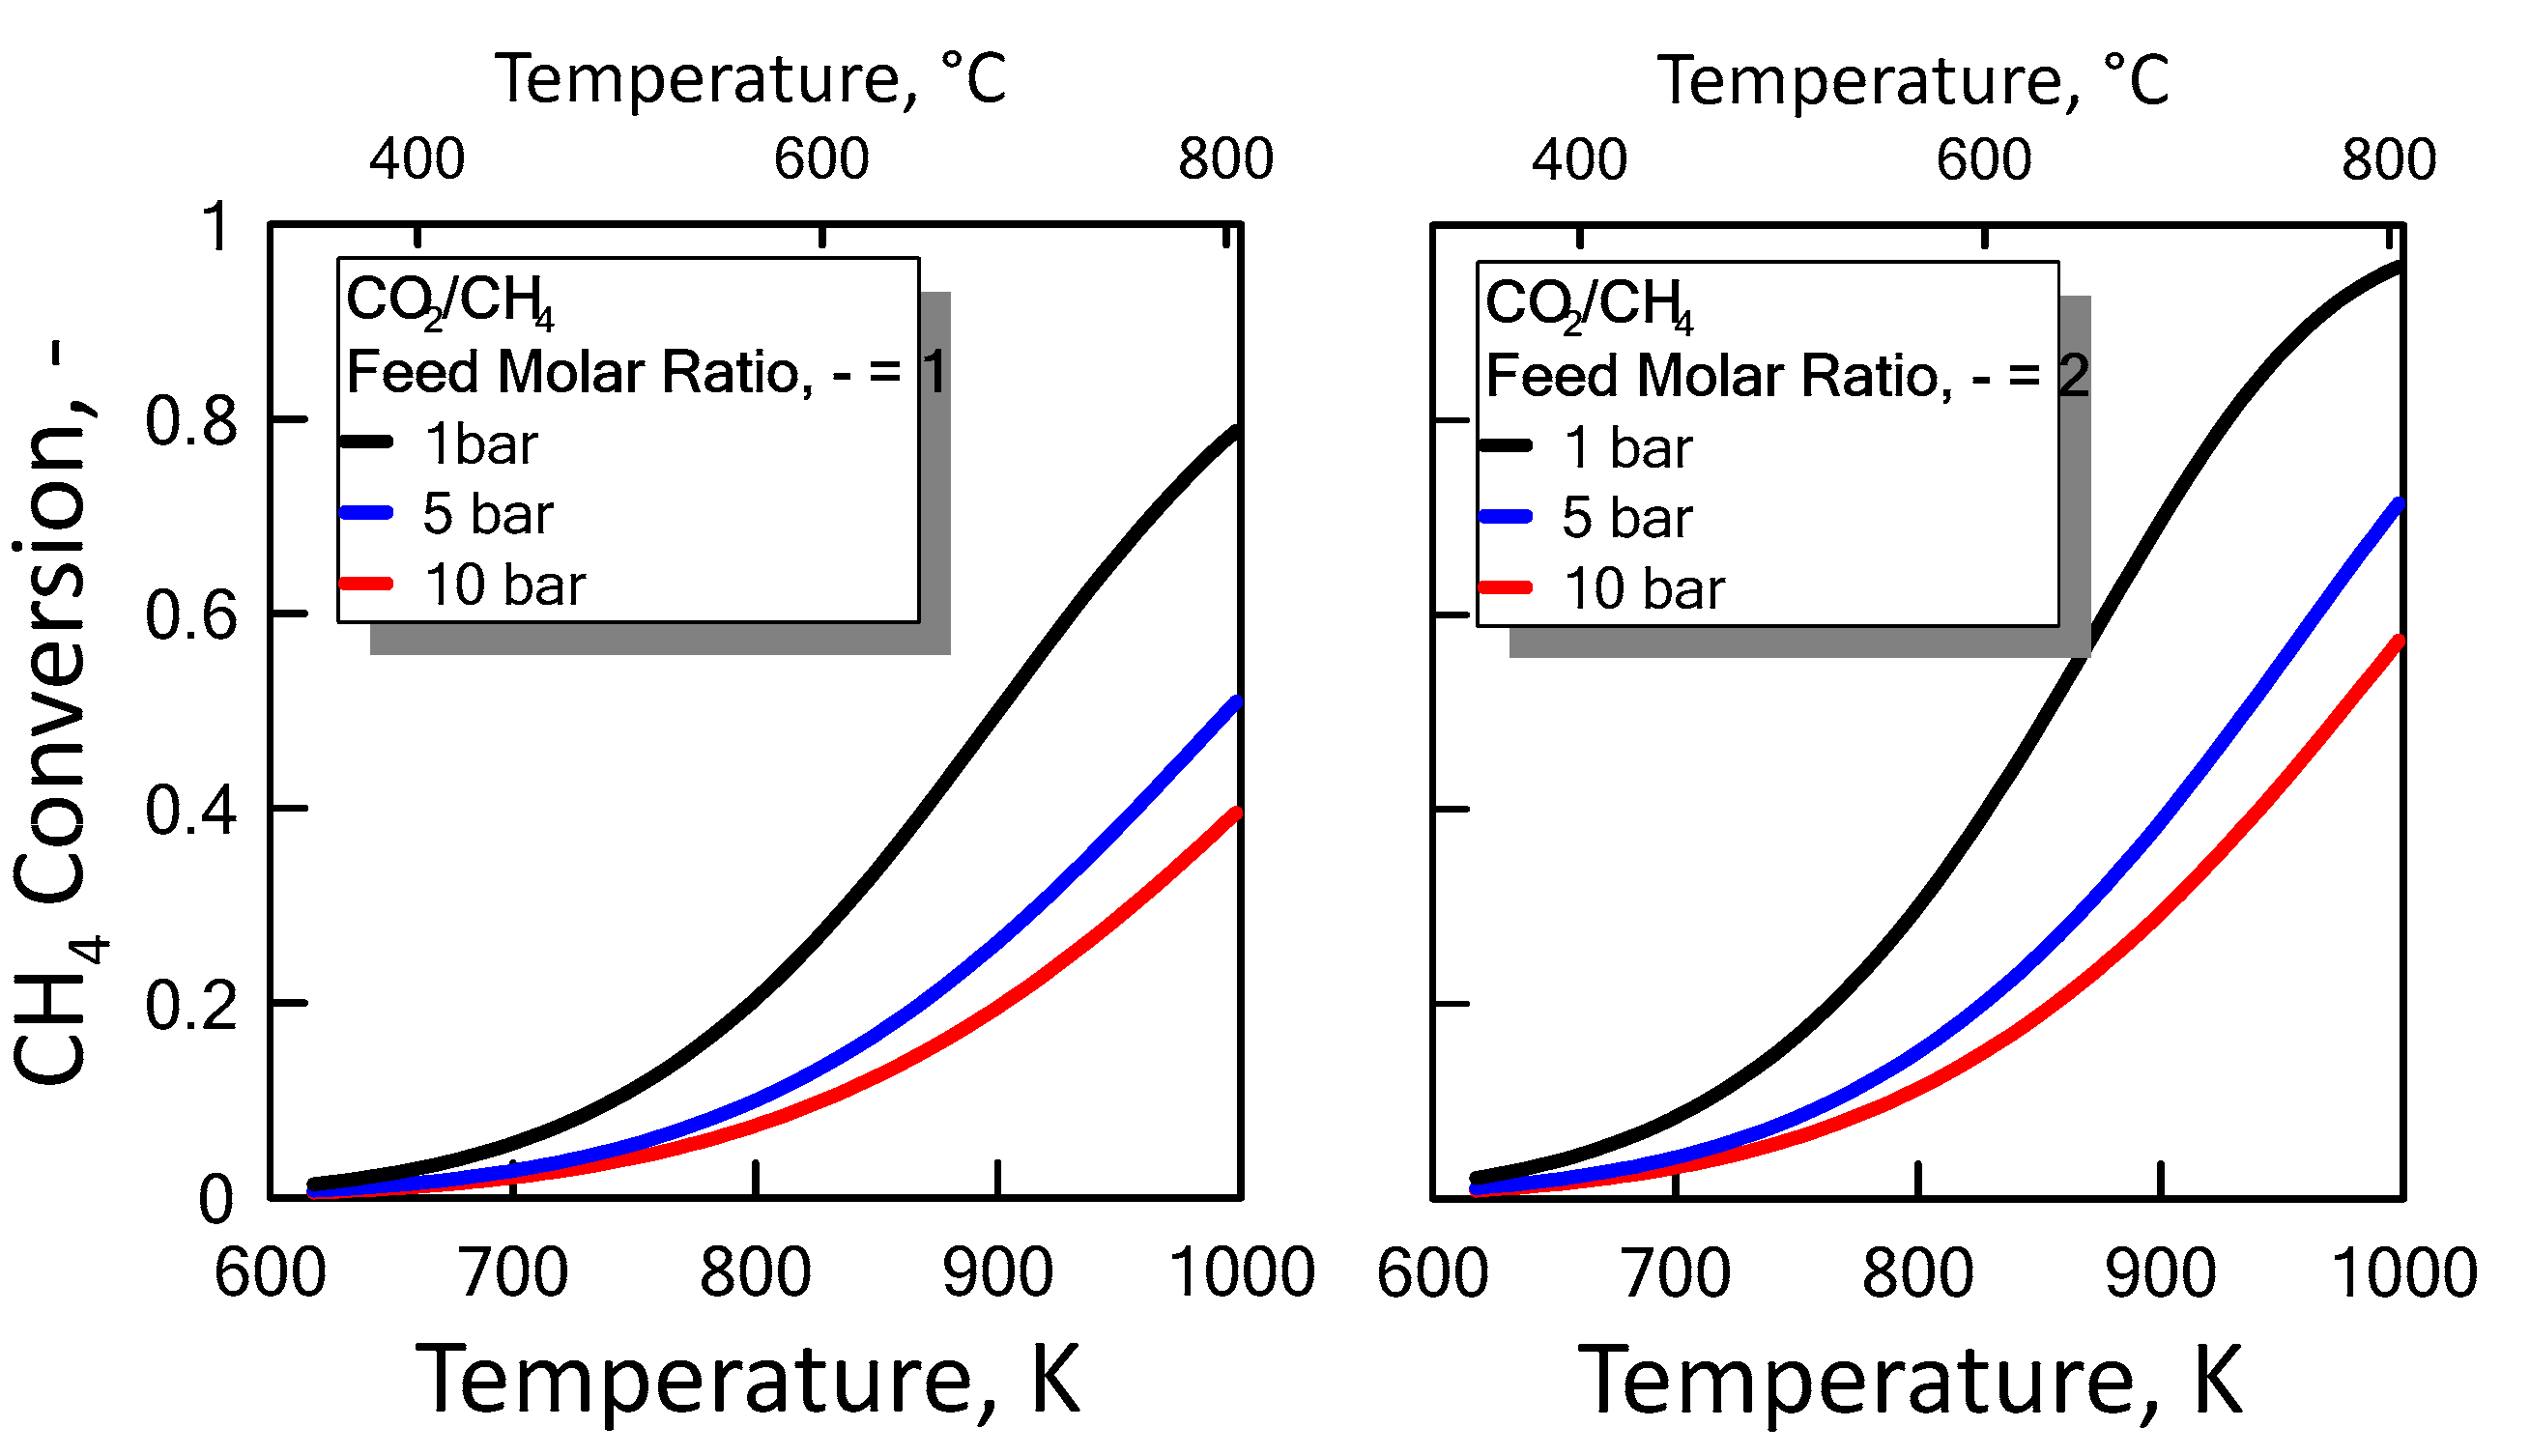
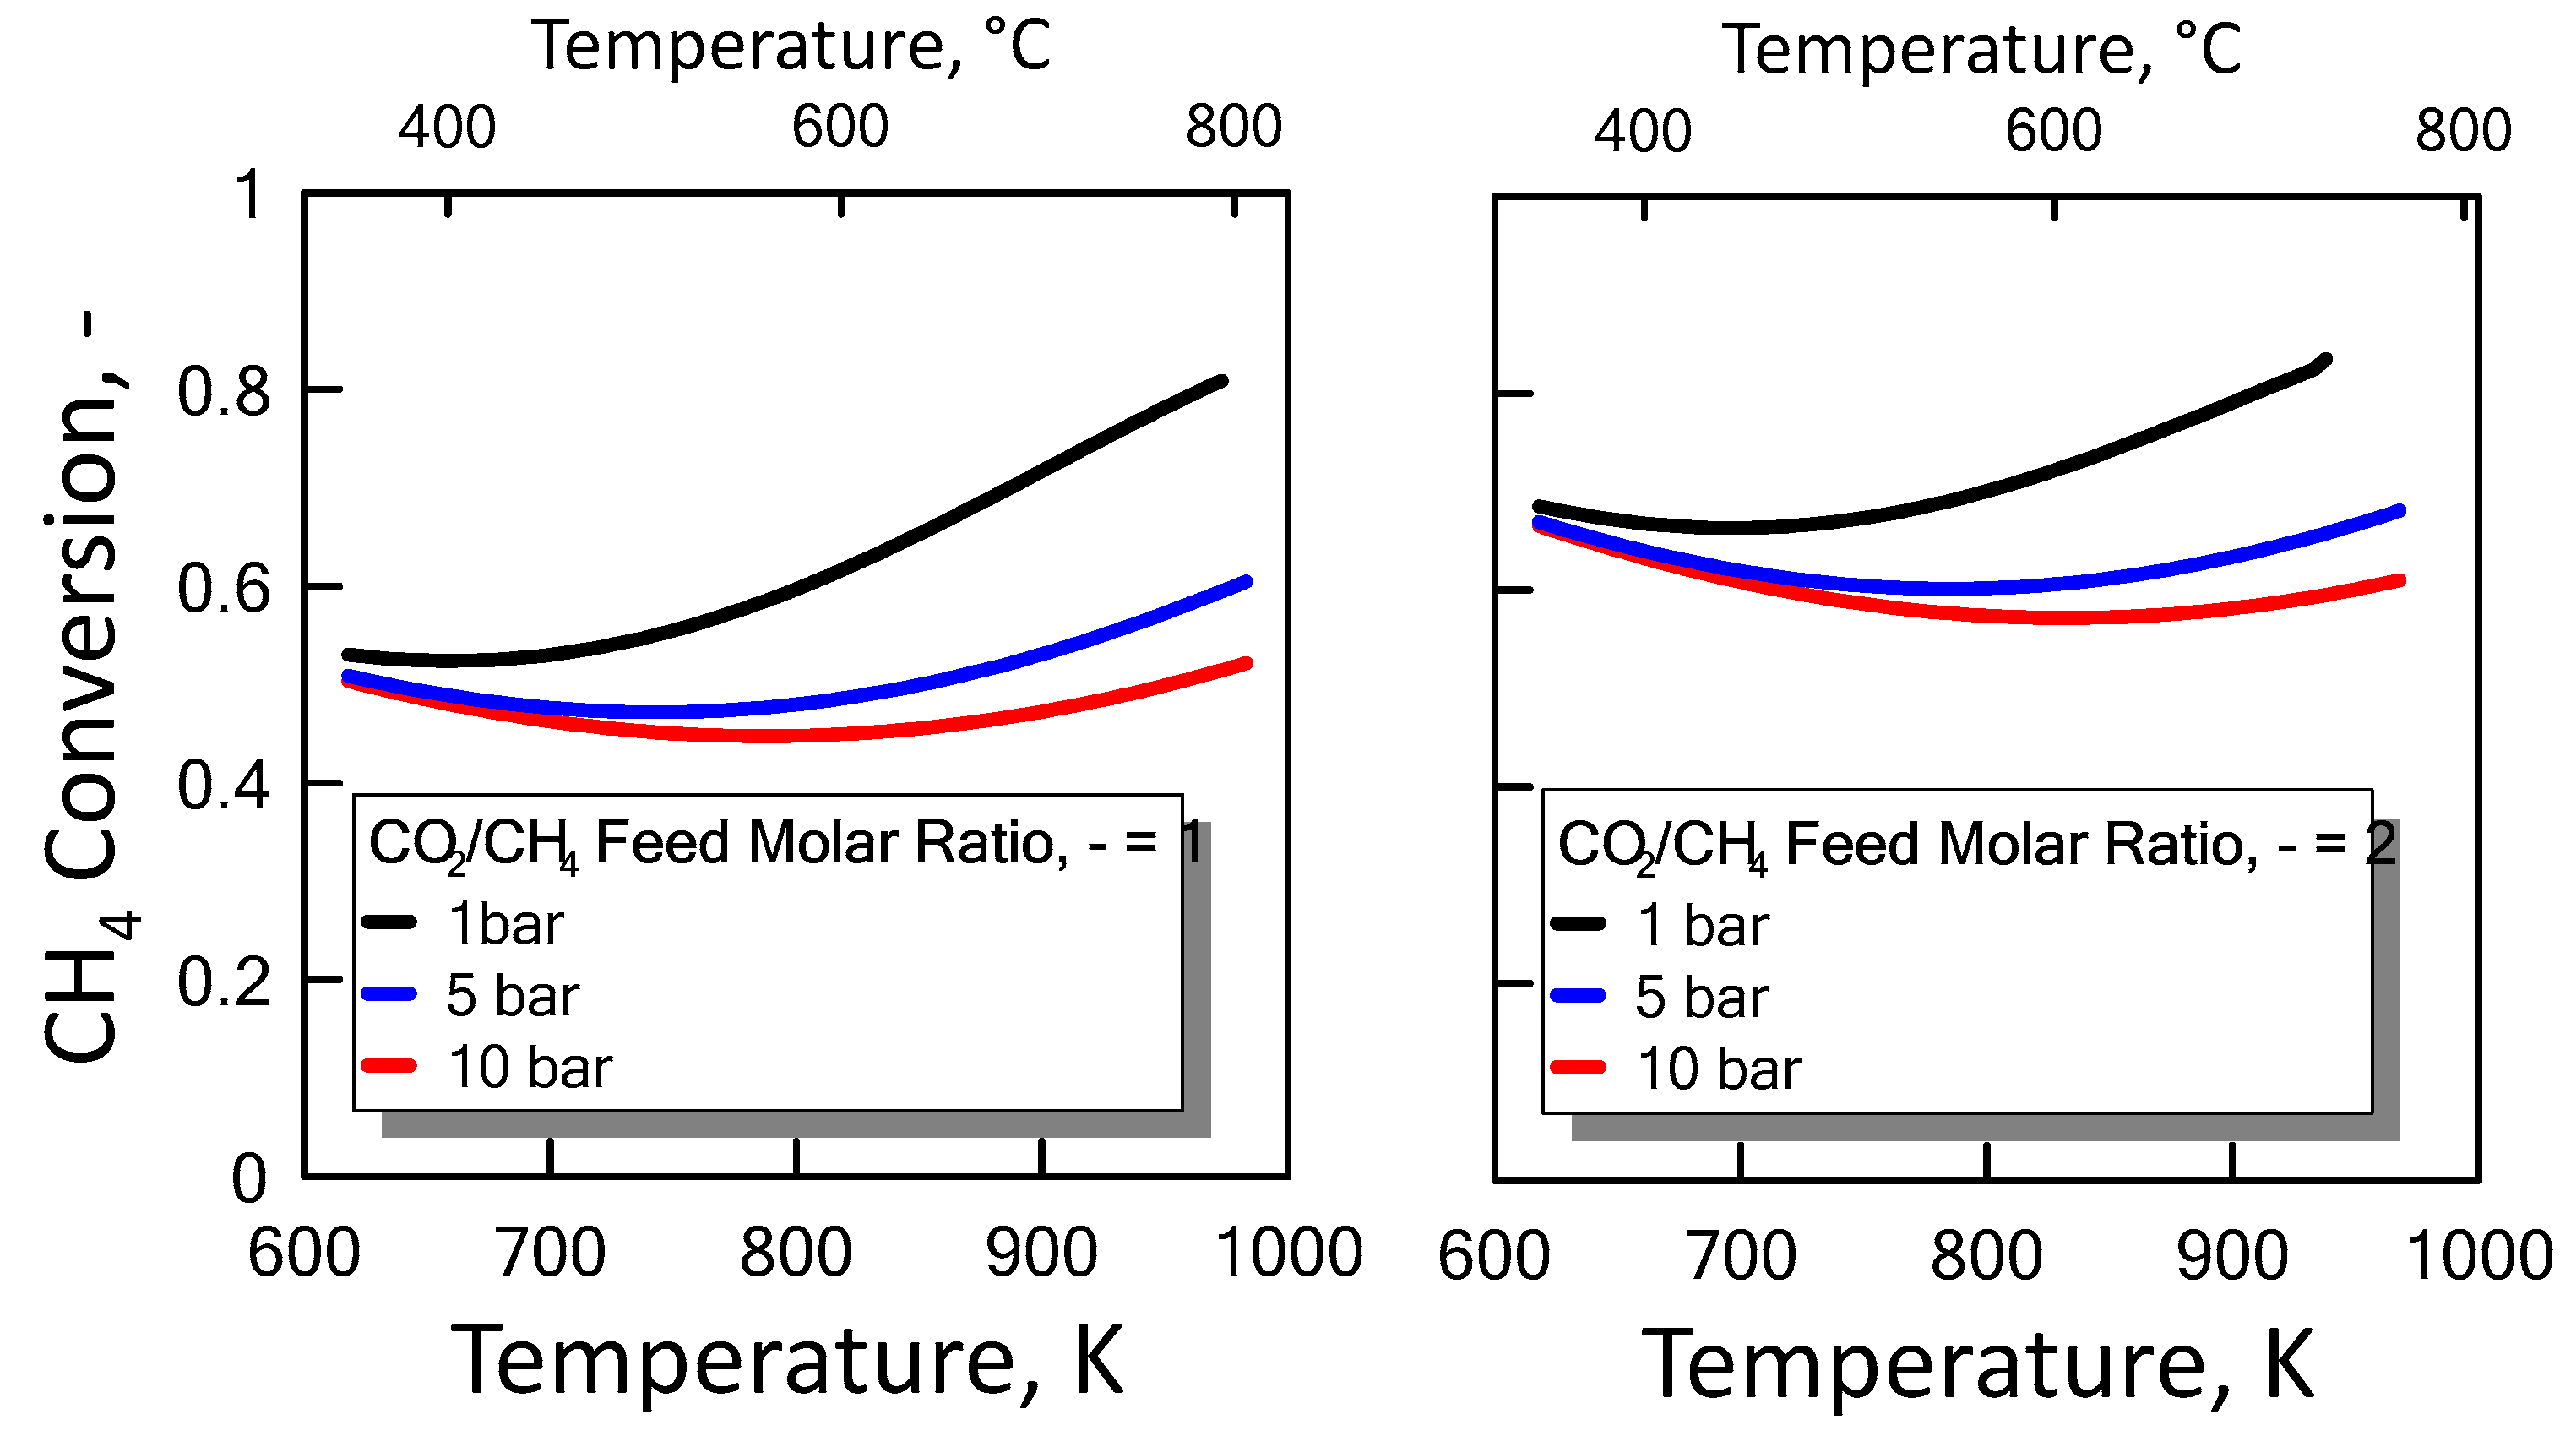
After ensuring the MATLAB method correctness, both CO2/CH4 feed molar ratio and pressure effect were evaluated on the methane equilibrium conversion. Figure 4 shows the CH4 equilibrium conversion as a function of temperature and varying CO2/CH4 feed molar ratio for 1 bar (left side) and 10 bar (right side). At a pressure value sets, CH4 conversion increases with CO2/CH4 feed molar ratio and with temperature. The DRM reaction is endothermic, and is favored at high temperature. Figure 5 shows the CH4 equilibrium conversion as a function of temperature and varying pressure for CO2/CH4 feed molar ratio of 1 (left side) and 2 (right side). As pressure increases, CH4 conversion decreases. The DRM reaction occurs with the increase in molar number and is unfavorable at high pressures. The pressure negative effect is due to the reaction thermodynamics, according to the Le Chatelier-Braun principle. In particular, methane conversion approaches limiting values as the pressure increases.
3.1.3. Equilibrium Calculation: DRM, Reverse WGS and Boudouard Reactions
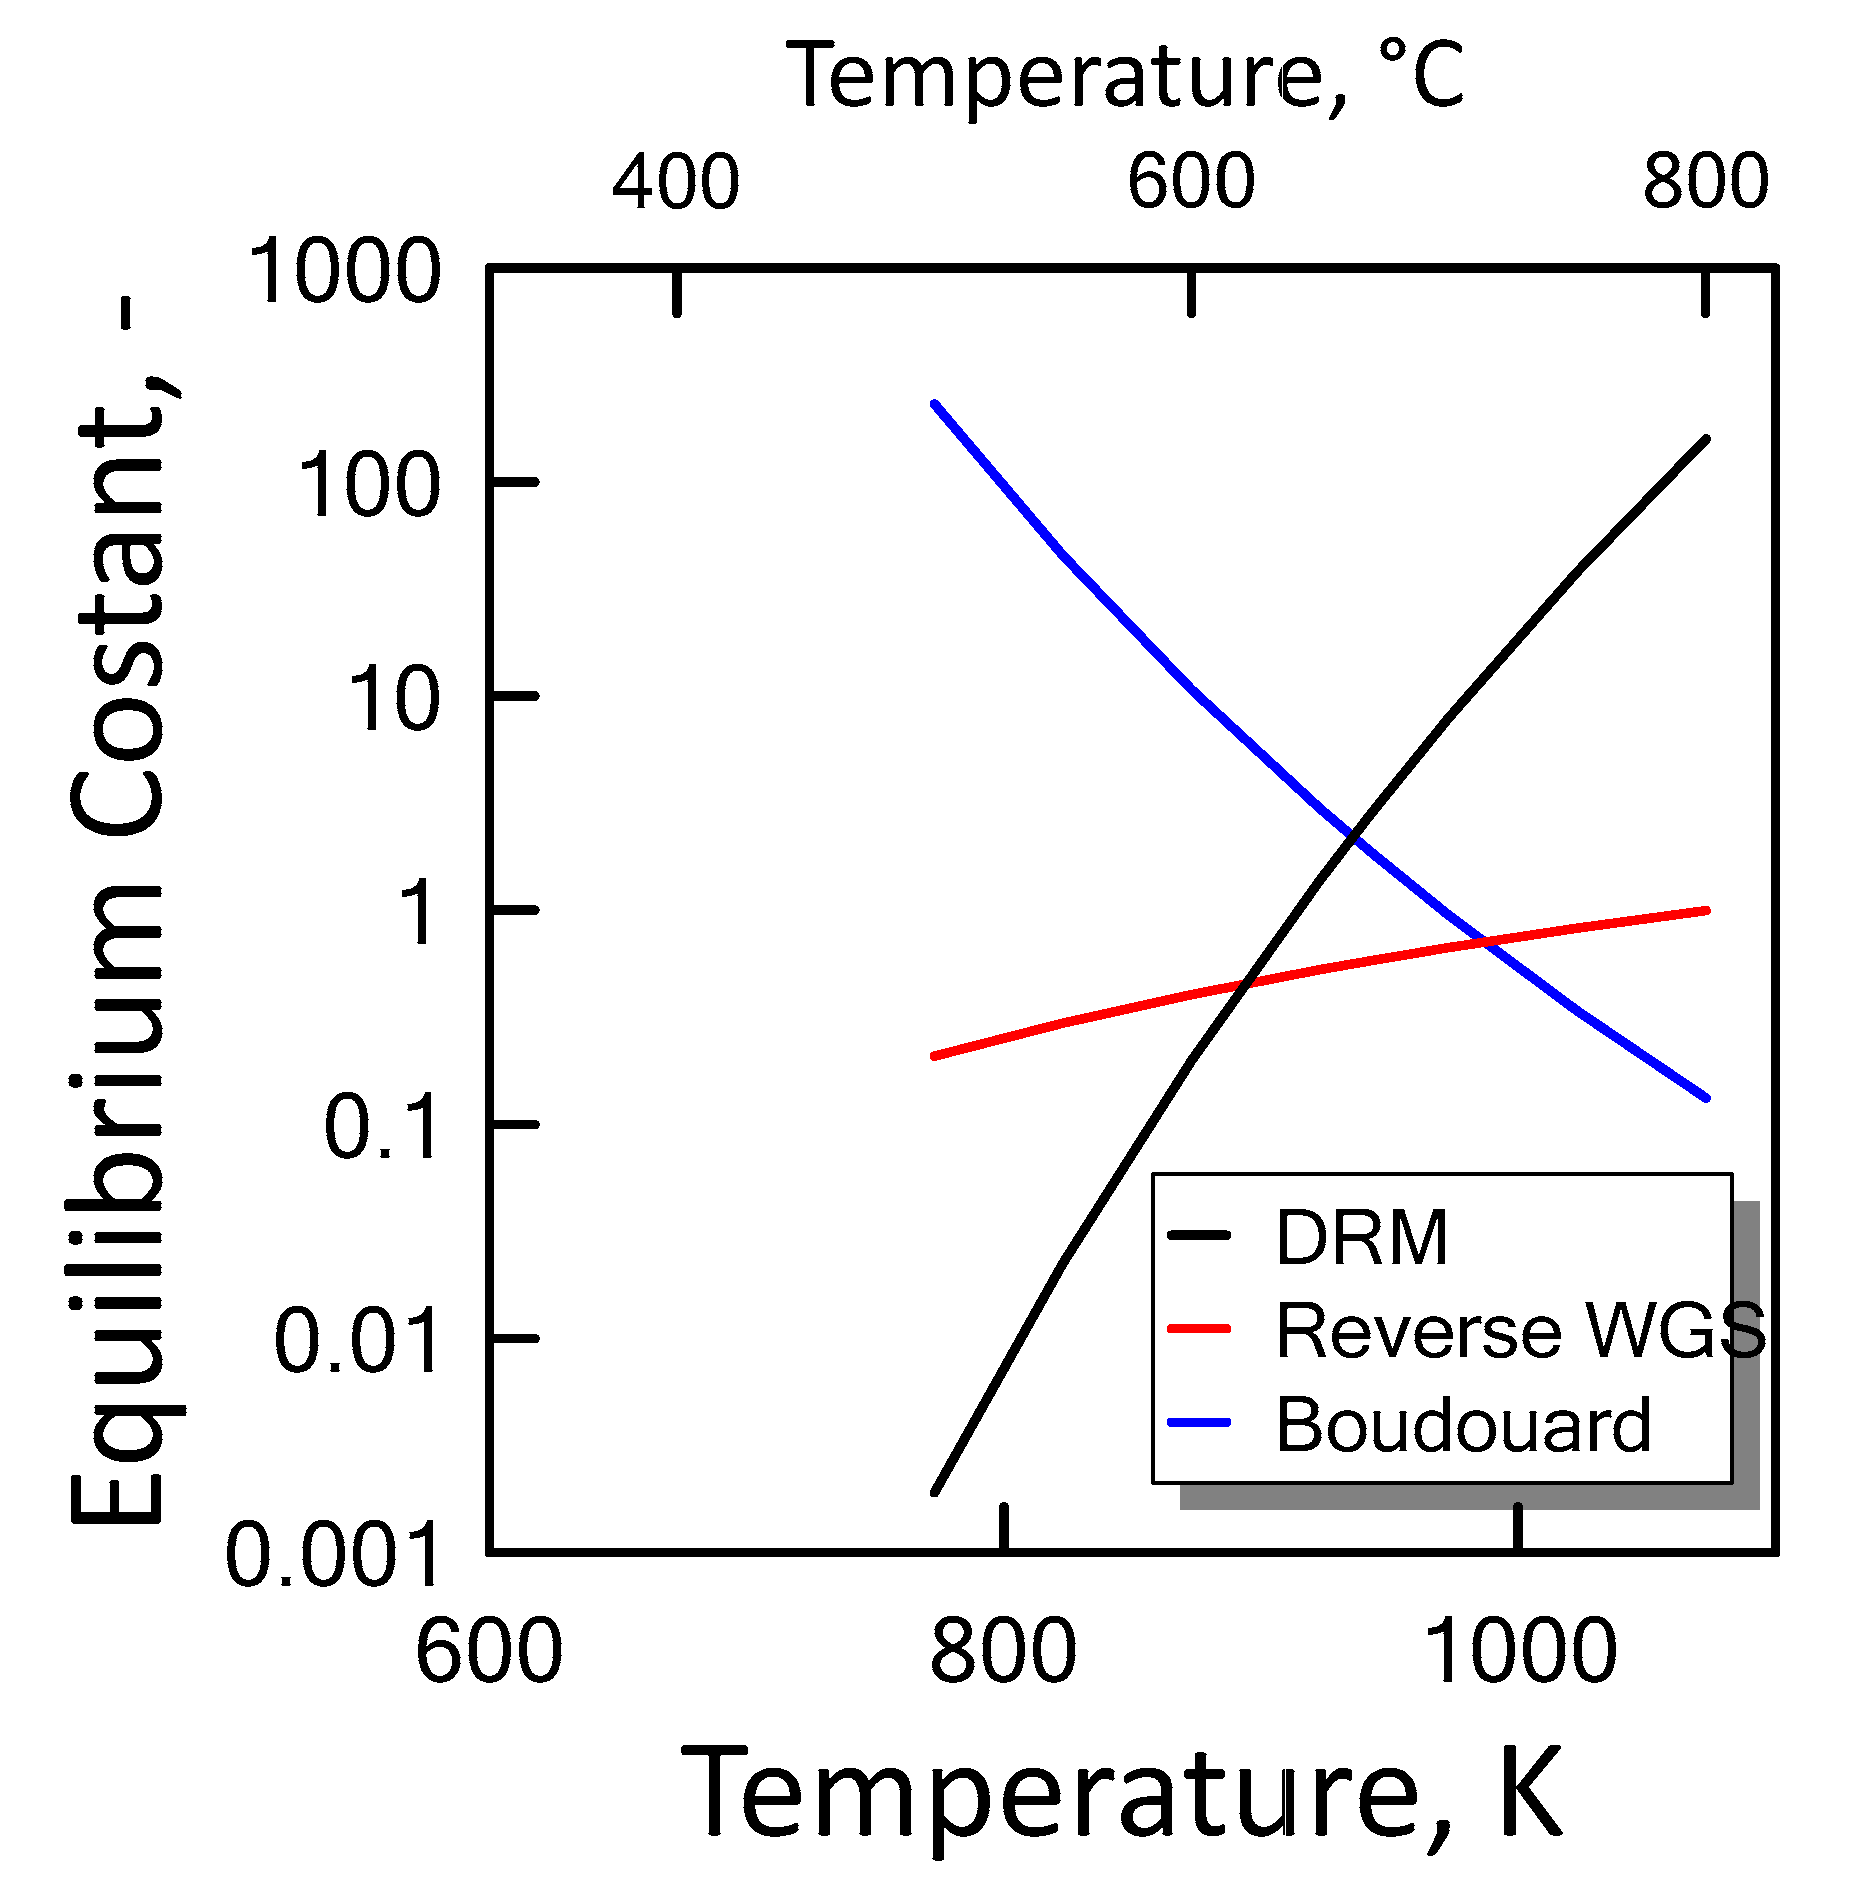
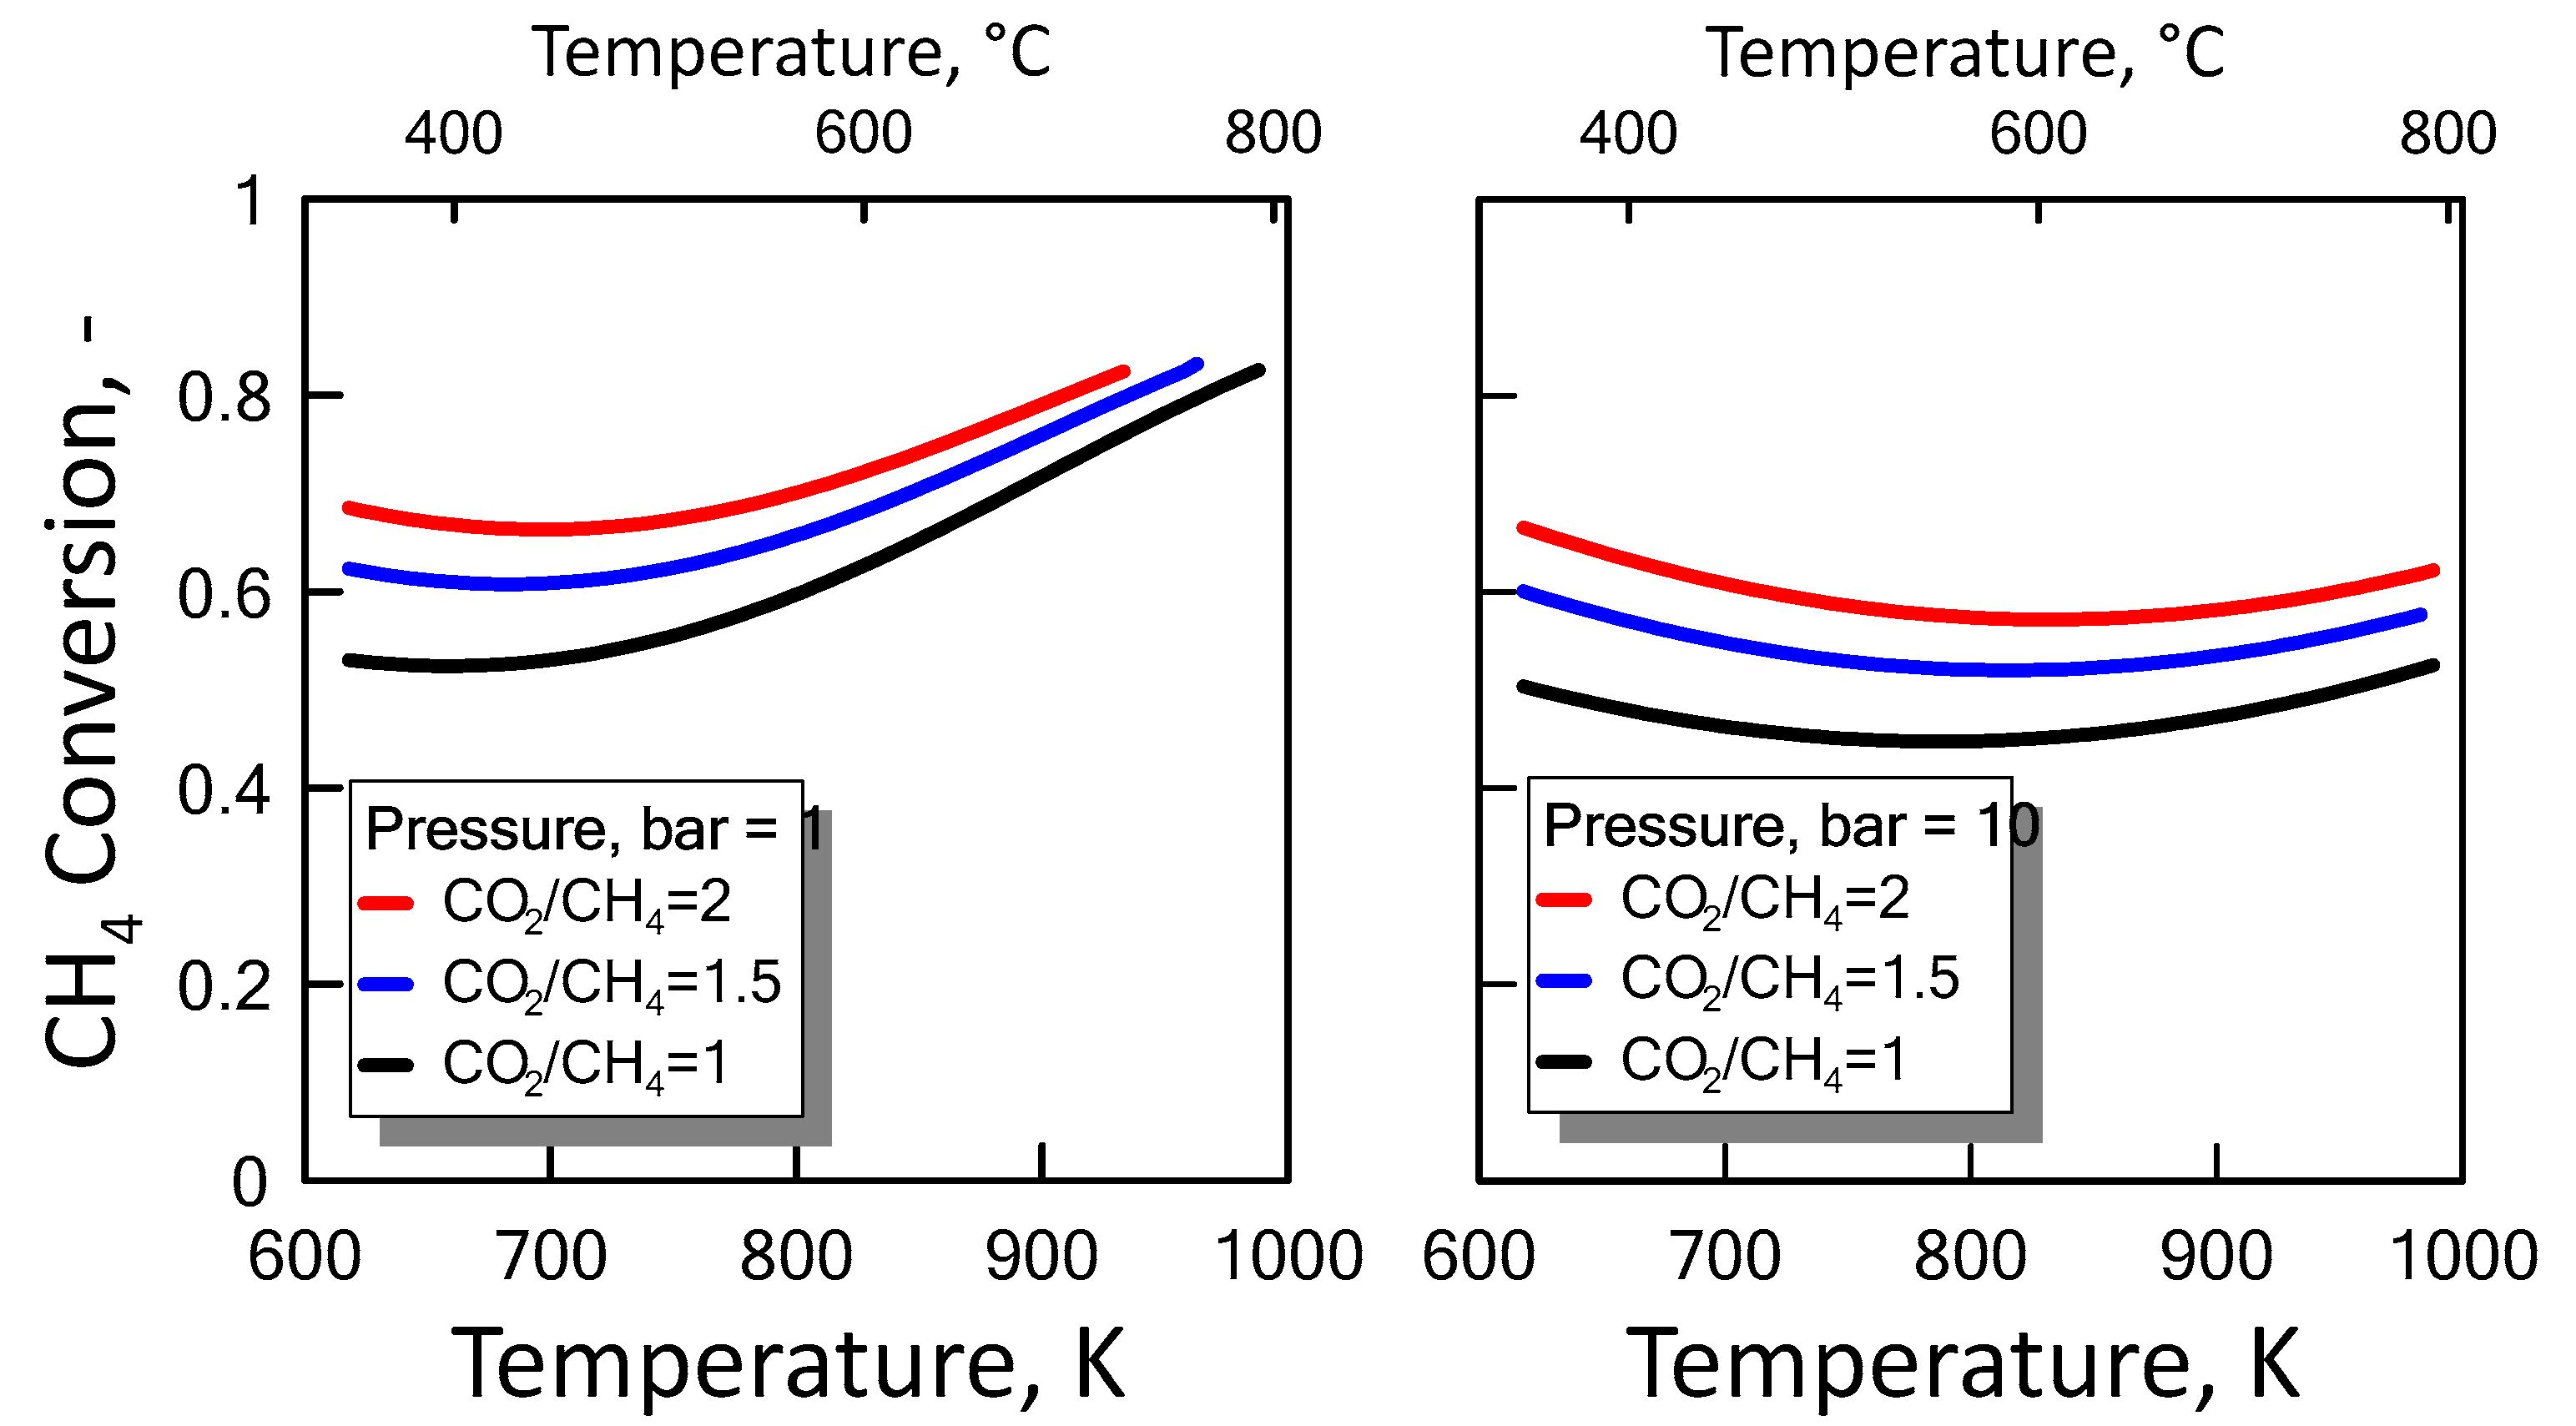
Carbon formation is one of the basic phenomena when hydrocarbon species are involved in chemical reactions. It is therefore interesting to examine its effect on the reaction. Figure 6 shows the equilibrium constants variation of the reactions involved as a function of temperature. For a strong endothermic reaction, DRM equilibrium constant increases dramatically with increasing reaction temperature. Thus, high conversion is favored at high temperatures. The equilibrium constants of the moderate endothermic reactions, the reverse WGS reaction, also increase with temperature. The carbon deposition by Boudouard reaction is exothermic and thermodynamically unfavorable at high temperatures. Therefore, high reaction temperatures are more favorable to increasing the equilibrium conversion of the DRM reaction than that of the side reactions. The equilibrium results for the case with carbon formation for DRM process as a function of temperature are showed in Figure 7 at pressure of 1 bar (left side) and 10 bar (right side) by varying CO2/CH4 feed molar ratio, and in Figure 8 at CO2/CH4 feed molar ratio of 1 (left side) and 2 (right side) by varying pressure. At a relatively low temperature, the equilibrium constant of the Boudouard reaction is much higher than the unity and, thus, the formation of coke and CO2 is favoured. This causes an enhanced conversion of methane due to a major presence of CO2, whose consumption by RWGS is not sufficient to overcome the effect of the Boudouard reaction. At a moderately higher temperature, however, the influence of the Boudouard reaction is modest and, at the same time, that of RWGS increases. This causes a higher consumption of CO2, which tends to push the equilibrium of DRM towards the reactants leading to a slightly lower CH4 conversion. On the other hand, at a higher temperature the DRM is favoured over both RWGS and Boudouard reactions, causing a boost in the CH4 conversion. The overall result of these different tendencies is the presence of minima in the trends shown in Figure 7 and Figure 8, which are justly caused by considering the effect of the Boudouard reaction.
Furthermore, carbon formation is more important as both pressure and CO2/CH4 feed molar ratio increase.
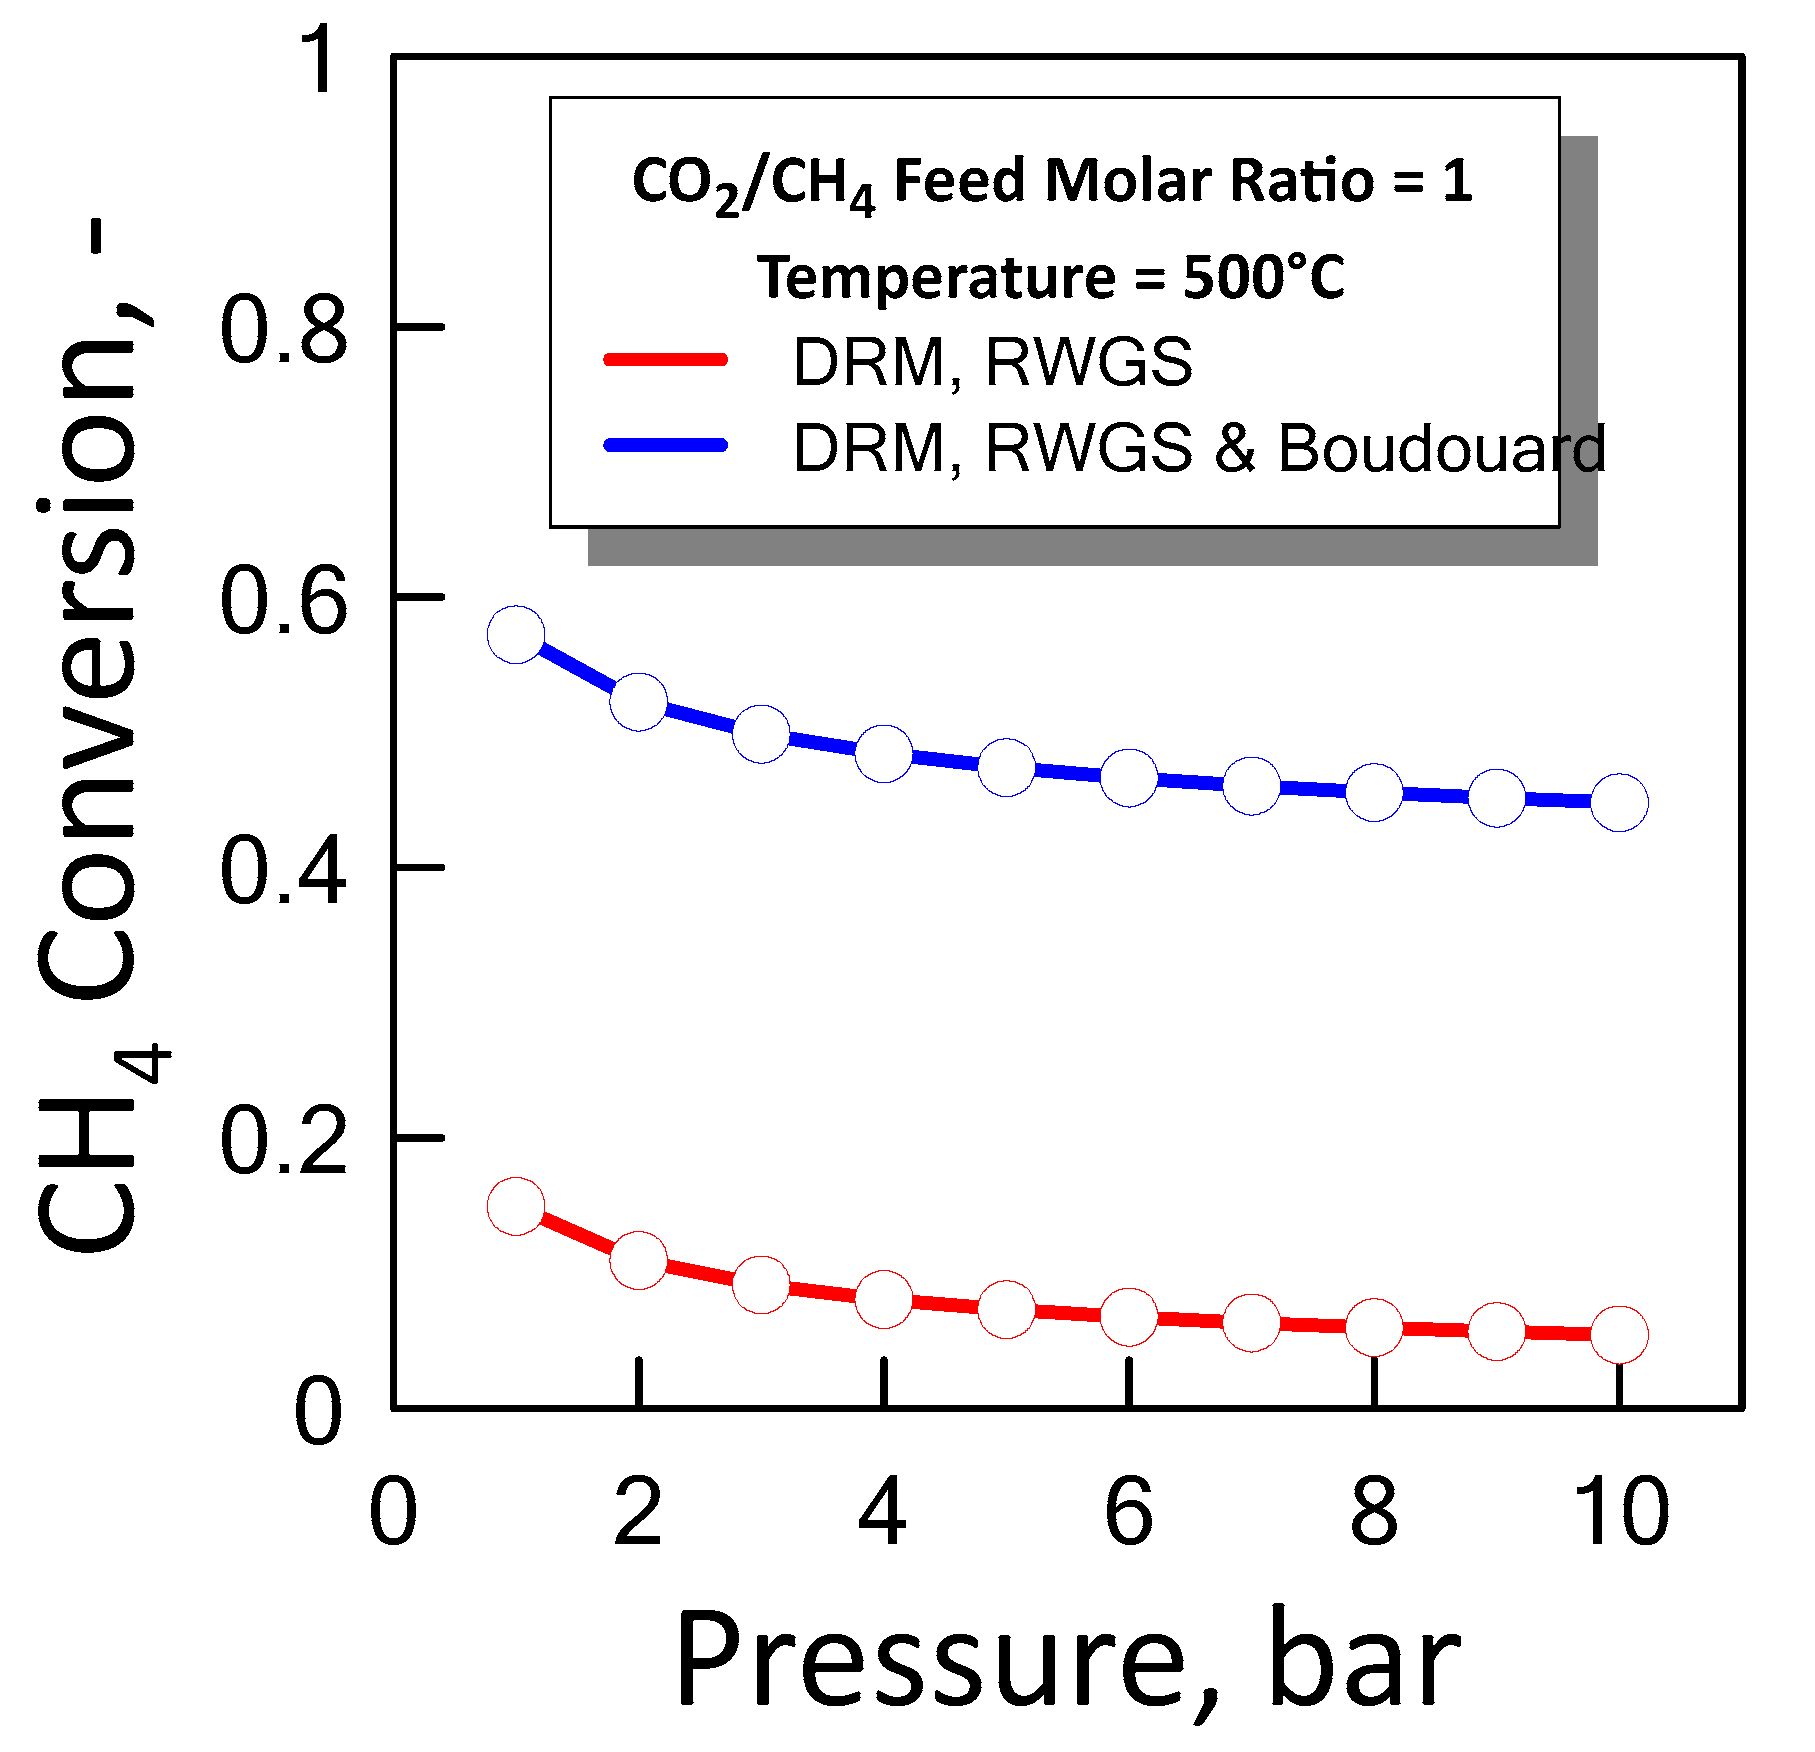
Figure 9 shows the CH4 equilibrium conversion as a function of pressure at temperature of 500 °C and a CO2/CH4 feed molar ratio of 1 for both cases previous described. In an ideal situation the optimum condition in which it operates is between the two equilibrium curves, i.e., lower than methane conversion which takes into account coke formation, and greater than methane conversion that does not take into account coke formation.
3.2. Permeation Measurements
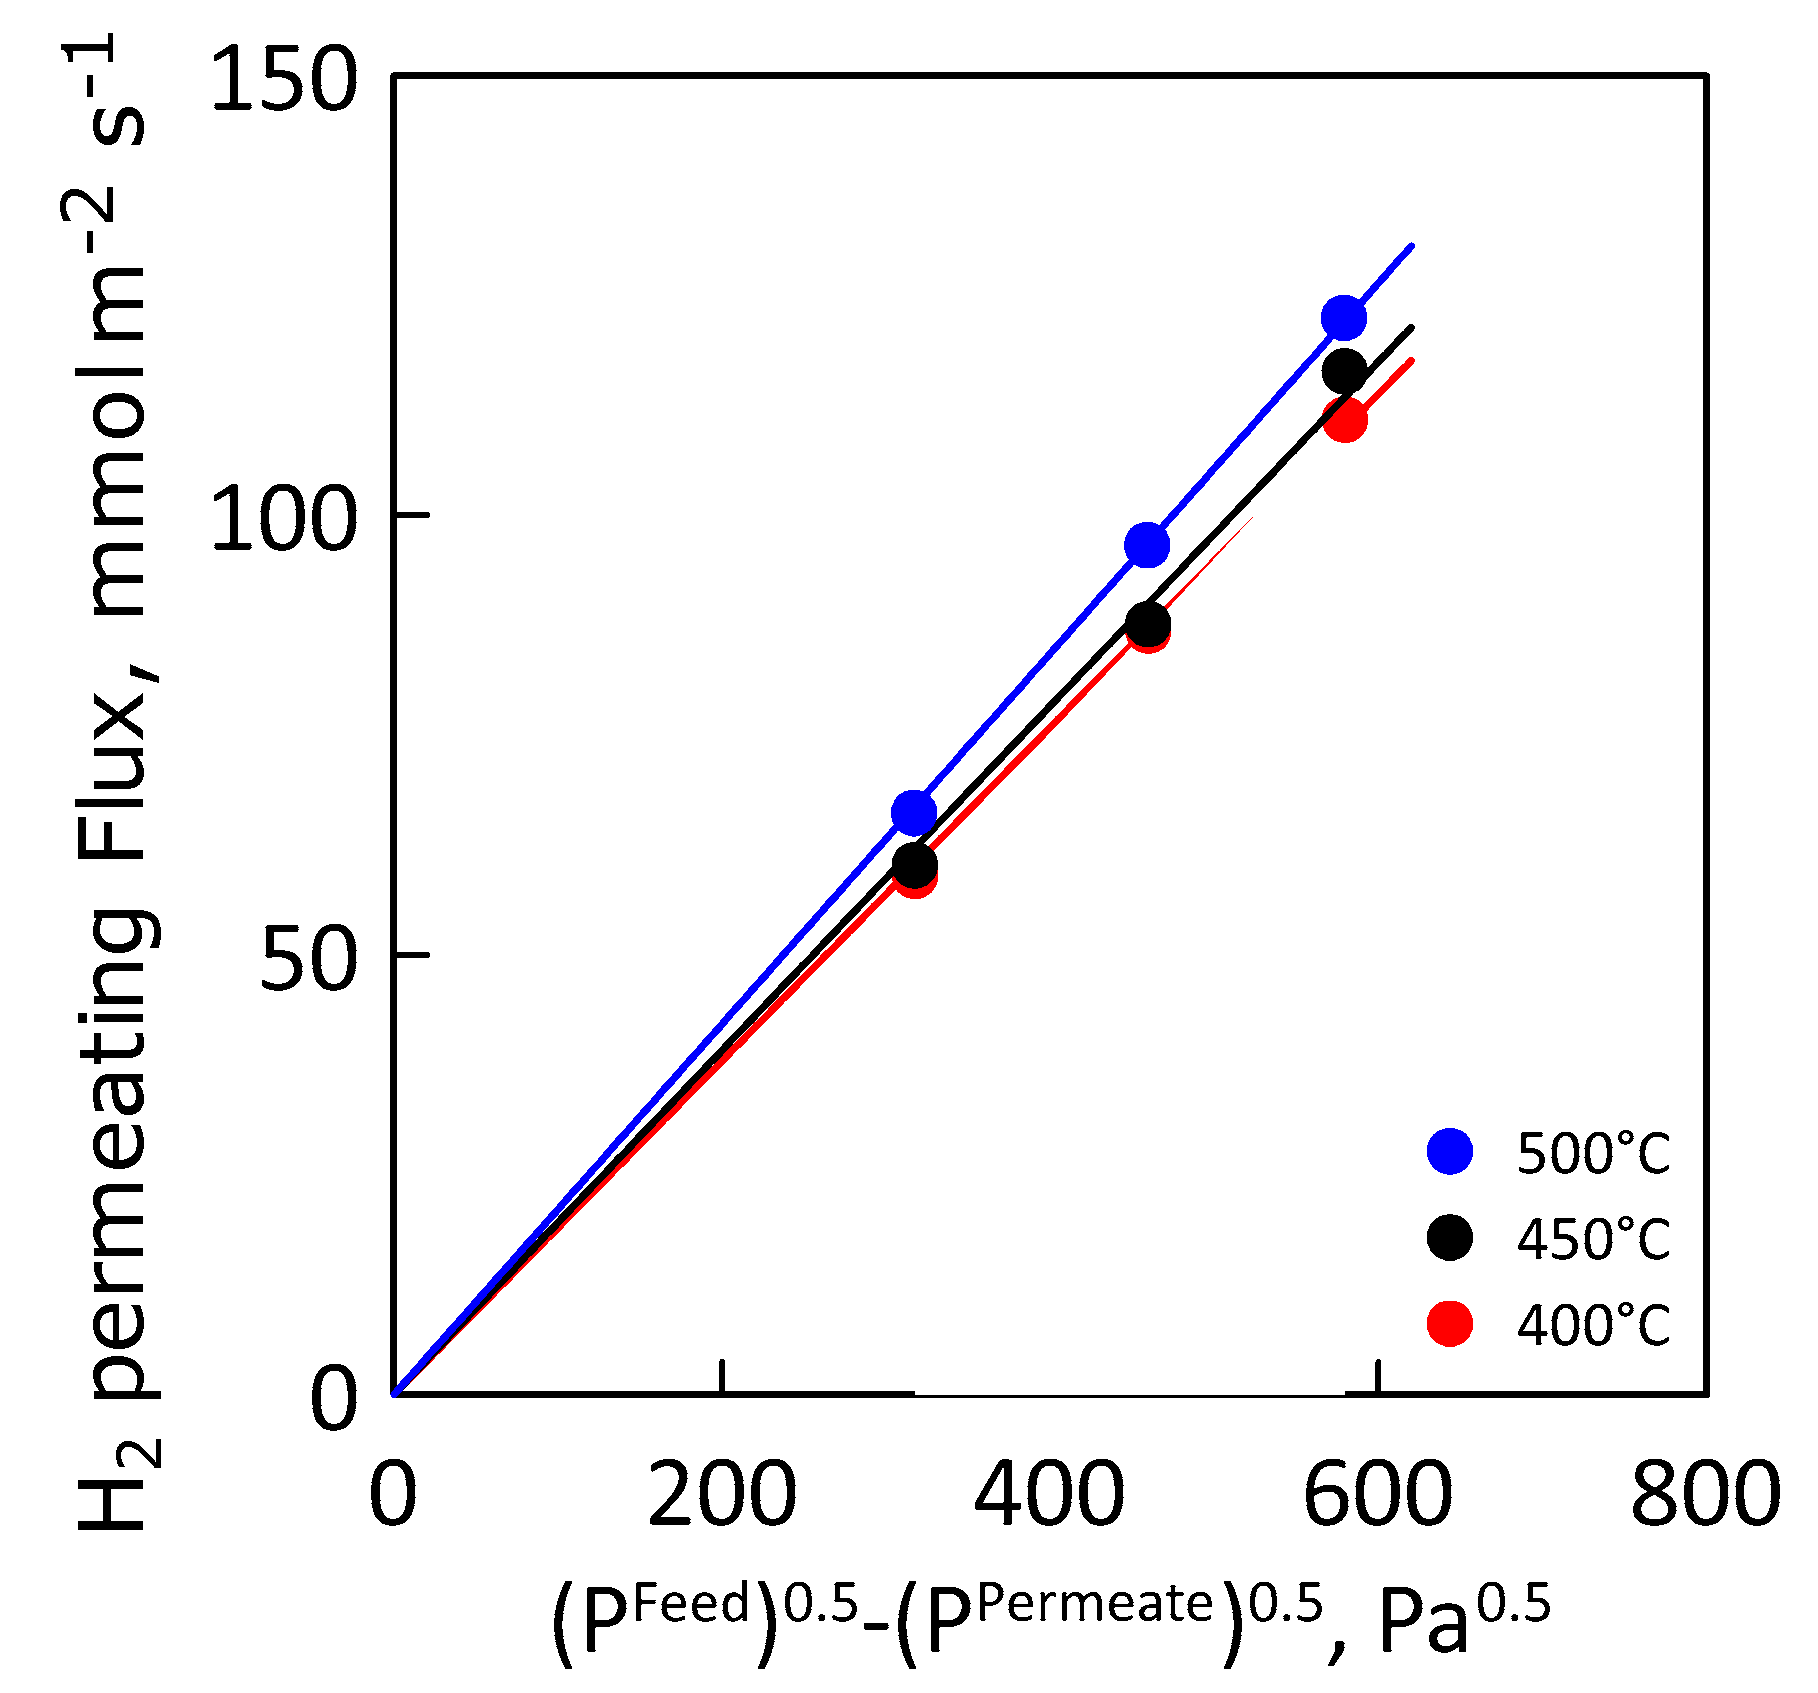
Figure 10 shows the hydrogen permeating flux as a function of the Sieverts′ permeation driving force at different values of temperature. As expected, hydrogen flux increases linearly with increasing driving force, indicating an ideal membrane behavior (i.e., permeation completely controlled by internal diffusion and hydrogen concentration in the metal lattice close to the infinite dilution).
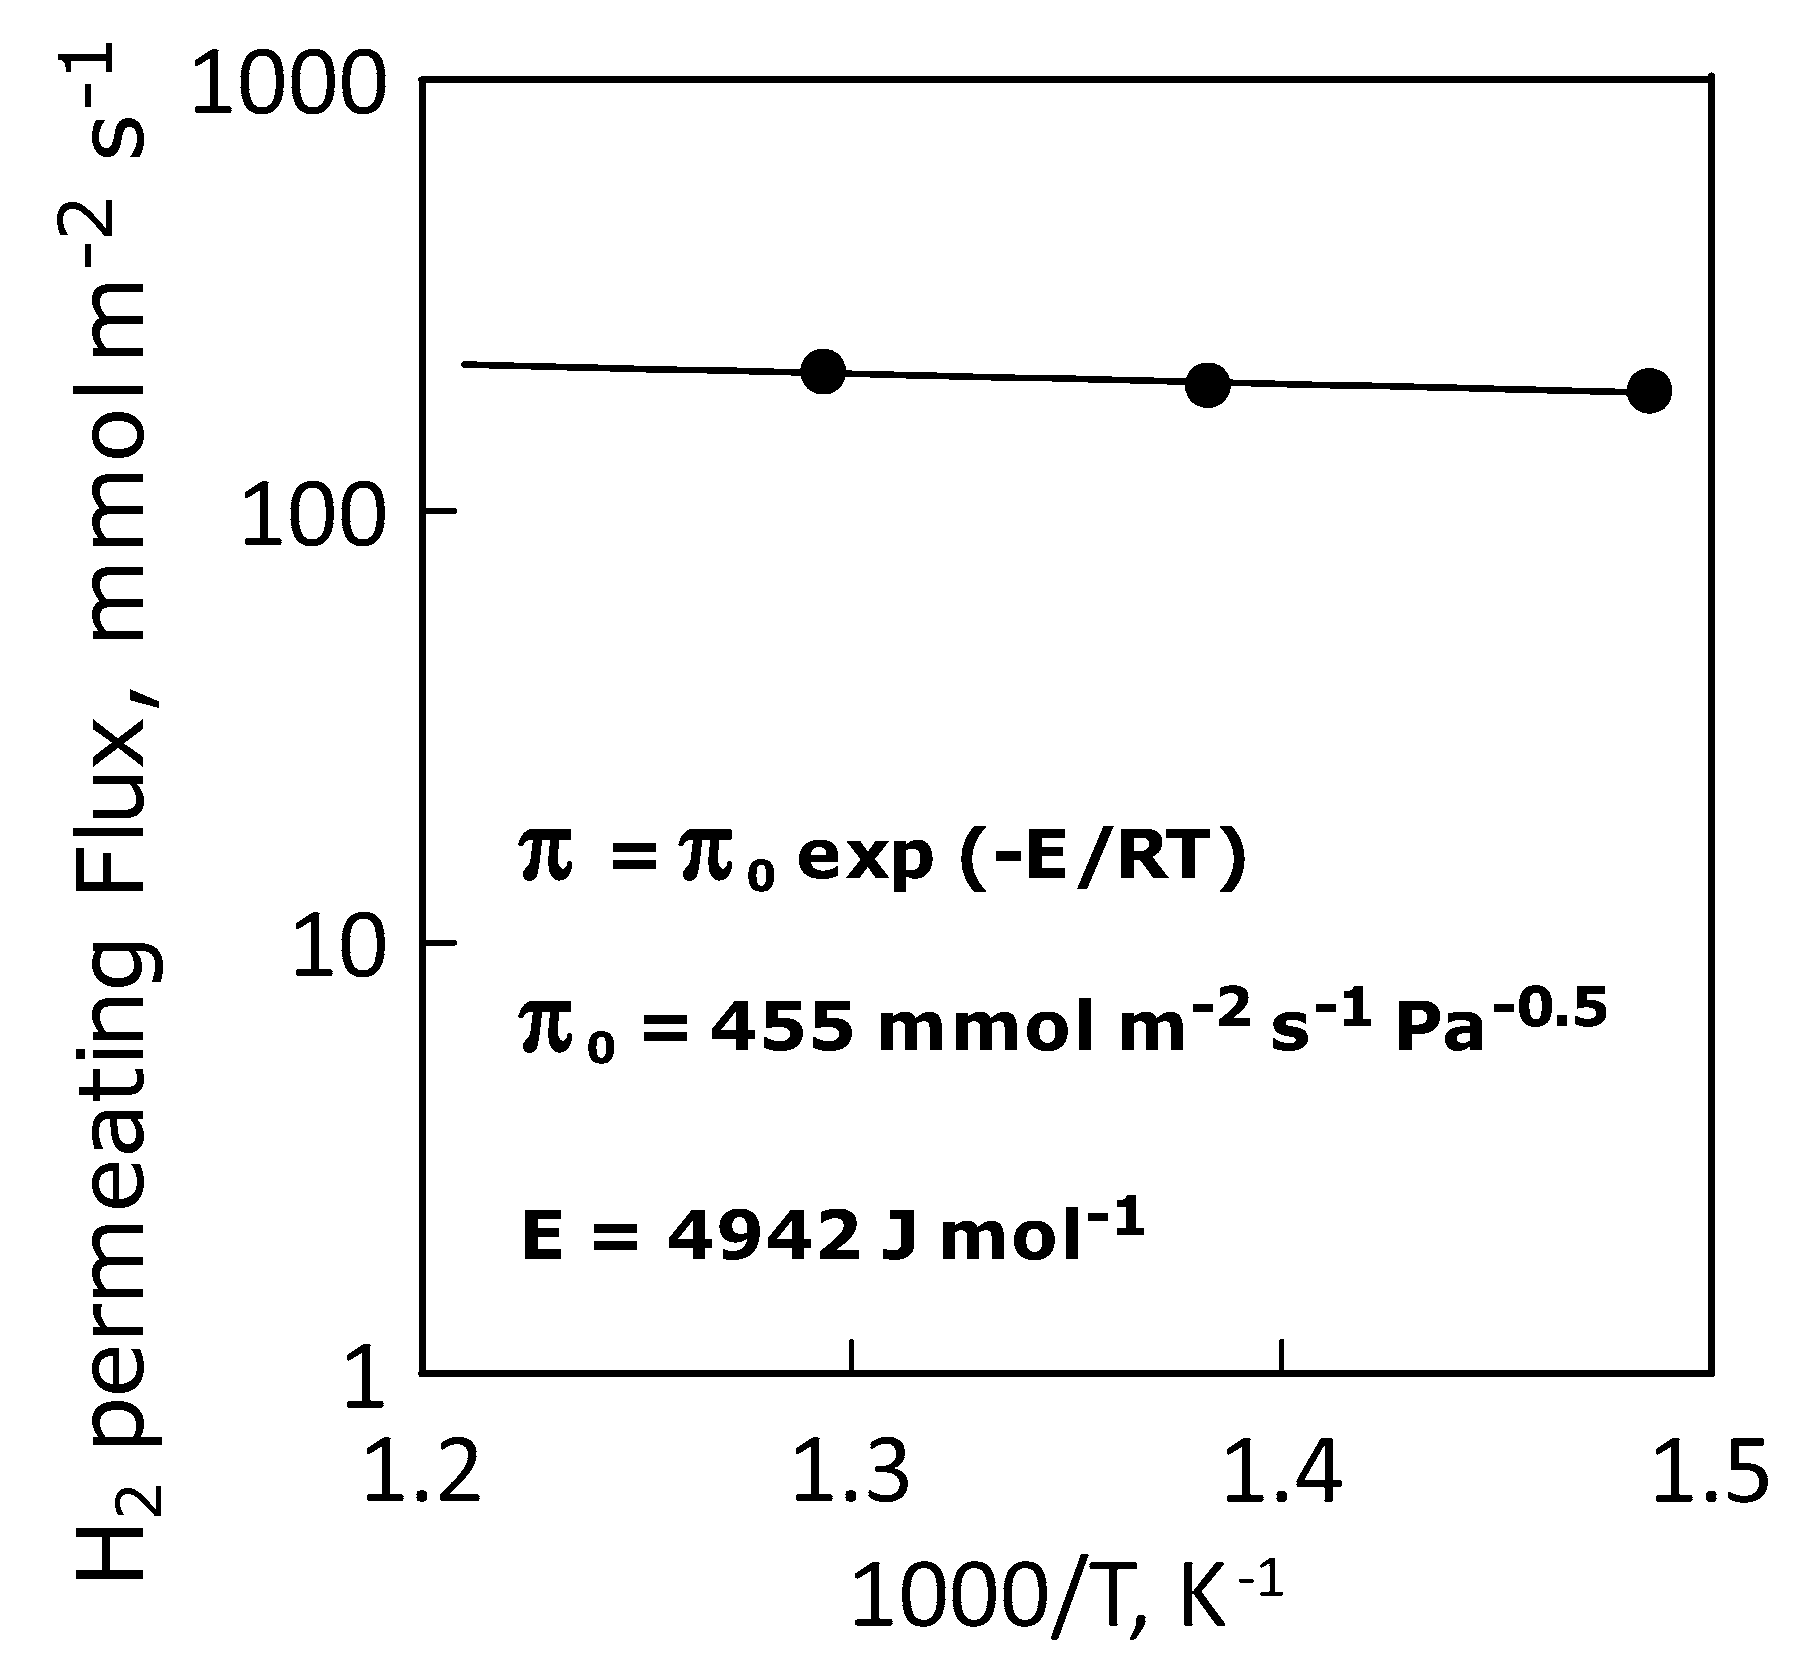
This situation is confirmed by the Arrhenius-type plot of the hydrogen permeance, which shows a linear trend indicating an ideal permeance (and, thus, permeability, Figure 11). Table 4 summarizes the values of apparent activation energy, pre-exponential and hydrogen permeance at the temperatures considered.
It must be noticed that the reaction experiments lasted ca. 500 h—alternating reaction with regeneration by methanation—and no drop of separating properties of the membrane, measured before and after reaction, was observed during this time.
3.3. Reaction Measurements
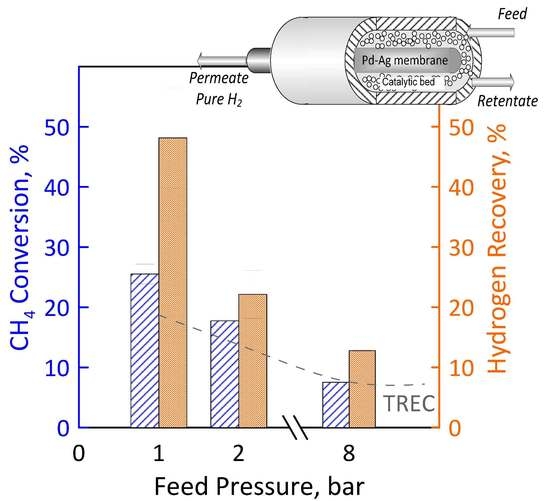
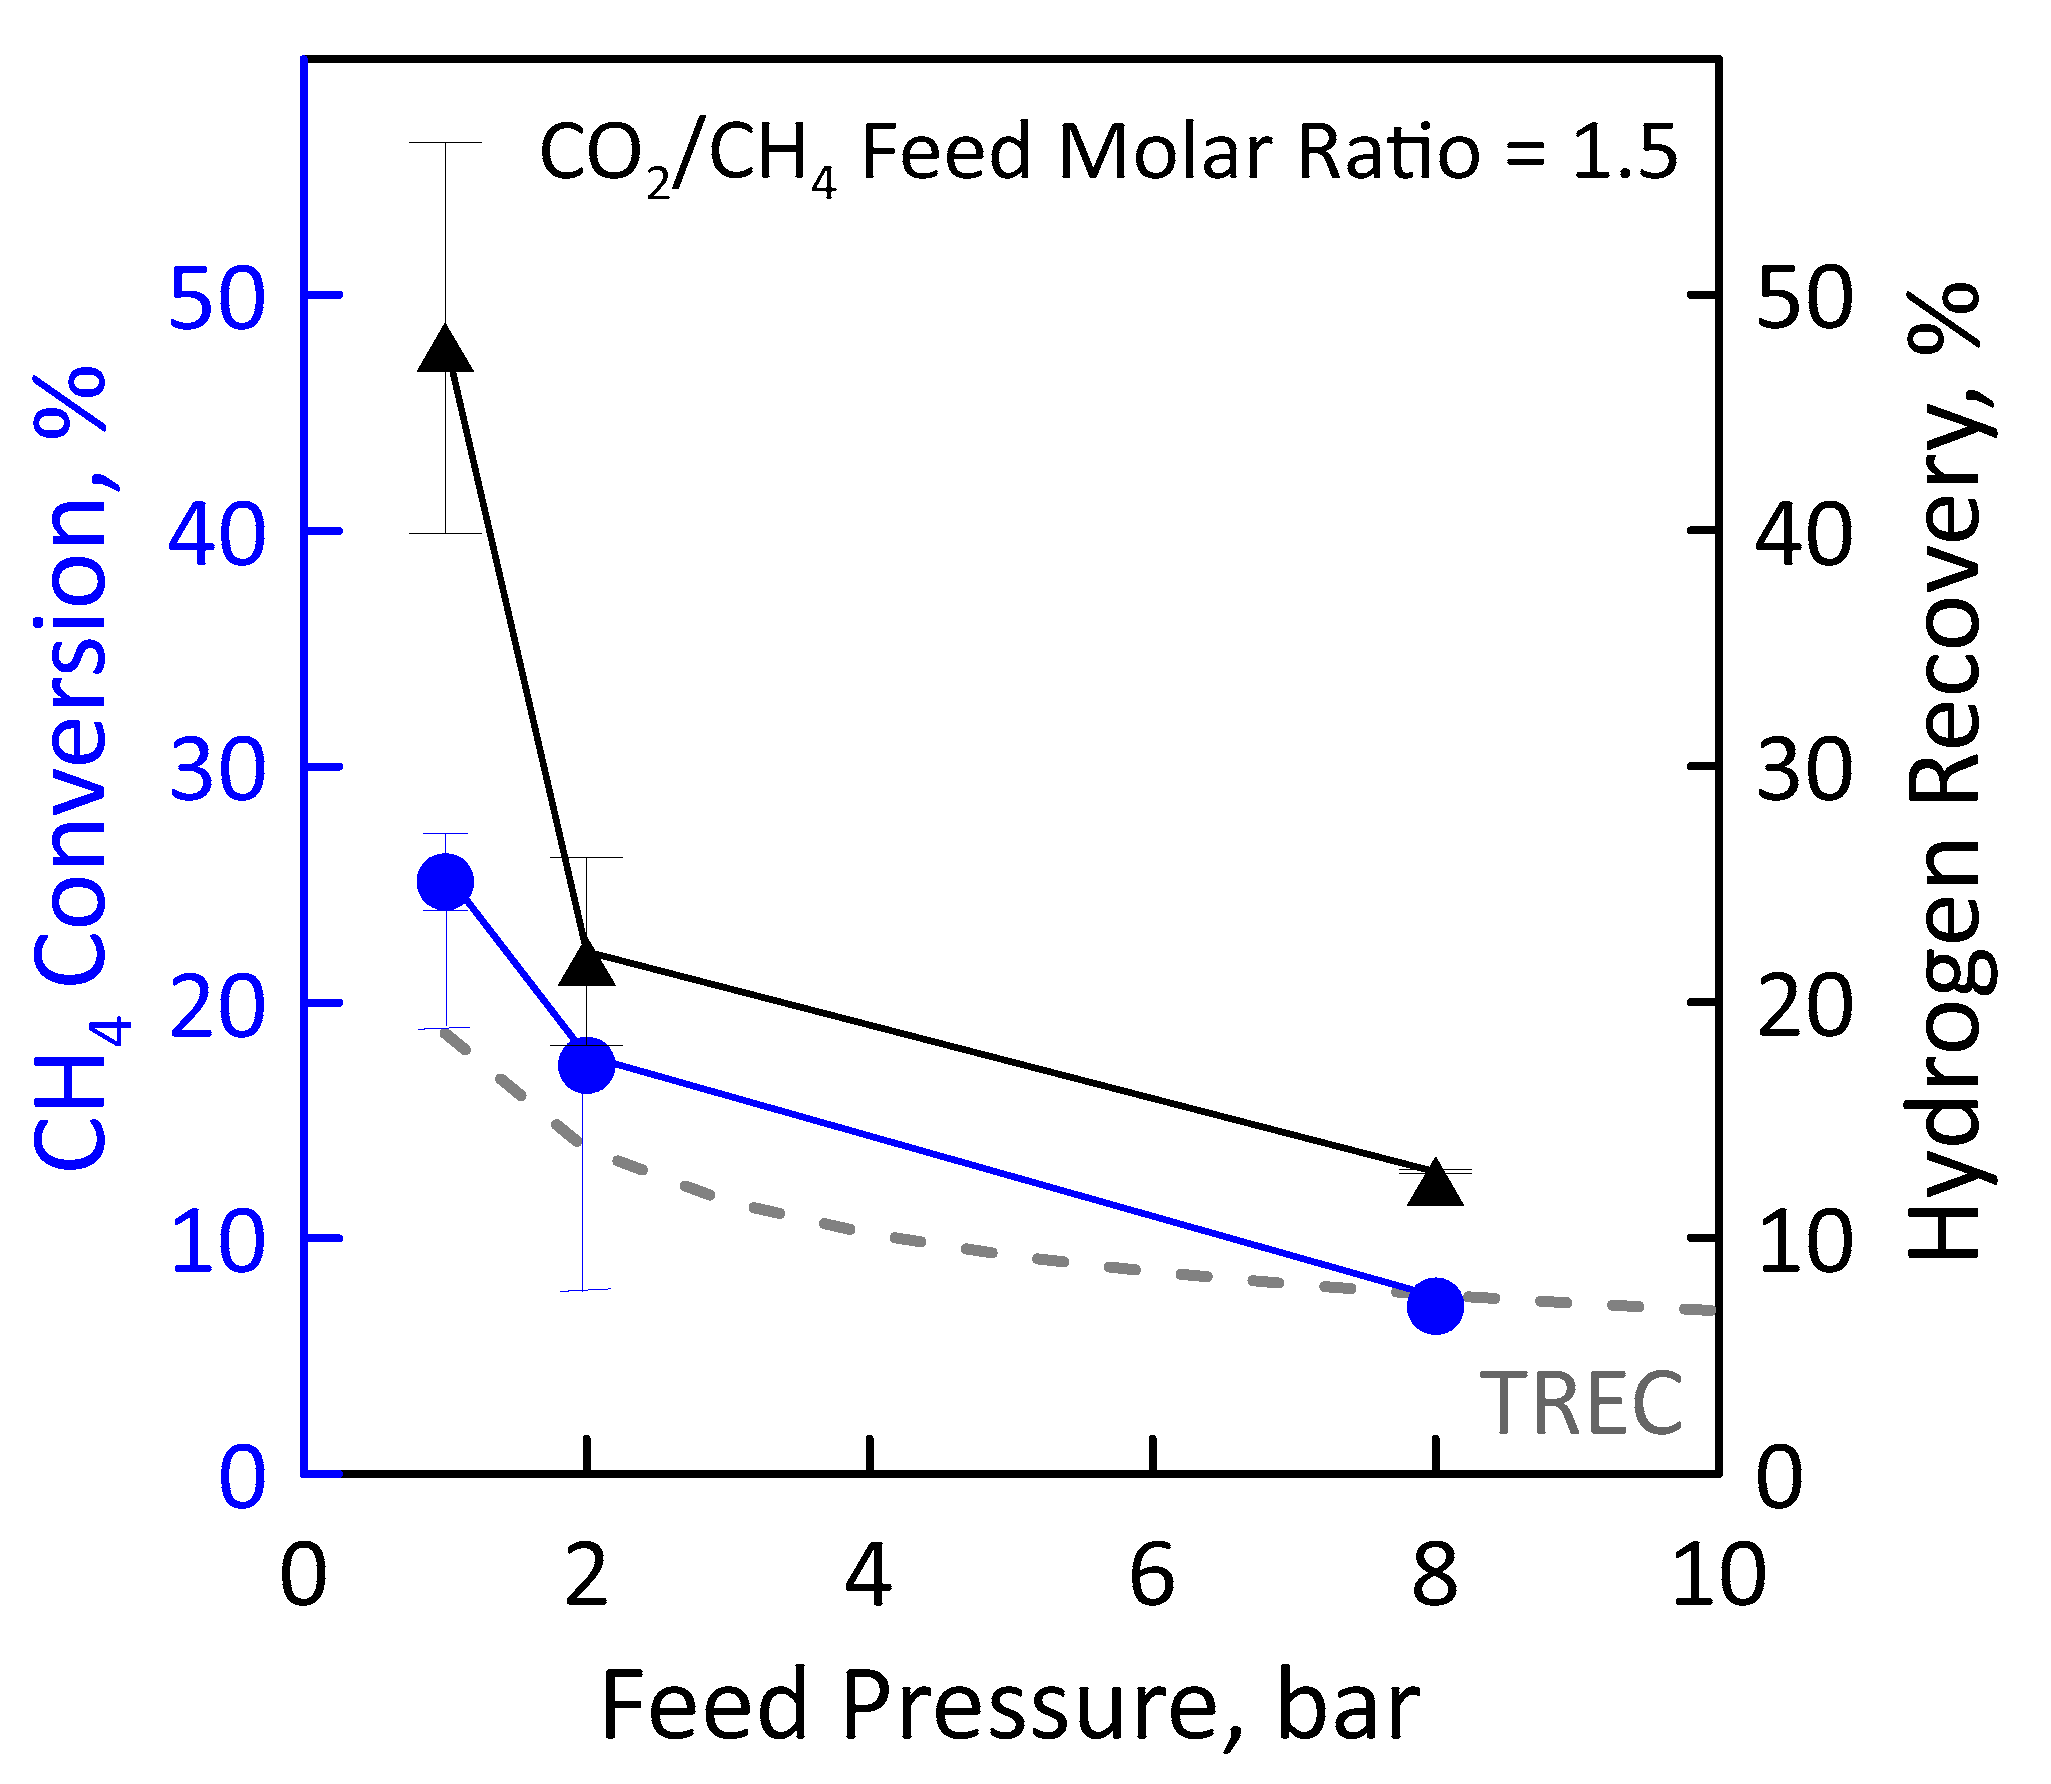
Before performing the DRM reaction measurements in MR, the catalyst activation was carried out in the presence of gas mixture having a molar concentration 90:10 = H2:N2 at 400 °C and atmospheric pressure for two hours. The values of CH4 and CO2 feed flow rates were calculated and set by fixing CO2/CH4 feed molar ratio, GHSV (space velocity), temperature and feed pressure. Figure 12 (left axis) shows the CH4 conversion as a function of the feed pressure at GHSV of 100 h−1, temperature of 500 °C and CO2/CH4 feed molar ratio of 1.5. The error bars indicate the carbon balance. The experimental conversion values obtained in the MR were compared with the equilibrium conversion obtained in the traditional reactor. In particular, the experimental CH4 conversion was found to decrease with increasing feed pressure according to Le Chatelier-Braun principle since there is a net increase in the number of moles. It is noticeable that at sufficiently low feed pressures (1 bar in the specific case), the experimental conversions in the MR were higher than equilibrium conversion of a TR since the removal of the H2 product shifts the equilibrium to the right. The permeation supplies such a significant contribution to overcoming the equilibrium performance. The higher feed pressure hinders the conversion since the reaction occurs with an increase in molar number, thus the hydrogen partial pressure on the feed side is lower and, similarly, its permeation.
These data were obtained considering a permeate pressure of 0.02 bar. We decided to operate under vacuum for increasing the permeation rate. CH4 conversion obtained at the permeate pressure of 1 bar is less than that of the equilibrium. With a low hydrogen permeate pressure value it is, thus, possible to significantly exceed the thermodynamic limit of the traditional reactor, reaching conversion significantly higher.
A higher methane conversion means a higher methane amount that reacts for producing hydrogen. For this reason, the hydrogen recovery follows the same trend as that of conversion (Figure 12, right axis). At a feed pressure of 1 bar and 0.02 bar of vacuum on the permeate, about 47% of hydrogen is recovered as a pure stream in the permeate. A higher feed pressure means a lower CH4 conversion, and, thus, less hydrogen produced and that can be recovered. However, it has to be pointed out that, even in the worse conditions (i.e., 8 bar), around 15% of hydrogen is recovered.
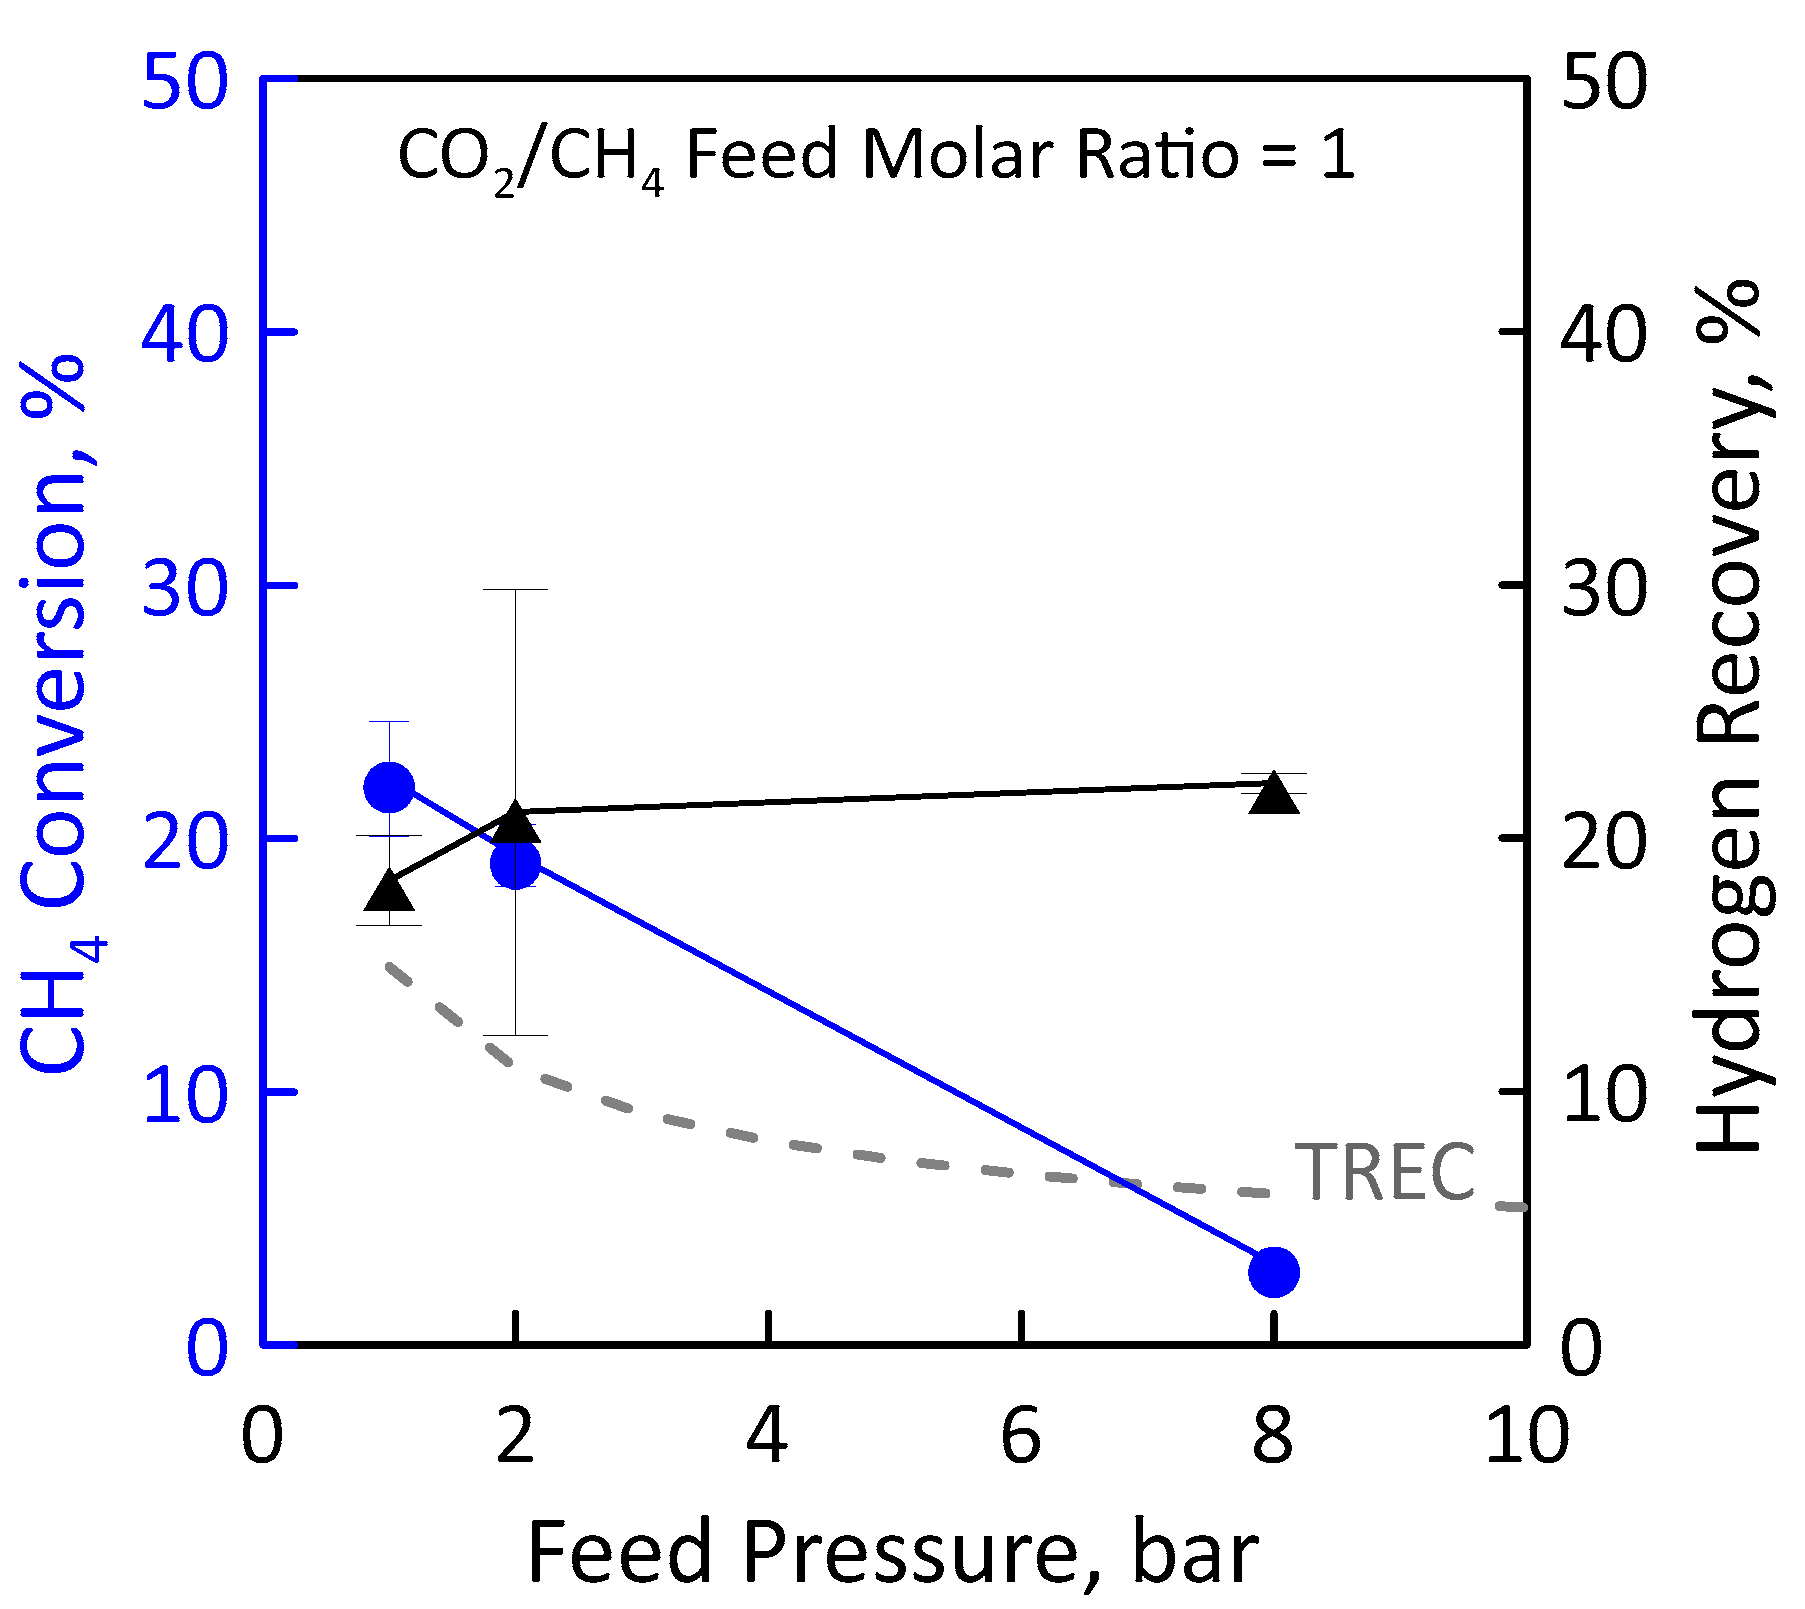
Another reaction measurement was carried out at stoichiometric feed molar ratio under the same operating conditions as the just-analyzed ones (Figure 13). Additionally, in this case, the CH4 conversion decreases with pressure (Figure 13, left axis). At low pressures, the experimental conversions in the MR are higher than equilibrium conversions since the removal of H2 product shifts the equilibrium to the right. However, at the high pressure, the conversion in the MR is lower than the equilibrium one. This is a non-favourable condition because, despite using an MR, the H2 permeation through the membrane cannot compensate the feed pressure negative effect induced by thermodynamics. Therefore, the reactor behavior is similar to that of a TR. Figure 13 (right axis) shows the effect of feed pressure on the H2 recovery. Although conversion is low, a hydrogen recovery of about 20% was found. This could mean that, despite the small amount of methane converted, a sufficiently large amount of hydrogen is produced by reaction to permeate through the membrane. In an MR, a high feed pressure involves an increase of hydrogen permeation driving force, favouring a higher hydrogen removal from the reaction side towards the permeate side with a consequently higher hydrogen recovery. The opposite trend between methane conversion and hydrogen recovery can be justified by the combination of the negative effect induced by thermodynamics and the positive effect induced by permeation.
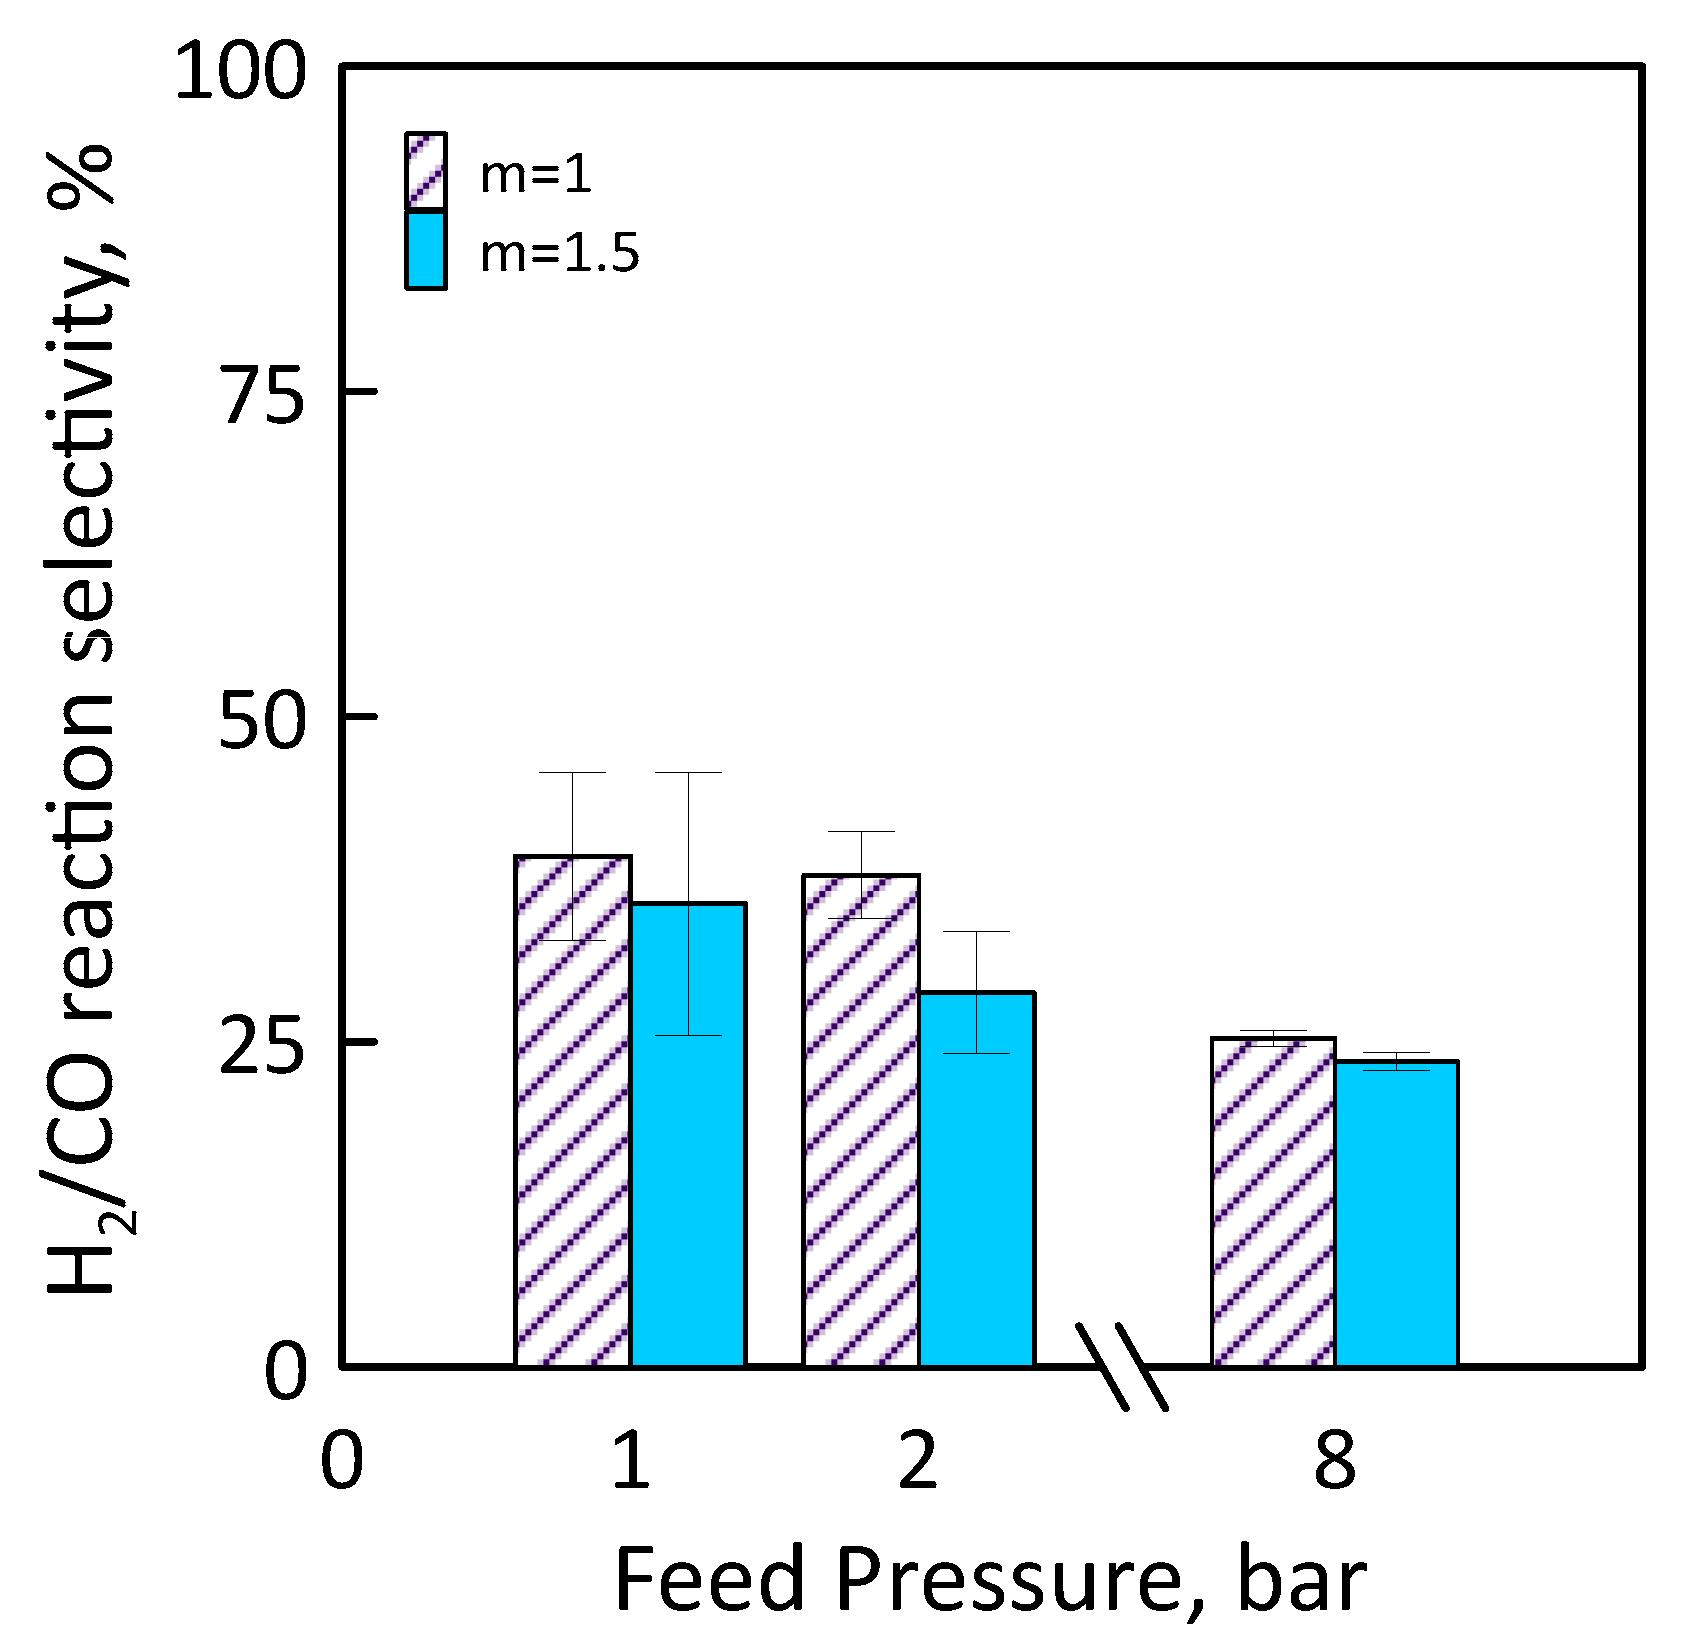
Figure 14 shows H2/CO reaction selectivity as a function of the feed pressure for different feed molar ratio. As feed pressure increases, H2/CO reaction selectivity decreases. It is less than 100% for all feed pressure range considered, that is, the CO amount produced is greater than that of H2. This could mean that, operating at CO2/CH4 feed molar ratio of 1.5, H2 product reacts with CO2 fed (in excess) to produce CO and H2O by reverse WGS side reaction.
4. Conclusions
This work consists of an analysis of dry reforming of methane in a catalytic Pd-based membrane reactor. A 0.5 wt % Ru/Al2O3 catalyst was packed in the annulus between the shell and a Pd-Ag commercial membrane and the performance of the MR were analyzed as a function of feed pressure and feed molar ratio. The whole experimental period lasted about 500 h and any significant change in membrane permeation properties was observed during this time. Moreover, the catalyst was stable for the whole reaction period (alternated by a periodic regeneration with a diluted stream of 10% H2 in argon), with no drops of its activity. Coke formation was continuously monitored, and carbon balance was below ±10%. The higher conversion was achieved at low feed pressures owing to the favourable thermodynamics, reaching a higher value than the equilibrium one obtainable in a traditional reactor thanks to the hydrogen permeation through membrane. At 500 °C, MR showed good performance in terms of both CH4 conversion and hydrogen recovery (CH4 conversion = 26% and H2 recovery = 46% @ 100 h−1, 1 bar, 0.02 bar on permeate side) exceeding the traditional reactor equilibrium conversion. Comparing the results, it can be deduced that at a CO2/CH4 feed molar ratio of 1.5 there is a higher methane conversion but a lower H2 recovery and H2/CO reaction selectivity with respect to the stoichiometric feed molar ratio. This could indicate that both the reverse WGS and Boudouard reactions occur along with DRM, meaning that part of the H2 produced is consumed to make water as a by-product, and part of CO produced is consumed to produce coke. So far, the main limitation to DRM industrialization remains as coke formation. The development of new catalysts with high and stable activity, is thus highly recommended. Membrane engineering with MR technology can play a fundamental role in the integration of the units and processes and, at the same time, in the definition of the knowledge necessary to drive the process by maximizing the gains both in terms of efficiency, productivity and plant size reduction.
Author Contributions
Conceptualization, A.B., G.B. and A.C.; Methodology, A.C.; Software, A.C.; Validation, M.G.; Formal Analysis, M.G. and A.C.; Investigation, M.G. and A.C. Resources, G.B. and A.C.; D.C., A.C.; Writing—Original Draft Preparation, A.C. and A.B.; Writing—Review & Editing, A.B. and A.C.; Supervision, A.B., A.C., G.B.
Funding
This research received no external funding.
Conflicts of Interest
The authors declare no conflict of interest.
Appendix A
Appendix A.1. Calculation Approach for Thermodynamic Equilibrium
The following sub-sections report the details of the calculation approach used to evaluate the equilibrium trend of DRM in the presence of the following side-reactions: The RWGS and Boudouard reaction.
The total Gibbs free energy of a single-phase only for a gas or a solid system can be respectively represented by Equations (A1) and (A2):
Hence, the total Gibbs free energy of a two-phase system is written as Equation (A3):
The standard state is defined as the pure ideal gas state at 1 atm, and equals to zero for each element in its standard state. The solid phase is assumed as a pure solid carbon and its reference state is at atmospheric pressure and 25 °C. The partial fugacity is written as shown in Equation (A4):
The total Gibbs free energy of the system is expressed in Equation (A5) by the summation over N species:
where Gi° is the Gibbs free energy of species i under standard conditions, R is the universal molar gas constant, fi° and fi are fugacity of species i at standard and operating conditions, respectively, ni is the number of moles of species i, and T is the temperature. If carbon is formed in the overall reactions, ns represents the number of solid carbon molecules, while Gs is the Gibbs free energy of solid carbon at the operating conditions.
To reach equilibrium, Gibbs energy is minimized with respect to reaction degree ξ for which there are constraints to be respected (Equation (A6)). The necessary condition to have a minimum of Gt is reported in Equation (A7).
The vector of the reaction degrees ξ is written between the species involved in a reaction by a mass balance between both the initial and generic condition (Equation (A8)). As the number species in the system, more variables are necessary. In particular, many reactions degree as reactions are in the system. A reaction constrains the moles number variation of each species through the stoichiometry. Moles number must be positive.
where is moles number of the specie i at reaction inlet (=0), is stoichiometric coefficient of specie i in the reaction j and NR is number of independent reactions.
Appendix A.2. Equilibrium Calculation: Numerical Procedure
The thermodynamic equilibrium condition of a reaction system is calculated using the Gibbs free energy minimization method, at both constant P and T and with given initial composition. This method is based on the principle that the total Gibbs energy of system has its minimum value at chemical equilibrium. Furthermore, it requires the formalization of the reactions and the identification of all the species, beyond the reactants, which may be present at equilibrium.
The reactions used must be linearly independent, that is the stoichiometric matrix rank ν (whose elements νij correspond to the stoichiometric coefficient of species i in the reaction j) must be equal to the independent reactions number (Equation (A9)). The latter variable is obtained by Equation (A10).
where C is a species number and A is an atom/species matrix.
The independent reactions systems considered in this paper work, for dry reforming of methane process, are: DRM (Equation (1)), reverse WGS (Equation (2)) and Boudouard (Equation (3)) reactions.
MATLAB was used in the equilibrium problem resolution. In particular, fmincon (MATLAB solver) attempts to find a constrained minimum of a scalar function of several variables starting at an initial estimate. This is generally referred to as constrained nonlinear optimization. During the process of optimization, the equilibrium condition is evaluated by varying the temperature (600:5:1073 K), pressure (1:1:10 bar) and molar feed ratio CO2/CH4 (1:0.5:2) value, whereas catalyst, reaction kinetics, and the transport process are not considered.
References
- Henriques, I.; Sadorsky, P. Investor implications of divesting from fossil fuels. Glob. Financ. J. 2017, in press. [Google Scholar] [CrossRef]
- Hanley, E.S.; Deane, J.P.; Gallachóir, B.P.Ó. The role of hydrogen in low carbon energy futures—A review of existing perspectives. Renew. Sustain. Energy Rev. 2017, 82, 3027–3045. [Google Scholar] [CrossRef]
- Hydrogen: Fuel for Our Future? Available online: http://www.worldwatch.org/node/4516 (accessed on 9 October 2018).
- Wadhwani, S.; Wadhwani, A.K.; Agarwal, R.B. Clean Coal Technologies—Recent Advances. In Proceedings of the First International Conference on Clean Coal Technologies for Our Future, Chia Laguna, Sardinia, Italy, 21–23 October 2002. [Google Scholar]
- Muradov, N. Low to near-zero CO2 production of hydrogen from fossil fuels: Status and perspectives. Int. J. Hydrogen Energy 2017, 42, 14058–14088. [Google Scholar] [CrossRef]
- Vivas, F.J.; de las Heras, A.; Segura, F.; Andújar, J.M. A review of energy management strategies for renewable hybrid energy systems with hydrogen backup. Renew. Sustain. Energy Rev. 2018, 82, 126–155. [Google Scholar] [CrossRef]
- Akhtera, P.; Farkhondehfal, M.A.; Hernández, S.; Hussain, M.; Fina, A.; Saracco, G.; Khan, A.U.; Russo, N. Environmental issues regarding CO2 and recent strategies for alternative fuels through photocatalytic reduction with titania-based materials. J. Environ. Chem. Eng. 2016, 4, 3934–3953. [Google Scholar] [CrossRef]
- Pomilla, F.R.; Brunetti, A.; Marcì, G.; García-López, E.I.; Fontananova, E.; Palmisano, L.; Barbieri, G. CO2 to liquid fuels: Photocatalytic conversion in a continuous membrane reactor. ACS Sustain. Chem. Eng. 2018, 6, 8743. [Google Scholar] [CrossRef]
- Sellaro, M.; Bellardita, M.; Brunetti, A.; Fontananova, E.; Palmisano, L.; Drioli, E.; Barbieri, G. CO2 conversion in a photocatalytic continuous membrane reactor. RSC Adv. 2016, 6, 67418–67427. [Google Scholar] [CrossRef]
- Kohen, A.; Cannio, R.; Bartolucci, S.; Klinman, J.P. Enzyme dynamics and hydrogen tunneling in a thermophilic alcohol dehydrogenase. Nature 1999, 399, 496–499. [Google Scholar] [CrossRef] [PubMed]
- Marpani, F.; Pinelo, M.; Meyer, A.S. Enzymatic conversion of CO2 to CH3OH via reverse dehydrogenase cascade biocatalysis: Quantitative comparison of efficiencies of immobilized enzyme systems. Biochem. Eng. J. 2017, 127, 217–228. [Google Scholar] [CrossRef]
- Nocera, D.G. The artificial leaf. Acc. Chem. Res. 2012, 45, 767–776. [Google Scholar] [CrossRef] [PubMed]
- Bensaid, S.; Centi, G.; Garrone, E.; Perathoner, S.; Saracco, G. Towards artificial leaves for solar hydrogen and fuels from carbon dioxide. ChemSusChem 2012, 5, 500–521. [Google Scholar] [CrossRef] [PubMed]
- Chabi, S.; Papadantonakis, K.M.; Lewis, N.S.; Freund, M.S. Membranes for artificial photosynthesis. Energy Environ. Sci. 2017, 10, 1320–1338. [Google Scholar] [CrossRef]
- Guczi, L.; Stefler, G.; Geszti, O.; Sajó, I.; Pászti, Z.; Tompos, A.; Schay, Z. Methane dry reforming with CO2: A study on surface carbon species. Appl. Catal. A Gen. 2010, 375, 236–241. [Google Scholar] [CrossRef]
- Bucharkina, T.V.; Gavrilova, N.N.; Kryzhanovskiy, A.S.; Skudin, V.V.; Shulmin, D.A. Dry reforming of methane in contactor and distributor membrane reactors. Pet. Chem. 2015, 55, 932–939. [Google Scholar] [CrossRef]
- Usman, M.; Wan Daud, W.M.A.; Abbas, H.F. Dry reforming of methane: Influence of process parameters—A review. Renew. Sustain. Energy Rev. 2015, 45, 710–744. [Google Scholar] [CrossRef]
- Kim, S.; Ryi, S.K.; Lim, H. Techno-economic analysis (TEA) for CO2 reforming of methane in a membrane reactor for simultaneous CO2 utilization and ultra-pure H2 production. Int. J. Hydrogen Energy 2018, 43, 5881–5893. [Google Scholar] [CrossRef]
- Roy, P.S.; Song, J.; Kim, K.; Park, C.S.; Raju, A.S.K. CO2 conversion to syngas through the steam-biogas reforming process. J. CO2 Util. 2018, 25, 275–282. [Google Scholar] [CrossRef]
- Oyama, S.T.; Hacarlioglu, P.; Gu, Y.; Lee, D. Dry reforming of methane has no future for hydrogen production: Comparison with steam reforming at high pressure in standard and membrane reactors. Int. J. Hydrogen Energy 2012, 37, 10444–10450. [Google Scholar] [CrossRef]
- Drioli, E.; Barbieri, G.; Brunetti, A. Membrane Engineering for the Treatment of Gases, 2nd ed.; Royal Society of Chemistry: Cambridge, UK, 2017; ISBN 978-1-78262-875-0. [Google Scholar]
- Wang, S.; Lu, G.; Millar, G.J. Carbon dioxide reforming of methane to produce synthesis gas over metal-supported catalysts: State of the art. Energy Fuel 1996, 10, 896–904. [Google Scholar] [CrossRef]
- Bosko, M.L.; Munera, J.F.; Lombardo, E.A.; Cornaglia, L.M. Dry reforming of methane in membrane reactors using Pd and Pd–Ag composite membranes on a NaA zeolite modified porous stainless steel support. J. Membr. Sci. 2010, 364, 17–26. [Google Scholar] [CrossRef]
- Gallucci, F.; Tosti, S.; Basile, A. Pd-Ag tubular membrane reactors for methane dry reforming: A reactive method for CO2 consumption and H2 production. J. Membr. Sci. 2008, 317, 96–105. [Google Scholar] [CrossRef]
- Garcıa-Garcıa, F.R.; Soria, M.A.; Mateos-Pedrero, C.; Guerrero-Ruiz, A.; Rodrıguez-Ramos, I.; Li, K. Dry reforming of methane using Pd-based membrane reactors fabricated from different substrates. J. Membr. Sci. 2013, 435, 218–225. [Google Scholar] [CrossRef]
- Silva, F.A.; Hori, C.E.; da Silva, A.M.; Mattos, L.V.; Munera, J.; Cornaglia, L. Hydrogen production through CO2 reforming of CH4 over Pt/CeZrO2/Al2O3 catalysts using a Pd-Ag membrane reactor. Catal. Today 2012, 193, 64–73. [Google Scholar] [CrossRef]
- Fedotov, A.S.; Antonov, D.O.; Uvarov, V.I.; Tsodikov, M.V. Original hybrid membrane-catalytic reactor for the Co-Production of syngas and ultrapure hydrogen in the processes of dry and steam reforming of methane, ethanol and DME. Int. J. Hydrogen Energy 2018, 43, 7046–7054. [Google Scholar] [CrossRef]
- Sumrunronnasak, S.; Tantayanon, S.; Kiatgamolchai, S.; Sukonket, T. Improved hydrogen production from dry reforming reaction using a catalytic packed-bed membrane reactor with Ni-based catalyst and dense PdAgCu alloy membrane. Int. J. Hydrogen Energy 2016, 41, 2621–2630. [Google Scholar] [CrossRef]
- Alique, D.; Martinez-Diaz, D.; Sanz, R.; Calles, J.A. Review of supported Pd-based membranes preparation by electroless plating for ultra-pure hydrogen production. Membranes 2018, 8, 5. [Google Scholar] [CrossRef] [PubMed]
- Safariamin, M.; Tidahy, L.H.; Abi-Aad, E.; Siffert, S.; Aboukais, A. Dry reforming of methane in the presence of ruthenium-based catalysts. C. R. Chim. 2009, 12, 748–753. [Google Scholar] [CrossRef]
- Jeon, J.; Nam, S.; Ko, C.H. Rapid evaluation of coke resistance in catalysts for methane reforming using low steam-to-carbon ratio. Catal. Today 2018, 309, 140–146. [Google Scholar] [CrossRef]
- Simakov, D.S.A.; Leshkov, Y.R. Highly efficient methane reforming over a low-loading Ru/γ-Al2O3 catalyst in a Pd-Ag membrane reactor. AIChE J. 2018, 64, 3101–3108. [Google Scholar] [CrossRef]
- Lee, D. Catalytic Reforming of CH4 with CO2 in a Membrane Reactor: A Study on Effect of Pressure. Doctoral Dissertations, VirginiaTech, Blacksburg, VA, USA, 2003; pp. 66–91. [Google Scholar]
- Chein, R.Y.; Chen, Y.C.; Yu, C.T.; Chung, J.N. Thermodynamic analysis of dry reforming of CH4 with CO2 at high pressures. J. Nat. Gas Sci. Eng. 2015, 26, 617–629. [Google Scholar] [CrossRef]
Figure 1.
Membrane reactor scheme.

Figure 2.
Sketch of the lab-scale plant for permeation and reaction experiments.

Figure 3.
CH4 conversion at equilibrium: (Left side) as a function of pressure, CO2/CH4 feed molar ratio of 1, temperature of 650 °C (●) and 600 °C (♦), compared with experimental data (Lee (2003) [33]); (right side) as a function of temperature, CO2/CH4 feed molar ratio of 1.5, pressure of 1 bar (▲), compared with experimental data (Chein et al. (2015) [34]).

Figure 4.
CH4 equilibrium conversion at 1 bar (left side) and 10 bar (right side) as a function of temperature, varying CO2/CH4 feed molar ratio from 1 to 2.
Figure 4.
CH4 equilibrium conversion at 1 bar (left side) and 10 bar (right side) as a function of temperature, varying CO2/CH4 feed molar ratio from 1 to 2.

Figure 5.
CH4 equilibrium conversion at CO2/CH4 feed molar ratio of 1 (left side) and 2 (right side) as a function of temperature, varying the pressure from 1 to 10 bar.
Figure 5.
CH4 equilibrium conversion at CO2/CH4 feed molar ratio of 1 (left side) and 2 (right side) as a function of temperature, varying the pressure from 1 to 10 bar.

Figure 6.
Equilibrium constant as a function of temperature for DRM ( ![Chemengineering 02 00048 i001]() ), reverse WGS (
), reverse WGS ( ![Chemengineering 02 00048 i002]() ) and Boudouard (
) and Boudouard ( ![Chemengineering 02 00048 i003]() ) reactions.
) reactions.
 ), reverse WGS (
  ) and Boudouard (
  ) reactions.
Figure 6.
Equilibrium constant as a function of temperature for DRM ( ![Chemengineering 02 00048 i001]() ), reverse WGS (
), reverse WGS ( ![Chemengineering 02 00048 i002]() ) and Boudouard (
) and Boudouard ( ![Chemengineering 02 00048 i003]() ) reactions.
) reactions.
), reverse WGS ( ) and Boudouard ( ) reactions.
Figure 7.
CH4 equilibrium conversion at 1 bar (left side) and 10 bar (right side) as a function of temperature at different CO2/CH4 feed molar ratio taking into account carbon formation.
Figure 7.
CH4 equilibrium conversion at 1 bar (left side) and 10 bar (right side) as a function of temperature at different CO2/CH4 feed molar ratio taking into account carbon formation.

Figure 8.
CH4 equilibrium conversion at CO2/CH4 feed molar ratio of 1 (left side) and 2 (right side) as a function of temperature at different pressures taking into account carbon formation.
Figure 8.
CH4 equilibrium conversion at CO2/CH4 feed molar ratio of 1 (left side) and 2 (right side) as a function of temperature at different pressures taking into account carbon formation.

Figure 9.
CH4 equilibrium conversion at CO2/CH4 feed molar ratio of 1 and temperature of 500 °C as a function of pressure.
Figure 9.
CH4 equilibrium conversion at CO2/CH4 feed molar ratio of 1 and temperature of 500 °C as a function of pressure.

Figure 10.
Hydrogen flux as a function of Sieverts’ driving force at different temperatures.

Figure 11.
Arrhenius plot of hydrogen permeance.

Figure 12.
CH4 conversion (●) and H2 recovery (▲) as a function of feed pressures at CO2/CH4 feed molar ratio = 1.5, permeate pressure = 0.02 bar. Equilibrium conversion values in a traditional reactor (dashed line).
Figure 12.
CH4 conversion (●) and H2 recovery (▲) as a function of feed pressures at CO2/CH4 feed molar ratio = 1.5, permeate pressure = 0.02 bar. Equilibrium conversion values in a traditional reactor (dashed line).

Figure 13.
CH4 conversion (●) and H2 recovery (▲) as a function of feed pressures at CO2/CH4 feed molar ratio = 1, permeate pressure = 0.02 bar. Equilibrium conversion values in a traditional reactor (dashed line).
Figure 13.
CH4 conversion (●) and H2 recovery (▲) as a function of feed pressures at CO2/CH4 feed molar ratio = 1, permeate pressure = 0.02 bar. Equilibrium conversion values in a traditional reactor (dashed line).

Figure 14.
H2/CO reaction selectivity as a function of feed pressures at CO2/CH4 feed molar ratio = 1–1.5, permeate pressure = 0.02 bar.
Figure 14.
H2/CO reaction selectivity as a function of feed pressures at CO2/CH4 feed molar ratio = 1–1.5, permeate pressure = 0.02 bar.


Table 1.
Membrane reactor characteristics.
| Membrane | Pd-Ag Commercial (Goodfellow) Self-Supported |
|---|---|
| Thickness | 100 micrometers |
| Superficial Area | 3 cm2 |
| Outer Diameter | 1 mm |
| Length | 93 mm |
| Catalyst Weight | 8.5 g |
Table 2.
Operating conditions for experimental measurements.
| Temperature, °C | Permeation | 400, 450, 500 |
| Reaction | 500 | |
| Pressure, bar | Feed | 1–8 |
| Permeate | 0.02; 1 | |
| CO2/CH4 Feed Molar Ratio | 1, 1.5 | |
| GHSV, h−1 | 100 | |
Table 3.
Equilibrium constant for dry reforming of methane (DRM) and reverse water gas shift (RWGS) reactions calculated at a temperature of 600 °C and 650 °C and compared with experimental data of Lee (2003) [33].
Table 3.
Equilibrium constant for dry reforming of methane (DRM) and reverse water gas shift (RWGS) reactions calculated at a temperature of 600 °C and 650 °C and compared with experimental data of Lee (2003) [33].
| Equilibrium Constant Keq | ||||
|---|---|---|---|---|
| DRM | RWGS | |||
| Lee (2003) [33] | MATLAB code | Lee (2003) [33] | MATLAB code | |
| 600 °C | 0.19 | 0.20 | 0.37 | 0.40 |
| 650 °C | 1.31 | 1.38 | 0.48 | 0.53 |
Table 4.
Apparent activation energy, pre-exponential factor and hydrogen permeance values.
| Apparent Activation Energy, E | J·mol−1 | 4942 |
| Permeance Pre-Exponential Factor | mol·m−2·s−1·Pa−0.5 | 455 |
| Hydrogen Permeance, mol·m−2·s−1·Pa−0.5 | 400 °C | 190 |
| 450 °C | 196 | |
| 500 °C | 211 |
© 2018 by the authors. Licensee MDPI, Basel, Switzerland. This article is an open access article distributed under the terms and conditions of the Creative Commons Attribution (CC BY) license (http://creativecommons.org/licenses/by/4.0/).
Share and Cite
MDPI and ACS Style
Caravella, A.; Brunetti, A.; Grandinetti, M.; Barbieri, G. Dry Reforming of Methane in a Pd-Ag Membrane Reactor: Thermodynamic and Experimental Analysis. ChemEngineering 2018, 2, 48. https://doi.org/10.3390/chemengineering2040048
AMA Style
Caravella A, Brunetti A, Grandinetti M, Barbieri G. Dry Reforming of Methane in a Pd-Ag Membrane Reactor: Thermodynamic and Experimental Analysis. ChemEngineering. 2018; 2(4):48. https://doi.org/10.3390/chemengineering2040048
Chicago/Turabian StyleCaravella, Alessio, Adele Brunetti, Monia Grandinetti, and Giuseppe Barbieri. 2018. "Dry Reforming of Methane in a Pd-Ag Membrane Reactor: Thermodynamic and Experimental Analysis" ChemEngineering 2, no. 4: 48. https://doi.org/10.3390/chemengineering2040048