Experimental Investigation of the Gas/Liquid Phase Separation Using a Membrane-Based Micro Contactor


Karlsruhe Institute of Technology, Institute for Micro Process Engineering, 76344 Eggenstein-Leopoldshafen, Germany
*
Author to whom correspondence should be addressed.
ChemEngineering 2018, 2(4), 55; https://doi.org/10.3390/chemengineering2040055
Submission received: 28 September 2018
/
Revised: 2 November 2018
/
Accepted: 6 November 2018
/
Published: 14 November 2018
(This article belongs to the Special Issue Membrane and Membrane Reactors Operations in Chemical Engineering)
Abstract
:The gas/liquid phase separation of CO2 from a water-methanol solution at the anode side of a µDirect-Methanol-Fuel-Cell (µDMFC) plays a key role in the overall performance of fuel cells. This point is of particular importance if the µDMFC is based on a “Lab-on-a-Chip” design with transient working behaviour, as well as with a recycling and a recovery system for unused fuel. By integrating a membrane-based micro contactor downstream into the µDMFC, the efficient removal of CO2 from a water-methanol solution is possible. In this work, a systematic study of the separation process regarding gas permeability with and without two-phase flow is presented. By considering the µDMFC working behaviour, an improvement of the overall separation performance is pursued. In general, the gas/liquid phase separation is achieved by (1) using a combination of the pressure gradient as a driving force, and (2) capillary forces in the pores of the membrane acting as a transport barrier depending on the nature of it (hydrophilic/hydrophobic). Additionally, the separation efficiency, pressure gradient, orientation, liquid loss, and active membrane area for different feed inlet temperatures and methanol concentrations are investigated to obtain an insight into the separation process at transient working conditions of the µDMFC.
1. Introduction
In recent years, the operating time and the miniaturisation of portable electronic devices such as smartphones, laptops, and many others devices has become a field of high importance. Unfortunately, due to the low energy capacity of conventional electrochemical accumulators e.g., lithium ion batteries, this kind of energy supply or recharging systems (power banks) are no longer appropriate for long operating times. To overcome short operating times, many possibilities are currently being investigated to replace lithium ion battery-based energy supplies or recharging systems [1,2,3]. Small-sized membrane-based fuel cell systems with a highly specific energy density are among the most promising candidates to overcome short operating times. Using a micro direct methanol fuel cell (µDMFC) based on a lab-on-a-chip (LOC) design, integrated fuel supply for methanol, and a separation system, the operating time can be extended significantly without increasing the weight or volume of the portable device disproportionately. In addition, the µDMFC can be refuelled instantly with methanol, which is an easily storable, convenient liquid fuel with an energy density of 4.42 kWh/dm3 [1,2,3,4,5].
During the operation of the µDMFC, methanol from the liquid water-methanol mixture is oxidised to gaseous carbon dioxide while at the cathode side, oxygen from gaseous air is reduced to liquid water. Subsequently, two-phase flows are formed by the produced carbon dioxide and water at both -anode and cathode- side. This occurring two-phase flow, on the one hand, decreases the accessibility of methanol and oxygen to the catalyst layer on the respective electrode area inside the µDMFC, leading, on the other hand, to a channel blocking phenomena in one or more channels during operation. In both cases, the two-phase flow causes a reduction of the overall fuel cell performance. Therefore, to ensure the permanent operation of a µDMFC in recirculation mode and to improve the fuel cell performance stability, produced carbon dioxide as waste product or byproduct must be removed continuously from the anodic loop. Furthermore, the water must be efficiently recovered from the cathodic loop and fed into the anodic loop to compensate the water losses during µDMFC operation and CO2 separation [6,7,8].
In conventionally-operated DMFCs, the occurring two-phase flow is passively separated in small vessels due to the difference in density and the use of gravity [4]. For µDMFCs based on LOC design, the separation of a two-phase flow is significantly more complex. Only flat separation systems to realise a compact and portable design can be considered. By combining membrane- and micro-engineering -technology, an orientation-independent removal and recovery of carbon dioxide and water from the two-phase flow is possible [9,10,11,12]. This can be achieved by using a porous membrane-based micro contactor installed downstream of the µDMFC with additional integration on the bipolar plates to achieve a compact and flat LOC design including a recycling system. Different design approaches and investigations for several microcontactors are summarised in Table 1.
All of the studies summarised in Table 1 describe different membrane-based micro contactors for the gas/liquid phase separation, studying different types of membranes and parameters. Nevertheless, these studies fail to systematically investigate the gas permeability and influence of diffusion fluxes at single and two-phase flow conditions, the separation efficiency regarding the gas permeability, and the active membrane area during the gas/liquid separation process. In this work, a membrane-based micro contactor for the gas/liquid phase separation with its corresponding systematic study of the gas permeability, influence of the diffusion fluxes, and separation performance at single and two-phase flow conditions, is presented for four different membranes.
2. Theoretical Background
To provide a solid background on the separation process in a porous membrane-based micro contactor, capillary forces and mass transfer concepts—i.e., fundamentals of passive or active gas/liquid phase separation—will be introduced.
2.1. Capillary Pressure
The capillary pressure (capillary forces), which has been known since 1830, can be mathematically described by the Young-Laplace equation for ideal circular pores Equation (1) and rectangular/square micro channels Equation (2). Detailed information about the capillary force can be found in the supplementary information.
Circular Pore
Rectangular/Square Micro Channel
where represents the surface tension, the contact angle, and the characteristic diameter (hydraulic or circular) of the pores of the polymer based membrane. Using Equation (1), the capillary pressure can be calculated indicating the maximum water entry pressure of a porous membrane. For an ideal circular pore diameter of 500 nm and a water contact angle of 100° (, a capillary pressure, or in a broader sense, a capillary force of acting against the pore wetting should be applied. The negative value of the calculated capillary pressure indicates the acting direction of the force.
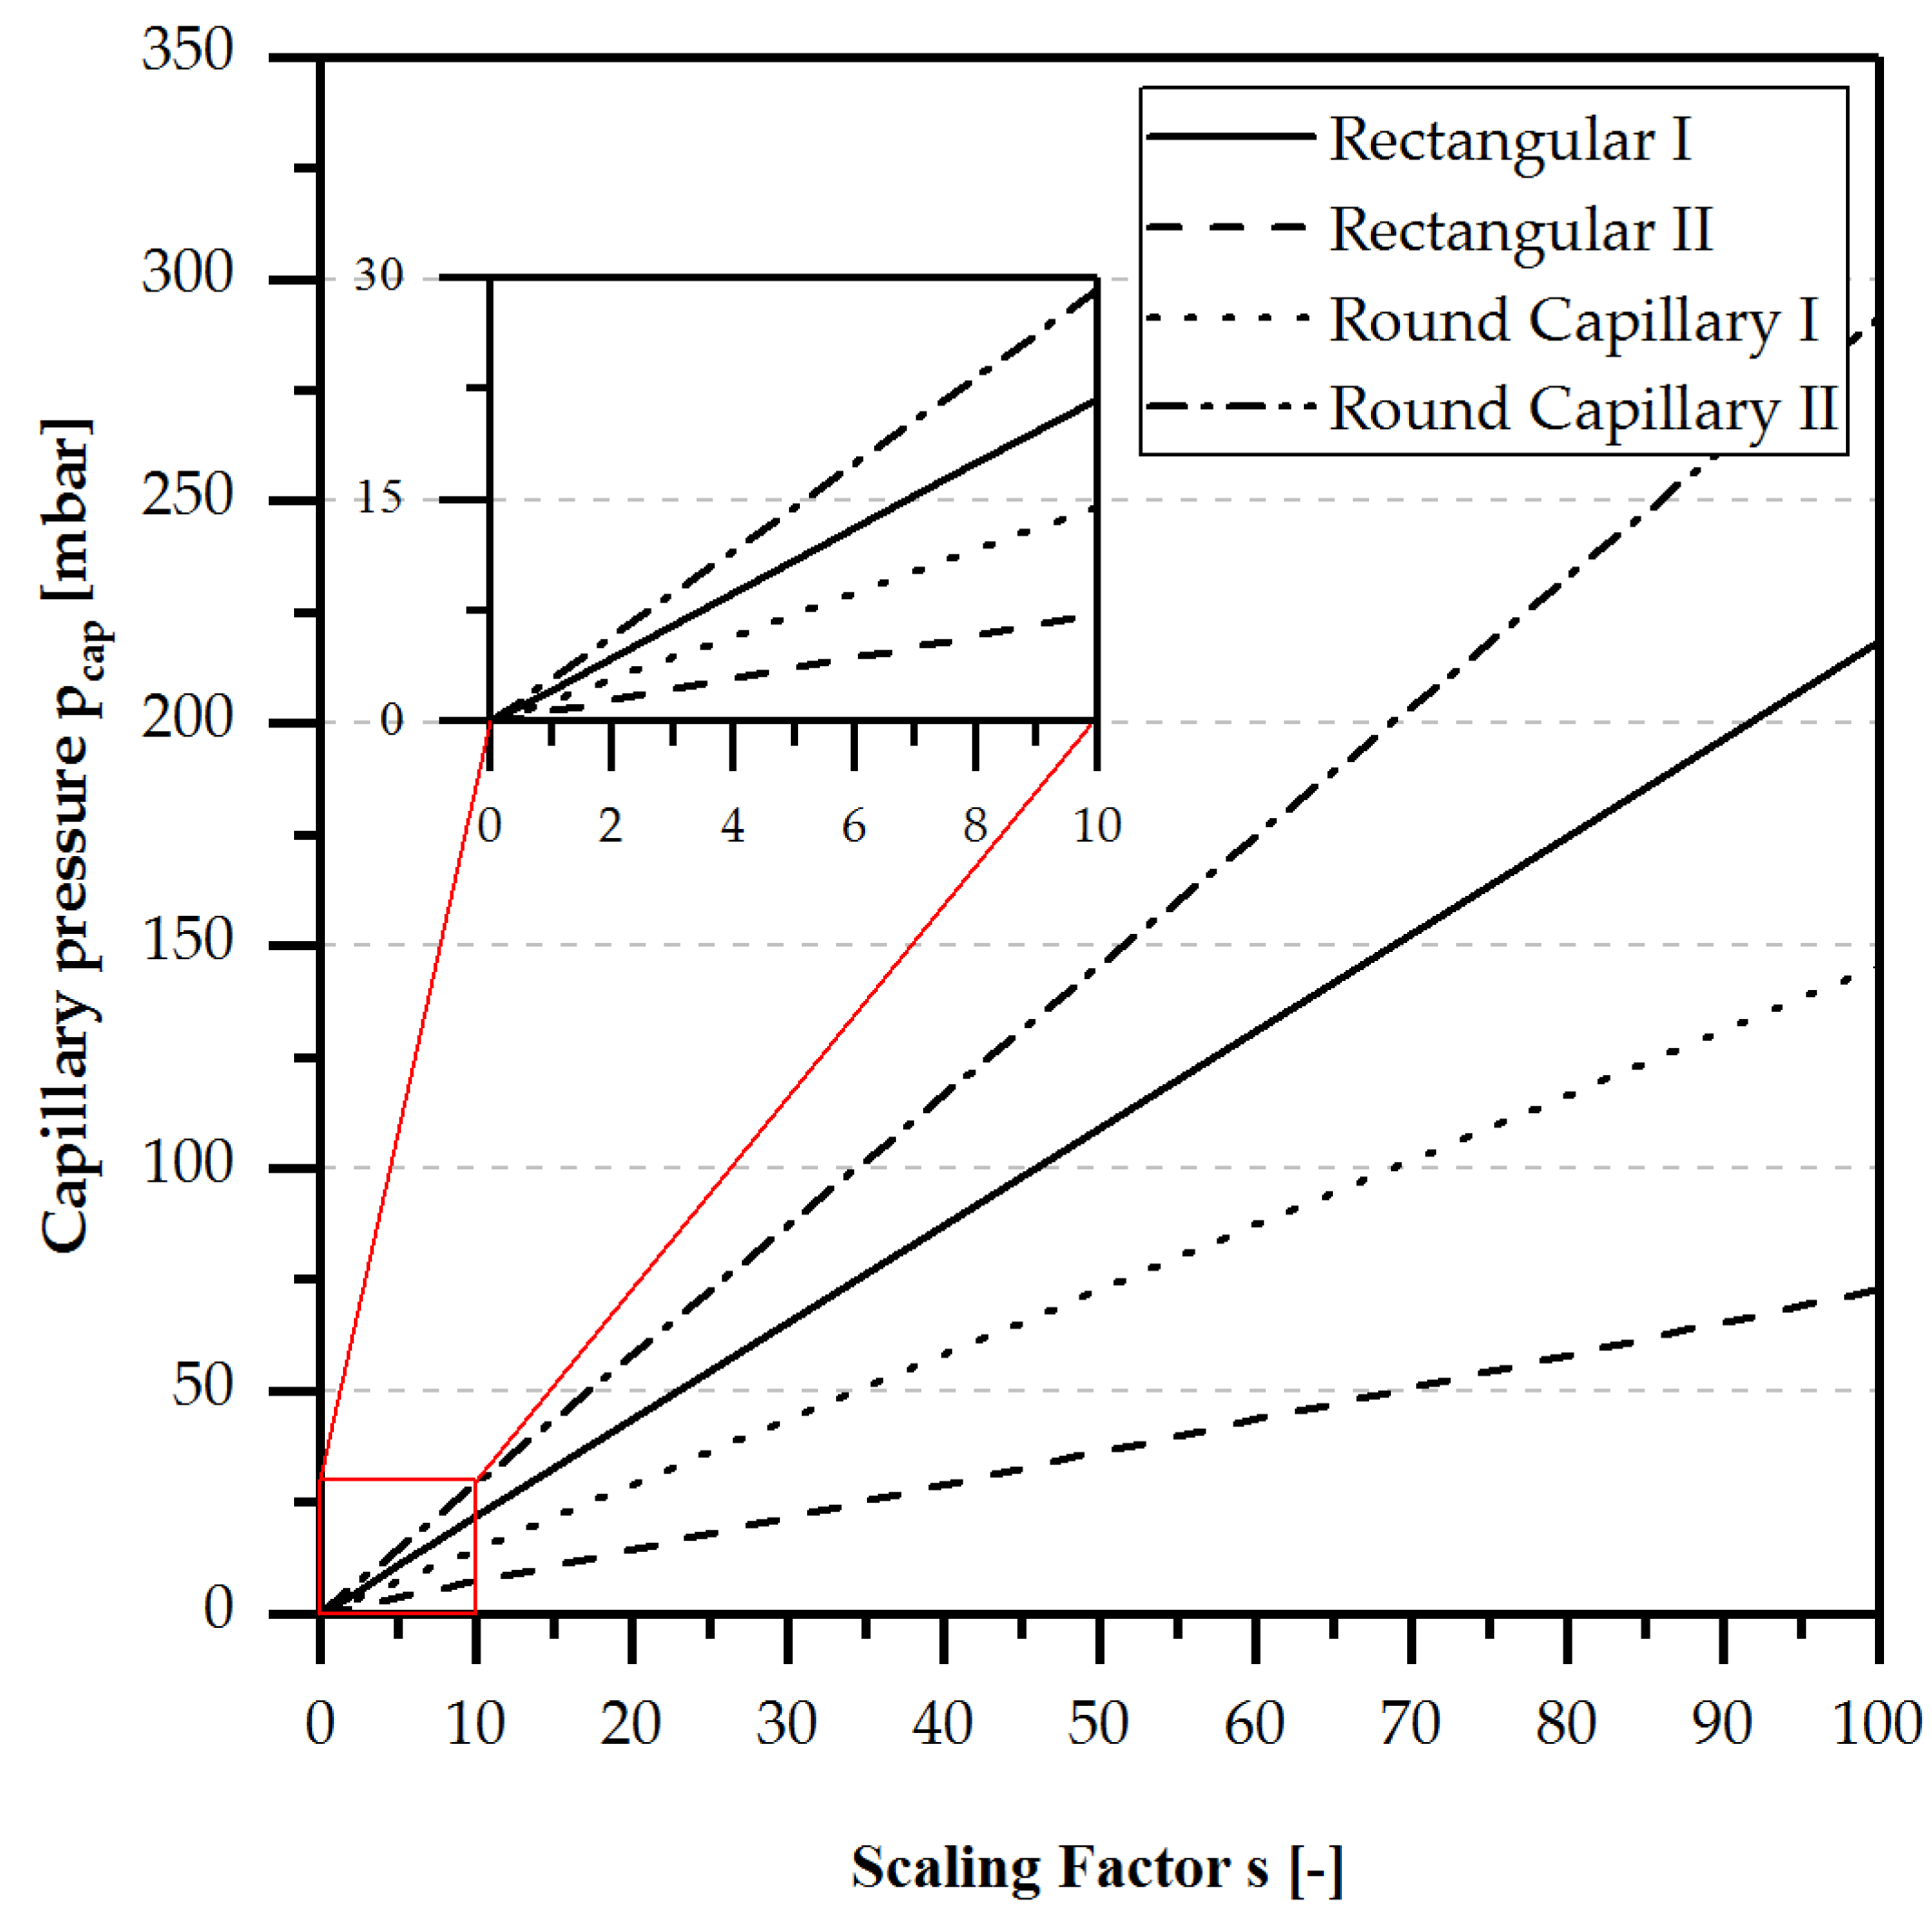
Figure 1 shows the capillary pressure calculated by Equation (2) for four different micro channel configurations and pores (round capillary) depending on a scaling factor dividing the starting values width and/or height of the channel geometry.
In Figure 1, it is clearly visible that homogenous wetted micro channels with a width of 1 mm and a height of 0.5 mm always have the highest positive capillary pressure with an increasing scaling factor. Heterogeneous wetted micro channels, as they can occur in a membrane-based micro contactor (see Figure 2), instead have the lowest positive capillary pressure due to the high influence of the hydrophobic membrane. To utilise the capillary pressure as a driving force for the passive gas/liquid phase separation, the size of the channel plays a major role and must be taken into account if passively-operated gas/liquid separation is the main objective.
However, to ensure the portability of portable energy systems or applications, the gas/liquid phase separation must be independent of orientation, which can be ensured by the capillary forces in the micro channels. In macroscopic channels, gravitational forces have a considerable influence on the behaviour of the two-phase flow (TPF), since buoyancy forces exceed the capillary forces. The influence of capillary forces increases with decreasing channel diameter, as shown in Figure 1. To quantify the ratio of capillary and gravitational forces, the Confinement number (Co) is calculated by Equation (3). The Eötvös number (Eo), related to the Confinement number, can be calculated by Equation (4).
where represents the hydraulic diameter, the gravitational acceleration, the liquid density, and the gas density. For a rectangular or square channel, the hydraulic diameter can be calculated using the cross-section area A and wetted perimeter , as shown in Figure 1, by using the following equation:
According to Huh et al. [21], Serizawa et al. [22], Suo et al. [23] and Brauner et al. [24], the capillary forces become predominant over the buoyancy forces if or . Using the data for a micro channel with a height of 0.5 mm and a width of 1.0 mm with water + air at 20 °C, a Confinement number of and an Etövös Number of are obtained. In both cases, the capillary forces are predominant over the gravitational forces, and an orientation-independent separation can be assumed.
2.2. Mass Transfer
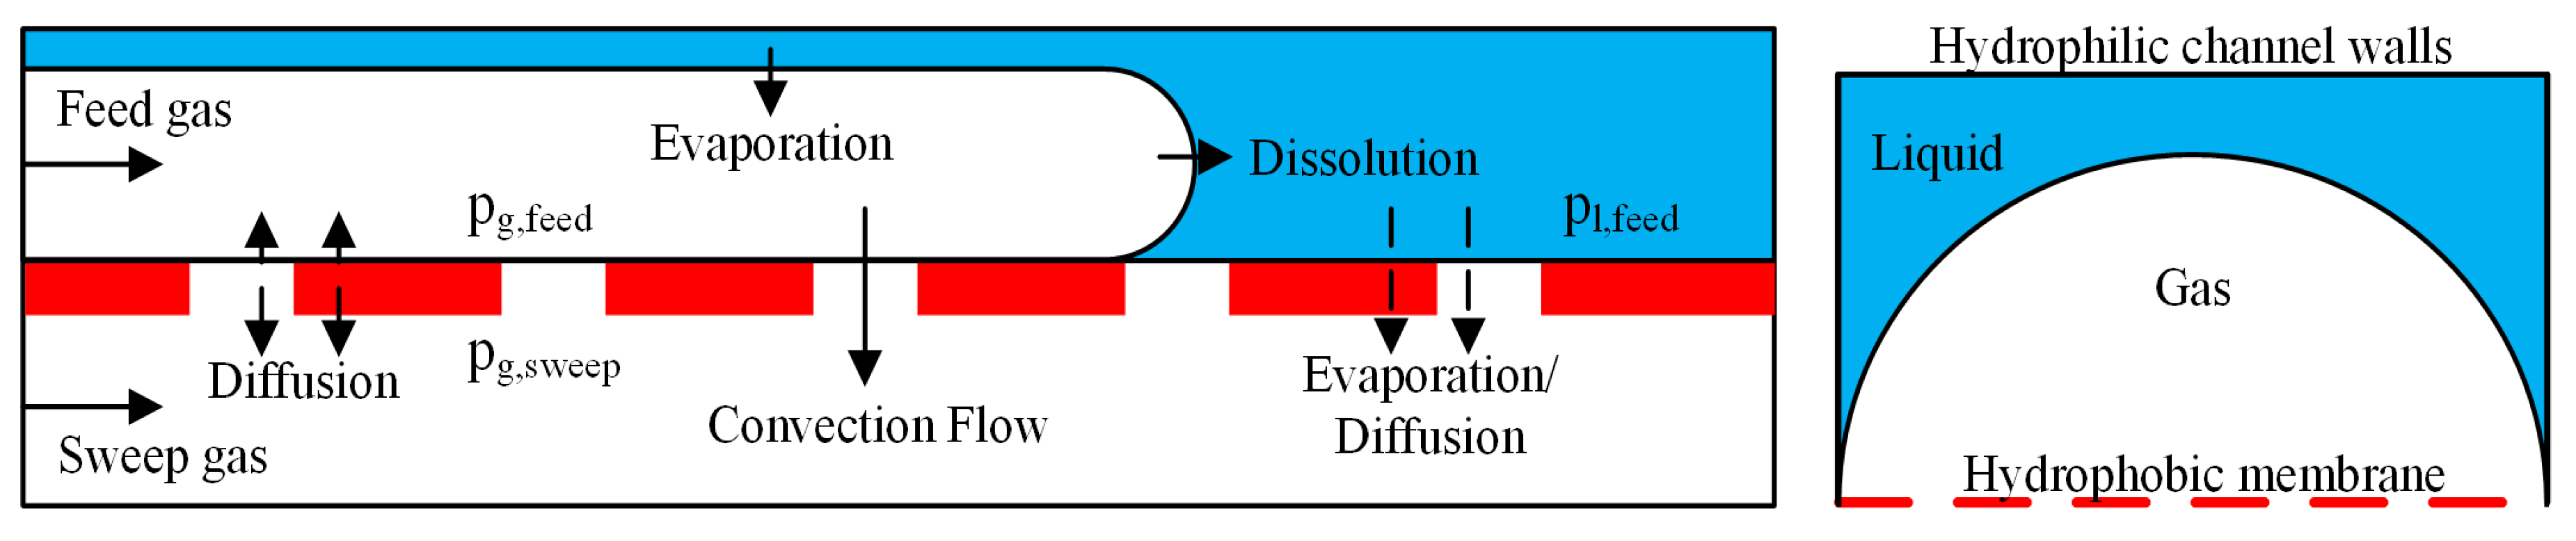
The working principle of the separation process is illustrated in Figure 2, showing the cross sectional (left side) and longitudinal section (right side) views of the feed and permeate channel. As can be observed, the combination of heterogeneous channel walls and hydrophobic porous membranes leads to a spatial separation behaviour of the two-phase due to the capillary forces.
In addition, it can be seen that the gas phase directly contacts the porous membrane, and is then pushed through. The driving force of the gas separation is the transmembrane pressure difference :
Furthermore, as shown in Figure 1, the capillary pressure on a gas bubble in a rectangular microchannel with a hydrophobic membrane at a reduction factor of 1 (Figure 1) is about 1 mbar. For the effective separation of typical amounts of gas over a small membrane area, higher pressures are necessary. Therefore, the capillary pressure is considered negligible and the pressure in the gas and liquid phases of the feed channel can be assumed to be equal, as shown in Equation (7).
In the longitudinal section of the micro contactor (Figure 2), an overview of the different mass transfer processes is given. Gaseous species are transported by convection as well as diffusion.
2.2.1. Convective Mass Transfer
The predominant mass transport through the gas covered area of the membrane is the pressure driven convective flow. Depending on the thermodynamic state of the system, the feed gas is saturated by the liquid species through evaporation, which is subsequently also separated from the liquid stream convectively.
In the 19th century, Henry Darcy described the laminar convectional flow through porous media empirically. His mathematical correlation is today known as the Darcy’s law. As assumed by this law, the amount of the transferred fluid is directly proportional to the pressure difference across the porous structure, as described by Equation (8) [17,18]:
where represent the volume flow rate of a fluid through a porous structure, the permeability of the porous structure, the available separation area which is usually completely covered by the separable fluid, the transmembrane pressure difference across the porous structure, the viscosity of the fluid, and the thickness of the separation layer.
The available or active membrane area during the separation process of a two-phase flow is defined by the percentage of the overall allocable membrane area where the separable gas flow is concentrated, and only thereby available for the separation process. For determination of the active membrane area, Equation (9) can be used.
where represent the active membrane area, the maximum available membrane area in the separation unit, the measured gas permeability with two-phase flow, and the measured gas permeability with single-phase flow.
2.2.2. Diffusive Mass Transfer
In tight porous media, the interaction between the diffusing molecules and the channel walls becomes more relevant at a Knudsen number of Kn > 0.01. If the Knudsen number exceeds this value, the diffusion regime turns to a Knudsen diffusion regime in which collisions with walls occur more often than collisions among molecules. In general, the Knudsen number is defined as:
with
where is the free mean path length of the molecule, is the pore diameter, is the Boltzmann constant, is the collision diameter of the molecule, and T and p are the temperature and pressure respectively. At , only Knudsen diffusion is occurring. The Knudsen diffusion coefficient is given by [25]:
where is the molecular mass. In contrast, at , free molecular diffusion can be assumed. In that case, the diffusion coefficient of substance A in substance B can be calculated using Fuller’s equation with sufficient accuracy [26].
where is the temperature, is the molar mass, the pressure, and is the molecular diffusion volume. To describe the diffusive mass transfer processes in the porous membrane-based micro contactor, the gas covered and liquid covered areas of the membrane can be studied separately. At the gas liquid interface, i.e., the area above the liquid covered area of the membrane, liquid species evaporate and are thereupon transported diffusively through the membrane. Also, feed gas and evaporated liquid is diffusively transported through the gas-covered area of the membrane into the permeate channel if no convective flux is occurring.
On the other hand, the sweep gas diffuses via the membrane into the feed channel, but is then transported back by the convection flow. It is important to mention that the overall diffusion through the gas-covered membrane area is strongly affected by the convection flow. To approximate the rate of diffusion of transport through the membrane in the deployed micro contactor without convection flow or liquid feed, a simple calculation based on Fick’s law [25] e.g., for the sweep gas (synthetic air), can be used:
where is the diffusion flux of air through the membrane, is the cumulative surface area of the pores, is the gradient of the molar fraction of air through the membrane, and is the mass transfer coefficient in the membrane. Normally, the examined membranes are built with a backer material. In this case, a combined mass transfer coefficient can be calculated as follows:
with
where is the mass transfer coefficient in the respective layer i, is the thickness of the respective layer i, and is the diffusion coefficient of air in CO2 in the respective layer i.
2.2.3. Dissolving of Feed Gas
At the gas-liquid interface in the feed stream, gas is dissolved into the liquid. Small channel dimensions generate a high surface to volume ratio, and the diffusion process is enhanced by the small distances. Saturation of the liquid stream with feed gas can therefore be assumed. In the case of carbon dioxide as the feed gas and water as the feed liquid, the maximum solubility of CO2 can be determined approximately using an equation developed by R. Weiss [27]:
with
where is the solubility coefficient of calculated applying constants , , and and system temperature T, and is the pressure in the system.
In addition, as shown by Schüler et al. [28] the solubility of CO2 in a water-methanol mixture up to 2 mol/L at room temperature is approximately 20% () higher, at 40 °C nearly constant (), and at 60 °C significantly below 70% () than in pure water. The maximal-dissolved volume flux of CO2 can therefore be calculated.
where is the volume flux of liquid, is the solubility multiplier needed for aqueous methanol solutions, and is the molar volume of the CO2 gas.
2.2.4. Separation Performance
For the characterisation of the separation efficiency, the separation performance () is commonly used as an evaluation criterion.
For a given maximum separable feed gas amount calculated by Darcy’s law, the value is equal to 1, as long as the feed gas inlet volume flow is lower than the maximum separable feed gas amount. If the feed gas inlet volume flow is higher than the highest separable feed gas amount, the curve shows theoretically a regressive profile, as illustrated in Figure 3.
2.2.5. Mass Balance
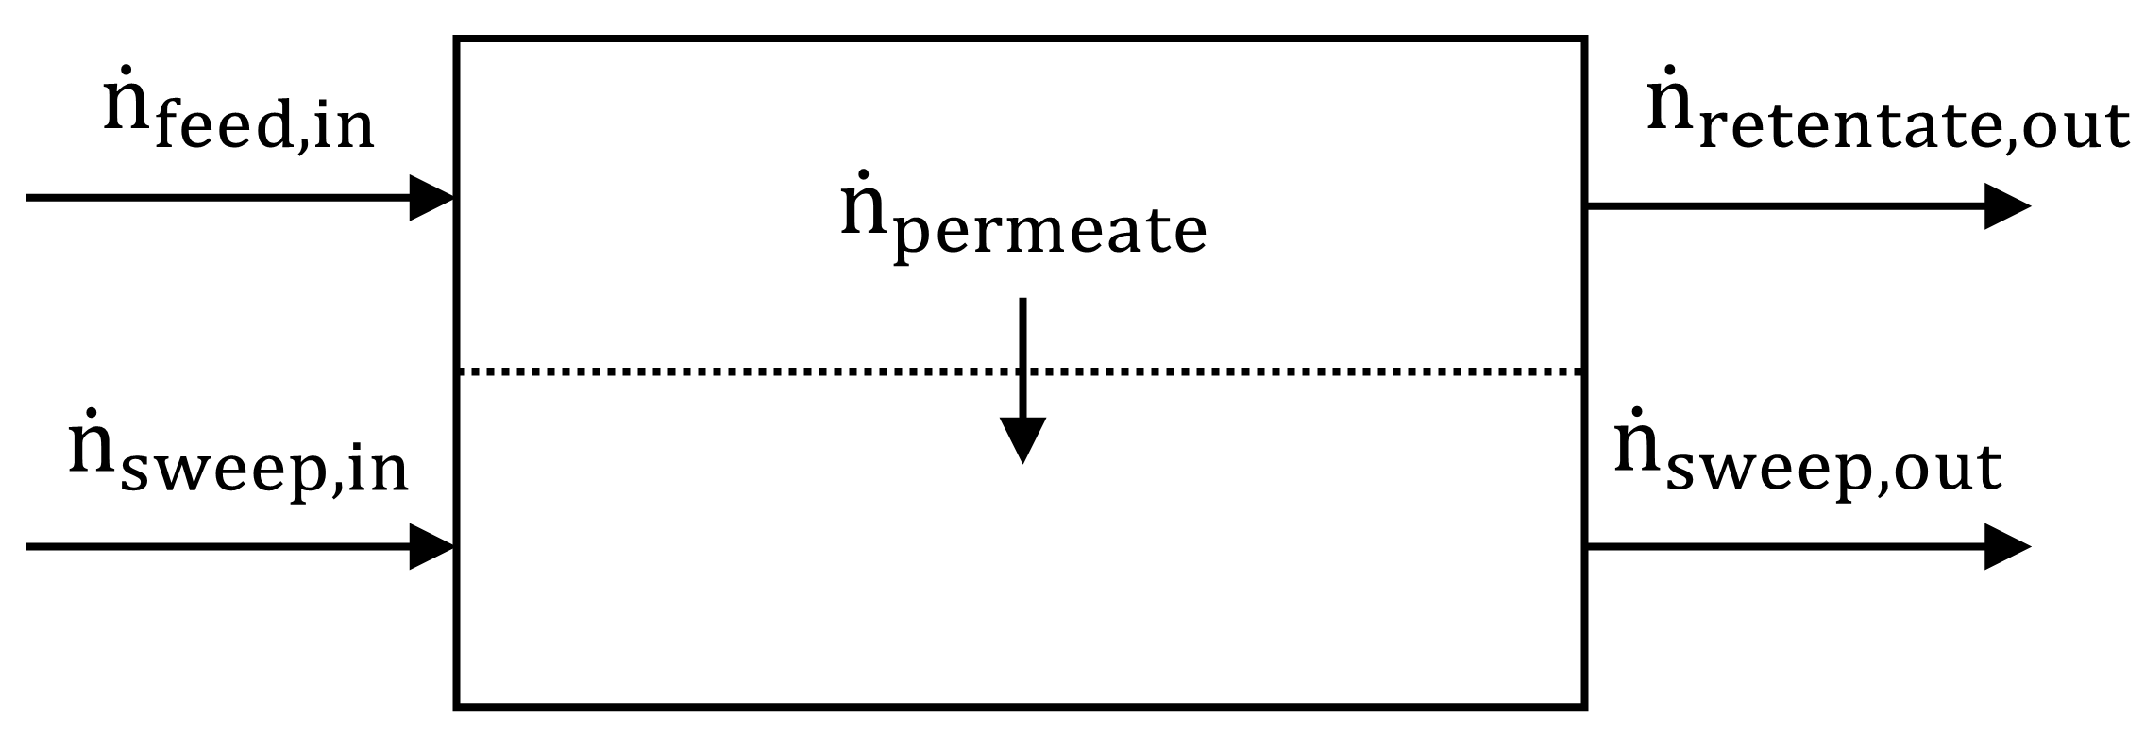
For the characterisation of the separation performance, as well as the measurement of the loss of water/methanol by evaporation, gas saturation and diffusion through the membrane in this work, the composition of the gas from the sweep side outlet of the micro contactor was determined by Fourier-transform infrared spectral analysis (FTIR). The sweep gas (spectrally-inactive synthetic air) was used as a dilution and reference medium. Because of the lack of any chemical reaction, the amount of material is constant and the mass balance of the membrane based micro contactor, as illustrated in Figure 4, can be formulated as:
where is the feed flux of liquid (aqueous methanol solution) and gas (CO2), is the flux of sweep gas (synthetic air), is the flux of gas and or liquid leaving the feed channel and is the cumulative flux of sweep gas and permeate leaving the sweep channel.
The cumulative flux of sweep gas and permeate can be calculated using Equation (22)
if the separation performance is
or
It should be noted, that Equation (21) is only valid when no sweep gas is lost through the feed outlet. If the gas separation is complete (), only liquid is leaving the feed channel. At a state of incomplete gas separation, sweep gas can be transported diffusely across the membrane into the feed channel and leave the feed side outlet. In this case, as shown in Section 4.2, a critical transmembrane pressure difference is sufficient to prevent significant sweep gas loss. When these conditions are met, the amount of separated gaseous substances i can be calculated with Equation (25).
where is the loading of species i in the gas stream leaving the sweep gas channel. Equation (25) can also be written as:
with
where is the molar fraction of species i in the gas stream leaving the sweep gas channel measured by calibrated Fourier-transform infrared spectral analysis.
3. Materials and Methods (Experimental)
3.1. Micro Contactor
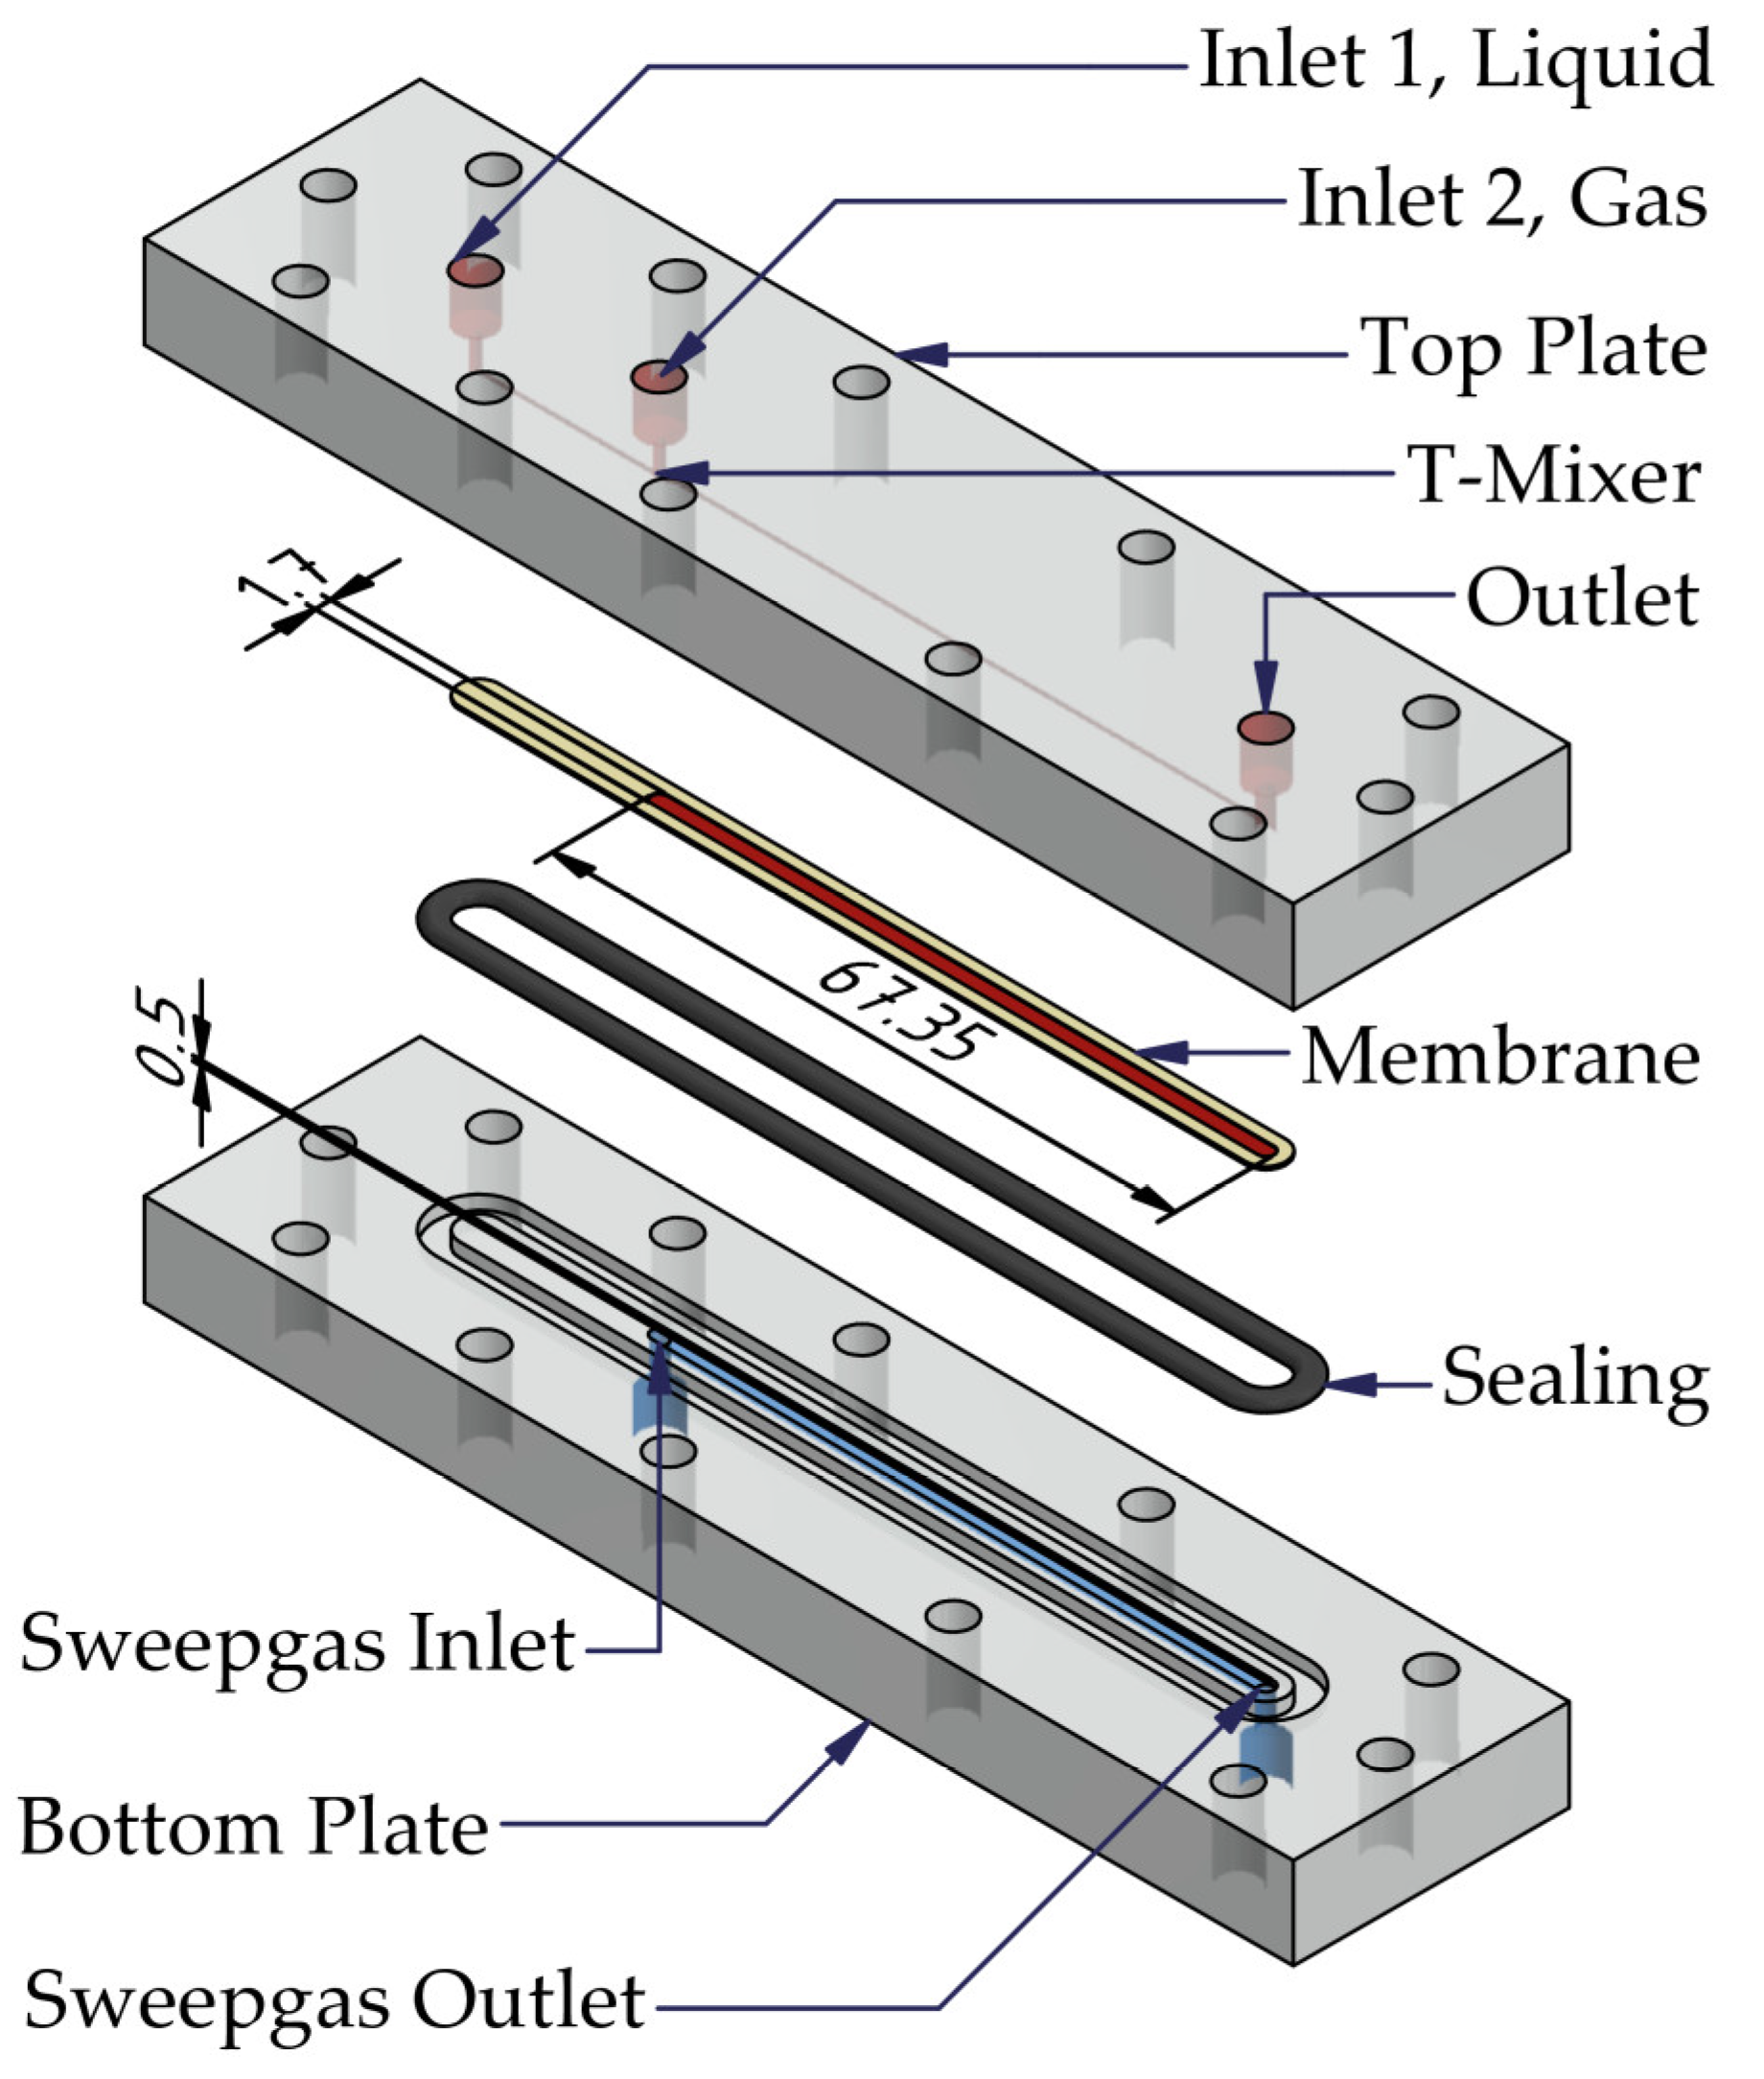
The experimental investigation of the gas permeability, diffusion, and active-pressure-driven gas/liquid phase separation was performed using the membrane-based micro contactor shown in Figure 5.
The main components of the membrane-based micro contactor are the bottom plate, the top plate, the milli/micro channel structure, the integrated T-Mixer, the sealing, and the membrane. Both plates have one straight milli/micro channel with a width of 1.7 mm, a height of 0.5 mm, and a length of 67.35 mm. The overall available membrane area for the separation process is 114.5 mm2. For a visual observation of the gas/liquid phase separation, the membrane-based micro contactor is made of PMMA, with a contact angle of 60° according to the literature [29].
Two inlets for the feed, i.e., gas and liquid, and one outlet for the retentate are integrated into the top plate. The bottom plate possesses only one inlet and outlet for the sweep gas. In addition, the permeate leaves the micro contactor via the sweep gas outlet. If no sweep gas is used, the inlet of the bottom plate can instead be used as an outlet for the permeate. To generate a two-phase flow, gas and liquid are mixed by a T-junction with a milli/micro channel depth of 0.5 mm, width of 1 mm, and length of 20 mm.
3.2. Porous Membranes
Based on theoretical considerations (Equations (1) and (2)), only hydrophobic membranes for gas/liquid phase separation were chosen as a separation membrane in a micro contactor. Due to the high gas permeability and low pressure loss of porous membranes, the required membrane area for the separation task can be customised to the available pressure gradient, which is the driving force for the gas/liquid phase separation process. Hereby, a compact µDMFC with LOC design and well-defined dimensions for the separation system can be realised.
In this article, four commercial-available porous hydrophobic membranes from two different suppliers (Clarcor Industrial Air and Pall Corporation, Overland Park, KS, USA) were compared. All membranes were built with a two-layer structure including the functional membrane layer and stabilising support layer.
As shown in Table 2, different functional layers and different supporting materials were taken into account for the experimental study. Water entry pressure ranges between 1 to 4.5 bar, as measured by the supplier, which are high and safe enough for use as a separation layer in a µDMFC with LOC design. Furthermore, all membranes are supposed to be temperature resistant in the working range of a µDMFC. Images of the membrane surfaces with a scanning electron microscope (SEM) can be found in Section 4 “Results”.
3.3. Experimental Setup
3.3.1. Equipment
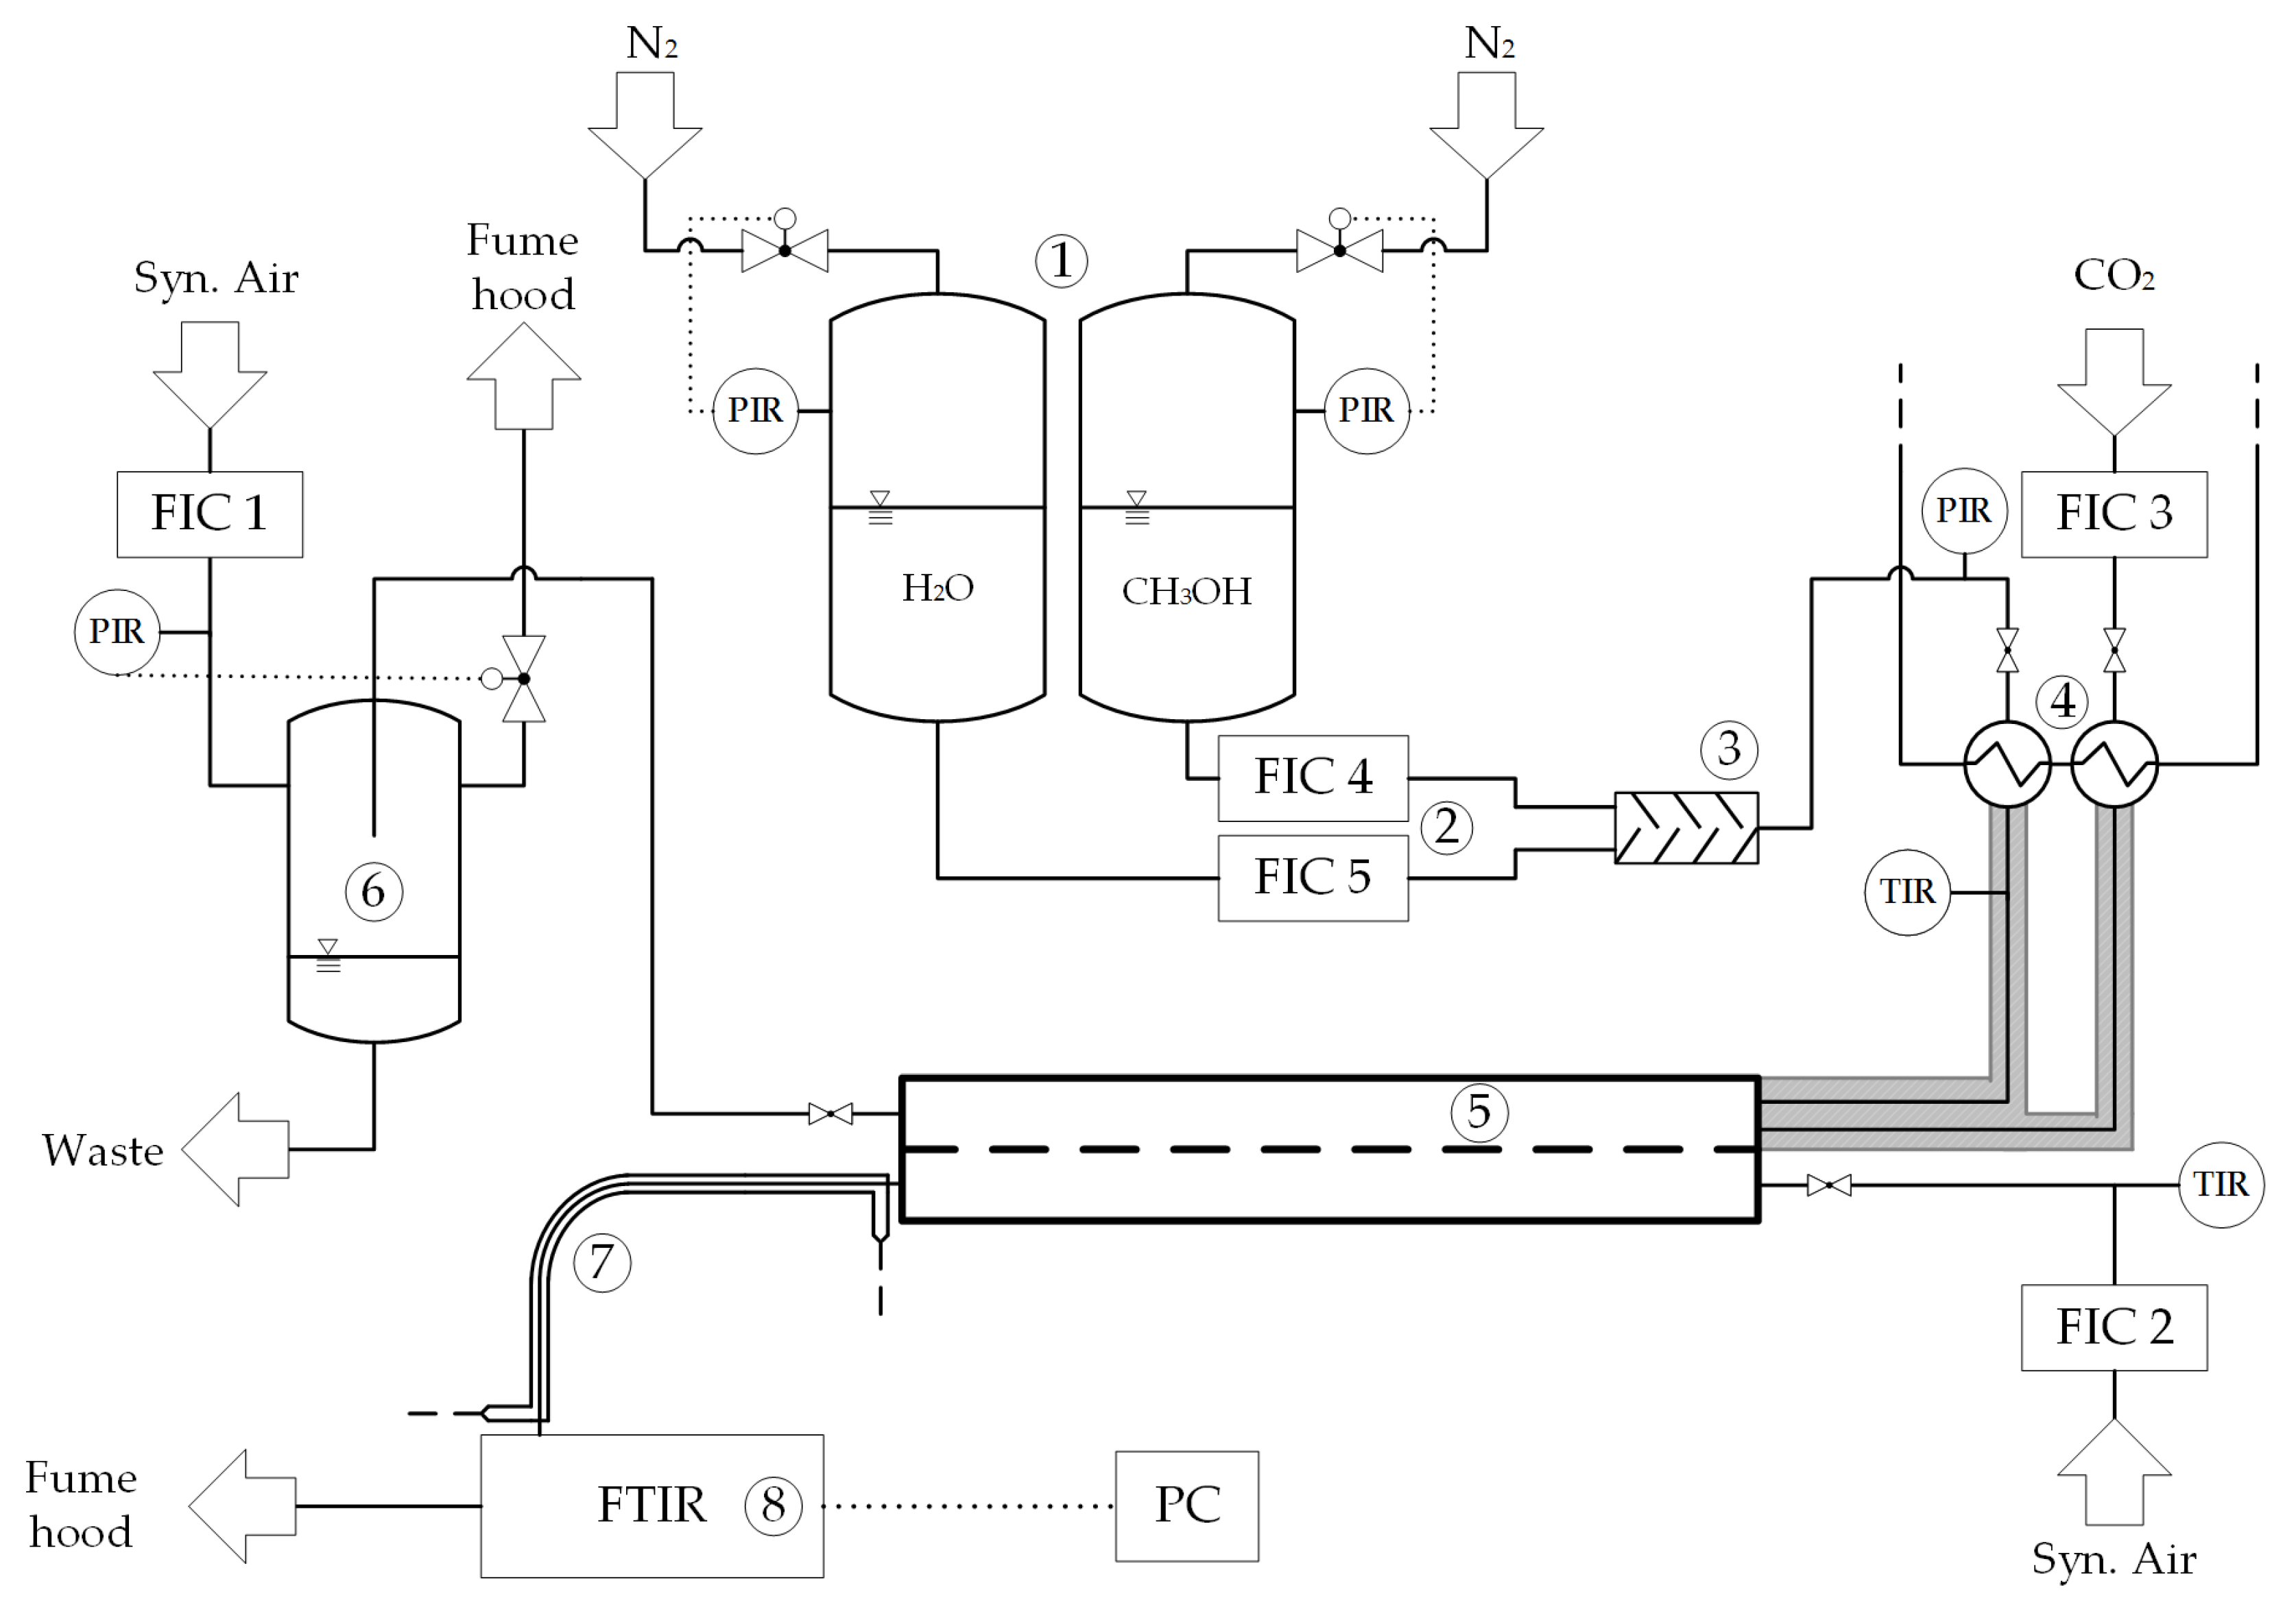
In Figure 6, a sketch of the experimental setup is shown. It can be divided into fluid dosing ①–④, micro contactor ⑤, pressure regulation ⑥, and analysis ⑦–⑧.
To ensure fluctuation-free liquid admission, the methanol and water vessels ① were pressurised by a controlled influx of nitrogen. The liquid flow was regulated with mini CORI-FLOWTMs, utilising Coriolis force as a measurement principle, whereas gas flows were regulated with an EL-FLOW® thermal mass flow controller (MFC). Both regulation units were manufactured by Bronkhorst High-Tech B.V. The specifications of the employed mini CORI-FLOWTMs and MFCs can be found in the supplementary information.
In addition, the liquids were merged in a micro mixer (Part No. 1446-A-9.0) which was designed and manufactured by the Institute of Micro Process Engineering (IMVT, Eggenstein-Leopoldshafen, Germany) ③. Two identically-manufactured cross-flow micro heat exchangers (Part No. 1469-A-1.2 and Part No. 1343-K-1.2), also designed by IMVT, were used to regulate the temperature of the liquid and gas ④. As a thermostating fluid, water was heated and pumped through the micro heat exchangers by a PROLINE P12 thermostat (Lauda Dr. R. Wobser GmbH & Co. KG, Lauda-Königshofen, Germany). Data sheets of the micro mixer and micro heat exchanger can be found in the supplementary information.
Feed gas, sweep gas, and liquid then entered the micro contactor module ⑤ where the separation process took place. At a state of incomplete separation, a two-phase flow streamed out at the outlet of the top plate. For pressure control of the single and two-phase flow, a pressure buffer was integrated ⑥. The temperature of permeate and sweep gas leaving the micro contactor ⑦ were held at a constant 80 °C by a double jacket heat exchanger ⑦. Hereby, the condensation of evaporated liquid species was prevented. Subsequently, the permeate/sweep gas mixture was spectrally analysed in a Fourier transform infrared spectrometer (FTIR) Vector 22 MIR ⑧ (Bruker® Corporation, Billerica, MA, USA) equipped with a 17 mL gas cell with optical windows made from zinc selenide. The multicomponent calibration (CO2, water, and methanol) of the gas analysis was carried out using the software OPUS 6.5. With a backward calculation using Equation (26), a constant and from the spectral analysis, the amount of the permeate was determined. For the sweep gas loss experiments or measurements of the retentate, an additional bubble flow meter Definer 220 (Mesa Labs, Lakewood, CO, USA) was used.
The experimental data acquisition and process automation as well as control was done using LabManager®/LabVision® 2.11 (Hitec Zang GmbH, Herzogenrath, Germany) on a standard PC operated with Windows® 7. Verification of the methanol concentration in the water-methanol mixture produced inline at the experimental setup was done using density-based measurements pycnometer at 20 °C (BRAND GMBH & CO KG, Wertheim, Germany). Water contact angle measurements were done manually with an optical contact angle measurement system OCA5 (DataPhysics Instruments GmbH, Filderstadt, Germany). Surface images of the unused and used porous membrane were taken with a JSM-6300 (tungsten cathode) scanning electron microscope (JOEL GmbH Germany, Freising, Germany).
3.3.2. Chemicals
All chemicals were used as bought. Methanol was bought from Merck in p.A. grade. Water was purified with a Milli-Q Reference by Merck® Millipore (serial number F5PA67202D). The electrical resistance of the purified water was measured to be 18.2 MΩ cm. All gases were purchased from Air Liquid in grad N4.5 (separation experiments).
3.4. Operation Conditions
Generally, experiments were performed at a temperature of and a relative humidity of . Experiments on separation performance and liquid loss by diffusion and evaporation were measured at feed entry temperatures of 40 °C and 60 °C.
For the orientation tests, a feed entry temperature of 40 °C was chosen. For the determination of the methanol loss, the methanol concentration of the water-methanol mixture was set to 1 and , i.e., the usual fuel concentration in an active µDMFC system. For all other experiments, the methanol concentration was generally set to to study the influence it had on the separation process and membrane material resistance.
3.4.1. Gas Permeability
The gas permeability was measured with a dead-end method for all porous membranes. With this method, the incoming gas volume flow can only leave the membrane micro contactor across the porous membrane. For the determination of the gas permeability, the pressure drop for different gas volumetric flows up to was detected. Furthermore, the gas permeability and the sweep gas loss for was checked in detail with an open-end method with a constant feed gas volumetric flow and different sweep gas volumetric flows up to in the permeate channel.
3.4.2. Separation Efficiency
The separation efficiency or performance was evaluated by the following three different criteria:
- Separation performance
- Liquid loss by evaporation and diffusion
- Orientation independence
All experimental parameters for each evaluation criteria are summarised in Table 3.
For all porous membranes and evaluation criteria, the transmembrane pressure was set to and the liquid volume flow to . The feed gas volume flow was varied between and . Additionally, the gas permeability was investigated at separations factors below , indicating the maximum gas permeability of the porous membrane under two-phase flow conditions. Furthermore, the temperature was varied and the methanol concentration of the water-methanol was set to .
For the diffusive liquid loss at single phase flow, the Aspire® QL217 membrane was used as an example to detect the real liquid loss by diffusion of water and methanol at room temperature for different methanol concentrations and sweep gas volume flows.
The determination of the orientation independent gas/liquid phase separation with the porous membrane-based micro contactor was checked for four different orientations. The orientation was clockwise radially rotated by 90°, 180°, and 270° with respect to gravity. With these test scenarios, all occurring critical orientations were tested.
3.4.3. Active Membrane Area
Considering the two-phase flow, the membrane area was not completely used during the separation process, especially at full separation. If , a two-phase flow would be still present at the feed outlet. The determination of the active membrane area or participating membrane area during the separation process was done for the Aspire® QL 217 membrane at room temperature with different methanol concentrations. To quantify the active membrane area, the permeability values for single phase and two-phase flow were experimentally determined and afterwards compared. The sweep gas was set to .
4. Results
4.1. Gas Permeability
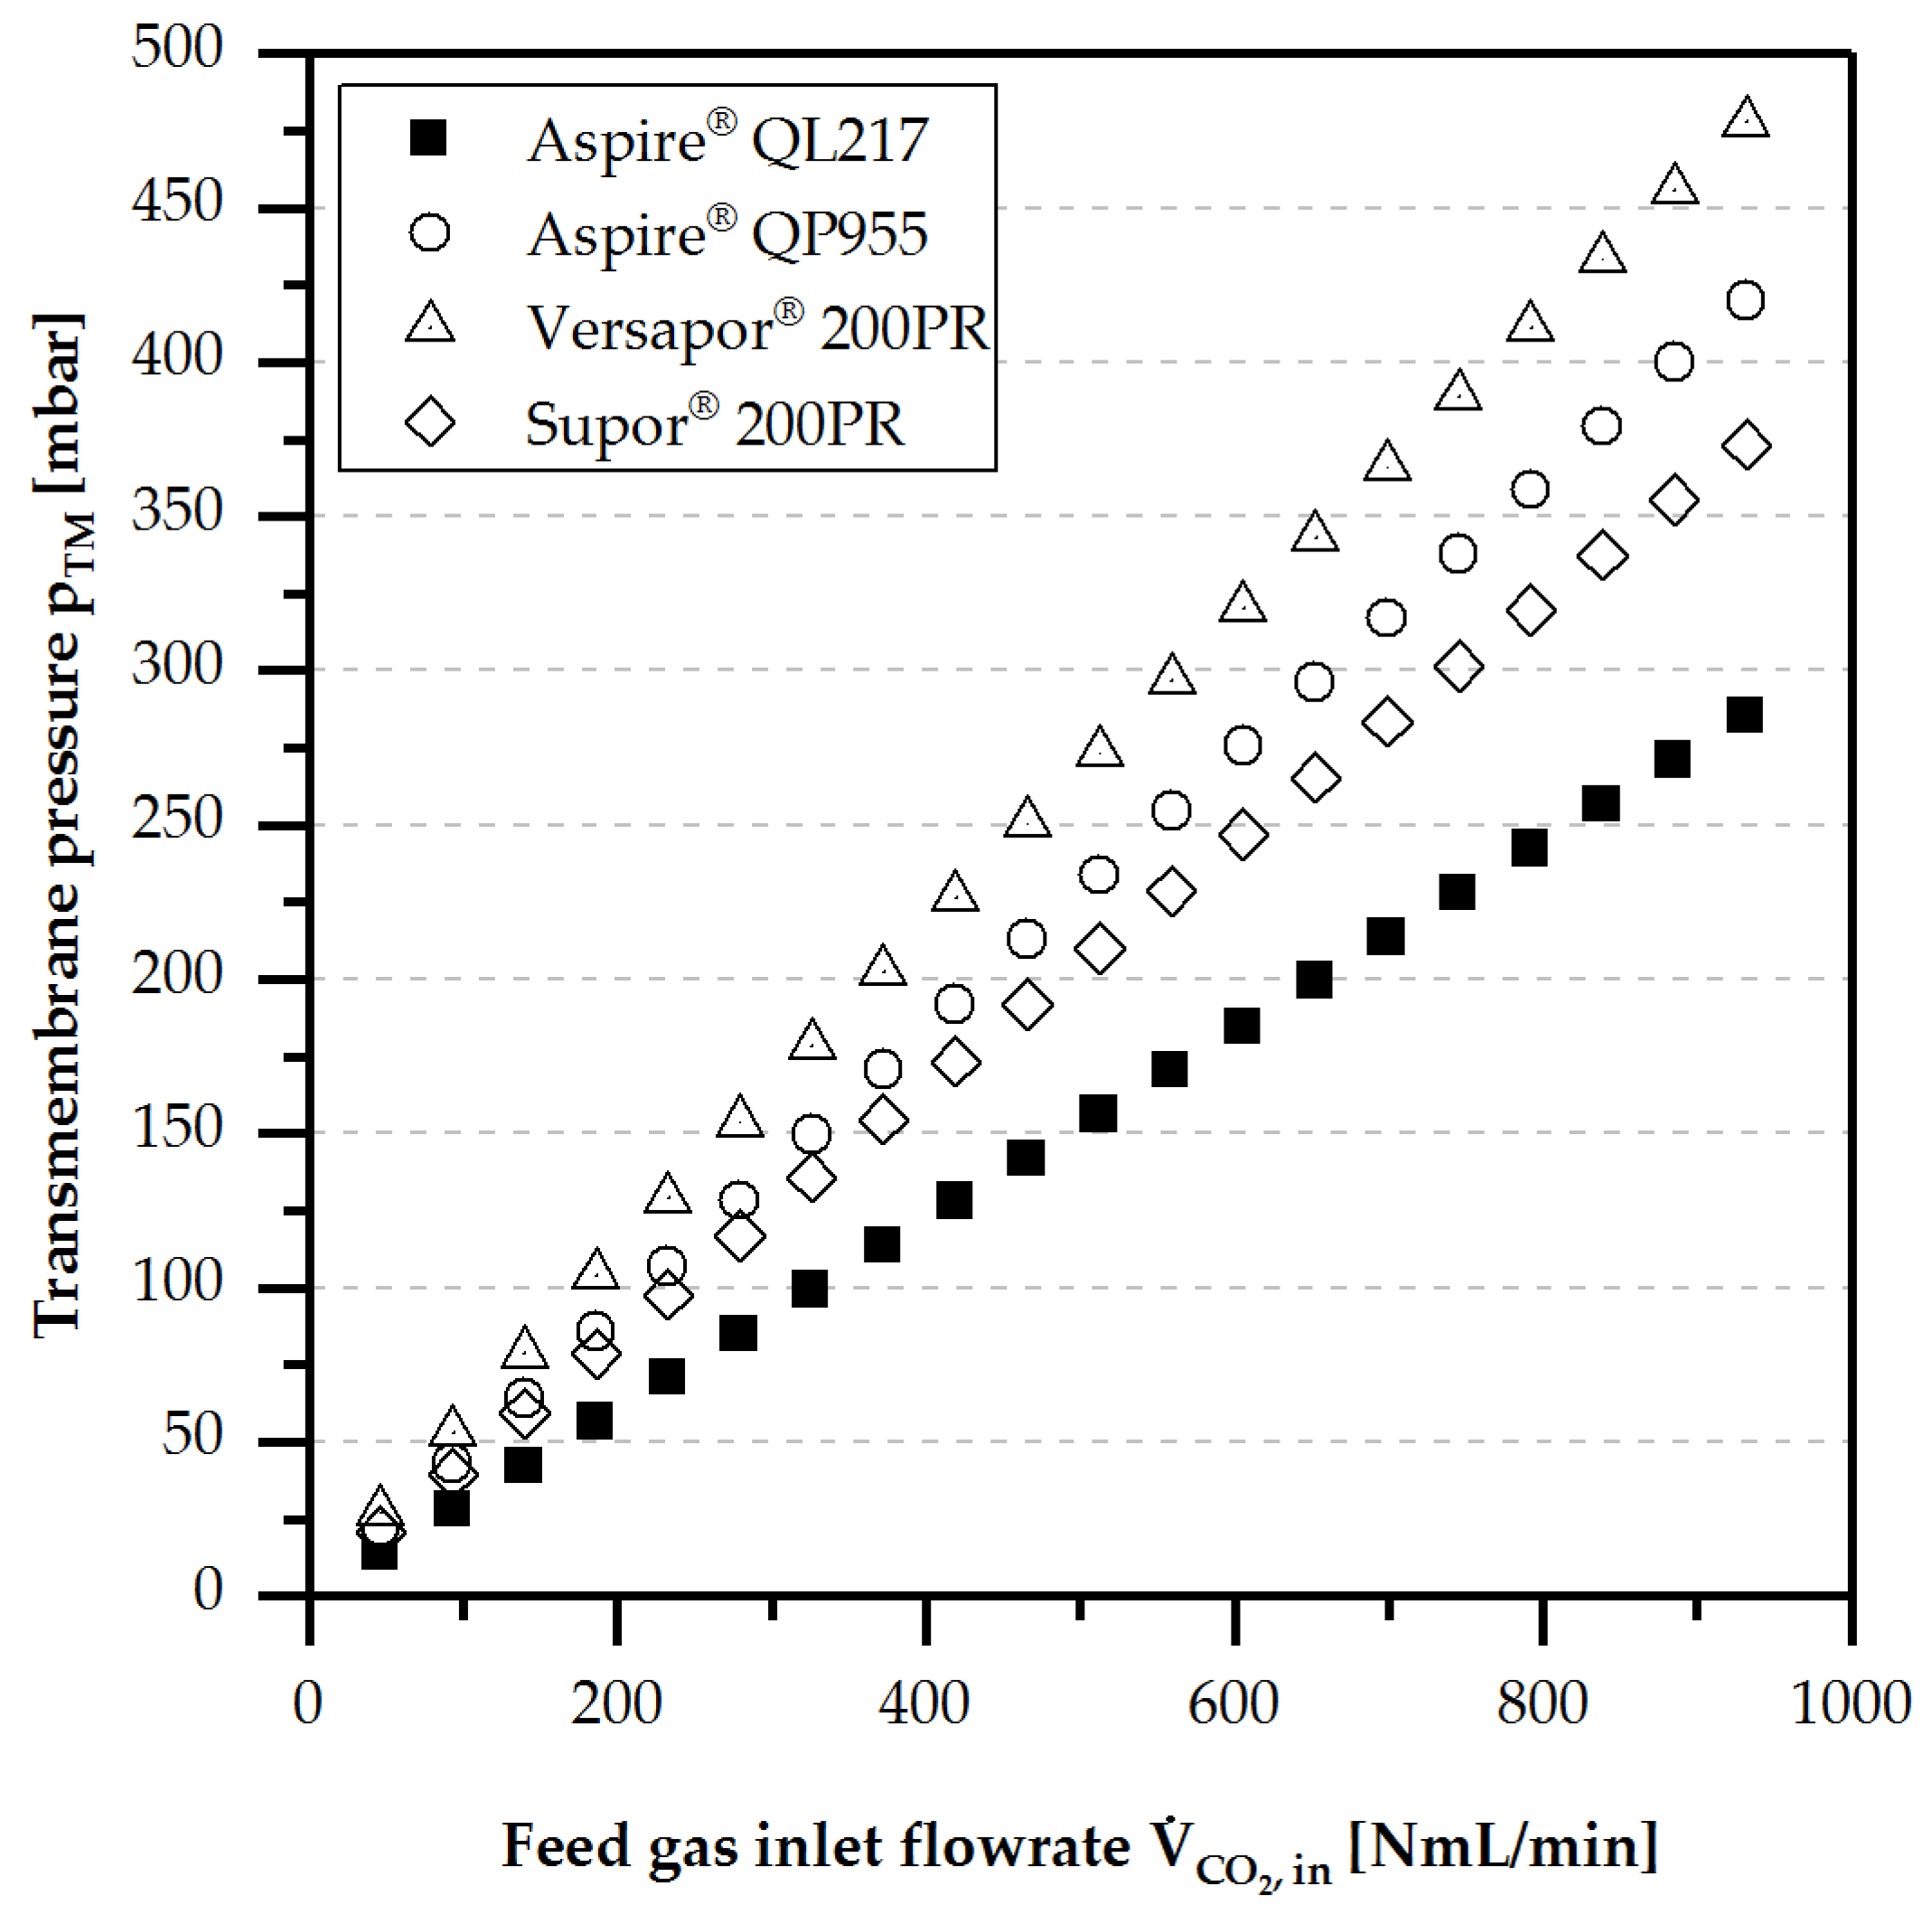
As shown in Figure 7, the transmembrane pressure rose with an increasing feed gas volume flux at room temperature for all membranes.
Gas permeability values shown in Table 4 were calculated by rearranging Equation (8). The total membrane thickness (active membrane layer + supporting material) was used for the calculation of the permeability.
The highest gas permeability was detected for the membrane Aspire® QL217. The Versapor® 200PR membrane showed the lowest gas permeability, due to the increased thickness of the active membrane layer compared to the other membranes. The relatively low gas permeability of the membrane Aspire® QP955 was caused by the smaller pores (100 nm) compared to the other membranes (200 nm).
4.2. Diffusion
The gas diffusion process from the sweep gas channel into the feed gas channel and vice versa played a significant role at low pressure gradients and low convective flux rates. This can be seen by the exemplary calculated diffusion values for a 10 µm thick active membrane layer with a pore diameter of 200 nm supported by a porous backer material with a thickness of 190 µm. The Knudsen number for air in the active microporous membrane layer is calculated to be with a mean path length at 1 bar and 298.15 K [34]. Thus, in this case, the diffusion mechanism is a mixture of Knudsen and free molecular diffusion.
However, as a simplification, only pure Knudsen diffusion in the active membrane layer is assumed to be equal to the highest possible mass transfer coefficient. The Knudsen diffusion value is , whereas the free diffusion value is . In the real case, it is evident that the diffusion value of the active membrane lies in between and .
In direct comparison, the transport coefficient in the membrane layer is over 10 times higher than the transport coefficient in the thick backer material. It is clear that the backer material limits the mass transfer by diffusion. Due to this, a uniform and free molecular diffusion through the membrane can be assumed, and the Knudsen diffusion can be neglected.
With an average concentration gradient of , considering a pore area of , the diffusive volume flux of sweep gas (air) is . Additionally, an equimolar flow of CO2 can be supposed to be transported diffusively in the opposite direction.
It is important to note that this is only a rough estimation. Many aspects, including the diffusive mass transport within feed and sweep channel and exact membrane characteristics such as tortuosity, porosity, and pore length, are not considered. Nevertheless, it can be assumed that the polymer membranes used is this article, just like those considered in the model membrane, have a very low mass transfer resistance.
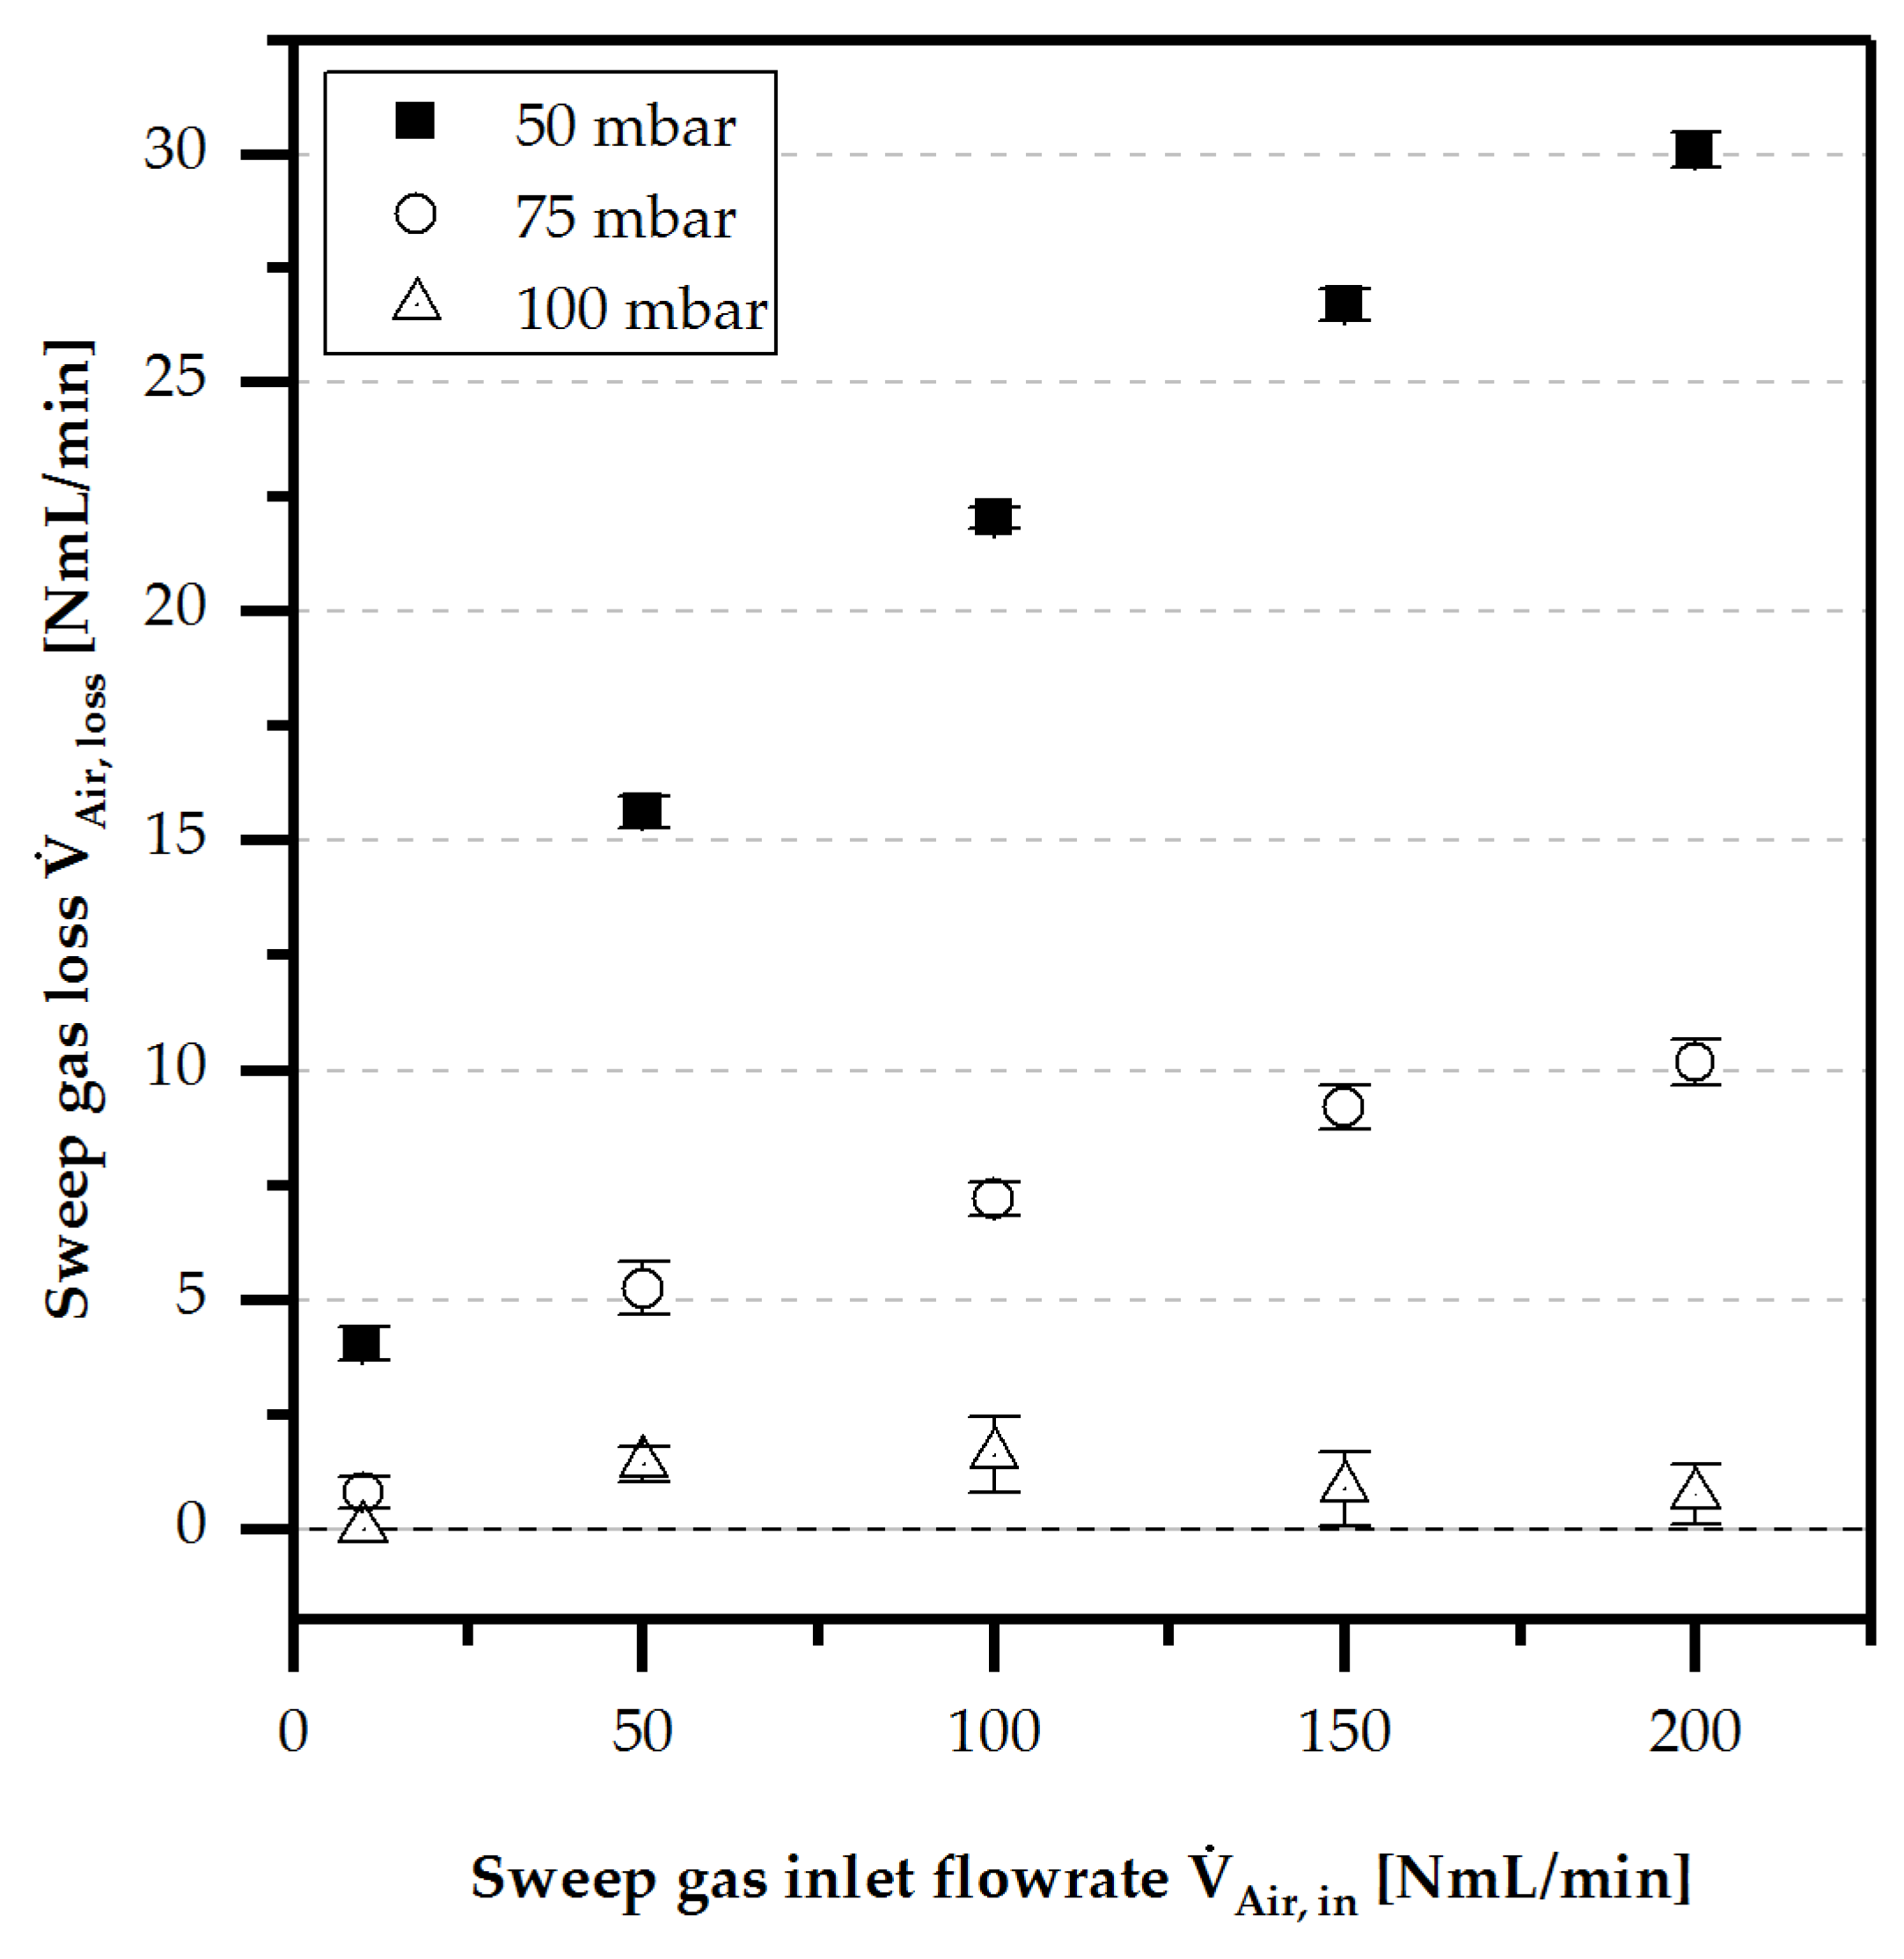
In addition, the sweep gas loss by diffusion was detected at different sweep gas fluxes and transmembrane pressure gradients, as shown in Figure 8. A clear correlation between low pressure gradients and high concentration gradient-driven sweep gas loss by diffusion was observed.
At a pressure gradient of 100 mbar, these losses became insignificant. Diffusive transport of the feed gas also inevitably followed this behaviour. It can be concluded that diffusive mass transfer phenomena will be irrelevant at pressure gradients higher or equal to .
4.3. Separation Efficiency
The effectiveness of a separation process was assessed by the separation performance, liquid loss, and orientation independence. A detailed overview of the results and a discussion are provided below.
4.3.1. Separation Performance
In principle, the porous membrane-based micro contactor can be installed downstream of the µDMFC system to achieve a flat, compact, and portable LOC design. By doing so, an open or closed breather can be realised. In the case of the open breather, the membrane is visible from the outside, and directly separates the CO2 into the environment, whereas the closed breather has an additional channel for flushing by a sweep gas. However, in both cases, isothermal operating conditions cannot be assumed due to the transient operating mode of the portable µDMFC.
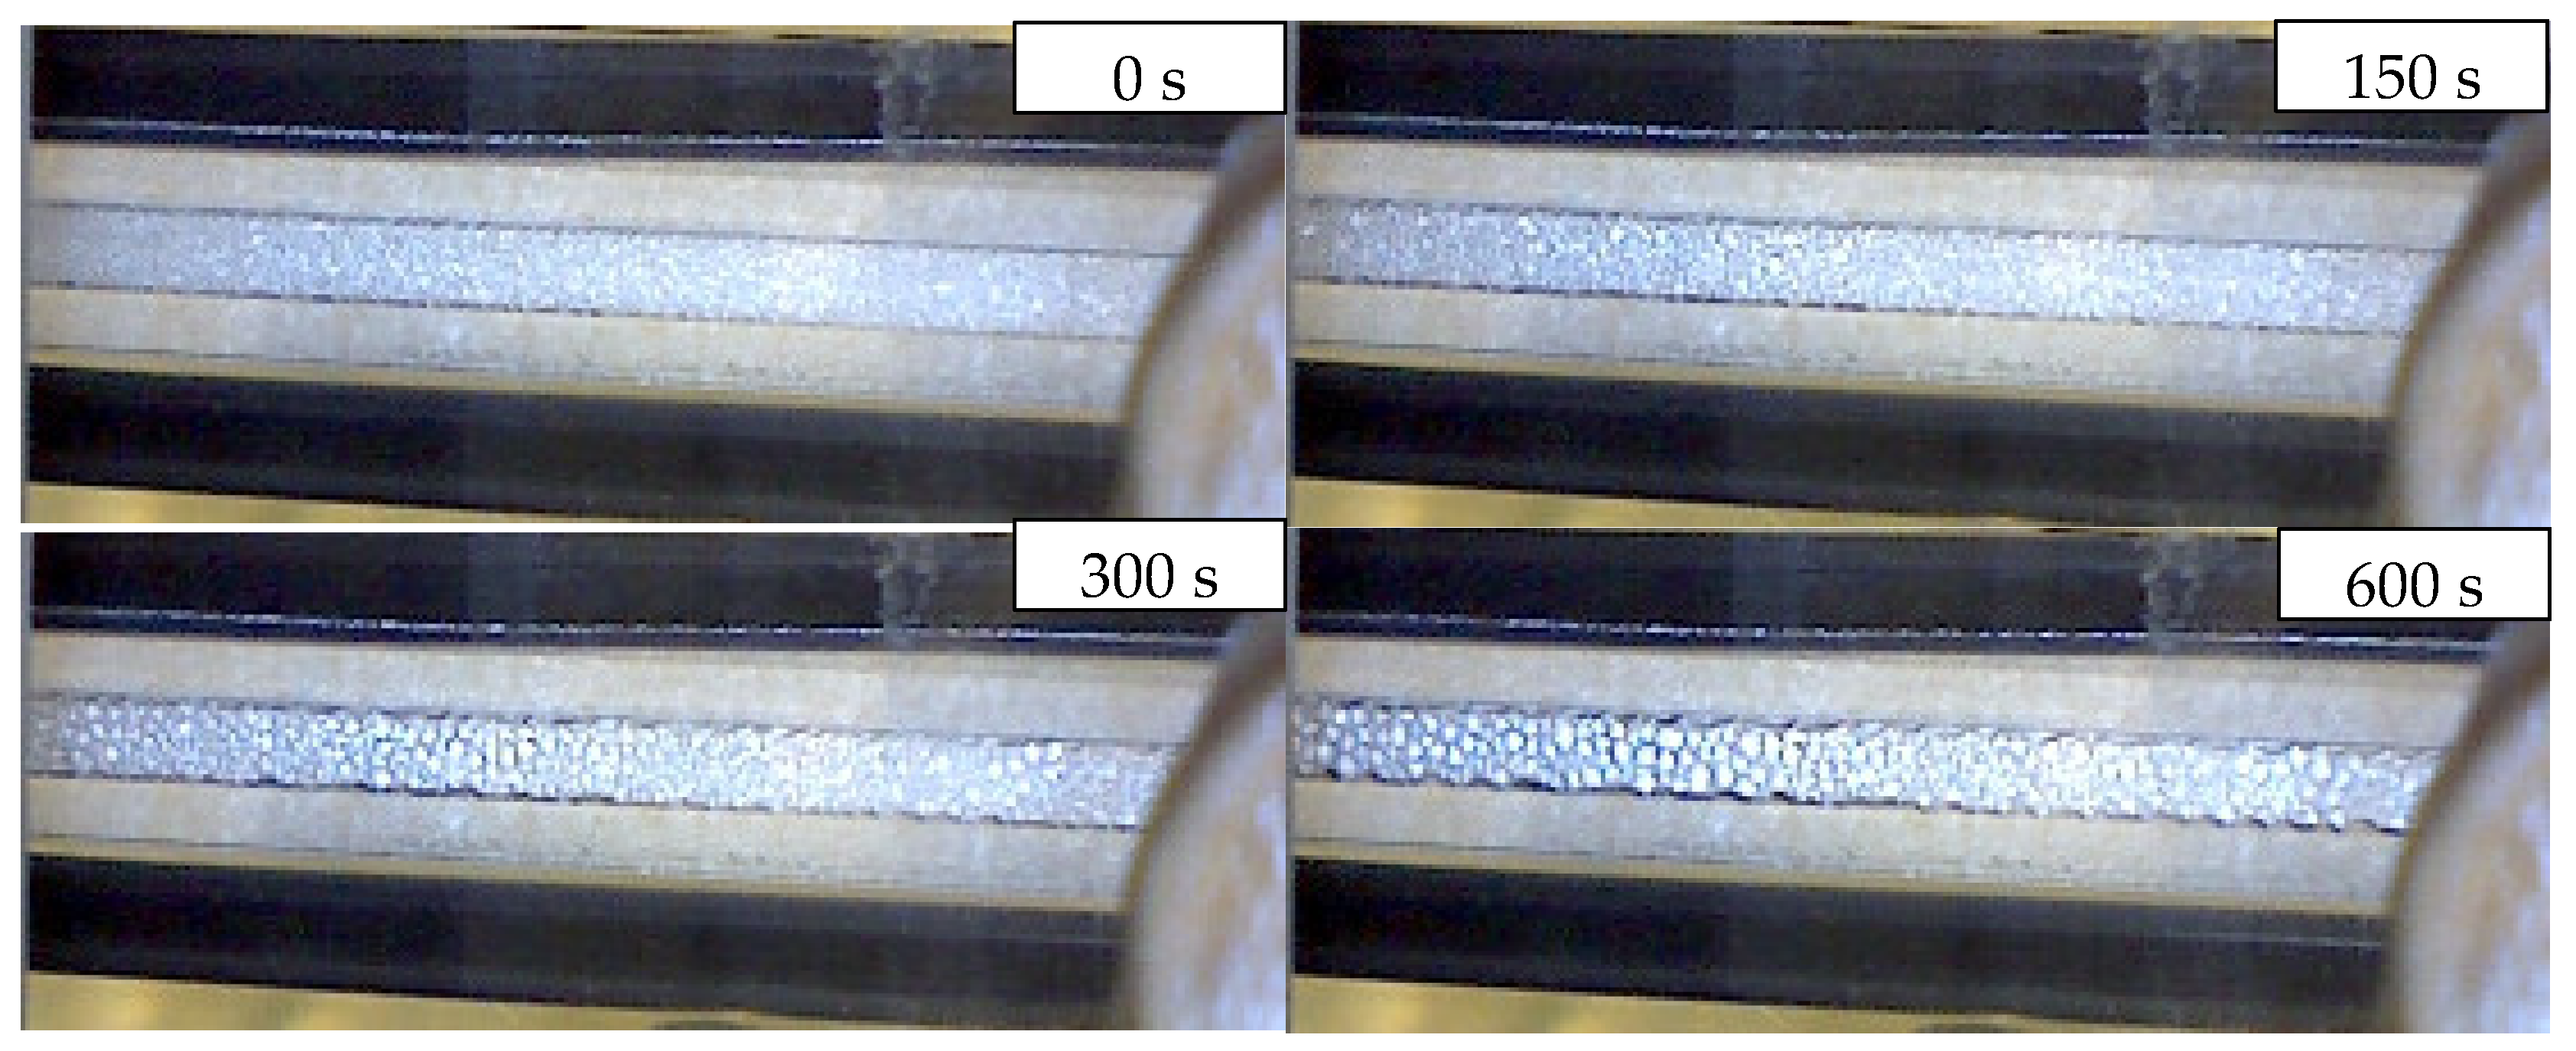
In all experiments where the separation efficiency was investigated at increased fluid inlet temperatures and without isothermal micro contactor operating conditions, liquid condensation under single- and two-phase conditions at the membrane support, i.e., the sweep gas channel, was observed. First, the liquid species evaporated at the membrane side into the gas phase. Thereafter, the vapour was transported by diffusion or convection through the active and supporting layer of the membrane. Subsequently, the vapour condensed at the membrane support due to the lower temperature within the sweep gas channel as shown in Figure 9.
As a consequence, the pores of the porous membrane got blocked and the separation performance decreased rapidly after 10 min. To reduce the diffusive flux (part of the liquid loss of water and methanol) and to avoid the condensation, a micro heat exchanger installed downstream after the µDMFC should be taken into account for the µDMFC with LOC design.
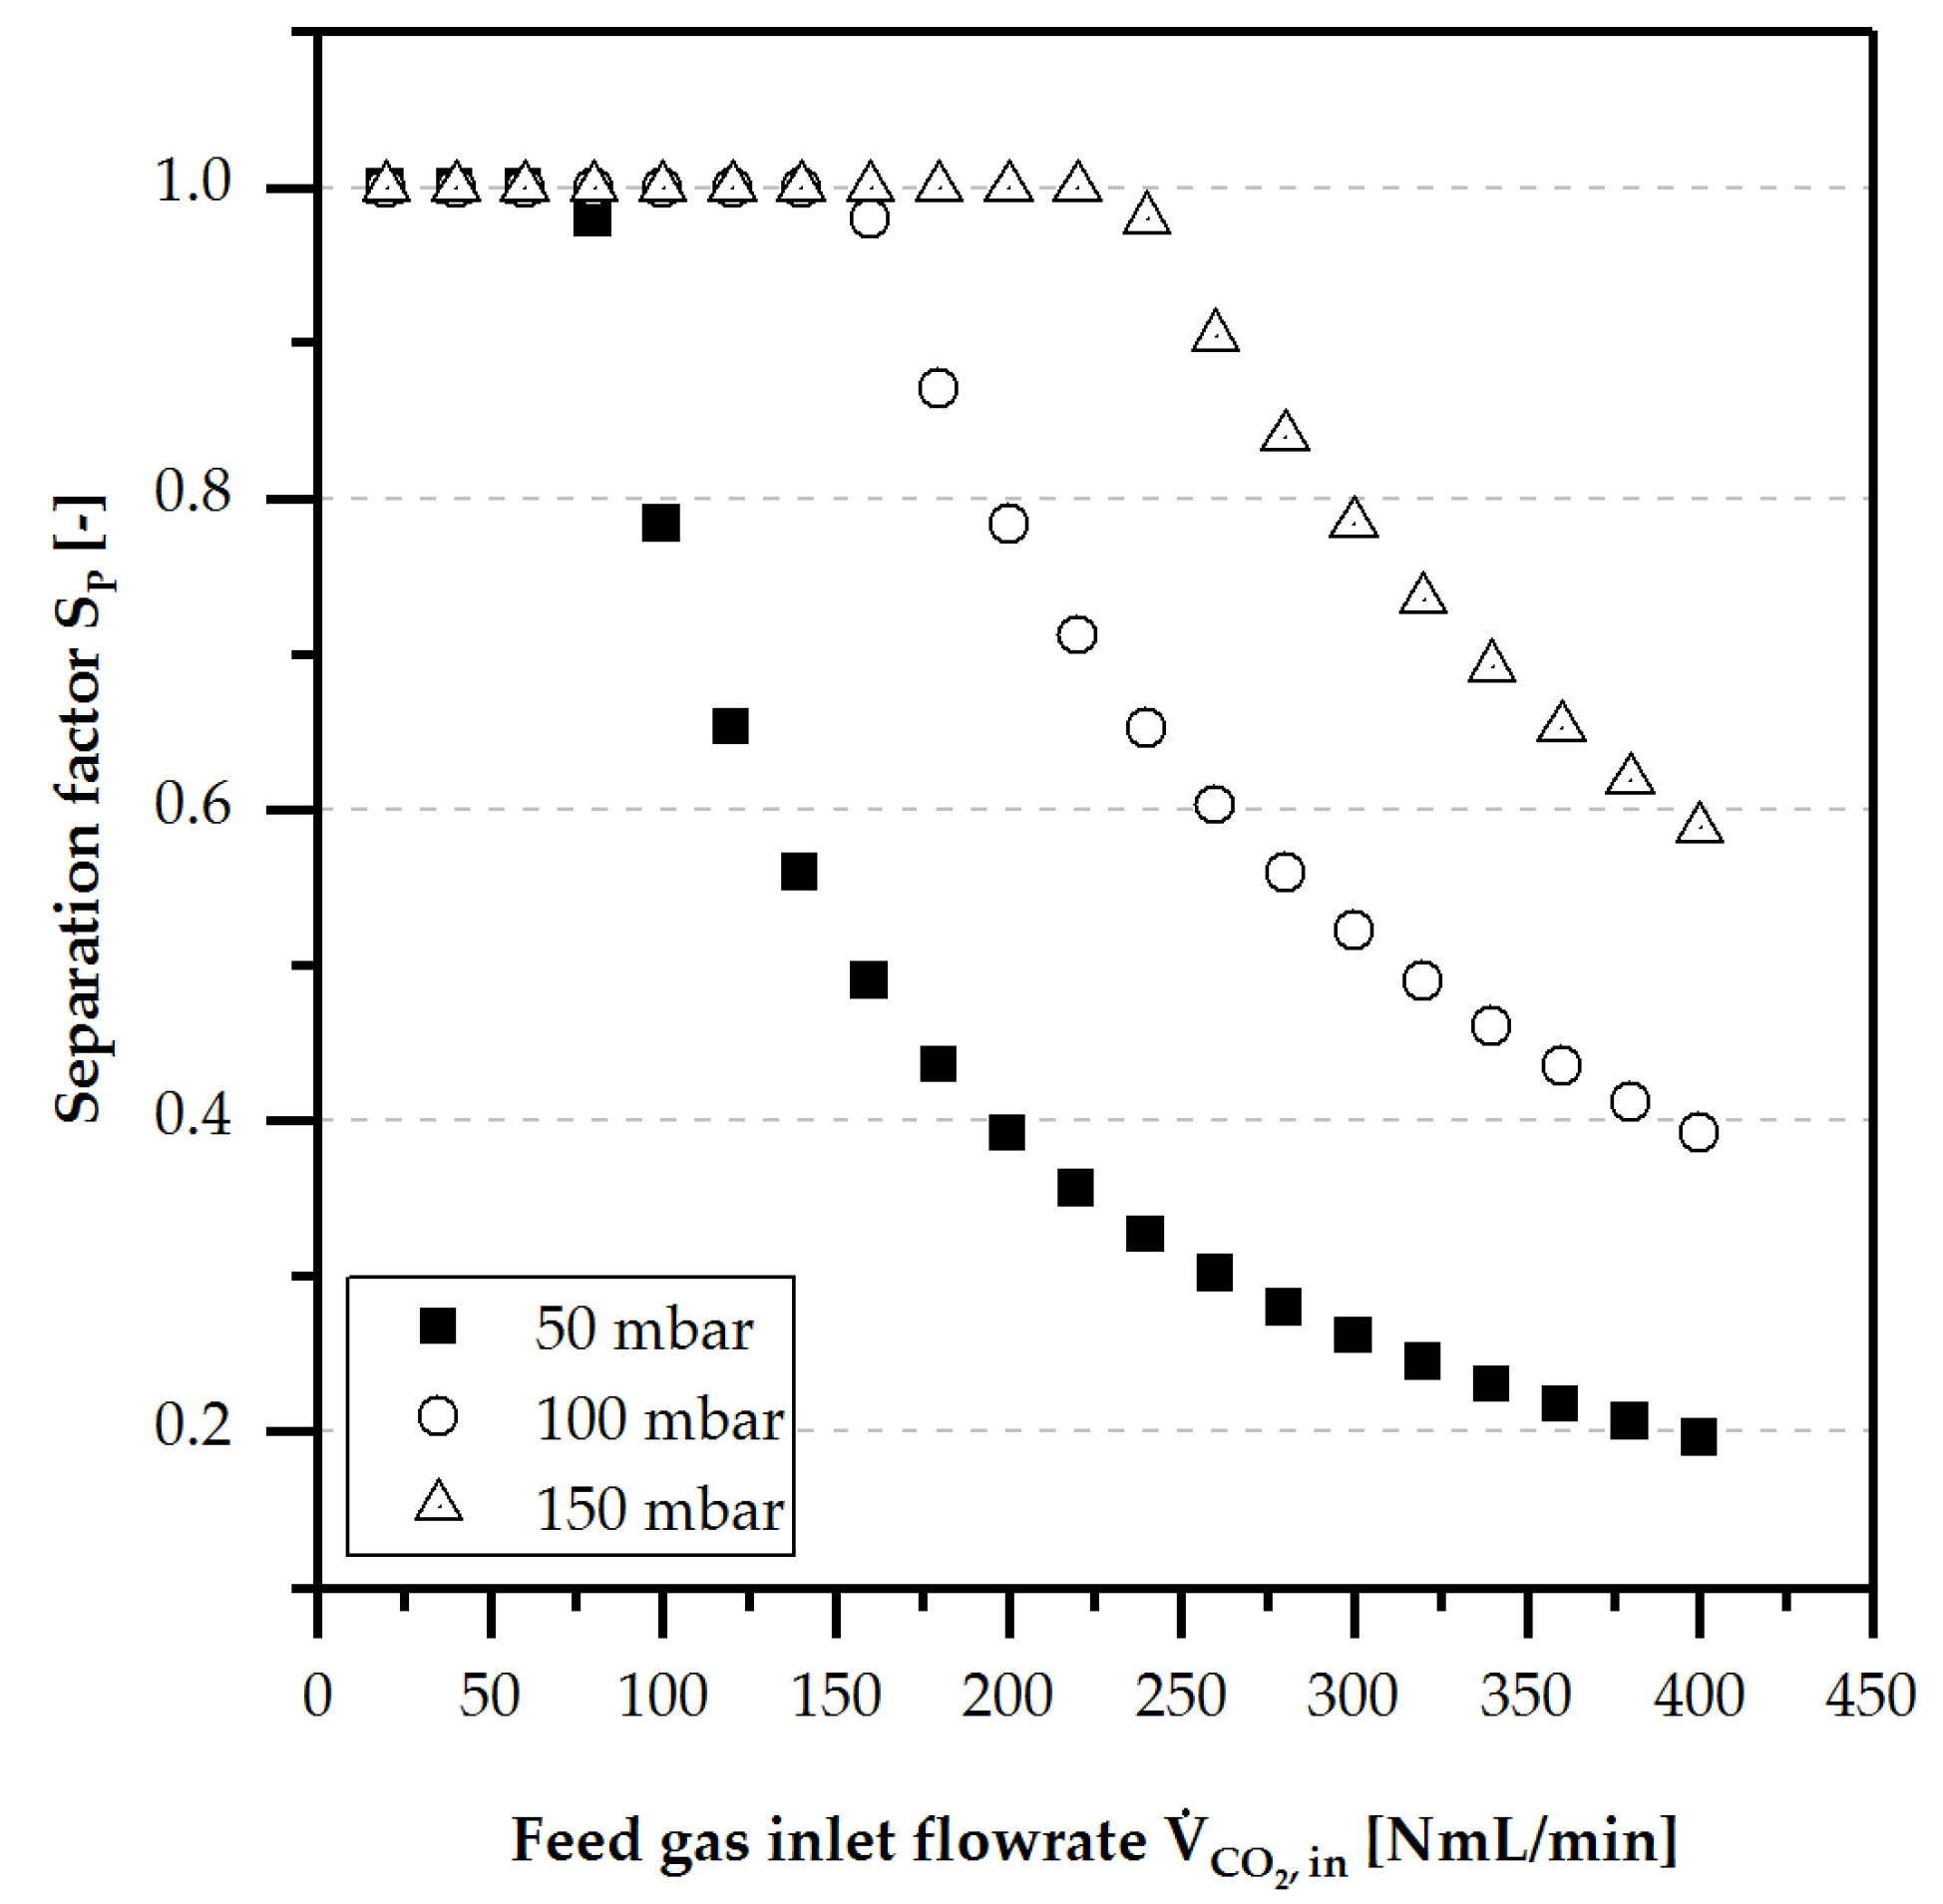
Another possibility for avoiding condensation is an increased sweep gas flow up to . Hereby, an increased liquid loss of water and methanol by liquid species diffusion during the experiments without condensation was observed (see Section 4.3.2.). Moreover, the constantly supplied sweep gas (synthetic air) was used as reference and dilution to detect inline the real separated CO2 amount by FTIR measurements. The experimental results for are shown in Figure 10.
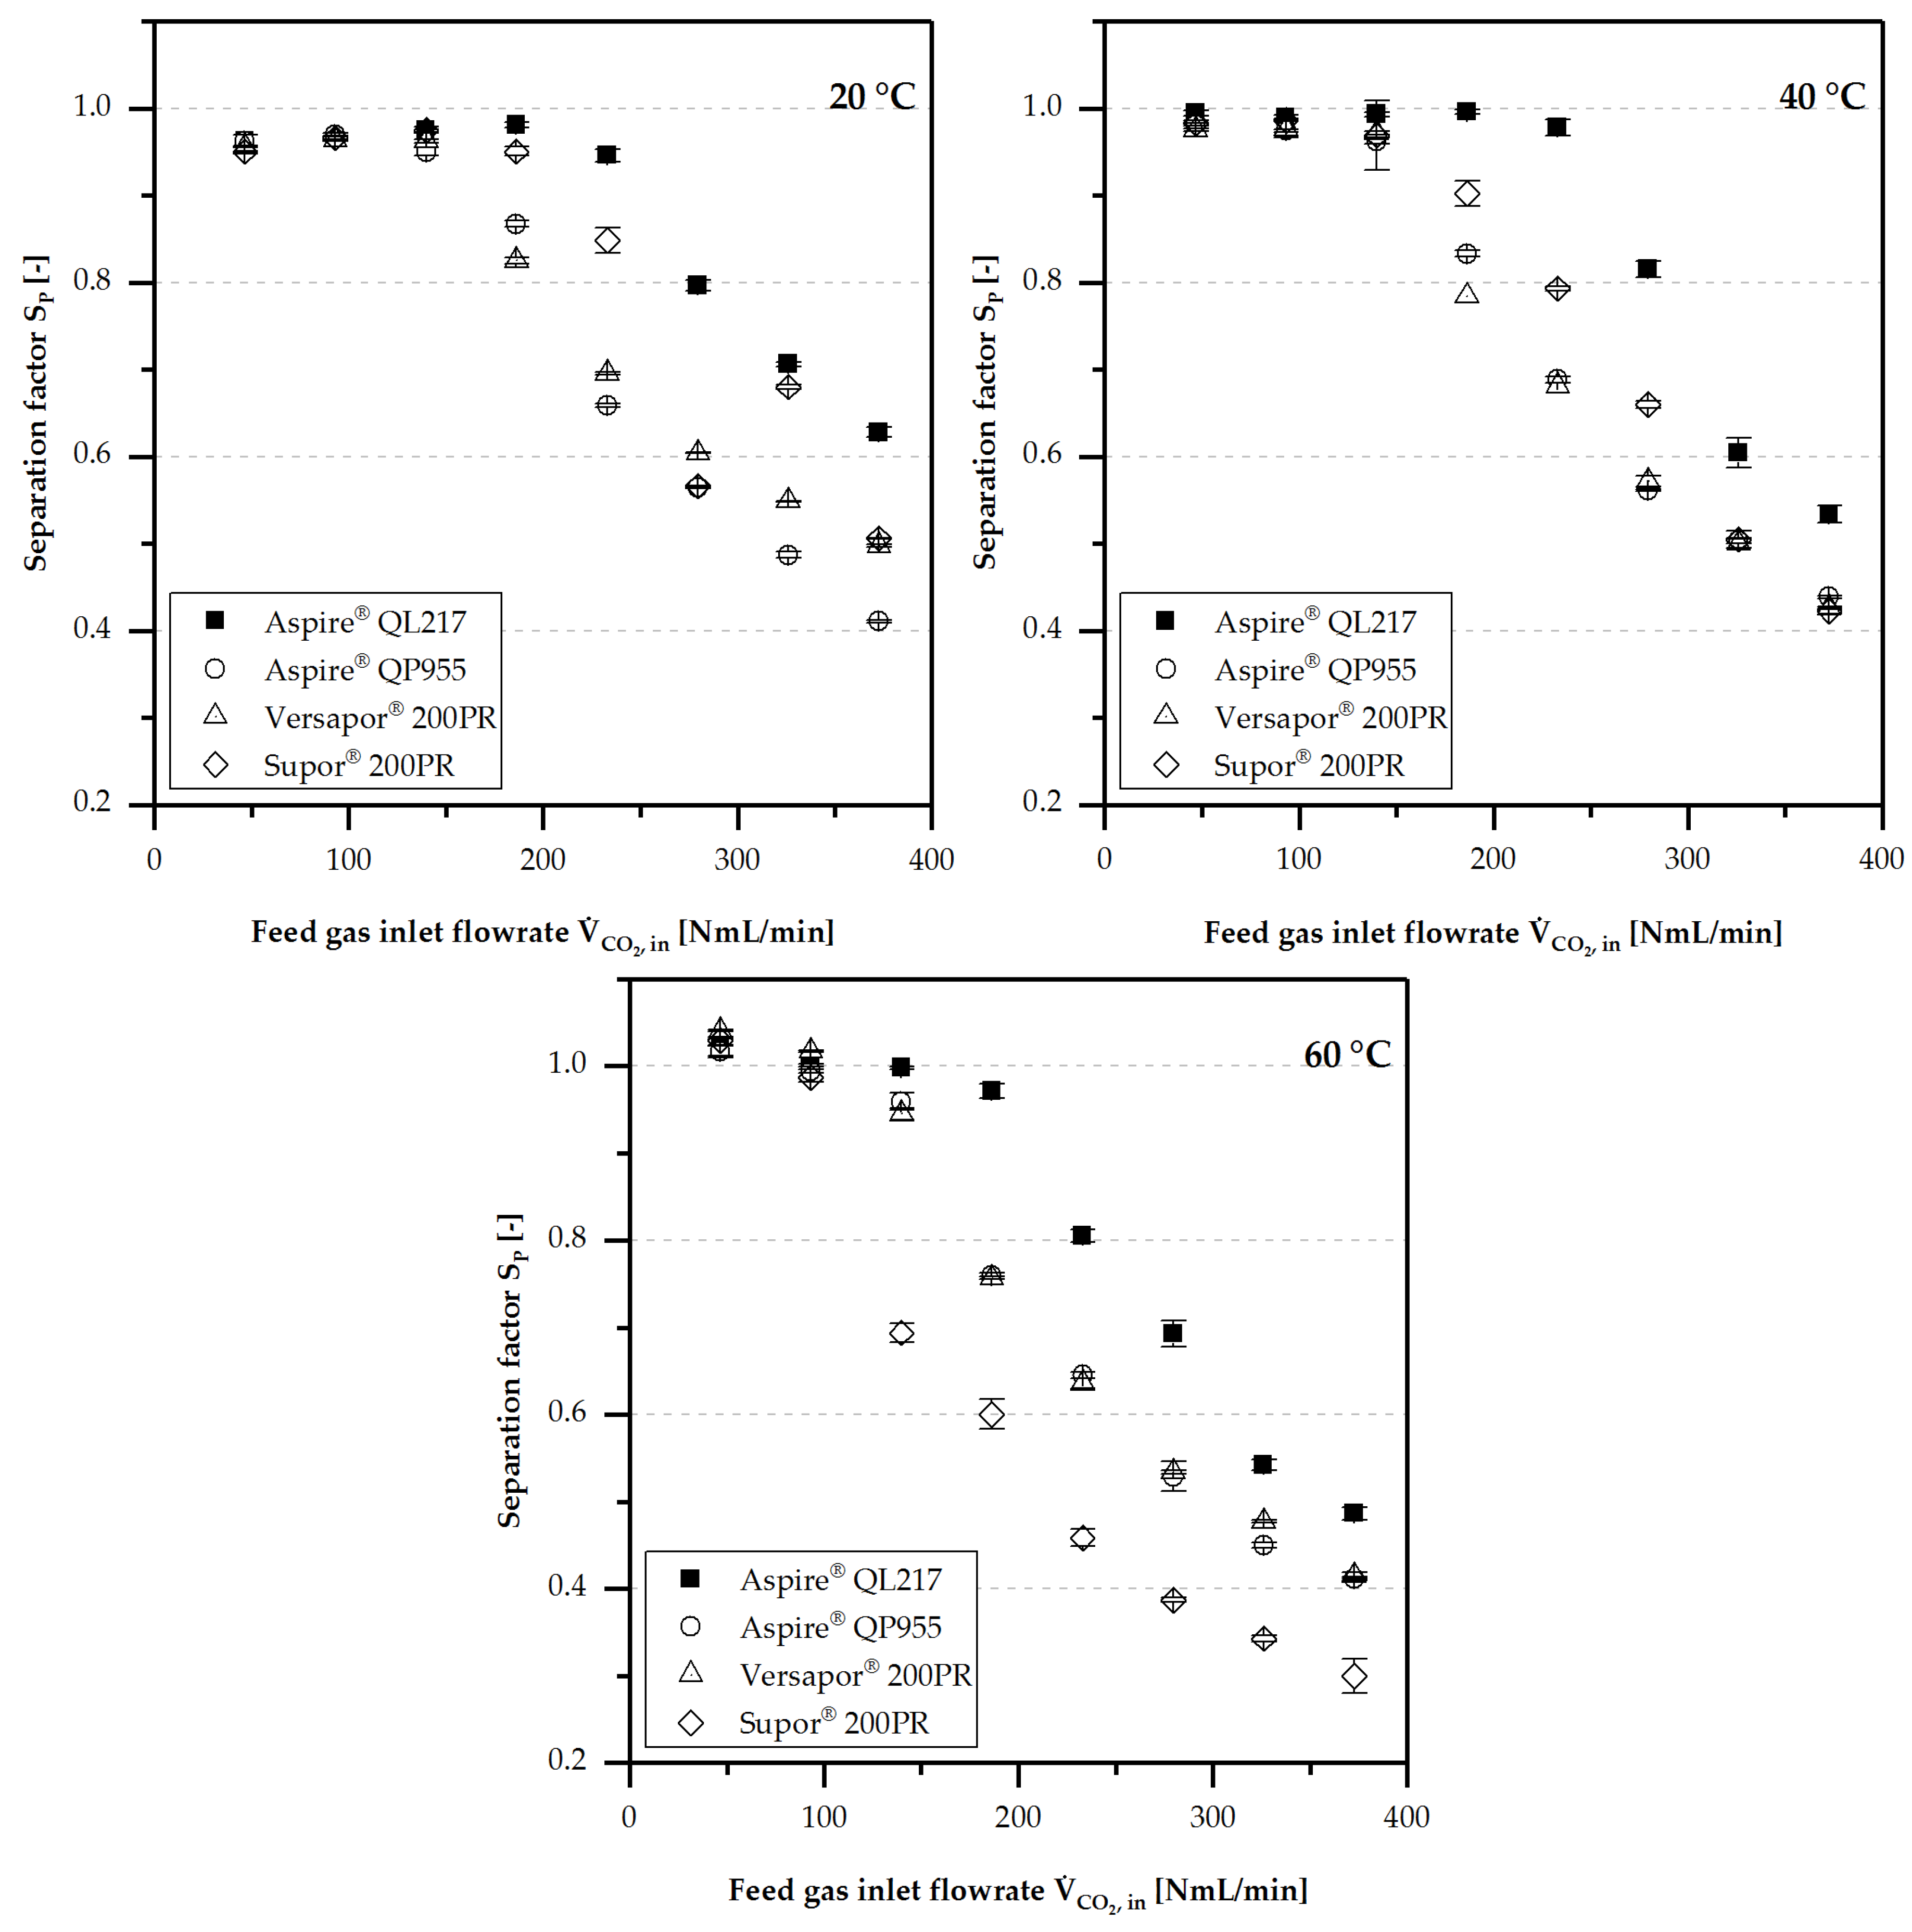
All porous membranes showed complete separation behaviour ( or ) for CO2 gas feed volume flows between 100–150 . A decrease of was observed at CO2 feed gas volume flows above 100–150 . In both cases, a dependence on the inlet temperature was noticed due to the liquid evaporation increasing the amount of gas to be separated, as well as decreasing surface tension and viscosity of the water-methanol mixture. Nevertheless, the curve characteristics for all porous membranes were almost identical, except for the maximum separation amount.
The turning point of indicated the maximum separable amount of CO2 at any given transmembrane pressure as described by Darcy’s law. From this point, a characteristic regressive curve was detected, agreeing with the theory.
At room temperature, the values for a complete separation were observed to be slightly below 1, whereas at 60 °C, the values were slightly above 1. In both cases, the gas solution and dissolution processes of CO2 into the water-methanol mixture during the separation were responsible for this phenomenon.
Moreover, only the porous membrane Supor® 200PR showed a dramatic decrease in at . After decreasing the temperature back to , nearly the same values were detected. It is assumed that a reversible temperature and methanol-induced change in the porous membrane took place, leading to reduced gas permeability. Several repetitions with increasing and decreasing inlet temperatures showed the same behaviour.
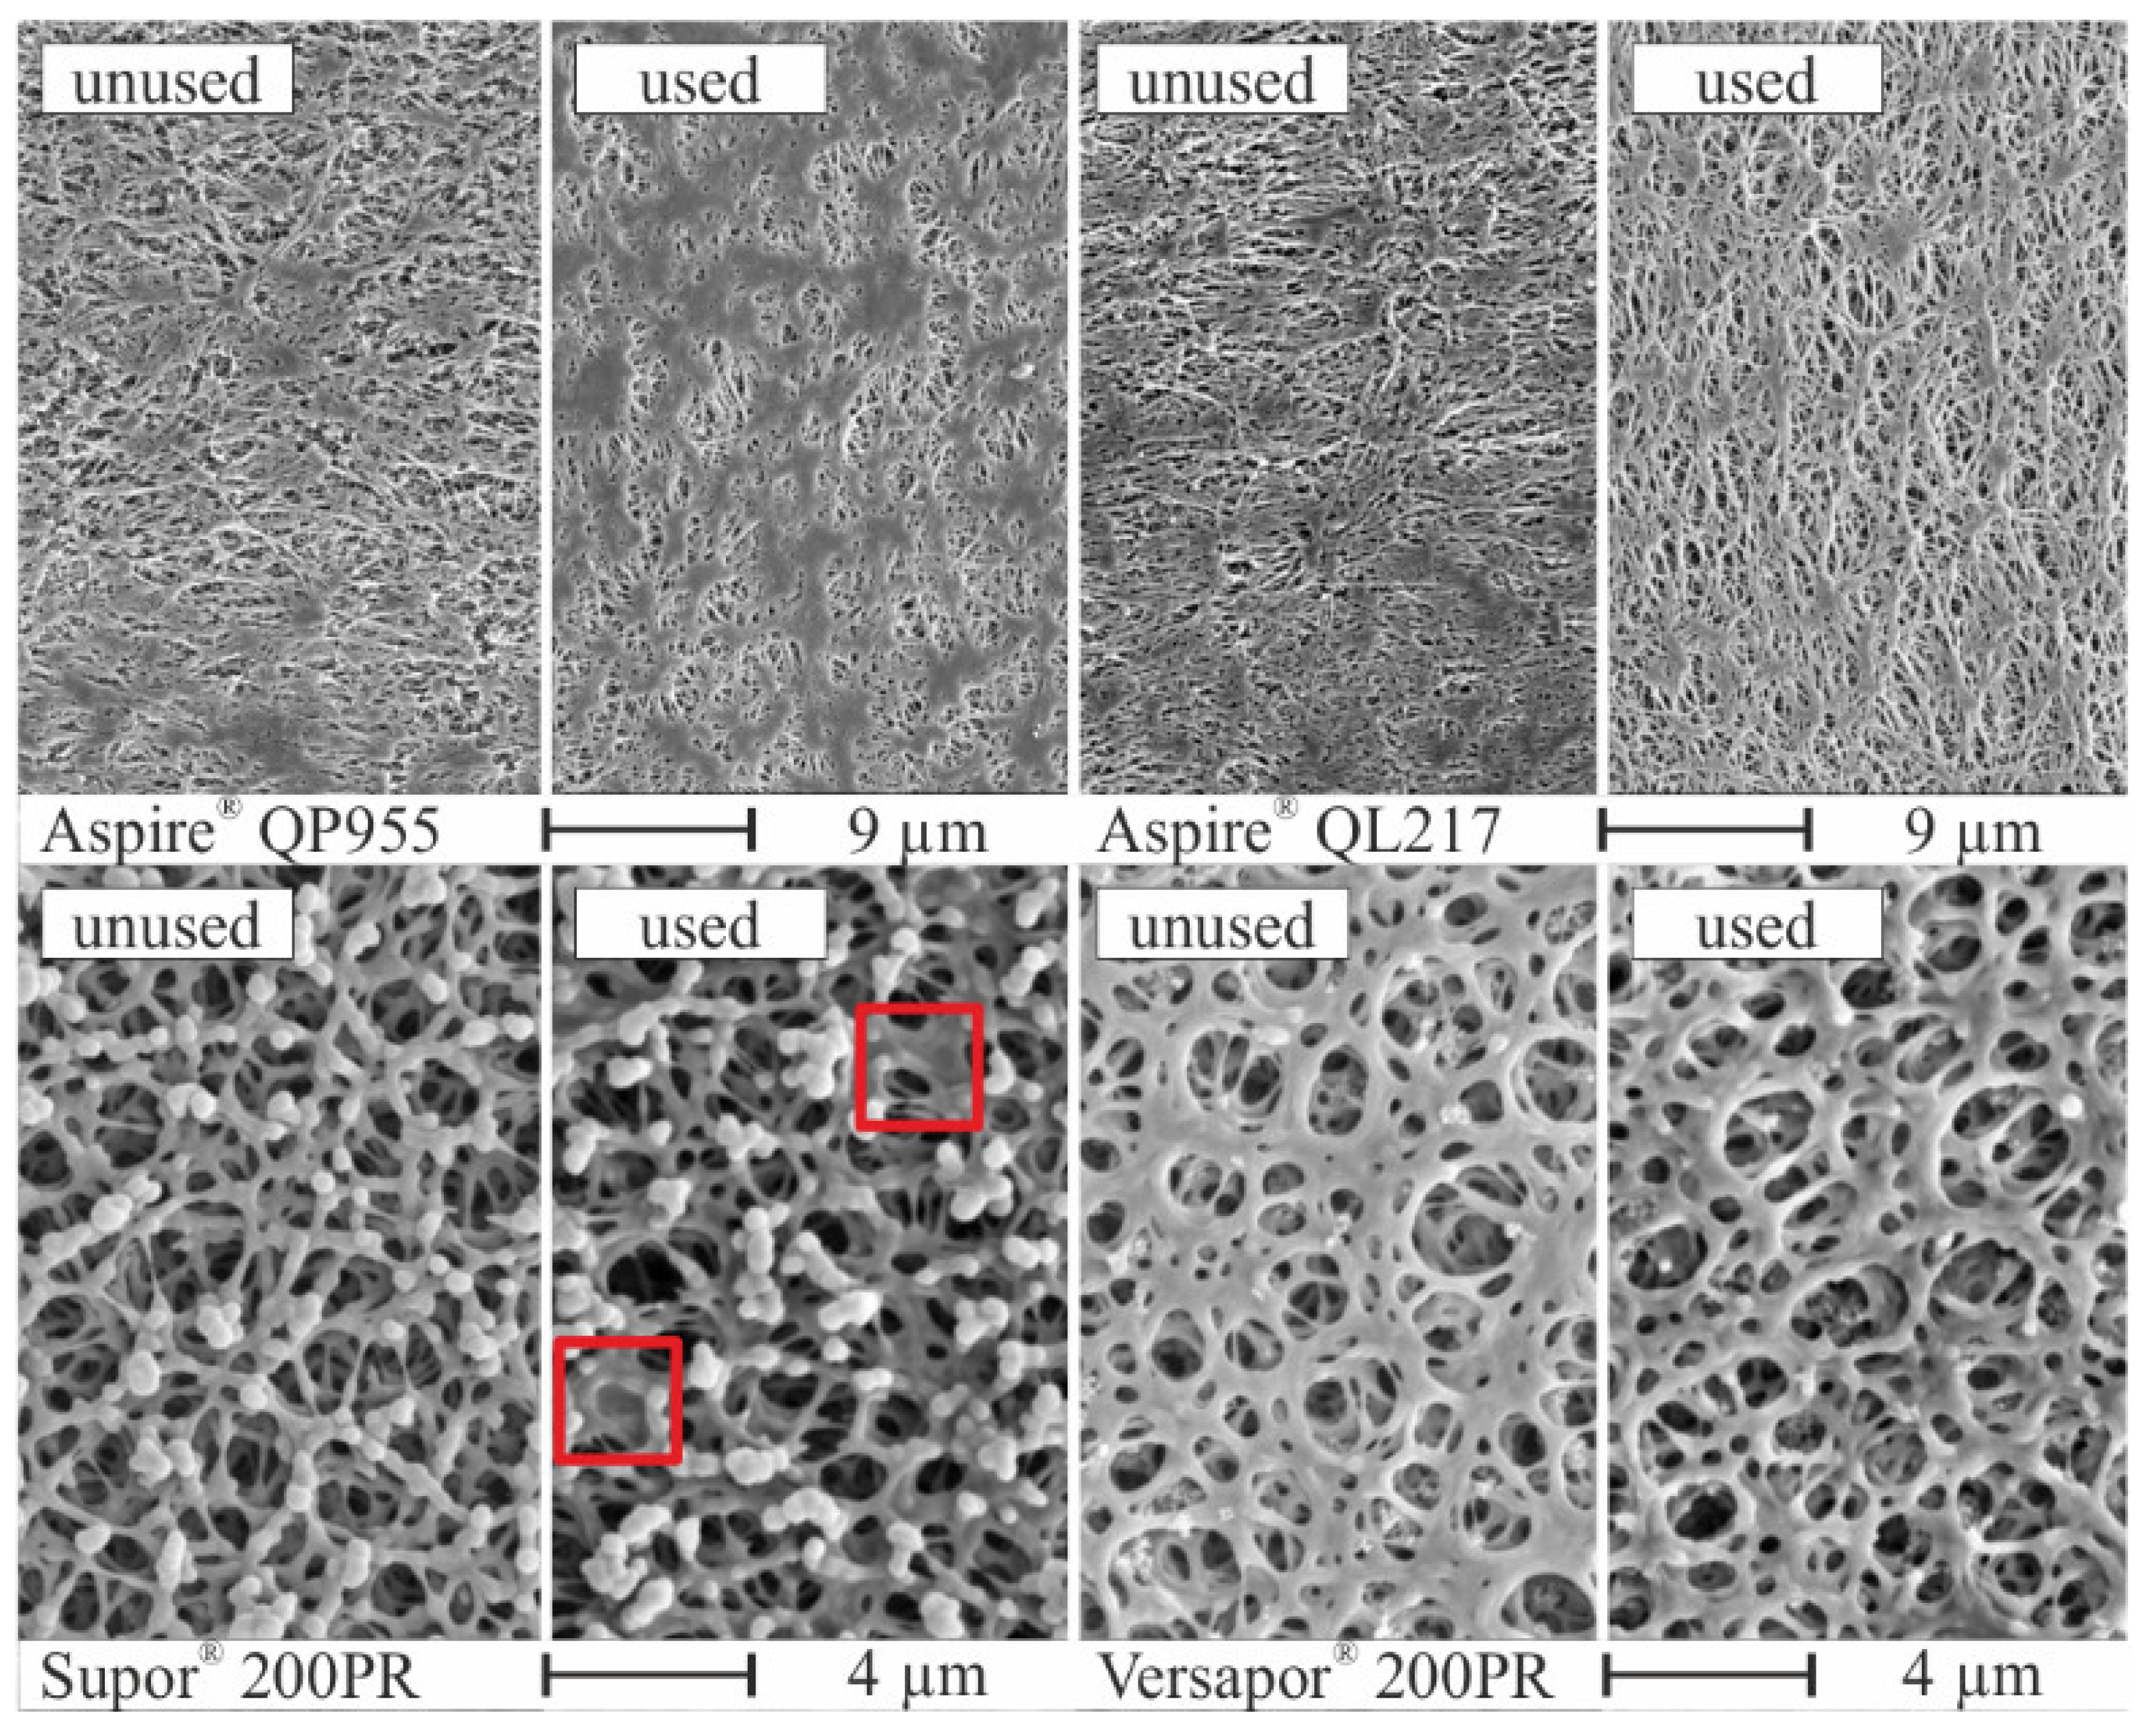
After the experiments, the membrane surfaces of all used membranes were investigated by SEM and compared with the unused ones, as shown in Figure 11. For the PTFE-based membranes Aspire® QP955 and Aspire® QP217, no significant changes on the membrane surface could be observed. The Supor® 200PR membrane instead showed an irreversible closing effect of the pores by chemical or thermal bonding of the membrane material (red squares). In the case of the porous membrane Versapor® 200PR, an increase in surface porosity by visually larger pore diameter was noticed.
During short term tests using Supor® 200PR and Versapor® 200PR membranes, the detected changes of the surface structure did not affect the separation performance. Nevertheless, it was concluded that the acrylic copolymer-based membrane (Versapor 200PR) was degraded at the top of the surface by the water-methanol mixture. For the observed surface behaviour of the polyethersulfon-based membrane (Supor® 200PR), additional investigations are needed.
The comparison of the gas permeability under single and two-phase flow conditions in Table 5 showed that the gas permeability of the pure gas (Section 4.1) was significantly higher than with two-phase flow conditions. It is assumed that this result is in general due to the not fully utilised membrane area during the separation process.
However, the liquid part of the two-phase flow partially reduced the active membrane area at slug, transient, and corner flow state. In general, the membrane was covered by the liquid slugs at slug flow conditions, whereas at under liquid corner flow conditions, i.e., at high feed gas volumetric flows, only the edges were covered by the liquid. In addition, a proportion of the pores can be physically blocked by the liquid. A detailed investigation of the utilised membrane area can be found in Section 4.3 “Active Membrane Area”.
For all CO2 gas feed volume flows, the Aspire® QL217 from CLARCOR Industrial Air, followed by the Supor 200PR from Pall delivered the best separation performance and gas permeability values for 20 °C and 40 °C.
4.3.2. Liquid Loss of Water/Methanol
Knowledge about liquid loss of water and methanol by evaporation and diffusion in a porous membrane-based micro contactor operating as a closed or open breather for a µDMFC with LOC design is an important evaluation criterion. Through a multi-variant calibration, all species in the sweep gas outlet leaving the micro contactor could be determined. Thus, the real amount of liquid loss during the separation process was measurable.
In order to exclude condensation in the sweep gas channel and piping, a higher sweep gas volume flow was set. Hereby, the proportion of liquid loss by diffusion was higher than at lower sweep gas volume flows, as shown in Figure 12, for a porous membrane-based micro contactor without TPF.
Furthermore, the liquid loss of water was larger than the liquid loss of methanol. For the liquid loss of methanol, a proportional behaviour to the methanol concentration was observed. Simultaneously, increased liquid loss of water was detected due to a higher vapour pressure of the water-methanol mixture. In addition, a slight contribution to the liquid loss by a decreasing surface tension and viscosity is assumed.
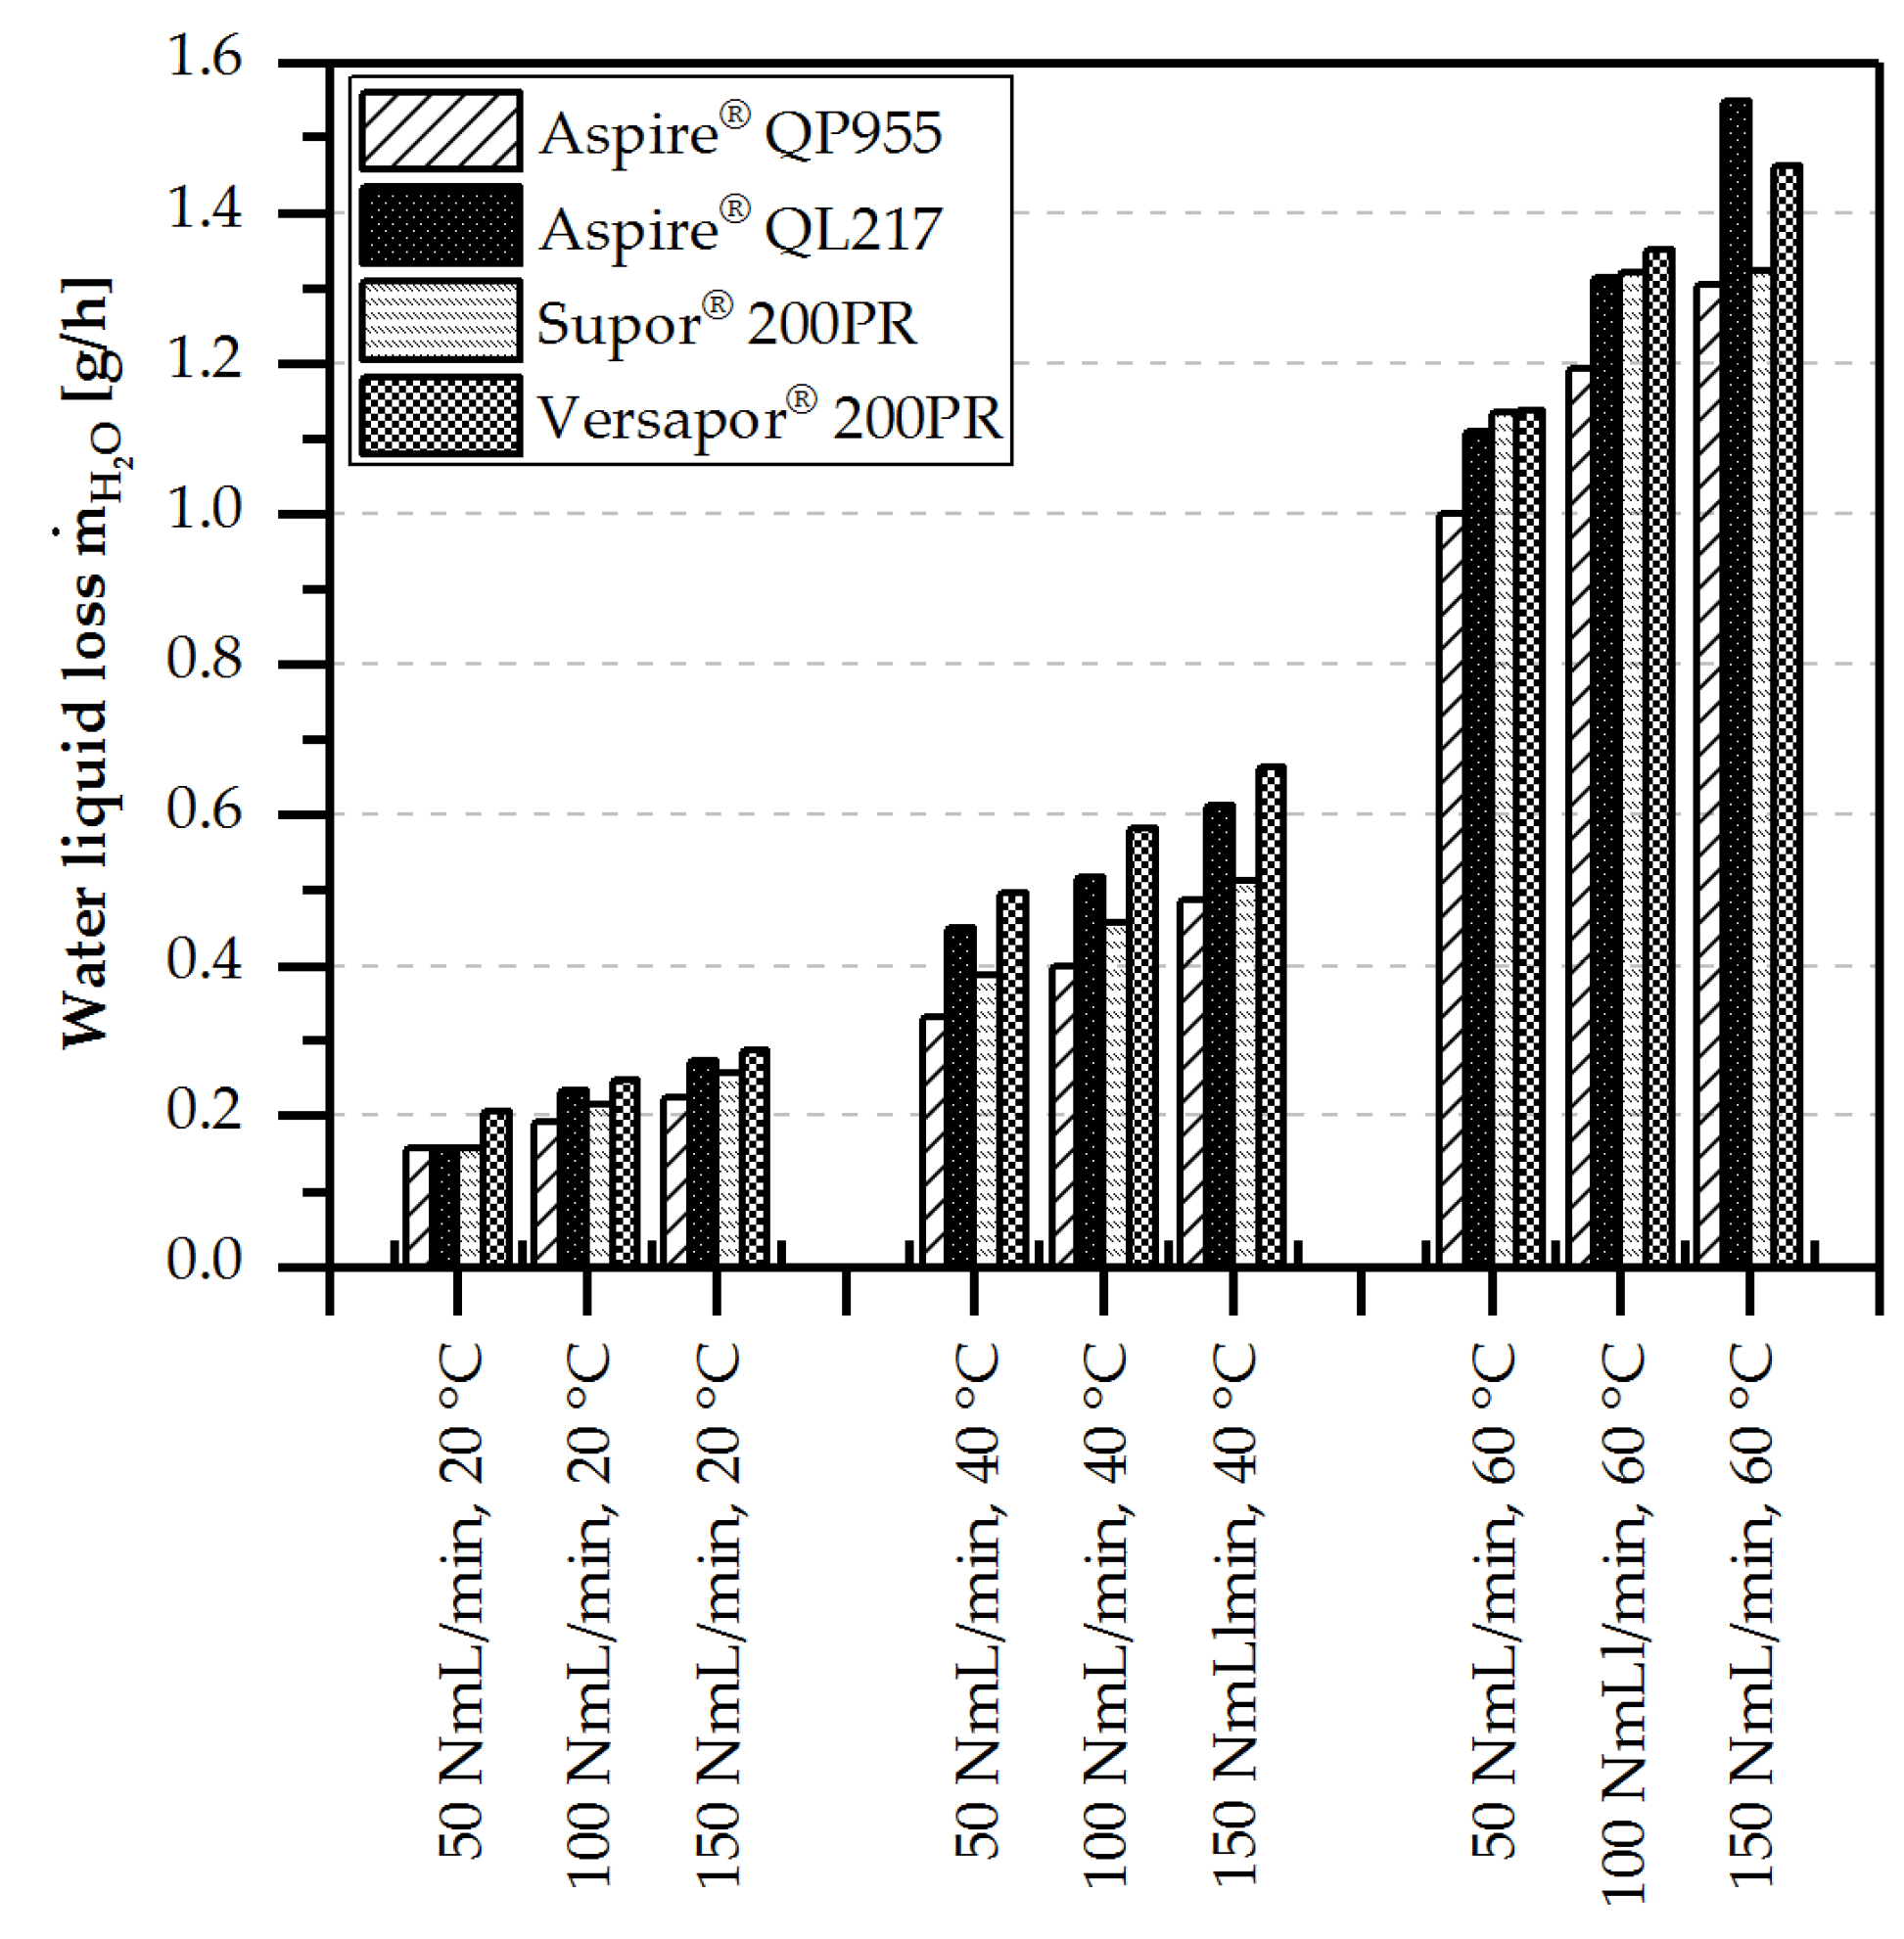
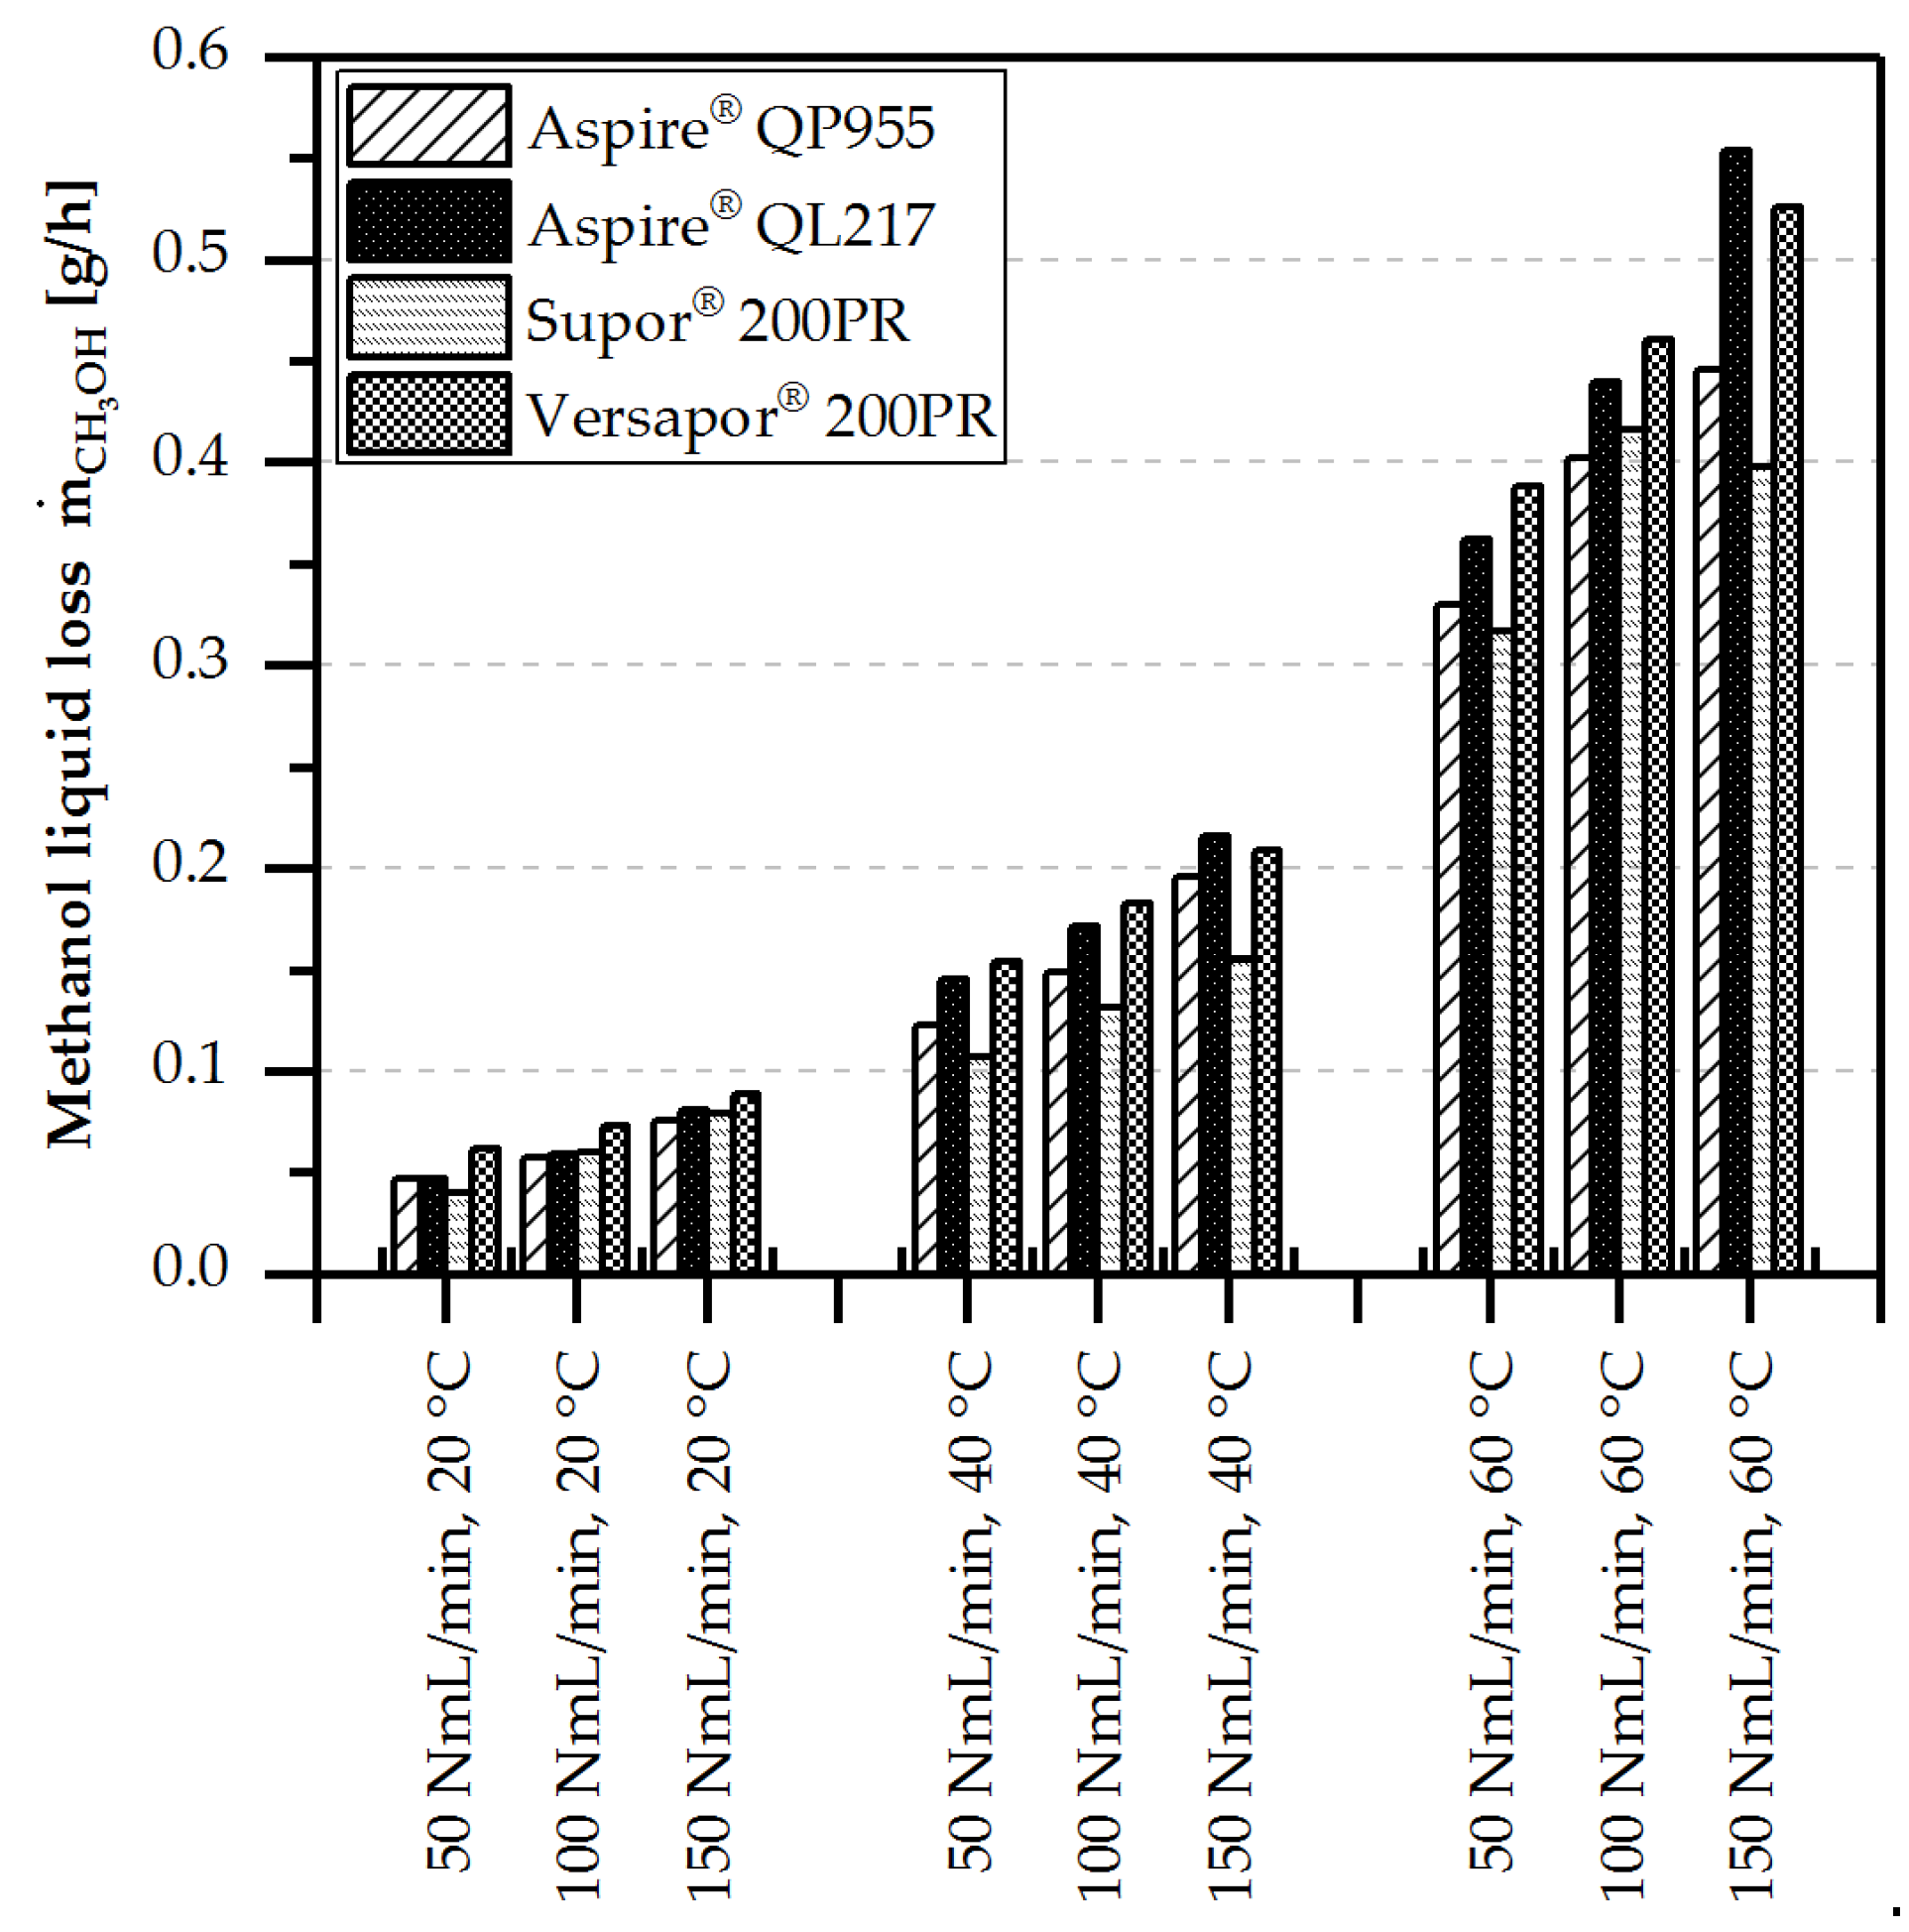
In direct comparison, the liquid loss by diffusion was significantly higher than the liquid loss through feed gas saturation by evaporation. Furthermore, it can be clearly seen in Figure 13 and Figure 14 that the liquid loss of water and methanol increased with rising temperatures and feed gas volume flows. Additionally, the impact of increasing volume flows was lower than the increasing temperatures on the liquid loss of water and methanol.
The Aspire® QP955 and Supor® 200PR had the lowest liquid loss for water and methanol over the whole tested range compared to the other porous membranes. In the case of the Aspire® QP955 membrane, the smaller pore diameter () was probably responsible for this behaviour, whereas for the Supor® 200PR, the surface structure of the membrane was responsible. The highest liquid losses of water and methanol were detected for the Aspire® QL217 und Versapor® 200PR.
Based on the presented results, it can be concluded that the liquid loss due to the diffusion was the largest in a closed breather with additional sweep gas. The liquid loss in a closed or open breather without sweep gas is mainly caused by gas saturation through evaporation.
4.3.3. Orientation Independence
The portability of a porous membrane-based micro contactor for the gas/liquid phase separation depends primarily on the orientation independent working principle. Theoretically, as mentioned in Section 2 “Theoretical Background”, a calculated Confinement number of = 3.5 and the Etövos number of should be sufficient for an orientation-independent gas/liquid phase separation. For the calculation of Co and Eo, a micro channel filled with water + air, a height of 0.5 mm, and a width of 1.7 mm was assumed.
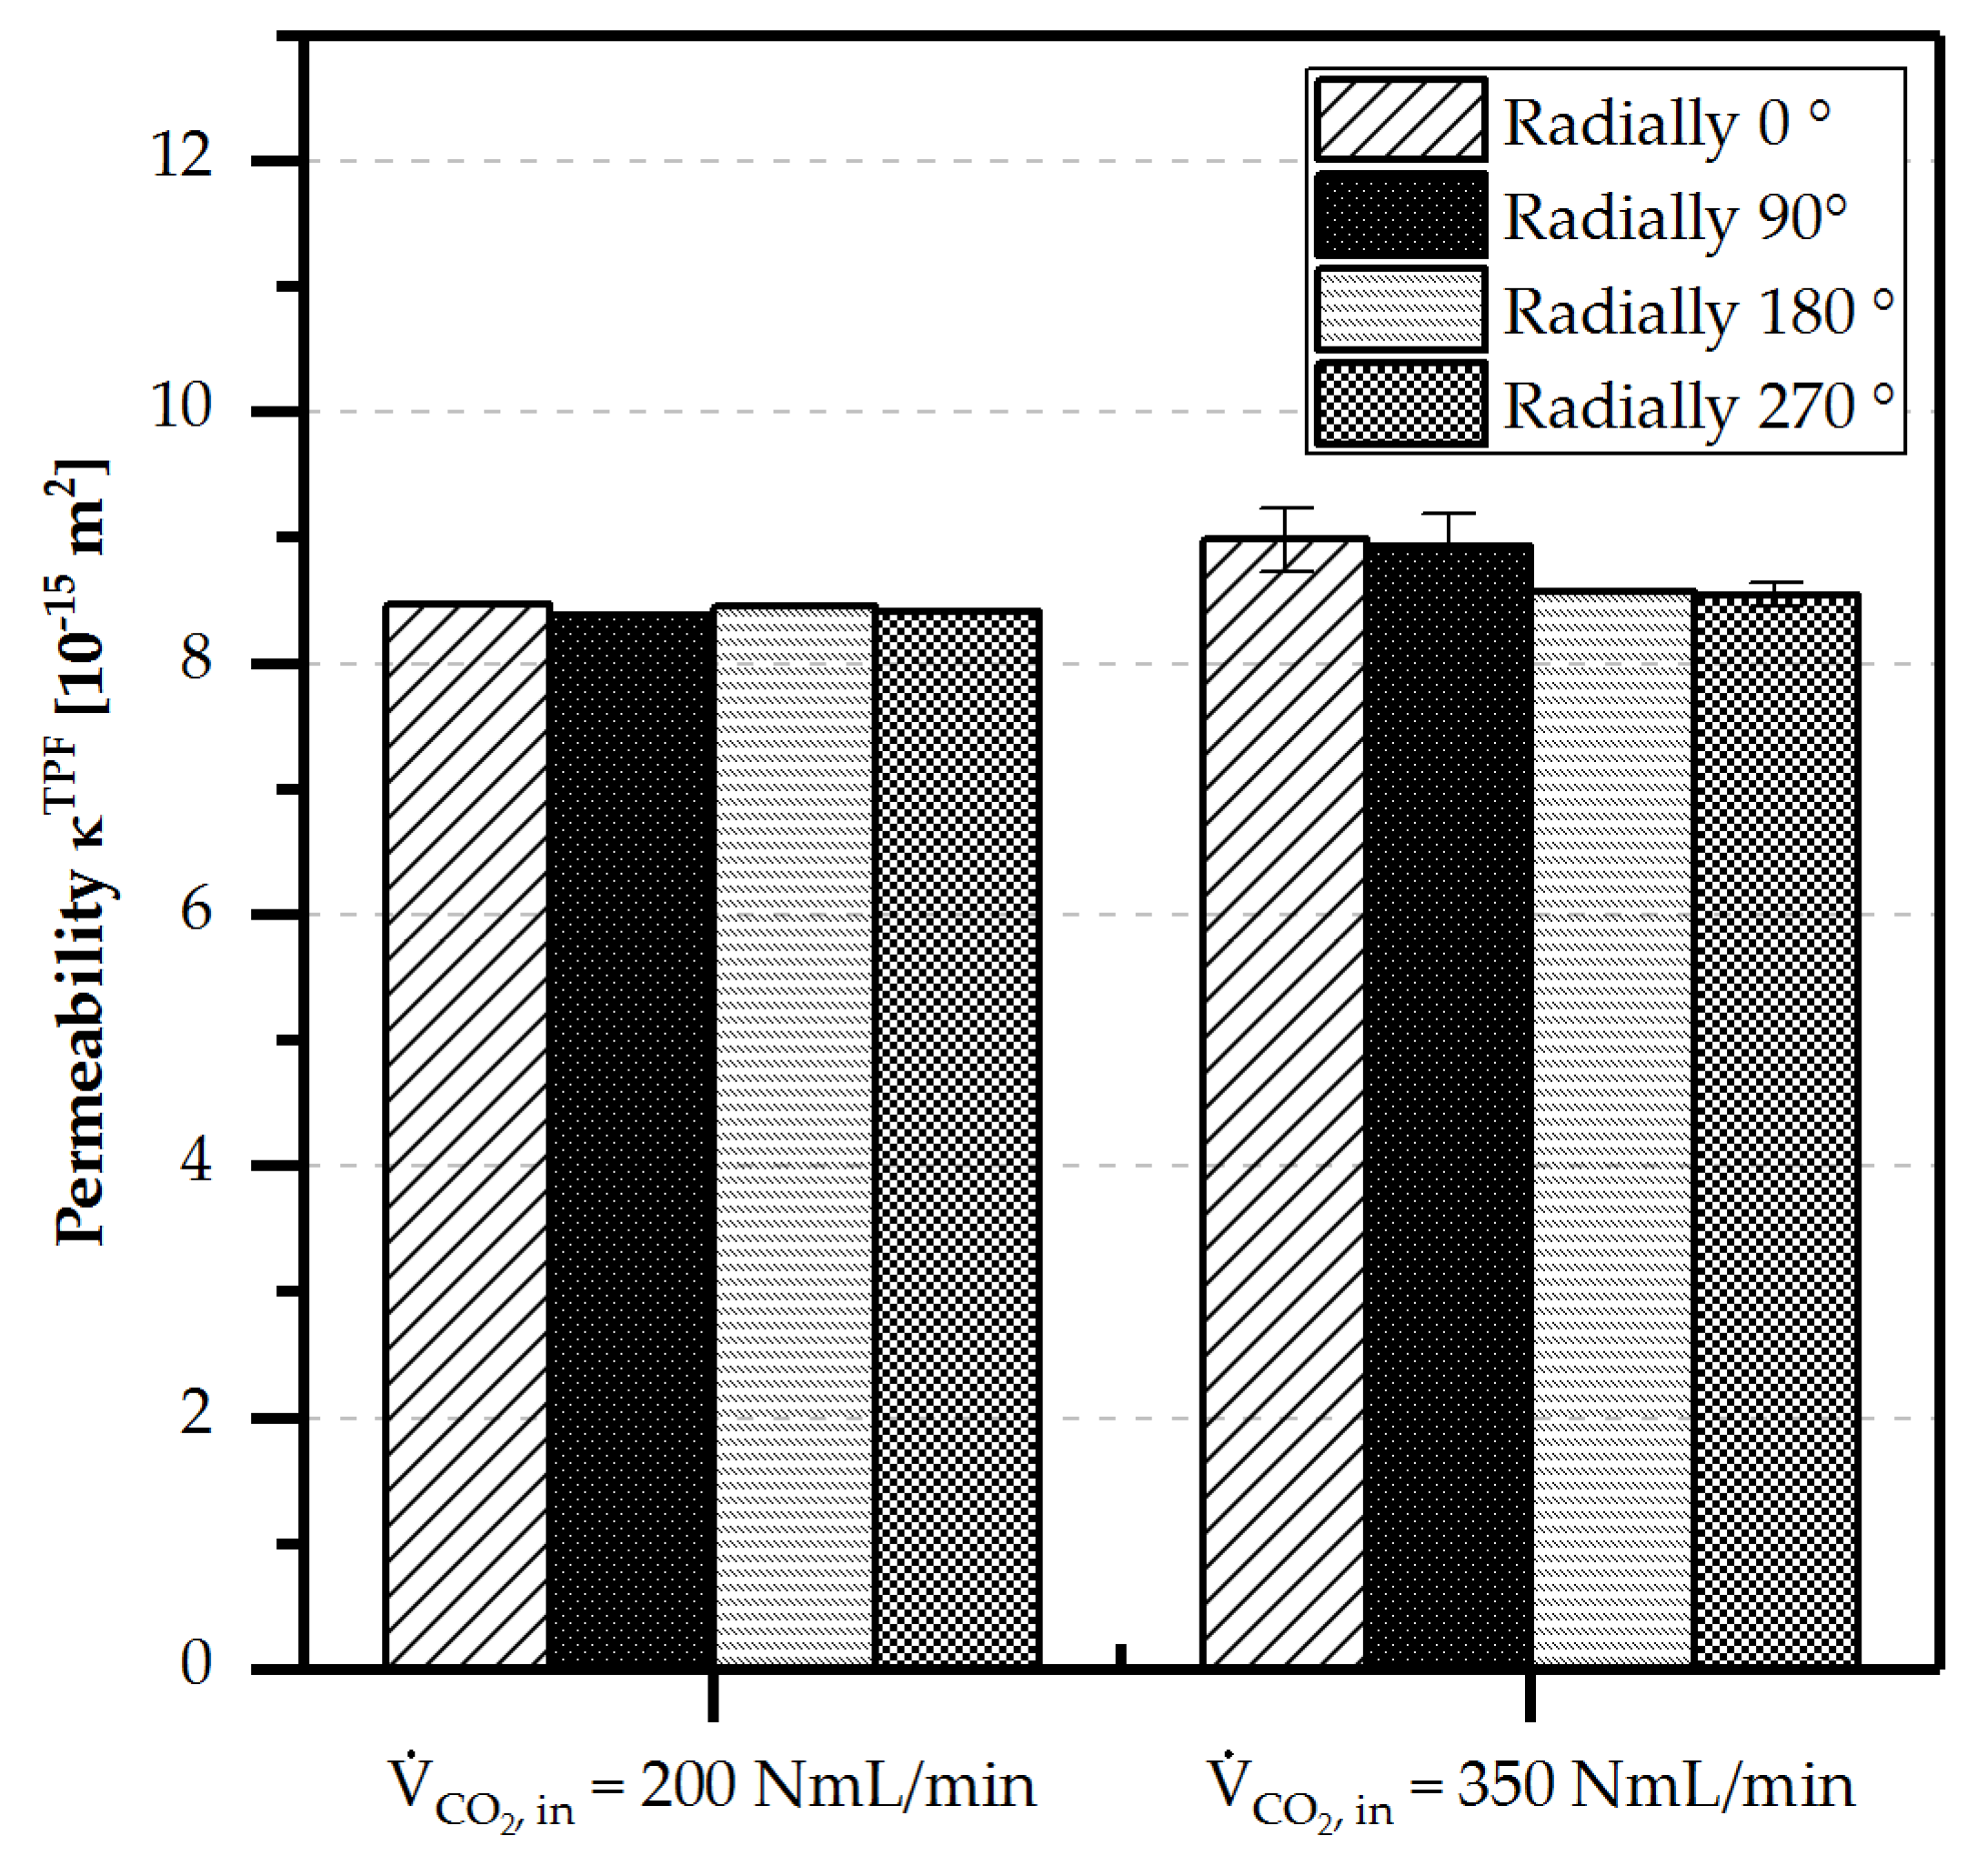
Nevertheless, different orientations, as shown in Figure 15, were tested for all membranes at complete separation state ( or .) and incomplete separation state () were tested, to confirm the orientation independent gas/liquid phase separation. As an example, the result for the Aspire® QL217 is shown in Figure 15. With a feed gas volume flow rate of and , a and was detected, respectively.
The orientations had only a minimal influence on the separation performance—less than 3%—for a feed gas volume flow rate of . For a feed gas volume flow rate of , an influence of less than 5% was observed. Identical results were also obtained for the other membranes. Based on the results shown above, an orientation independent separation performance can be assumed.
4.4. Active Membrane Area
When two-phase flow is present in the feed channel of the micro contactor module, a fraction of the overall available membrane is covered with liquid, and can therefore not be used for gas separation. Only the gas-covered part of the membrane, defined as active membrane area, contributes to the separation process. The active membrane area, calculated using Equation (9) and from Table 4, grows with increasing feed gas flux.
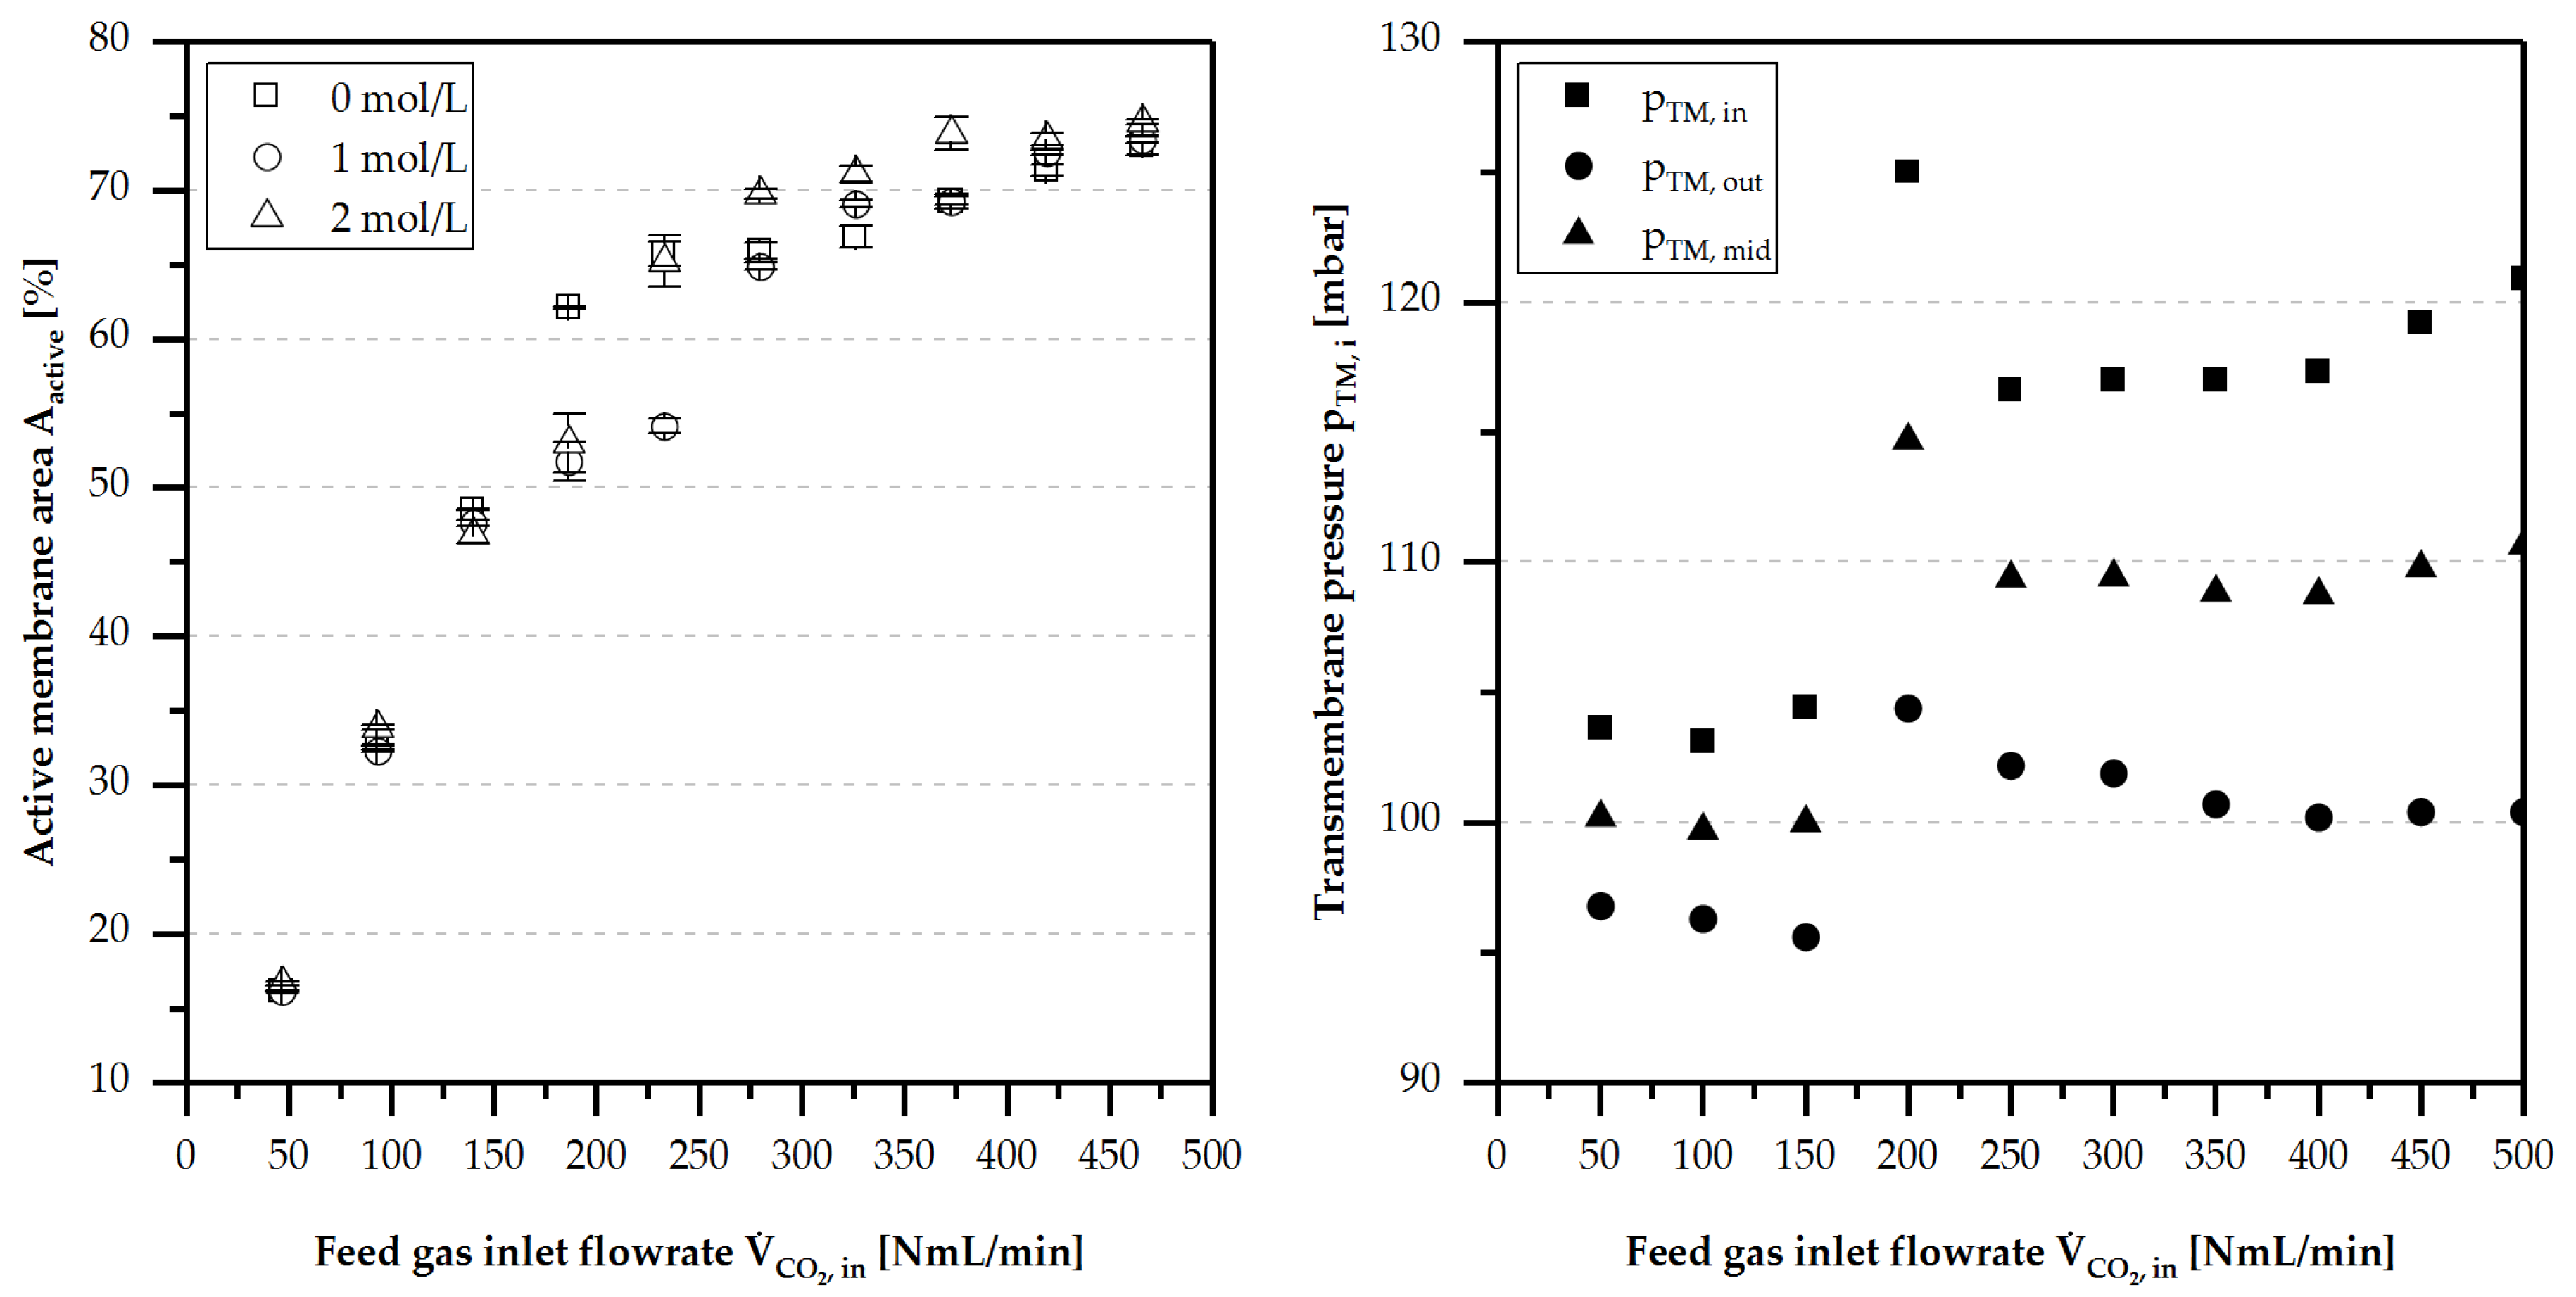
In Figure 16, this phenomenon is shown for the membrane Aspire® QL217 and for different feed liquid methanol concentrations. At a state of complete gas separation ( or .), the active membrane area increased linearly with increasing flow rate of the feed gas. When the feed gas flux exceeded the separation capability of the membrane (), the calculated values for the active membrane area shows exponentially-decreasing behaviour.
In addition, an increased feed gas flux led to a higher pressure gradient, and subsequently, to a higher gas permeation flux. At the same time, the gas/liquid ratio in the feed channel and the mean velocity increased. Through this, the residence time of the liquid on the membrane was reduced by pushing the liquid out of the feed channel more rapidly, resulting in a decreased membrane area blocked by liquid.
The high discontinuity of the measurement results at 200–300 NmL/min was caused by the instability of the separation at the point where the separation first became incomplete and insignificant amounts of gas could leave the feed channel outlet. At this point, pressure increased abruptly because of the additional pressure loss caused by the gas pushing the liquid in the line out, leaving the feed channel. This effect was dynamic, and pressure fluctuation could also be high at this point. The separation stabilised when more feed gas was used.
The concentration of methanol in the feed liquid flow—in the range of 0–2 —had no direct influence on the available membrane area or the active membrane area during the separation process.
5. Conclusions
In general, the applicability of porous membranes as a separation layer under µDMFC working conditions (physically and chemically) was confirmed. Due to the high capillary pressure in the small pores, the permeation of liquid was prevented, while gas could be transported via the pores of the membrane across the membrane by applying a pressure gradient. In addition, the diffusion flow via these membranes is substantial, and should not be neglected if the separation exceeds the capability of the available membrane area and a high sweep gas flux is used.
In the investigated separation module, the pressure in the gas bubble or phase, which is strongly dependent on the channel size, was negligible compared to the pressure gradient required for an efficient gas separation process. Furthermore, the capillary pressure was always overlain by the pressure drop caused by the active transport of fluids through the narrow channel. Through this observation, it can be concluded that the gas separation solely driven by the capillary pressure in the gas phase located in the channel cannot be realised in a compact and active driven µDMFC.
To increase the capillary pressure in the gas bubble or gas phase, the channel size has to be reduced by an order of 10–20. However, by reducing the channel size, the pressure drop due to the smaller channel would increase dramatically. A parallel arrangement of smaller channels instead of a single channel could be helpful to normalise the pressure drop again, but the distributions of two-phase into the smaller channels is not homogenous enough and less controllable. As a result, uncontrollable short-circuit flows of unseparated gas can occur.
Furthermore, the gas separation was found to follow Darcy’s law describing the separated gas amount as proportional to the pressure gradient over the membrane. To obtain complete phase separation under some of the investigated conditions, it was observed that for an effective gas separation, a transmembrane pressure of at least 100 mbar was necessary. In addition, it is known that the low bubble pressure, i.e., the capillary pressure of the gas phase or bubble within the micro channel, amounts to a single digit mbar value, so that the driving force has to be a sufficiently high transmembrane pressure. With an area of 114.5 mm2, all membranes were capable of separating at least 100 NmL/min CO2 under µDMFC working conditions using a pressure gradient of 100 mbar. This is sufficient for a typical 20 W DMFC producing 93 NmL/min CO2 gas at a considered efficiency of 41% [35].
The diffusion of the liquid species and the amount of sweep gas also affected the diffusion of feed gas into the sweep channel and vice versa. The diffusion process was also dependent on the convective gas flow through the membrane, and thereby, was dependent on the applied pressure gradient. At high pressure gradients, diffusion rates of feed and sweep gas were found to be insignificant. It was observed that the convective flux is predominant at an empirically-determined, critical transmembrane pressure gradient of 100 mbar, suppressing the diffusion flow of the sweep gas completely.
Finally, alternatives to polymer-based membranes should be investigated to overcome negative properties such as swelling or chemical resistance against methanol. At present, metallic microsieves coated with hydrophobic layers are considered as a potential substitute, and are being studied at the Institute of Micro Process Engineering. With respect to the separation system and its integration in a µDMFC, further research is still required. Different channel geometries and channel coatings could provide a better liquid/gas distribution during the separation, and could increase the active membrane area for the gas separation. Finally, using a prototype µDMFC to create the two-phase-flow feed stream to accurately replicate the conditions that would be expected in a complete integrated system, could improve the separation process under transient working conditions.
Supplementary Materials
The following are available online at https://www.mdpi.com/2305-7084/2/4/55/s1.
Author Contributions
Conceptualisation, K.M.D.; methodology, K.M.D.; formal analysis, K.M.D. and V.W.; investigation, V.W. and K.M.D.; resources, KIT; data curation, V.W. and K.M.D., writing—original draft preparation, K.M.D.; writing—review and editing, K.H.-S.; visualisation, K.M. and V.W.; supervision, R.D.; project administration, K.M.D. and K.H.-S.; funding acquisition, K.H.-S. and R.D.
Funding
This work was funded and supported by the BMWi and AiF through IGF-Project 18741 N.
Acknowledgments
The authors acknowledge support of this work by staff of the Institute for Micro Process Engineering at Karlsruhe Institute of Technology. We also thank “Clarcor Industrial Air” and “Pall Corporation” for the graciously provided porous membranes.
Conflicts of Interest
The authors declare no conflict of interest.
Nomenclature
| Latin Symbols | |
| A | area (m2) |
| Co | confinement number (-) |
| d | diameter (m) |
| D | diffusion coefficient (m2 s−1) |
| dh | hydraulic dimeter (m) |
| Eö | Eötvös number (-) |
| f | multiplication factor (-) |
| g | standard gravity (9.981 kg m s−2) |
| h | height (m) |
| H | mean curvature (m−1) |
| k | curvature of sphere (m−1) |
| solubility coefficient (mol L−1 atm−1) | |
| K | Parameter (-) |
| kb | Boltzmann constant (1.38 10−23 J K−1) |
| Kn | Knudsen number (-) |
| l | thickness (m) |
| m | mass (kg) |
| M | molar mass (kg mol−1) |
| molar flux (mol s−1) | |
| p | pressure (Pa) |
| r | radius (m) |
| R | radius of channel geometry (m) |
| separation performance (-) | |
| T | temperature (K) |
| U | perimeter (m) |
| V | volume (m3) |
| volume flux (m3 s−1) | |
| Vm | molar volume (m3 mol−1) |
| v | diffusion volume (-) |
| w | width (-) |
| x/y | molar fraction (-) |
| X | solubility constant (-) |
| Y | molar loading (-) |
| Subscripts | |
| active | active |
| air | air |
| backer | backer material |
| cap | capillary |
| coll. | collision |
| crit | critical |
| CH3OH | methanol |
| CO2 | carbon dioxide |
| diff | diffusive |
| feed | feed |
| gas | gas |
| H2O | water |
| in | in |
| inlet | inlet |
| Kn | Knudsen |
| liq | liquid |
| lg | liquid-gas-interface |
| mem | membrane |
| mol | molecular |
| nw | non-wetted |
| out | out |
| p | pores |
| perm | permeate |
| sg | solid-gas-interface |
| sl | solid-liquid-interface |
| sol | dissolved |
| sweep | sweep |
| tm | trans membrane |
| TPF | two-phase-flow |
| w | wetted |
| t,b,l,r | top, bottom, left, right |
| Greek symbols | |
| β | mass transfer coefficient (m s−1) |
| η | dynamic viscosity (Pa s) |
| ϑ | temperature (°C) |
| κ | permeability (m2) |
| λ | mean free path length (m) |
| ρ | density (kg m−3) |
| σ | surface tension (N m−1) |
| collision diameter (m) | |
| φ | contact angle (°) |
| Δ | gradient (-) |
| ω | mass fraction (-) |
| Abbreviations | |
| µDMFC | micro-direct methanol fuel cell |
| DIK | Deutsches Institut für Kautschuktechnologie |
| FTIR | Fourier-transform infrared |
| IMVT | Institute for Micro Process Engineering |
| KIT | Karlsruhe Institute of Technology |
| LOC | lab on a chip |
| PMMA | polymethylmethacrylate |
| PP | polypropylene |
| PTFE | polytetrafluoroethylene |
| SEM | scanning electron microscope |
| separation performance | |
| TPF | two-phase flow |
| ZBT | Zentrum für Brennstoffzellentechnik |
References
- Schaevitz, S.B. Powering the wireless world with MEMS. Proc. SPIE 2012, 8248, 1–15. [Google Scholar] [CrossRef]
- Krewer, U. Portable Energiesysteme: Von elektrochemischer Wandlung bis Energy Harvesting. Chem. Ing. Tech. 2011, 83, 1974–1983. [Google Scholar] [CrossRef]
- Rummich, E. Energiespeicher. Elektrotech. Inftech. 2013, 130, 143–144. [Google Scholar] [CrossRef] [Green Version]
- Li, X.; Faghri, A. Review and advances of direct methanol fuel cells (DMFCs) part I: Design, fabrication, and testing with high concentration methanol solutions. J. Power Sources 2013, 226, 223–240. [Google Scholar] [CrossRef]
- Novosolution. Freezing Points of Methanol/Water Solutions. Available online: http://novosolution.ca/images/Freezing-Points-Methanol.pdf (accessed on 20 February 2018).
- Paust, N.; Krumbholz, S.; Munt, S.; Müller, C.; Koltay, P.; Zengerle, R.; Ziegler, C. Self-regulating passive fuel supply for small direct methanol fuel cells operating in all orientations. J. Power Sources 2009, 192, 442–450. [Google Scholar] [CrossRef]
- Zenith, F.; Krewer, U. Modelling, dynamics and control of a portable DMFC system. J. Process Control 2010, 20, 630–642. [Google Scholar] [CrossRef]
- Zenith, F.; Weinzierl, C.; Krewer, U. Model-based analysis of the feasibility envelope for autonomous operation of a portable direct methanol fuel-cell system. Chem. Eng. Sci. 2010, 65, 4411–4419. [Google Scholar] [CrossRef]
- Meng, D.D.; Kim, J.; Kim, C.-J. A distributed gas breather for micro direct methanol fuel cell (μ-DMFC). In Proceedings of the Sixteenth Annual International Conference on Micro Electro Mechanical Systems, Kyoto, Japan, 23 January 2003. [Google Scholar] [CrossRef]
- Lee, S.-W.; Wong, S.-C. Design and fabrication of multidirectional microbubble separator. Proc. SPIE 2005, 5718, 194–199. [Google Scholar] [CrossRef]
- Amon, C.H.; Yao, S.-C.; Tang, X.; Hsieh, C.-C.; Alyousef, Y.; Vladimer, M.; Fedder, G.K. Micro-electro-mechanical systems (MEMS)-based micro-scale direct methanol fuel cell development. Energy 2006, 31, 636–649. [Google Scholar] [CrossRef]
- Alexander, B.R.; Wang, E.N. Design of a Microbreather for Two-Phase Microchannel Heat Sinks. Nanoscale Microscale Thermophys. Eng. 2009, 13, 151–164. [Google Scholar] [CrossRef]
- Kraus, M.; Krewer, U. Experimental analysis of the separation efficiency of an orientation independent gas/liquid membrane separator. Sep. Purif. Technol. 2011, 81, 347–356. [Google Scholar] [CrossRef]
- Meng, D.D.; Kim, J.; Kim, C.-J. A degassing plate with hydrophobic bubble capture and distributed venting for microfluidic devices. J. Micromech. Microeng. 2006, 16, 419–424. [Google Scholar] [CrossRef]
- Meng, D.D.; Cubaud, T.; Ho, C.-M.; Kim, C.-J. A Methanol-Tolerant Gas-Venting Microchannel for a Microdirect Methanol Fuel Cell. J. Microelectromech. Syst. 2007, 16, 1403–1410. [Google Scholar] [CrossRef]
- Meng, D.D.; Kim, C.J. An active micro-direct methanol fuel cell with self-circulation of fuel and built-in removal of CO2 bubbles. J. Power Sources 2009, 194, 445–450. [Google Scholar] [CrossRef]
- Xu, J.; Vaillant, R.; Attinger, D. Use of a porous membrane for gas bubble removal in microfluidic channels: Physical mechanisms and design criteria. Microfluid. Nanofluid. 2010, 9, 765–772. [Google Scholar] [CrossRef]
- David, M.P.; Steinbrenner, J.E.; Miler, J.; Goodson, K.E. Adiabatic and diabatic two-phase venting flow in a microchannel. Int. J. Multiph. Flow 2011, 37, 1135–1146. [Google Scholar] [CrossRef]
- Fazeli, A.; Moghaddam, S. Microscale phase separator for selective extraction of CO2 from methanol solution flow. J. Power Sources 2014, 271, 160–166. [Google Scholar] [CrossRef]
- Diversified Enterprises. Surface Energy Data for PTFE. 2018. Available online: https://www.accudynetest.com/polymer_surface_data/ptfe.pdf (accessed on 20 February 2018).
- Huh, D.; Kuo, C.-H.; Grotberg, J.B.; Takayama, S. Gas-liquid two-phase flow patterns in rectangular polymeric microchannels: Effect of surface wetting properties. New J. Phys. 2009, 11, 75034. [Google Scholar] [CrossRef] [PubMed]
- Serizawa, A.; Feng, Z.; Kawara, Z. Two-phase flow in microchannels. Exp. Therm. Fluid Sci. 2002, 26, 703–714. [Google Scholar] [CrossRef]
- Suo, M. Two-Phase Flow in Capillary Tubes. Ph.D. Thesis, Massachusetts Institute of Technology, Cabridge, MA, USA, 1960. [Google Scholar]
- Brauner, N.; Maron, D.M. Identification of the range of ‘small diameters’ conduits, regarding two-phase flow pattern transitions. Int. Commun. Heat Mass Transf. 1992, 19, 29–39. [Google Scholar] [CrossRef]
- Cussler, E.L. Diffusion. Mass Transfer in Fluid Systems, 3rd ed.; Cambridge University Press: Cambridge, UK, 2011. [Google Scholar]
- Fuller, E.N.; Giddings, J.C. A Comparison of Methods for Predicting Gaseous Diffusion Coefficients. J. Chromatogr. Sci. 1965, 3, 222–227. [Google Scholar] [CrossRef]
- Weiss, R.F. Carbon dioxide in water and seawater: The solubility of a non-ideal gas. Mar. Chem. 1974, 2, 203–215. [Google Scholar] [CrossRef]
- Schüler, N.; Hecht, K.; Kraut, M.; Dittmeyer, R. On the Solubility of Carbon Dioxide in Binary Water–Methanol Mixtures. J. Chem. Eng. Data 2012, 57, 2304–2308. [Google Scholar] [CrossRef]
- Diversified Enterprises. Surface Energy Data for PMMA. 2018. Available online: https://www.accudynetest.com/polymer_surface_data/pmma_polymethylmethacrylate.pdf (accessed on 20 February 2018).
- Clarcor Industrial Air. Data Sheet aspire® ePTFE Membrane Laminate; Aspire® QP955; Clarcor Industrial Air: Overland Park, KS, USA, 2014. [Google Scholar]
- Clarcor Industrial Air. Data Sheet aspire® ePTFE Membrane Laminate; Aspire® QL217; Clarcor Industrial Air: Overland Park, KS, USA, 2014. [Google Scholar]
- Pall Corporaton. Data Sheet Supor® R Membrane. Supor 200PR. 2009. Available online: http://www.pall.de/pdfs/misc/IMGSRMEN.pdf (accessed on 20 February 2018).
- Pall Corporaton. Data Sheet Versapor® R Membrane. Versapor 200PR. 2010. Available online: http://www.pall.de/pdfs/misc/IMGVRMEN.pdf (accessed on 20 February 2018).
- Jennings, S.G. The mean free path in air. J. Aerosol Sci. 1988, 19, 159–166. [Google Scholar] [CrossRef]
- Rashidi, R.; Dincer, I.; Naterer, G.F.; Berg, P. Performance evaluation of direct methanol fuel cells for portable applications. J. Power Sources 2009, 187, 509–516. [Google Scholar] [CrossRef]
Figure 1.
Capillary Pressure for water at 20 °C, , dependent on channel geometry, surface properties, and material combination. Rectangular I (wall contact angle: 60°, width: 1 mm, height: 0.5 mm) without a hydrophobic membrane on the top of the micro channel. Rectangular II (wall contact angle: 60°, width: 1 mm, height: 0.5 mm) with hydrophobic membrane made of PTFE (contact angle: 120° [20]) on the top of the micro channel. Round Capillary I (wall contact angle: 60°, diameter: 1 mm). Round Capillary II (wall contact angle: 60°, diameter: 0.5 mm).

Figure 2.
Cross and longitudinal section of the separation process.

Figure 3.
Theoretical trend according to a maximum separable gas feed amount of , , and calculated by Darcy’s law with , , , , and .
Figure 3.
Theoretical trend according to a maximum separable gas feed amount of , , and calculated by Darcy’s law with , , , , and .

Figure 4.
Mass balance model of the separation process.

Figure 5.
Exploded-view of the membrane based micro contactor with integrated T-junction for two-phase flow generation.
Figure 5.
Exploded-view of the membrane based micro contactor with integrated T-junction for two-phase flow generation.

Figure 6.
Scheme of the experimental setup.

Figure 7.
Transmembrane pressure at different for all membranes at and calculated average permeabilities for all membranes at .
Figure 7.
Transmembrane pressure at different for all membranes at and calculated average permeabilities for all membranes at .

Figure 8.
Measured sweep gas loss through a Aspire® QL217 membrane for different sweep gas flows at and .
Figure 8.
Measured sweep gas loss through a Aspire® QL217 membrane for different sweep gas flows at and .

Figure 9.
Degree of condensation of the evaporated and diffusively transported liquid species at within the sweep gas channel on the supporting material, observed for different operating times. Illustrated pictures are for following operating times 0 s, 150 s, 300 s, and 600 s using , , and .
Figure 9.
Degree of condensation of the evaporated and diffusively transported liquid species at within the sweep gas channel on the supporting material, observed for different operating times. Illustrated pictures are for following operating times 0 s, 150 s, 300 s, and 600 s using , , and .

Figure 10.
Comparison of the separation performance for different at , , and (, , and .

Figure 11.
Images of the membrane surface by scanning electron microscopy after usage as separation layer for all experimental investigations.
Figure 11.
Images of the membrane surface by scanning electron microscopy after usage as separation layer for all experimental investigations.

Figure 12.
Diffusive liquid loss for water and methanol under single phase flow conditions (liquid) of the porous membrane depending on the sweep gas volume flow for Aspire® QL217 at 20 °C and .
Figure 12.
Diffusive liquid loss for water and methanol under single phase flow conditions (liquid) of the porous membrane depending on the sweep gas volume flow for Aspire® QL217 at 20 °C and .

Figure 13.
Overall liquid loss for water and for all porous membrane under two-phase flow conditions for different feed inlet temperatures ( and feed gas volume flows .
Figure 13.
Overall liquid loss for water and for all porous membrane under two-phase flow conditions for different feed inlet temperatures ( and feed gas volume flows .

Figure 14.
Overall liquid loss for methanol and for all porous membrane under two-phase flow conditions for different feed inlet temperatures ( and feed gas volume flows .
Figure 14.
Overall liquid loss for methanol and for all porous membrane under two-phase flow conditions for different feed inlet temperatures ( and feed gas volume flows .

Figure 15.
Orientation independence tests for Aspire® QL217 (, , , and ).

Figure 16.
Active membrane area (calculated with Equation (9)) of membrane QL 217 at , , , and for different methanol concentrations and different (left image). Development of the transmembrane pressure gradient with increasing (right image).
Figure 16.
Active membrane area (calculated with Equation (9)) of membrane QL 217 at , , , and for different methanol concentrations and different (left image). Development of the transmembrane pressure gradient with increasing (right image).


Table 1.
Examples of previous works on the gas/liquid separation in microstructured devices using polymeric membranes or inorganic microsieves as a separation layer.
Table 1.
Examples of previous works on the gas/liquid separation in microstructured devices using polymeric membranes or inorganic microsieves as a separation layer.
| Investigator | Research Topic | Membrane | Material | Fluids | Mode |
|---|---|---|---|---|---|
| Meng et al. [9] | Distributed Breather | Microsieve | Silicon | CO2 (g)/H2O (l) | P |
| Lee et al. [10] | Micro Bubble Separator | Microsieve | Silicon | CO2 (g)/H2O (l) | P |
| Amon et al. [11] | Micro-electro-mechanical based µDMFC | Microsieve | Silicon | CO2/H2O + CH3OH (l) | P |
| Alexander et al. [12] | Micro-breather (heat sink) | Microsieve | Silicon | H2O (g)/H2O (l) | P |
| Kraus et al. [13] | Orientation indipendent microseparator | Membrane | PTFE | CO2 (g)/H2O (l) | A |
| Meng et al. [14,15,16] | Membrane based micro separator in a µDMFC | Membrane | PTFE|PP | CO2 (g)/H2O + CH3OH (l) | A |
| Xu et al. [17] | Active gas/liquid phase separation | Membrane | ACP | N2 (g)/H2O (l) | A |
| David et al. [18] | Micro heat exchanger and microgas separator | Membrane | PTFE | Air (g)/H2O (l) | A |
| Fazeli et al. [19] | Differential pressure on the gas/liquid separation | Membrane | PTFE | CO2 (g)/H2O + CH3OH (l) | A |
PTFE: Polytetrafluoroethylene; PP: Polypropylene; ACP: Acrylic Copolymer; P: Passive; A: Active.
Table 2.
Data summary of the polymer based porous hydrophobic membranes. Data extracted from the data sheet provided by Clarcor Air for Aspire® QP955 and Aspire® QL217 and by Pall for Supor® 200PR and Versapor®. Contact angle of water determined by contact angle measurements at lab conditions against air with a measuring accuracy of ±2.5°.
| Hydrophobic Membranes | Functional Layer Material | Support Material | Thick-Ness | Pore Size | Contact Angle | Water Entry Pressure |
|---|---|---|---|---|---|---|
| Aspire® QP955 [30] | PTFE | Polyester | 200 µm | 100 nm | 120° | ≥4.5 bar |
| Aspire® QL217 [31] | PTFE | Polypropylen | 200 µm | 200 nm | 120° | ≥1.0 bar |
| Supor® 200PR [32] | Polyethersulfon | Polyester | 170 µm | 200 nm | 138° | ≥1.38 bar |
| Versapor® 200PR [33] | Acrylic Copolymer | Nylon | 230 µm | 200 nm | 120° | ≥1.79 bar |
Table 3.
Summary of the experimental parameter for each evaluation criteria.
| Evaluation Criteria | ||||||
|---|---|---|---|---|---|---|
| Separation Performance | 1 | 5 | 50 … 400 | 200 | 20, 40, 60 | 100 |
| Liquid Loss | 0, 1, 2 | 5 | 50 … 400 | 200 | 20, 40, 60 | 100 |
| Orientation Independence | 1 | 5 | 200, 350 | 200 | 40 | 100 |
Table 4.
Gas permeability values for single phase conditions.
| Membrane | |
|---|---|
| Aspire® QL217 | 9.3 |
| Aspire® QP955 | 14.0 |
| Versapor® 200PR | 10.3 |
| Supor® 200PR | 7.9 |
Table 5.
Comparison of the gas permeability under single and two-phase flow conditions.
| Membrane | ||||
|---|---|---|---|---|
| Aspire® QP955 | 9.3 | 7.2 | 0.77 | 88.7 |
| Aspire® QL217 | 14.0 | 10.6 | 0.76 | 86.7 |
| Supor® 200PR | 10.3 | 9.0 | 0.87 | 100.0 |
| Versapor® 200PR | 9.1 | 7.7 | 0.85 | 96.9 |
© 2018 by the authors. Licensee MDPI, Basel, Switzerland. This article is an open access article distributed under the terms and conditions of the Creative Commons Attribution (CC BY) license (http://creativecommons.org/licenses/by/4.0/).
Share and Cite
MDPI and ACS Style
Dyrda, K.M.; Wilke, V.; Haas-Santo, K.; Dittmeyer, R. Experimental Investigation of the Gas/Liquid Phase Separation Using a Membrane-Based Micro Contactor. ChemEngineering 2018, 2, 55. https://doi.org/10.3390/chemengineering2040055
AMA Style
Dyrda KM, Wilke V, Haas-Santo K, Dittmeyer R. Experimental Investigation of the Gas/Liquid Phase Separation Using a Membrane-Based Micro Contactor. ChemEngineering. 2018; 2(4):55. https://doi.org/10.3390/chemengineering2040055
Chicago/Turabian StyleDyrda, Kay Marcel, Vincent Wilke, Katja Haas-Santo, and Roland Dittmeyer. 2018. "Experimental Investigation of the Gas/Liquid Phase Separation Using a Membrane-Based Micro Contactor" ChemEngineering 2, no. 4: 55. https://doi.org/10.3390/chemengineering2040055