Article

Dry Reforming in a Milli-Scale Reactor Driven by Simulated Sunlight

1
School of Chemical, Biological, and Environmental Engineering, Oregon State University, Corvallis, OR 97331, USA
2
Chemical Engineering Department, Faculty of Engineering, King Mongkut’s University of Technology, North Bangkok, 1518 Pracharaj 1 Road, Bangsue, Bangkok 10800, Thailand
3
Department of Mechanical Engineering, Baylor University, Waco, TX 76798, USA
*
Author to whom correspondence should be addressed.
ChemEngineering 2018, 2(4), 50; https://doi.org/10.3390/chemengineering2040050
Submission received: 31 August 2018 / Revised: 23 September 2018 / Accepted: 11 October 2018 / Published: 18 October 2018

Abstract

:
In this study, a directly irradiated, milli-scale chemical reactor with a simple nickel catalyst was designed for dry reforming of methane for syngas. A milli-scale reactor was used to facilitate rapid heating, which is conducive to combating thermal transience caused by intermittent solar energy, as well as reducing startup times. Milli-scale reactors also allow for a distributed and modular process to produce chemicals on a more local scale. In this setup, the catalyst involved in the reaction is located directly in the focal area of the solar simulator, resulting in rapid heating. The effects of mean residence time and temperature on conversion and energy efficiency were tested. The process, which is intended to store thermal energy as chemical enthalpy, achieved 10% thermal-to-chemical energy conversion efficiency at a mean residence time of 0.028 s, temperature of 1000 °C, and molar feed ratio of 1:1 CO2:CH4. A significant portion of the thermal energy input into the reactor was directed toward sensible heating of the feed gas. Thus, this technology has potential to achieve solar-to-chemical efficiency with the integration of recuperative heat exchange.

1. Introduction

Development of a practical, long-term energy storage may be the greatest roadblock to utilization of renewable, yet intermittent energy sources, like wind and solar, in the industrial and transportation sectors. In order to foster a sustainable and robust energy future, it is important to develop an efficient method to convert solar energy into liquid fuels or higher value chemicals. Dry reforming of methane (DRM, Equation (1)) is not only a highly endothermic reaction that can store solar thermal energy, but it is a method to reform natural gas into CO and H2 (syngas) for use in various industrial processes such as Fischer-Tropsch synthesis—a process that can be used to synthesize long-chain hydrocarbons such as diesel, gasoline, or jet fuel from syngas [1,2,3]. Syngas can also be burned directly as higher heating value fuel gas. Either way, DRM has potential to upgrade the calorific value of the chemical constituents up to 30% [1]. If the DRM reaction is driven by non-fossil-based energy, this would translate to a 30% reduction in fossil carbon emissions from transportation and industries that consume syngas-derived products.
CO2 + CH4 ⇌ 2H2 + 2CO, ΔH298K = 247 kJ/mol
In recent years, much effort has been put into the development of catalysts for dry reforming of methane [1,3,4,5,6]. Nickel- and noble metal-based catalysts are commonly used and have demonstrated good catalytic properties for the DRM reaction [1,7].
Different sources can be used to supply energy to the reaction: electrical energy [8], thermal energy from combustion [9,10,11,12,13], or thermal energy from solar concentration such as parabolic dishes or heliostat fields [14,15,16]. Solar energy is a desirable energy input because it is clean and sustainable compared to other energy sources. In recent years, solar energy has been applied to methane reforming reactions [14,17,18,19,20,21,22]; however, dry reforming has not been performed in a miniaturized solar reactor (or a reactor driven by simulated solar energy).
One of the first reports of solar-driven dry reforming is reported in the work of Diver et al. [22]. This work details the use of a heat pipe system integrated with a solar furnace to run the dry reforming reaction. This system combined solar energy and electric heat to achieve the desired temperature. Although not purely solar-driven, it is one of the early introductions of integrating solar energy into the dry reforming reaction.
Another version of an early solar-driven dry reforming reactor is from the work of Anikeev et al. [21]. This system also uses a solar furnace system, and it can reach 650 °C to 850 °C using only solar energy. This reactor design is similar to that used in the work presented here, however, Anikeev et al. [21] use a greater mass loading of catalyst and a larger receiver area.
Michalsky et al. demonstrated DRM using a perovskite membrane reactor [20]. In this scheme, the CO2 and CH4 flow on different sides of the membrane. One advantage of this concept is the inherent separation of products; however, the rate of syngas production is limited by the mass loading of perovskite in the reactor, which makes heat distribution using solar energy difficult.
A solar-driven reactor for non-catalytic reformation is implemented by Klein et al. [19]. Carbon black particles entrained in the reactor feed gas at a C:CO2 ratio of 0.5:100 improve heat transfer and provide a surface for the reaction to proceed. However, high temperatures—up to 1450 °C—are needed to improve the rate of reaction as no metal catalyst is present. The authors also note that methane tends to decompose readily in their system at temperatures lower than necessary for reformation.
A study by Yu et al. [18] also utilizes actual sunlight to produce syngas. The authors devise a packed bed reactor with nickel catalyst to facilitate the reaction. Their study shows that with 6 L/min total flow rate, a 19.7% energy conversion efficiency is achieved. They also note that significant energy loss to the environment restricts their system performance.
A recent effort out of the Pacific Northwest National Laboratory (PNNL) using a microreactor mounted in a solar parabolic dish reached 69% energy efficiency in steam reforming of methane, which corresponds to a 20% calorific upgrade [14,15,16]. This illustrates the potential of combination solar thermal energy and microscale technologies to achieve effective heat and mass transfer.
The motivation of solar-driven dry reforming is to upgrade the energy content of the feed stream using clean energy. Here, a milli-scale reactor was designed, fabricated, and tested to study the effect of mean residence time, temperature and CO2:CH4 feed ratio under simulated sunlight. The miniature nature of the reactor was motivated by the inherent advantage of the microscale: a larger surface-area-to-volume ratio, which enables greater heat and mass transfer. This work contributes to the understanding of energy efficiency, conversion, and heat transfer in future solar-driven microreactors.

2. Materials and Methods

2.1. Catalyst Preparation

An 80 wt % Ni content porous pellet was synthesized to serve as the catalyst. The high Ni content served two purposes: (1) it allowed the pellet to form a sintered, cohesive structure once calcined; and (2) by being highly reactive, it limited the amount of inert mass which consumed thermal energy from the solar simulator. A quantity of 2 g nickel powder (325 mesh, 99.9% pure) was mixed with 3% graphite (325 mesh, 99% pure) and 20% Al2O3 powder (50–200 μm, Brockmann I), crushed and pressed into a 13 mm die. The pellet, which came out of the die, was approximately 13 mm in diameter and 5 mm thick. This pellet was calcined in a muffle furnace in air at 1000 °C for 5 h where it was oxidized into nickel oxide. Graphite was oxidized away to create pores. SEM-EDX mapping showed uniform distribution of all species (see Figure 1). When the pellet was put in the focal zone of the reactor, 5% H2 in balance Ar was used to activate the catalyst at 600 °C. Activation was assumed complete when the H2 level had recovered to a steady value and the H2O signal had reduced to its background level as indicated by the QGA mass spectrometer. This duration was typically around 10–15 min.

2.2. Reactor Design

The reactor design is shown in Figure 2. The main body was made up of stainless steel SS 316. An inner porous ceramic insulation (Buster M-15, Zircar Zirconia, Florida, NY, USA) was added inside the reactor to reduce heat loss and provide the passage of the gas to the outlet. This insulation layer allowed for SS 316 body to be used, as the temperature of the metal was far from its melting point. In fact, the silicone o-rings did not melt and remained intact. The transparent window on top of the reactor allowed radiation to enter. Two silicone o-rings were placed above and below the window to seal the reactor. The insulating layer mentioned above also helps to keep the seal cool. A top stainless steel plate was bolted to the body to compress the o-rings and seal the reactor. A cavity for the catalyst pellet was created in the inner insulation directly above the inlet tube and directly below the window, where concentrated solar energy was focused. The gas flow proceeds upward through the inner ceramic tube, and through the porous catalyst pellet before reversing direction through the porous insulation and annular space between the metal body and the inner ceramic tube. A concession of this design is that there is the possibility of gas bypassing the catalyst pellet. The heating of the pellet occurs via direct radiation through the window, while the gas is heated via passing through the hot pellet.

2.3. Solar Simulator and Thermal Test

The experimental setup is displayed in Figure 3. The high flux solar simulator consists of a single 6.5 kW Xenon arc lamp (Osram XBO 6 kW HS XL OFR, Osram, Munich, Germany) and a truncated ellipsoidal reflector. The apparatus has a water-cooled flux mask with 1 × 1 cm square opening indicated by the red circle in Figure 2. Light passes through the opening and is delivered to the receiver located underneath the mask. More information about the solar simulator design and flux calibration procedure can be found in the work by L’Estrange et al. [23].
In situ temperature measurements were impractical during reactive testing as a result of the small dimensions, so a preliminary test of the thermal behavior of the milli-scale reactor was performed. A K-type thermocouple was placed into the reactive zone of the reactor, under the transparent window. The reactor was placed in the focal area underneath the mask. Temperature was obtained under representative gas flow (0.7 slpm) of inert at different power levels of the solar simulator. Based on this thermal test, the reaction temperature at 50%, 60%, and 70% lamp power level were approximated to be 900 °C, 1000 °C, and 1100 °C, respectively, shown in Figure 4. The thermal test result was used as a reference for reactive testing. Reaction temperatures were kept above 800 °C to reduce carbon deposition [3].
Figure 5 shows a preliminary test of the transient thermal behavior of the milli-scale solar reactor. Temperatures were measured, as a function of time, after turning on the solar simulator at 100% lamp power level and showed a fast heating rate approximately 1020 K/min.

2.4. Experimental Apparatus and Design

The test loop of solar thermal dry reforming system is shown in Figure 6. The apparatus consists of the solar simulator, reactor, gas systems including mass flow controllers (Alicat, Tucson, AZ, USA), and a HIDEN HPR-20 Residual Gas Analyzer Mass Spectrometer (RGA, Warrington, UK) with a Faraday detector. Ar, CO2, CH4 (with purities 99.999%), and H2 mixture (5.000% H2 in Ar) were used in the reaction. At each reaction temperature (900 °C, 1000 °C, and 1100 °C), the CO2, CH4 and Ar ratio (3:3:1, 2:4:1, 4:2:1) and mean residence time (0.280 s, 0.0560 s, 0.0280 s, 0.019 s, 0.014 s) were studied. Effluent gases were passed through a heat exchanger/condenser cooled using process cooling water (ca. 10 °C). At no point were any liquids observed. The effluent gas compositions were continuously flowed and monitored by the RGA.

3. Results and Discussion

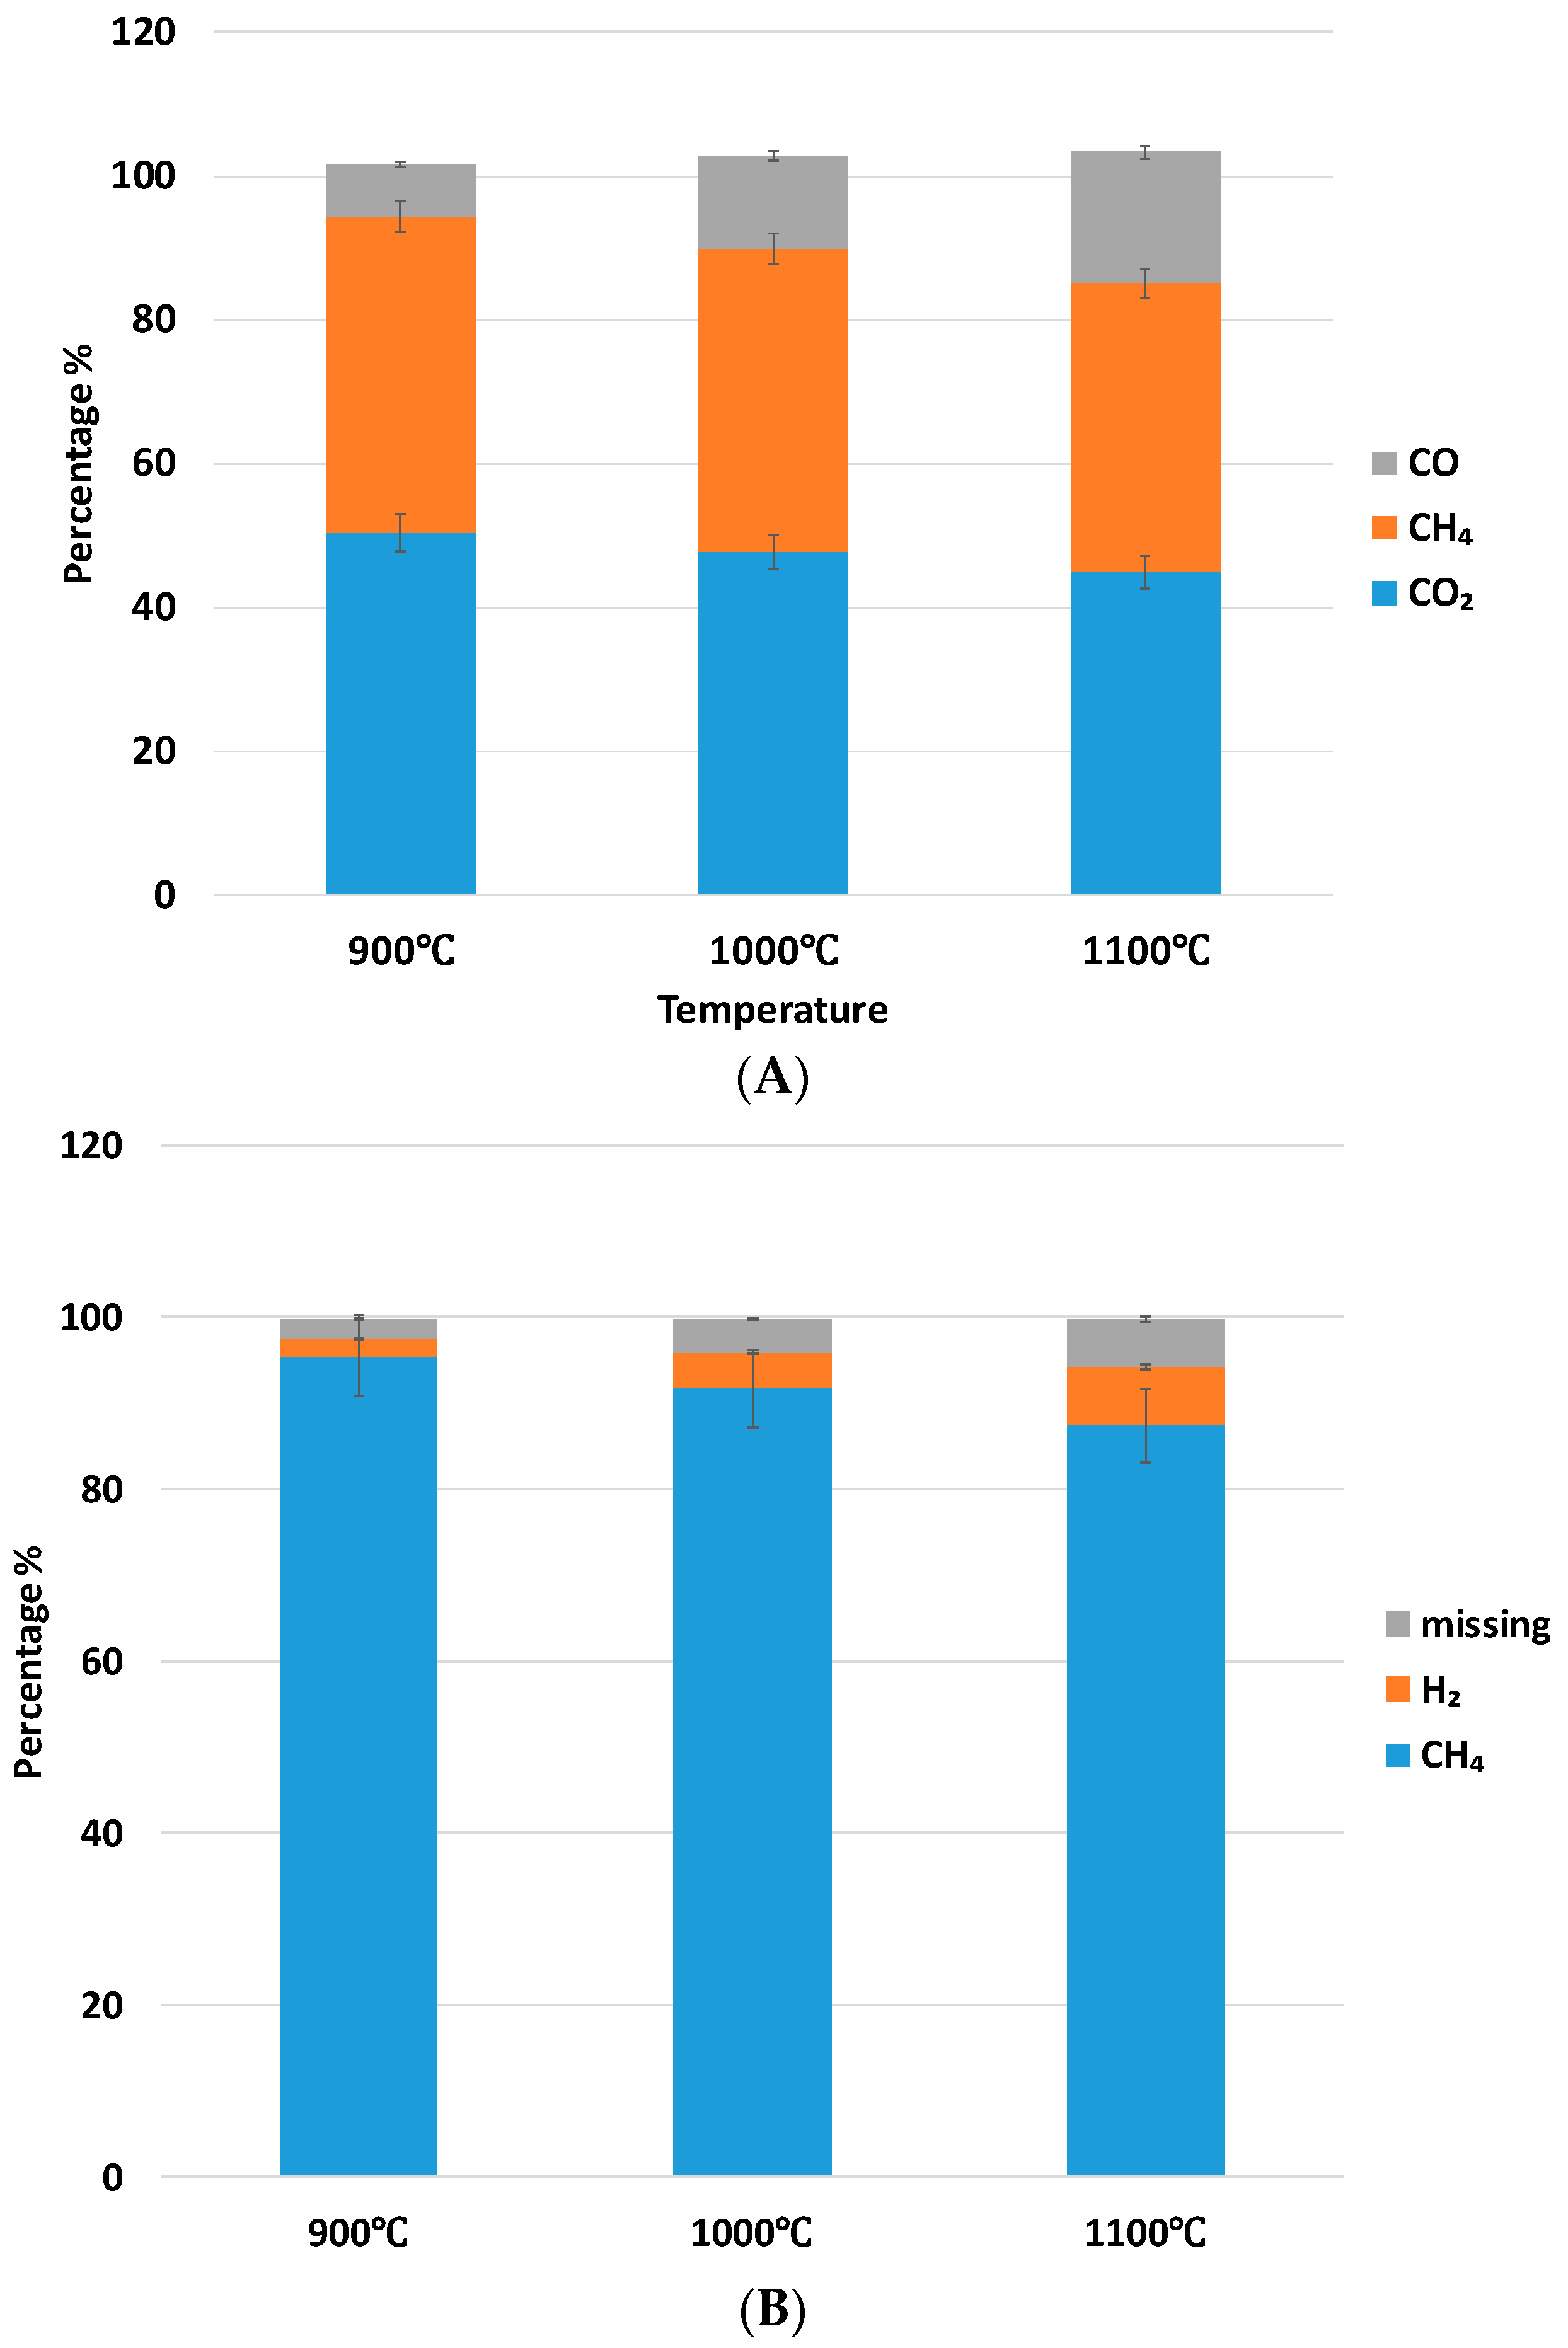
3.1. Carbon Balance and Hydrogen Balance

A carbon balance and a hydrogen balance were performed for each test by comparing elemental flowrates before and after reaction. Representative balances for an exemplary reaction condition are shown below in Figure 7. In the carbon balance, the outlet flow rate ratios of CH4, CO2, and CO are determined by using a calibration curve where the flow rate ratio of a given species relative to an argon reference flow is related to the signal ratio between the two species. In practice, when a signal ratio is computed, the calibration curve can be used to determine the flow rate ratio. Since the flow rate of inert argon is known, the flow rate of the species of interest can be easily determined by multiplying the flow rate ratio by the known flow rate of argon. These outlet flows are then multiplied by the stoichiometric coefficient for carbon (in this case 1:1 for all species), summed, and compared to the total amount of carbon added (from CO2 and CH4). Similarly, in the hydrogen balance, outlet flows of H2 and CH4 are determined. The flows for each species are then multiplied by the stoichiometric coefficient for hydrogen (i.e., 2 for H2 and 4 for CH4), summed, and compared to the total amount fed (assuming hydrogen originates solely from CH4).
DRM has several side reactions including water gas shift (2), methane cracking (3), and the Boudouard reaction (4):
CO + H2O ⇌ CO2 + H2
CH4 ⇌ C + 2H2
2CO ⇌ C + CO2
The missing hydrogen might be accounted for by generation of H2O during the reaction, which would likely have been condensed out of the product gas before analysis. On the other hand, small amounts of carbon black are observed on the catalyst pellet post reaction, but the amount is too small to be observed in the carbon balance. Although black color is known to improve light absorption, carbon formation is undesired as it deactivates the catalyst.

3.2. Conversion

Conversion (X, %) for CH4 and CO2 was calculated using the following two expressions,
X CH 4 = n ˙ CH 4 , in n ˙ CH 4 , out n ˙ CH 4 , in × 100 %
X CO 2 = n ˙ CO 2 , in n ˙ CO 2 , out n ˙ CO 2 , in × 100 %
where X CH 4 and X CO 2 are conversion for CH4 and CO2, respectively; n ˙ CH 4 , in and n ˙ CO 2 , in represent the molar flow rate of CH4 and CO2 at the inlet respectively; n ˙ CH 4 , out and n ˙ CO 2 , out are the molar flow rate of CH4 and CO2 at the outlet, respectively. The following parametric study investigated the effect of mean residence time (MRT) and temperature on conversion.

3.2.1. Effect of Mean Residence Time (MRT) and Temperature on CO2 Conversion

The effect of mean residence time and temperature on CO2 conversion at a constant CO2:CH4 ratio (1:1) is displayed in Figure 8 and shows that CO2 conversion increases with increasing mean residence time. Here, MRT refers to the estimated average time within the reaction zone (heated catalyst pellet) as determined by dividing this volume by the volumetric flow rate. The figure also shows that conversion increases with temperature.

3.2.2. Effect of MRT and Temperature on CO:H2 Ratio

The effect of residence time and temperature on the syngas composition for a 1:1 CO2:CH4 feed ratio is shown in Figure 9. Higher temperatures and longer residence times resulted in lower CO:H2 ratios approaching 1:1, which aligns well with the product ratio of dry reforming, indicating that the reaction is closer to thermodynamic equilibrium. Trends at lower temperatures and shorter residence times indicate higher CO:H2 ratios.

3.3. Energy Efficiency

Energy efficiencies were calculated from the following Equations (7)–(11). Total flux ( W flux , W/cm2) is measured by flux mapping with a Vatel TG1000-1 flux meter mounted to the reaction stage. Total thermal energy input ( Q ˙ solar , W) is assumed to be the measured total flux times the focal area (A, cm2). Energy used for preheating the inlet gases is defined as sensible heat ( Q ˙ sensible , W). Energy used for driving the reaction is defined as reaction energy ( Q ˙ reaction , W). Thermal-to-chemical energy conversion efficiency is calculated through Equation (11),
Q ˙ sensible = n ˙ gas Δ H gas ( T reaction T room )
Q ˙ reaction = n ˙ CH 4 , in X CH 4 Δ H reaction
Q ˙ solar = W flux A flux
η sensible = Q ˙ sensible Q ˙ solar × 100 %
η reaction = Q ˙ reaction Q ˙ solar × 100 %
where n ˙ gas is the molar flow rate for all the gases, n ˙ CH 4 , in is the molar flow rate for CH4 at the inlet, X CH 4 is the conversion of CH4, Δ H gas and Δ H reaction are the enthalpy for different gases and enthalpy of the DRM reaction, respectively, T reaction and T room are the reaction and room temperature, respectively, and η sensible and η reaction are the percentage of energy for preheating the gases and driving the reaction, respectively.
The energy conversion efficiency is plotted against mean residence time and temperature in Figure 10. In general, higher temperatures lead to higher energy efficiency regardless of the mean residence time. However, the mean residence time shows an interesting optimum for each temperature at 0.028 s (2X in the graph). Long residence times lead to the energy demand for endothermic reaction being poorly matched (i.e., too small) with the high rate of thermal input. The highest conversions achieved are at the longest residence times (see Figure 8) and corresponded to the lowest efficiency (Figure 10). Conversely, at the shortest residence time of 0.014 s efficiency suffers as the reaction did not proceed to a high conversion as shown in Figure 8).
Figure 11 shows energy usage of the reactor under the reaction conditions operating at the optimal conditions for thermal-to-chemical efficiency (CO2:CH4 1:1 ratio and 0.0280 s MRT). The figure shows that energy used by the reaction is approximately 10% of the total energy input. Based on the inlet flowrates, it is estimated that 30% of the incoming thermal energy is used to preheat the gas. The energy efficiency can be further improved by better insulation and integration of gas recuperator into the reactor. High temperature gas recuperation, such as that implemented by PNNL [14,15,16] in their solar steam reforming reactor, shows a substantial improvement in energy efficiency (69%). This is largely due to the gas recuperation which enables the inlet gas to be fed to the reactor at temperatures closer to the reaction temperature. Thus, energy input is directed toward chemical conversion rather than sensible heating. In comparison to other work in dry reforming, Anikeev et al. report 30% efficiency for a similar bayonet (concentric tube) reactor [21], while Yu et al. report just under 20% efficiency for a reactor featuring a tube array [18]. In the work presented here, the efficiency may also be improved by minimizing gas bypass which circumvents the catalyst. The remainder of the energy savings would be from decreasing the radiative and convective losses from the system, in addition to facilitating a faster flowrate whereby the thermal demand of the kinetics matches the solar intensity.
Scale up of the reactor would involve scaling the incident surface for flux to enter the reactor. A more highly engineered catalyst surface with higher surface area would allow for greater catalyst effectiveness and energy efficiency.

3.4. Catalyst Morphology

Figure 12 shows the before reaction and after reaction SEM images of the catalyst. Although the two images are at different levels of magnification, there is apparent sintering between particles in both cases, though slightly more pronounced in the post-reaction image.

4. Conclusions

Solar-driven dry reforming of methane is an effective and sustainable method to upgrade the energy content of methane and carbon dioxide. The experimental results presented here demonstrate dry reforming of methane in a directly irradiated, milli-scale chemical reactor to have acceptable energy efficiency—around 10%—and moderate rates of conversion. Most importantly, the reactor achieves a rapid heating rate in excess of 1020 K/min, demonstrating a key advantage of small, modular reactors. The majority of the flux is targeted directly onto the catalyst, which is a key advantage of the high surface-area-to-volume ratio of a miniaturized reactor. However, in the current design, a large portion of the energy is used for sensible heating of the gas. Adding a more effective heat exchanger and better insulation will reduce heat loss and greatly improve the energy efficiency. These results provide a platform for the next-generation reactor design featuring integration of a microscale feature for hot gas heat recuperation.

Author Contributions

Conceptualization, A.F.T.Y., G.J., and N.A.; Data curation, Y.W., F.L., and L.F.; Funding acquisition, G.J.; Investigation, Y.W., F.L., L.F., and E.B.; Methodology, S.I., P.I., L.Á., and G.J.; Supervision, N.A.; Writing—original draft, Y.W.; Writing—review & editing, F.L., L.F., L.Á., and N.A.

Funding

This research was funded by PTT Ltd.

Acknowledgments

We would like to thank PTT Ltd. For their generous support of this project.

Conflicts of Interest

The authors declare no conflict of interest. The founding sponsors had no role in the design of the study; in the collection, analyses, or interpretation of data; in the writing of the manuscript, and in the decision to publish the results.

References

  1. Pakhare, D.; Spivey, J. A review of dry (CO2) reforming of methane over noble metal catalysts. Chem. Soc. Rev. 2014, 43, 7813–7837. [Google Scholar] [CrossRef] [PubMed]
  2. Godini, H.R.; Xiao, S.; Kim, M.; Goerke, O.; Song, S.; Wozny, G. Dual-membrane reactor for methane oxidative coupling and dry methane reforming: Reactor integration and process intensification. Chem. Eng. Process. 2013, 74, 153–164. [Google Scholar] [CrossRef]
  3. Usman, M.; Wan Daud, W.M.A.; Abbas, H.F. Dry reforming of methane: Influence of process parameters—A review. Renew. Sustain. Energy Rev. 2015, 45, 710–744. [Google Scholar] [CrossRef]
  4. Hao, Z.G.; Zhu, Q.S.; Jiang, Z.; Hou, B.L.; Li, H.Z. Characterization of aerogel Ni/Al2O3 catalysts and investigation on their stability for CH4-CO2 reforming in a fluidized bed. Fuel Process. Technol. 2009, 90, 113–121. [Google Scholar] [CrossRef]
  5. Wang, H.Y.; Ruckenstein, E. Carbon dioxide reforming of methane to synthesis gas over supported rhodium catalysts: The effect of support. Appl. Catal. A Gen. 2000, 204, 143–152. [Google Scholar] [CrossRef]
  6. Sutthiumporn, K.; Maneerung, T.; Kathiraser, Y.; Kawi, S. CO2 dry-reforming of methane over La0.8Sr0.2Ni0.8M0.2O3 perovskite (M = Bi, Co, Cr, Cu, Fe): Roles of lattice oxygen on C–H activation and carbon suppression. Int. J. Hydrogen Energy 2012, 37, 11195–11207. [Google Scholar] [CrossRef]
  7. Kathiraser, Y.; Oemar, U.; Saw, E.T.; Li, Z.; Kawi, S. Kinetic and mechanistic aspects for CO2 reforming of methane over Ni based catalysts. Chem. Eng. J. 2015, 278, 62–78. [Google Scholar] [CrossRef]
  8. Mahammadunnisa, S.; Reddy, P.; Ramaraju, B.; Subrahmanyam, C. Catalytic Nonthermal Plasma Reactor for Dry Reforming of Methane. Energy Fuels 2013, 27, 4441–4447. [Google Scholar] [CrossRef]
  9. Brooks, K.P.; Davis, J.M.; Fischer, C.M.; King, D.L.; Pederson, L.R.; Rawlings, G.C.; Stenkamp, V.S.; TeGrotenhuis, W.; Wegeng, R.S.; Whyatt, G.A. Fuel reformation: Microchannel reactor design. Microreactor Technol. Process. Intensif. 2005, 914, 238–257. [Google Scholar]
  10. King, D.L.; Brooks, K.; Fischer, C.; Pederson, L.; Rawlings, G.; Stenkamp, V.S.; TeGrotenhuis, W.; Wegeng, R.; Whyatt, G. Fuel reformation: Catalyst requirements in microchannel architectures. Microreactor Technol. Process. Intensif. 2005, 914, 119–128. [Google Scholar]
  11. Wang, Y.; Vander Wiel, D.P.; Tonkovich, A.L.Y.; Fitzgerald, S.P.; Marco, J.L.; LaMont, M.J.; Wegeng, R.S. Engineered catalysts for fuel-processing applications in microchannel reactors. Abstracts Pap. Am. Chem. Soc. 2000, 219, U530. [Google Scholar]
  12. Peela, N.R.; Kunzru, D. Oxidative steam reforming of ethanol over Rh based catalysts in a micro-channel reactor. Int. J. Hydrogen Energy 2011, 36, 3384–3396. [Google Scholar] [CrossRef]
  13. Zhai, X.; Cheng, Y.; Zhang, Z.; Jin, Y.; Cheng, Y. Steam reforming of methane over Ni catalyst in micro-channel reactor. Int. J. Hydrogen Energy 2011, 36, 7105–7113. [Google Scholar] [CrossRef]
  14. Zheng, F.; Diver, R.; Caldwell, D.D.; Fritz, B.G.; Cameron, R.J.; Humble, P.H.; TeGrotenhuis, W.E.; Dagle, R.A.; Wegeng, R.S. Integrated solar thermochemical reaction system for steam methane reforming. Energy Procedia 2015, 69, 1192–1200. [Google Scholar] [CrossRef]
  15. Brown, D.; Tegrotenhuis, W.; Wegeng, R.; Mankins, J. Solar Powered Steam-methane Reformer Economics. Energy Procedia 2014, 49, 1916–1921. [Google Scholar] [CrossRef]
  16. Wegeng, R.; Diver, R.; Humble, P. Second Law Analysis of a Solar Methane Reforming System. Energy Procedia 2014, 49, 1248–1258. [Google Scholar] [CrossRef]
  17. De Falco, M.; Caputo, G.; Frattari, S.; Gironi, F.; Annesini, M.C. Solar steam reforming for enriched methane production: Reactor configurations modeling and comparison. Int. J. Hydrogen Energy 2014, 39, 13979–13990. [Google Scholar] [CrossRef]
  18. Yu, T.; Yuan, Q.; Lu, J.; Ding, J.; Lu, Y. Thermochemical storage performances of methane reforming with carbon dioxide in tubular and semi-cavity reactors heated by a solar dish system. Appl. Energy 2017, 185, 1994–2004. [Google Scholar] [CrossRef]
  19. Klein, H.H.; Karni, J.; Rubin, R. Dry methane reforming without a metal catalyst in a directly irradiated solar particle reactor. J. Sol. Energy Eng. 2009, 131, 21001. [Google Scholar] [CrossRef]
  20. Michalsky, R.; Neuhaus, D.; Steinfeld, A. Carbon Dioxide Reforming of Methane using an Isothermal Redox Membrane Reactor. Energy Technol. 2015, 3, 784–789. [Google Scholar] [CrossRef] [Green Version]
  21. Anikeev, V.I.; Bobrin, A.S.; Ortner, J.; Schmidt, S.; Funken, K.H.; Kuzin, N.A. Catalytic thermochemical reactor/receiver for solar reforming of natural gas: Design and performance. Sol. Energy 1998, 63, 97–104. [Google Scholar] [CrossRef]
  22. Diver, R.B.; Fish, J.D. Solar test of an integrated sodium reflux heat pipe receiver/reactor for thermochemical energy transport. Sol. Energy 1992, 48, 21–30. [Google Scholar] [CrossRef]
  23. L’Estrange, T.; Truong, E.; Rymal, C.; Rasouli, E.; Narayanan, V.; Apte, S.; Drost, K. High Flux Microscale Solar Thermal Receiver for Supercritical Carbon Dioxide Cycles. In Proceedings of the ASME 2015 13th International Conference on Nanochannels, Microchannels, and Minichannels, San Francisco, CA, USA, 6–9 July 2015; p. V001T03A009. [Google Scholar]
Figure 1. SEM-EDX mapping of catalyst.
Chemengineering 02 00050 g001
Figure 2. Reactor design. The catalyst pellet is placed at the top of the inner tube near the top of the porous alumina insulation. On the right figure, gas flow (blue arrows) enters from a center tube, flows through the catalyst, and then exits (red arrows) in the annular space between the inlet tube and the outer (exit) tube.
Chemengineering 02 00050 g002
Figure 3. (a) Solar simulator lamp and mirror reflector; (b) target underneath reflector.
Chemengineering 02 00050 g003
Figure 4. Temperatures at the center of the reactor cavity under different lamp power levels.
Chemengineering 02 00050 g004
Figure 5. Inner reactor temperature vs. time for milli-scale reactor. The rapid heating rate is a function of the small reactor size.
Chemengineering 02 00050 g005
Figure 6. Schematic of the experimental apparatus.
Chemengineering 02 00050 g006
Figure 7. Representative elemental balances. (A) Carbon balance and (B) hydrogen balance for the reaction conditions of mean residence time (MRT) = 0.014 s and molar ratio of CO2:CH4 equal to 1:1.
Chemengineering 02 00050 g007
Figure 8. Effect of MRT on CO2 conversion at different temperatures for a 1:1 CO2:CH4 ratio.
Chemengineering 02 00050 g008
Figure 9. Effect of MRT and temperature on CO:H2 ratio for a feed ratio of 1:1 CO2:CH4.
Chemengineering 02 00050 g009
Figure 10. Effect of mean residence time (MRT) and temperature on overall thermal efficiency for conversion of thermal energy into chemical energy. Here, X corresponds to a MRT of 0.14 s. CO2 to CH4 feed ratio was 1:1 in all cases. For the other data sets, the number in front of the ‘X’ represents the multiples of the residence time (e.g., 20X corresponds to a residence time that is 20-fold longer).
Chemengineering 02 00050 g010
Figure 11. Energy efficiency at molar ratio CO2:CH4 = 1:1 and MRT = 0.0280 s.
Chemengineering 02 00050 g011
Figure 12. SEM images from (a) before reaction; and (b) after reaction. Note that magnification scales are different.
Chemengineering 02 00050 g012

