
Force Field for Calculation of the Vapor-Liquid Phase Equilibrium of trans-Decalin

Department of Chemical Process Engineering, Kazan National Research Technological University, 68 Karl Marks Str., 420015 Kazan, Russia
*
Author to whom correspondence should be addressed.
ChemEngineering 2024, 8(1), 6; https://doi.org/10.3390/chemengineering8010006
Submission received: 6 October 2023
/
Revised: 12 November 2023
/
Accepted: 11 December 2023
/
Published: 26 December 2023
Abstract
:Based on the TraPPE force field, previously unknown values of the parameters of the intermolecular interaction potential of trans-decalin were determined. Parametrization was carried out using experimental data on saturated vapor pressure and density at atmospheric pressure. The found parameters make it possible to adequately describe the boiling and condensation lines of trans-decalin and also predict the critical values of pressure, density, and temperature with satisfactory accuracy. Calculations of vapor-liquid phase equilibrium conditions for a binary CO2—trans-decalin mixture in supercritical conditions for CO2 were carried out. When quantitatively comparing the calculated values with experimental data, an underestimation of pressure at a temperature of 345.4 K by 30% is observed, which decreases to 5% for temperatures up to 525 K.
1. Introduction
Phase equilibrium data is often required to model various industrial processes and technology development. For the processes of separation of liquid mixtures by distillation, data on vapor-liquid equilibrium are important. To determine the vapor-liquid phase equilibrium conditions in multicomponent systems, it is necessary to be able to calculate the saturated vapor pressures and activity coefficients of the components. In practice, this is usually done using various models of equations of state or activity coefficients based on the excess Gibbs energy. However, experimental data are needed to determine the parameters in these models. Unfortunately, they are not always available for the system in question or for the required process conditions (pressure, temperature, composition).
Reliable alternatives to experimental data are molecular simulation methods such as molecular dynamics and Monte Carlo. These methods are theoretically rigorous but have their own advantages, disadvantages, and limitations when calculating various properties. However, for any method, the adequacy of the calculation results is mainly related to the correct description of the intermolecular interactions. Their reliable description is an important task when using molecular simulation methods. It is usually solved using site–site interaction by Lennard Jones, Buckingham, and other potentials. So, the main task is to accurately determine the parameters in the intermolecular interaction potentials.
The parameters of intermolecular interaction models can be configured according to various properties. Parameters of intermolecular interaction potentials differ depending on the properties by which the model is configured. To this date, many force fields have been developed to describe intermolecular interactions. The OPLS (optimized potentials for liquid simulations) force field [1] was originally developed for the united atom approach. In this case, the hydrogen atoms of the carbon chain are not considered separate interaction sites. Fewer interaction sites reduce computational costs. Later, parameters of the OPLS force field were fitted [2] according to the all-atom approach (OPLS-AA). This force field has many modifications, for example, to describe amino acids and RNA [3]. Therefore, this force field is often used in molecular biology as it correctly reproduces the energy characteristics of molecules and their interactions with solvents. Also, CHARMM (Chemistry at Harvard Macromolecular Mechanics) force fields [4,5] are often used for the simulation of bio-molecules.
For chemical technology, the correct description of the phase diagram and pVT properties is more important. Therefore, the TraPPE (transferable potentials for phase equilibria) force field is used in this area more often [6,7,8,9]. This force field was developed specifically to describe the thermodynamic properties of the liquid phase and the vapor–liquid phase equilibrium conditions. The parameters of this force field are available for many classes of substances: hydrocarbons, branched hydrocarbons, alcohols, amines, aromatic compounds, etc. It is worth noting that although the force field was tuned to phase equilibrium conditions, the TraPPE force field shows a good description of other properties as well, such as diffusion coefficients [10].
An important feature of the considered force fields is their transferability. Transferability allows to use of the same potential functions and parameters to describe interactions of identical atoms or groups of atoms located in different molecules. The property of transferability turns out to be especially convenient for describing intermolecular interactions of homologous series of substances, for example, alkanes or alkenes, etc. It is worth noting that the number of functional groups that can be described by the TraPPE force field is inferior compared to the OPLS-AA force field. Therefore, situations arise when it is necessary to find the parameters of any of the missing functional groups in the molecule of the substance under study.
The object of study in this work is the intermolecular interactions of trans-decalin (CAS 493-02-7). Decalin is an industrial solvent for rubbers and polymers [11,12,13]. Decalin can be used as a solvent in processes for supercritical syntheses of polymer mixtures. The use of solution-enhanced dispersion by supercritical fluids is promising [14,15] to obtain polymer compositions with specified properties. CO2 is most widely used in supercritical technologies. This is due to the critical characteristics of CO2 that are acceptable for practical use. To select the optimal conditions for the process, it is necessary to know the phase equilibrium conditions. Therefore, in this work, in addition to describing the properties of pure trans-decalin, phase diagrams in the trans-decalin-CO2 mixture at temperatures above the critical temperature of CO2 were calculated.
Intermolecular interactions in decalin have been considered previously in several studies. The work [16] proposed parameters for the intermolecular interaction of decalin. The all-atom interaction model was used. The authors used arranged charges on the carbon and hydrogen atoms so that the CH2 group was neutral. It has been shown that the radial distribution function changes significantly only when the charge on oxygen atoms is greater than 0.8ē. The authors concluded that for a uniform density distribution, the atoms should not be uncharged or have a weak charge. The parameters of the Lennard–Jones interaction of hydrogen and carbon were determined from the experimental values of the density of the liquid phase.
In article [17] three force fields were evaluated: nonreactive OPLS-AA, reactive ReaxFF, and AIREBO-M for hydrocarbon simulation. The assessment was carried out on hydrocarbons of various structures. In that work, decalin was used as one of the representatives of cyclic hydrocarbons. Comparison with experimental data was carried out in terms of density and isentropic bulk modulus. Of these three force fields, OPLS-AA was found to be the best. ReaxFF also shows good results on the studied properties, but it is more computationally expensive.
In the article [18] accuracy of the critical properties description was described for hydrocarbons with various force fields using the molecular dynamics method. It was shown that CHARMM and OPLS-AA force fields underestimate the critical temperature of trans-decalin by more than 30 K.
This work aimed to determine the force field parameters for the correct description of thermodynamic properties on the phase equilibrium line and pVT properties. For this purpose, the TraPPE force field was used as a basis. In TraPPE parameters are fitted for cyclic alkanes [19]. However, in that case, work has been limited to a single cyclic group. In this work, however, the force field was modified to cover the case of fused rings. This required new parameters for CH groups between the two fused rings. The parameters of intermolecular interaction in this work were determined from the saturated vapor pressure and density of the liquid phase of pure trans-decalin.
2. Molecular Simulation
There are two molecular simulation methods for calculating the properties of substances: the molecular dynamics and the Monte Carlo method. These two methods produce the same results, and the calculated values are determined by intermolecular interactions. These methods have several advantages and disadvantages, and the scope of application is determined by the objectives of the study.
The molecular dynamics method is based on solving the equation of motion of molecules. Thus, the molecular dynamics method allows, in addition to thermodynamic properties, to also calculate changes in characteristics over time. This allows you to calculate transport properties: diffusion coefficient, viscosity coefficient, and thermal conductivity. This method also allows one to study nonequilibrium processes (for example, membrane separation [20], and processes in biological membranes [21,22]). To solve the equation of motion, it is necessary to calculate the molecular interaction forces, and this algorithm is effectively implemented using graphical processing units. This allows for significantly reduced computation time.
In the Monte Carlo method, thermodynamic properties are determined by averaging over phase space [23]. The Metropolis algorithm was developed for the most effective integration over phase space. This algorithm is based on changing the configuration of molecules (movement, rotation, changing the position of the carbon chain of the molecule, etc.) and subsequent calculation of the probability of acceptance or rejection of these changes.
There are several molecular statistical methods for calculating phase equilibrium conditions. At equilibrium, the temperature, pressure, and chemical potential in the two phases must be the same. Therefore, the first method is to calculate the chemical potential at given values of pressure (or density) and temperature (NpT or NVT ensemble) for two phases. By varying pressure (density) or temperature, equality of chemical potentials in the phases is achieved [24]. However, this approach is inconvenient for two reasons. First, it is necessary to carry out several calculations under different conditions. Secondly, when calculating multicomponent mixtures, it is necessary to vary the compositions of the phases, which significantly increases the volume of required calculations. This approach can be implemented both by the molecular dynamics method and the Monte Carlo method.
Another way to calculate phase equilibrium is to simulate a large number of molecules in a box elongated along one of the coordinates [25]. Due to the fact that only one box is being simulated, the conditions for equality of temperatures, pressures, and chemical potentials in the system will be satisfied automatically. The box will simultaneously contain liquid and vapor phases. However, averaging of the desired properties must be carried out far from the phase interface. Also, using this method, it is problematic to determine the pressure in the system due to the presence of two phases in the box at the same time. This approach to calculating phase equilibrium is used by the molecular dynamics method.
However, due to several advantages over other approaches, the Gibbs ensemble (Monte Carlo simulation) method [26] has become most widespread. Unlike other ensembles, it simulates several boxes. Additional new types of configuration changes are also introduced—the transfer of a molecule between boxes, and a joint change in volumes of boxes. This ensures equality of temperatures, pressures, and chemical potentials of the components in the two phases. Many programs have been developed for Monte Carlo simulation [27]: towhee [28], ms2 [29], GOMC [30,31], etc. Each program has its advantages and disadvantages.
Towhee is a fairly old and well-debugged program but does not allow full use of multi-core processors. The advantages of ms2 include the presence of a graphical interface, which is useful for inexperienced users.
In this work, the GOMC package (version 2.70) was used. A distinctive feature of this program is the ability to use a graphics processor to calculate long-range forces.
Density calculations in the single-phase region were carried out in the NpT ensemble. The calculation of long-range forces was carried out only in the presence of charges in the system (for example, for CO2). The topology (psf file) of the atomic structure of molecules (pdb file) was generated using a proprietary program [32]. The initial state of the system was generated using the packmol package [33].
When searching for parameters, the cells of the liquid phase contained a total of 500 molecules for both the Gibbs ensemble and the NpT ensemble. This allowed us to reduce the time required to search for parameters. When calculating the properties of trans-decalin and the binary mixture of trans-decalin—CO2, the number of molecules was increased to 1000 to reduce the statistical deviation of the simulation results.
When calculating the phase equilibrium conditions in the Gibbs ensemble, the initial number of molecules in the gas phase was set to about 50, and the volumes of the gas phase were determined based on the approximate pressure according to the ideal gas equation.
The calculation of phase equilibrium was carried out in two stages. First, 6 million Monte Carlo steps were carried out without the transfer of molecules between the boxes of the gas and liquid phases. The ratio of different types of system configuration changes was as follows: displacement move 69%, rotation move 10%, regrown by coupled-decoupled configurational-bias algorithm 10%, crankshaft move 10%, volume change 1%. During this stage, there was a decrease in the initially high values of energy and pressure and a change in the volumes of the gas and liquid phases.
The second stage involved the swap move of molecules between gas and liquid volumes. The ratio of configuration change types was as follows: displacement move 49%, molecule swap move between boxes 20%, rotation move 10%, regrown by coupled-decoupled configurational-bias algorithm 10%, crankshaft move 10%, volume change 1%. 6 million Monte Carlo steps were allocated to establish equilibrium, and 15 million were allocated to averaging the thermodynamic properties. Averaging was carried out in blocks of 3 million Monte Carlo steps each.
When calculating phase equilibrium, the correctness of pure substances was checked by the compressibility value zV = pV/NRT as proposed in the article [34].
3. Force Field Parameterization Algorithm
Decalin has cis-(CAS 493-01-6) and trans-(CAS 493-02-7) isomeric forms that differ in the position of hydrogen atoms in the structure of the carbon skeleton (Figure 1). This is due to the differences in the thermodynamic properties of various isomers. The united atom force field TraPPE [19], which describes the interaction of cyclohexane, was taken as a basis. The values of the parameters of the intermolecular and intramolecular interaction potential are presented in Table 1 and Table 2. The Lorentz–Berthelot rule was used to describe cross-interactions.
Unlike cyclohexane, decalin has two articulated rings. The parameters of the CH2 group were the same as for cyclohexane, therefore, in this work, unknown values for CH groups were determined. The values of bond lengths, bond and dihedral angles were the same as for cyclohexane in the TraPPE force field (Table 2).
Intermolecular interaction in the TraPPE force field is described by the Lennard–Jones potential:
where σ is the distance at which the potential is zero, and ε is the depth of the potential well, r is the distance between interaction sites. For trans-decalin, as well as for cyclohexane, the interaction centers were uncharged. Thus, in this work, two parameters ε and σ for the CH group were determined.
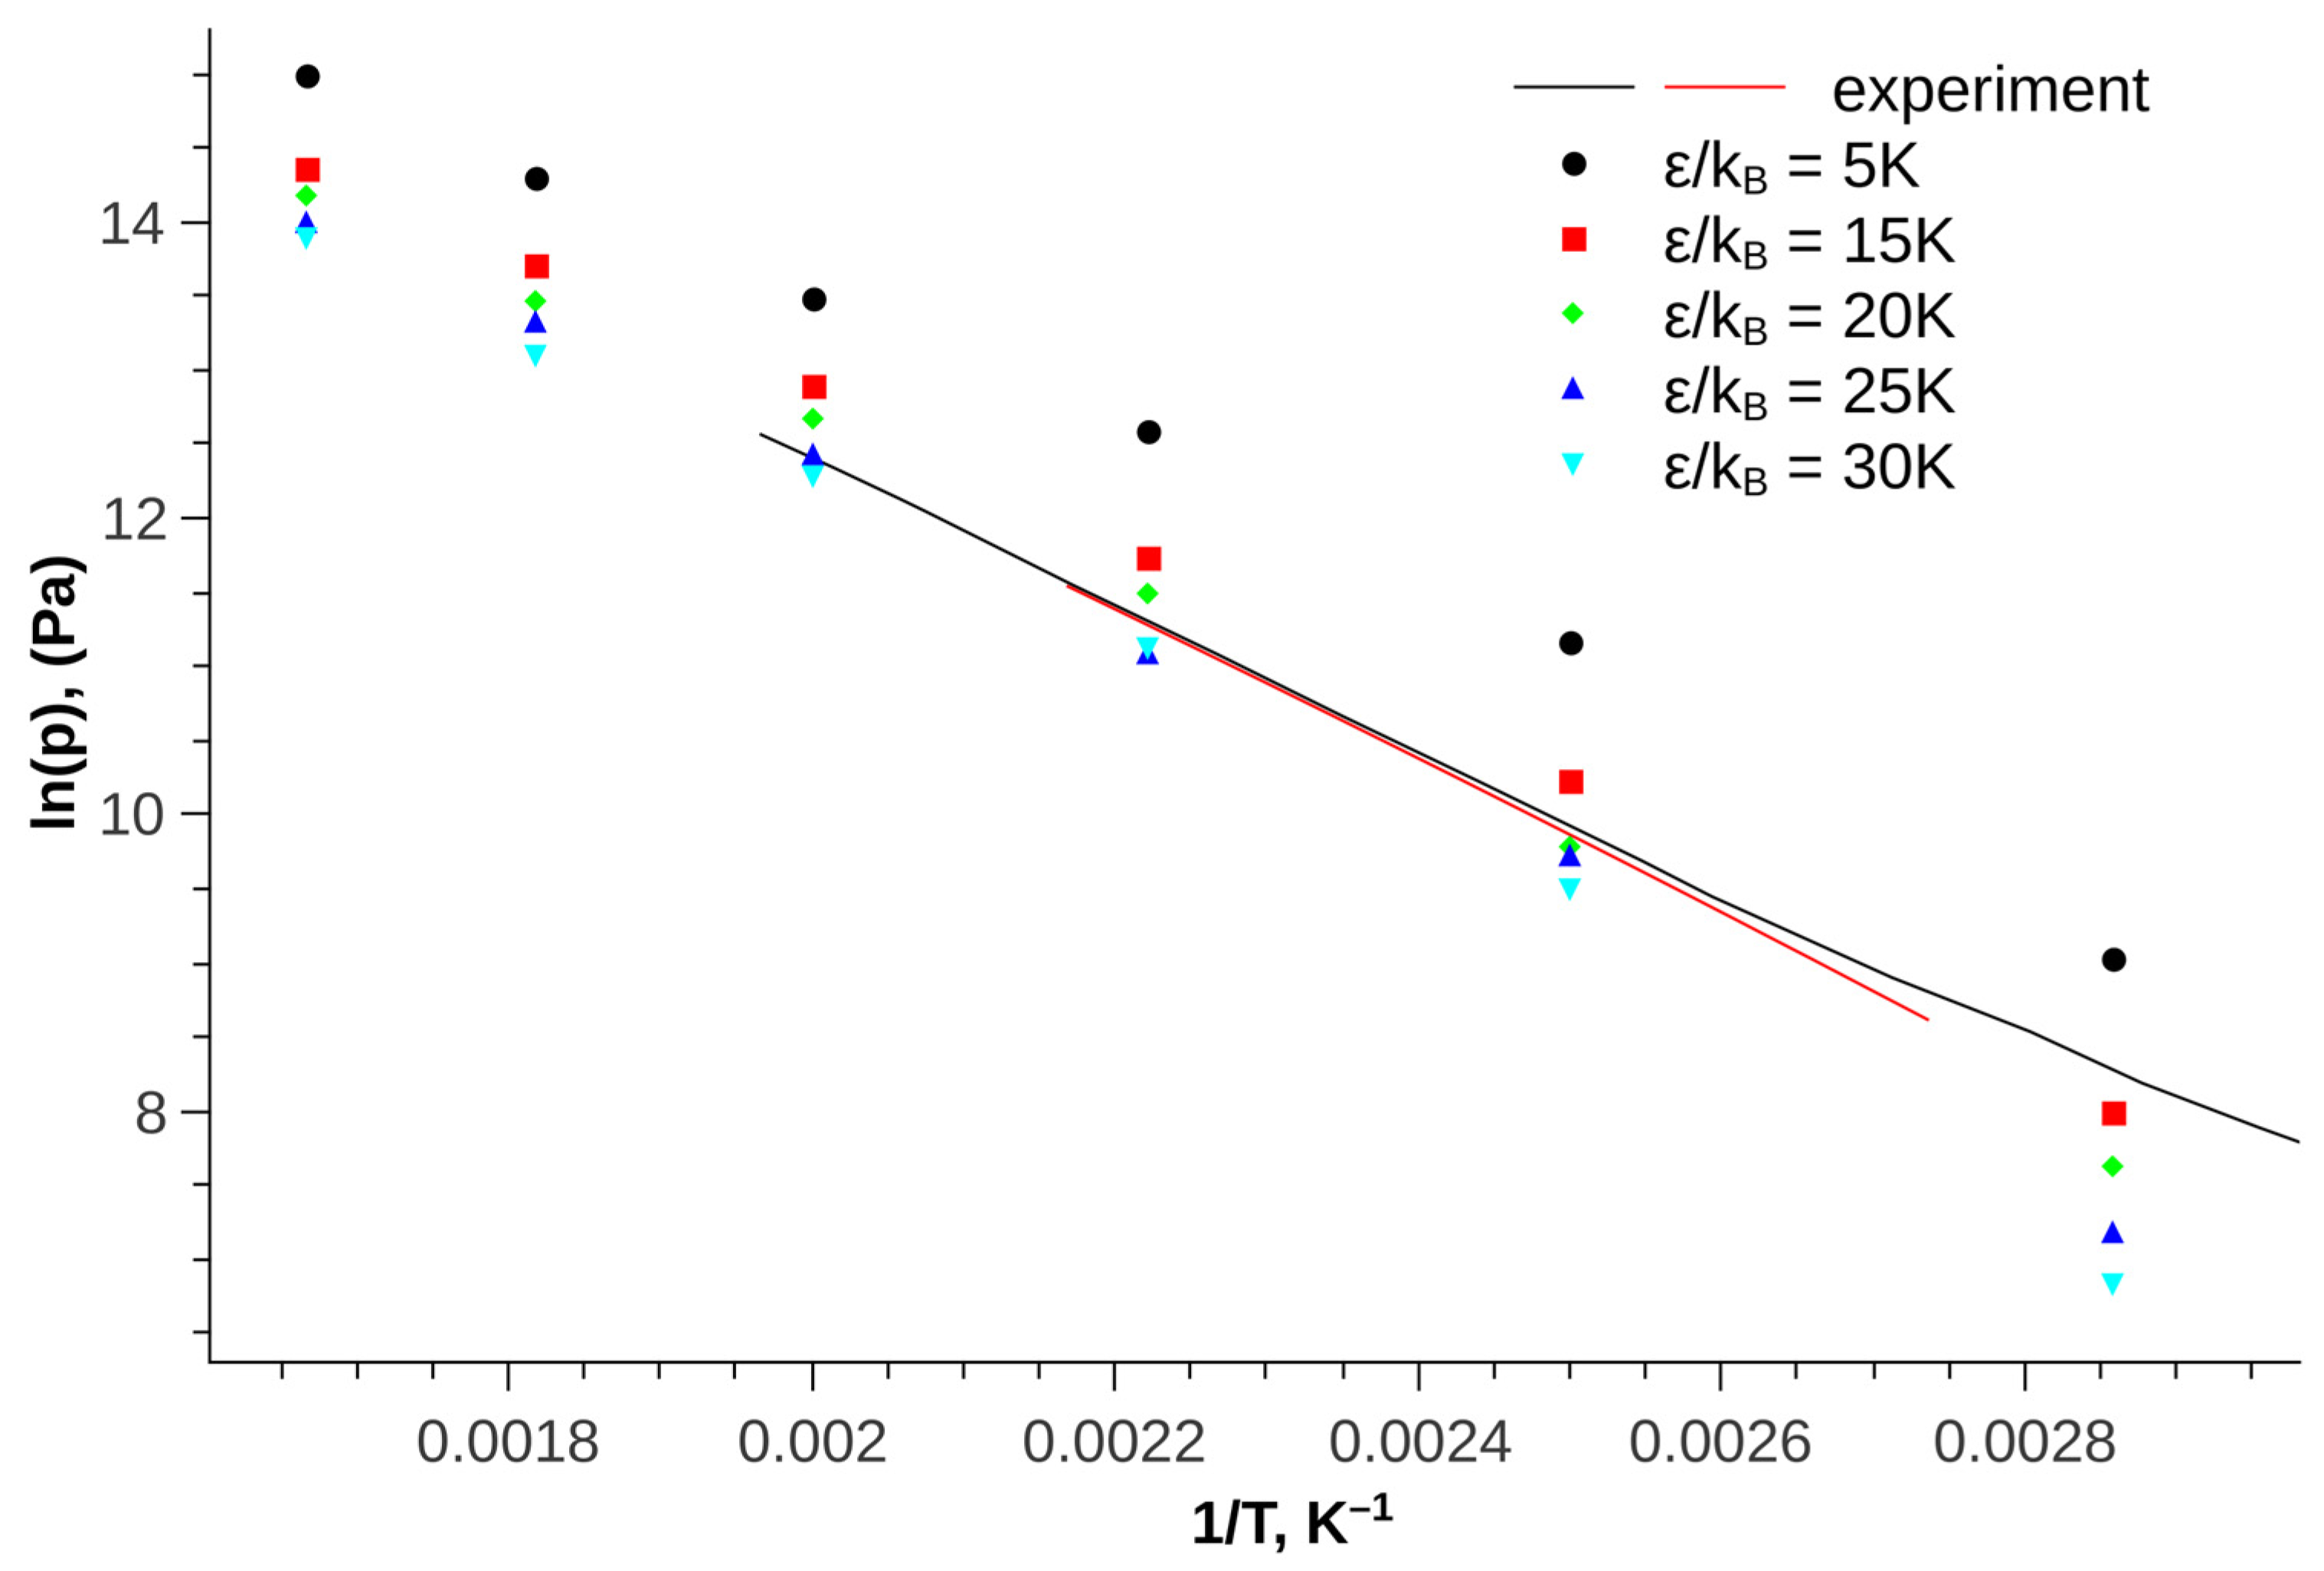
To search for parameters, firstly, the vapor-liquid equilibrium of pure trans-decalin was calculated at various values of σ in the range from 3.5 to 5.5 angstroms. For each of the values of σ, the value of ε was determined by the best description of the experimental values of saturated vapor pressure [35,36,37]. Figure 2 shows an example of a comparison of experimental and calculated vapor pressure for the value σ = 3.6 Å. An increase in the attractive force (increase in ε) leads to a decrease in vapor pressure.
Figure 3 shows the dependences of ε on σ, found from the saturated vapor pressure. It can be seen from the figure that as σ increases, the required value of the parameter ε decreases. It should be noted that the CH groups of decalin are surrounded by CH2 groups of the rings. Thus, CH groups make not the main, but a corrective contribution to intermolecular interaction. The influence of this factor on the parameter values can be observed on the CH3 (ε/kB = 98 K, σ = 3.75 Å), CH2 (ε/kB = 46 K, σ = 3.95 Å), CH (ε/kB = 10 K, σ = 4.68 Å) C (ε/kB = 0.5 K, σ = 6.4 Å) alkane groups in the TraPPE force field [6,7]. The CH3 groups in alkanes are terminal and make the main contribution to the interaction. Such groups are characterized by a small size (parameter σ) and a large depth of the potential well (parameter ε). Also, a small change in these parameters will dramatically change the simulation result. In the indicated sequence of groups from CH3 to C, hydrogen atoms are gradually replaced by hydrocarbon radicals. Thus, the interaction site under study is covered by other sites. This fact leads to the interaction distance increases (parameter σ). However, the strength of interaction (parameter ε) is significantly reduced. Thus, these sites make a corrective contribution to the interaction for a better description of the thermodynamic properties.
This observation allows us to predict the ranges in which it is necessary to search for parameters. For trans-decalin, one can expect fairly large values for the parameter σ.
In the next step, using the found values of the pairs of parameters ε and σ, densities at atmospheric pressure were calculated. A comparison of simulation results with experimental densities [38] of trans-decalin is presented in Figure 4.
It can be seen from Figure 4 that the slopes of the pressure versus temperature lines do not coincide. Therefore, compromise values of the parameters were chosen to describe the density in both the low and high-temperature regions.
4. Results and Discussion
The found values of the parameters of the intermolecular interaction of the CH group are presented in Table 1. The parameters of the trans-decalin force field determined in the work were tested for the adequacy of describing the various thermodynamic properties of pure decalin on saturation lines and in the single-phase region, as well as in a mixture with supercritical CO2.
In Table 3 the results of calculating various thermodynamic properties (p—saturated vapor pressure, ρx—liquid phase density, ρy—vapor phase density, Hvap—heat of vaporization) for pure trans-decalin on saturation lines are presented. In the table, the sign Δ indicates the standard deviations of the calculation results.
The calculated boiling and condensation lines make it possible to predict the coordinates of the critical point using equations:
and
with
where values of the critical indices were taken as follows: β = 0.326, μ = 0.90, and Θ = 0.54 [39]. The values of the critical temperature, critical density, as well as the parameters A, B0, and B1 in Equations (2) and (3) were determined by regression analysis of the calculated boiling and condensation lines. To determine the value of the critical pressure, the calculated dependence of the saturated vapor pressure on temperature was approximated by the Clapeyron equation. Then the critical pressure was determined using the Clapeyron equation with the critical temperature.
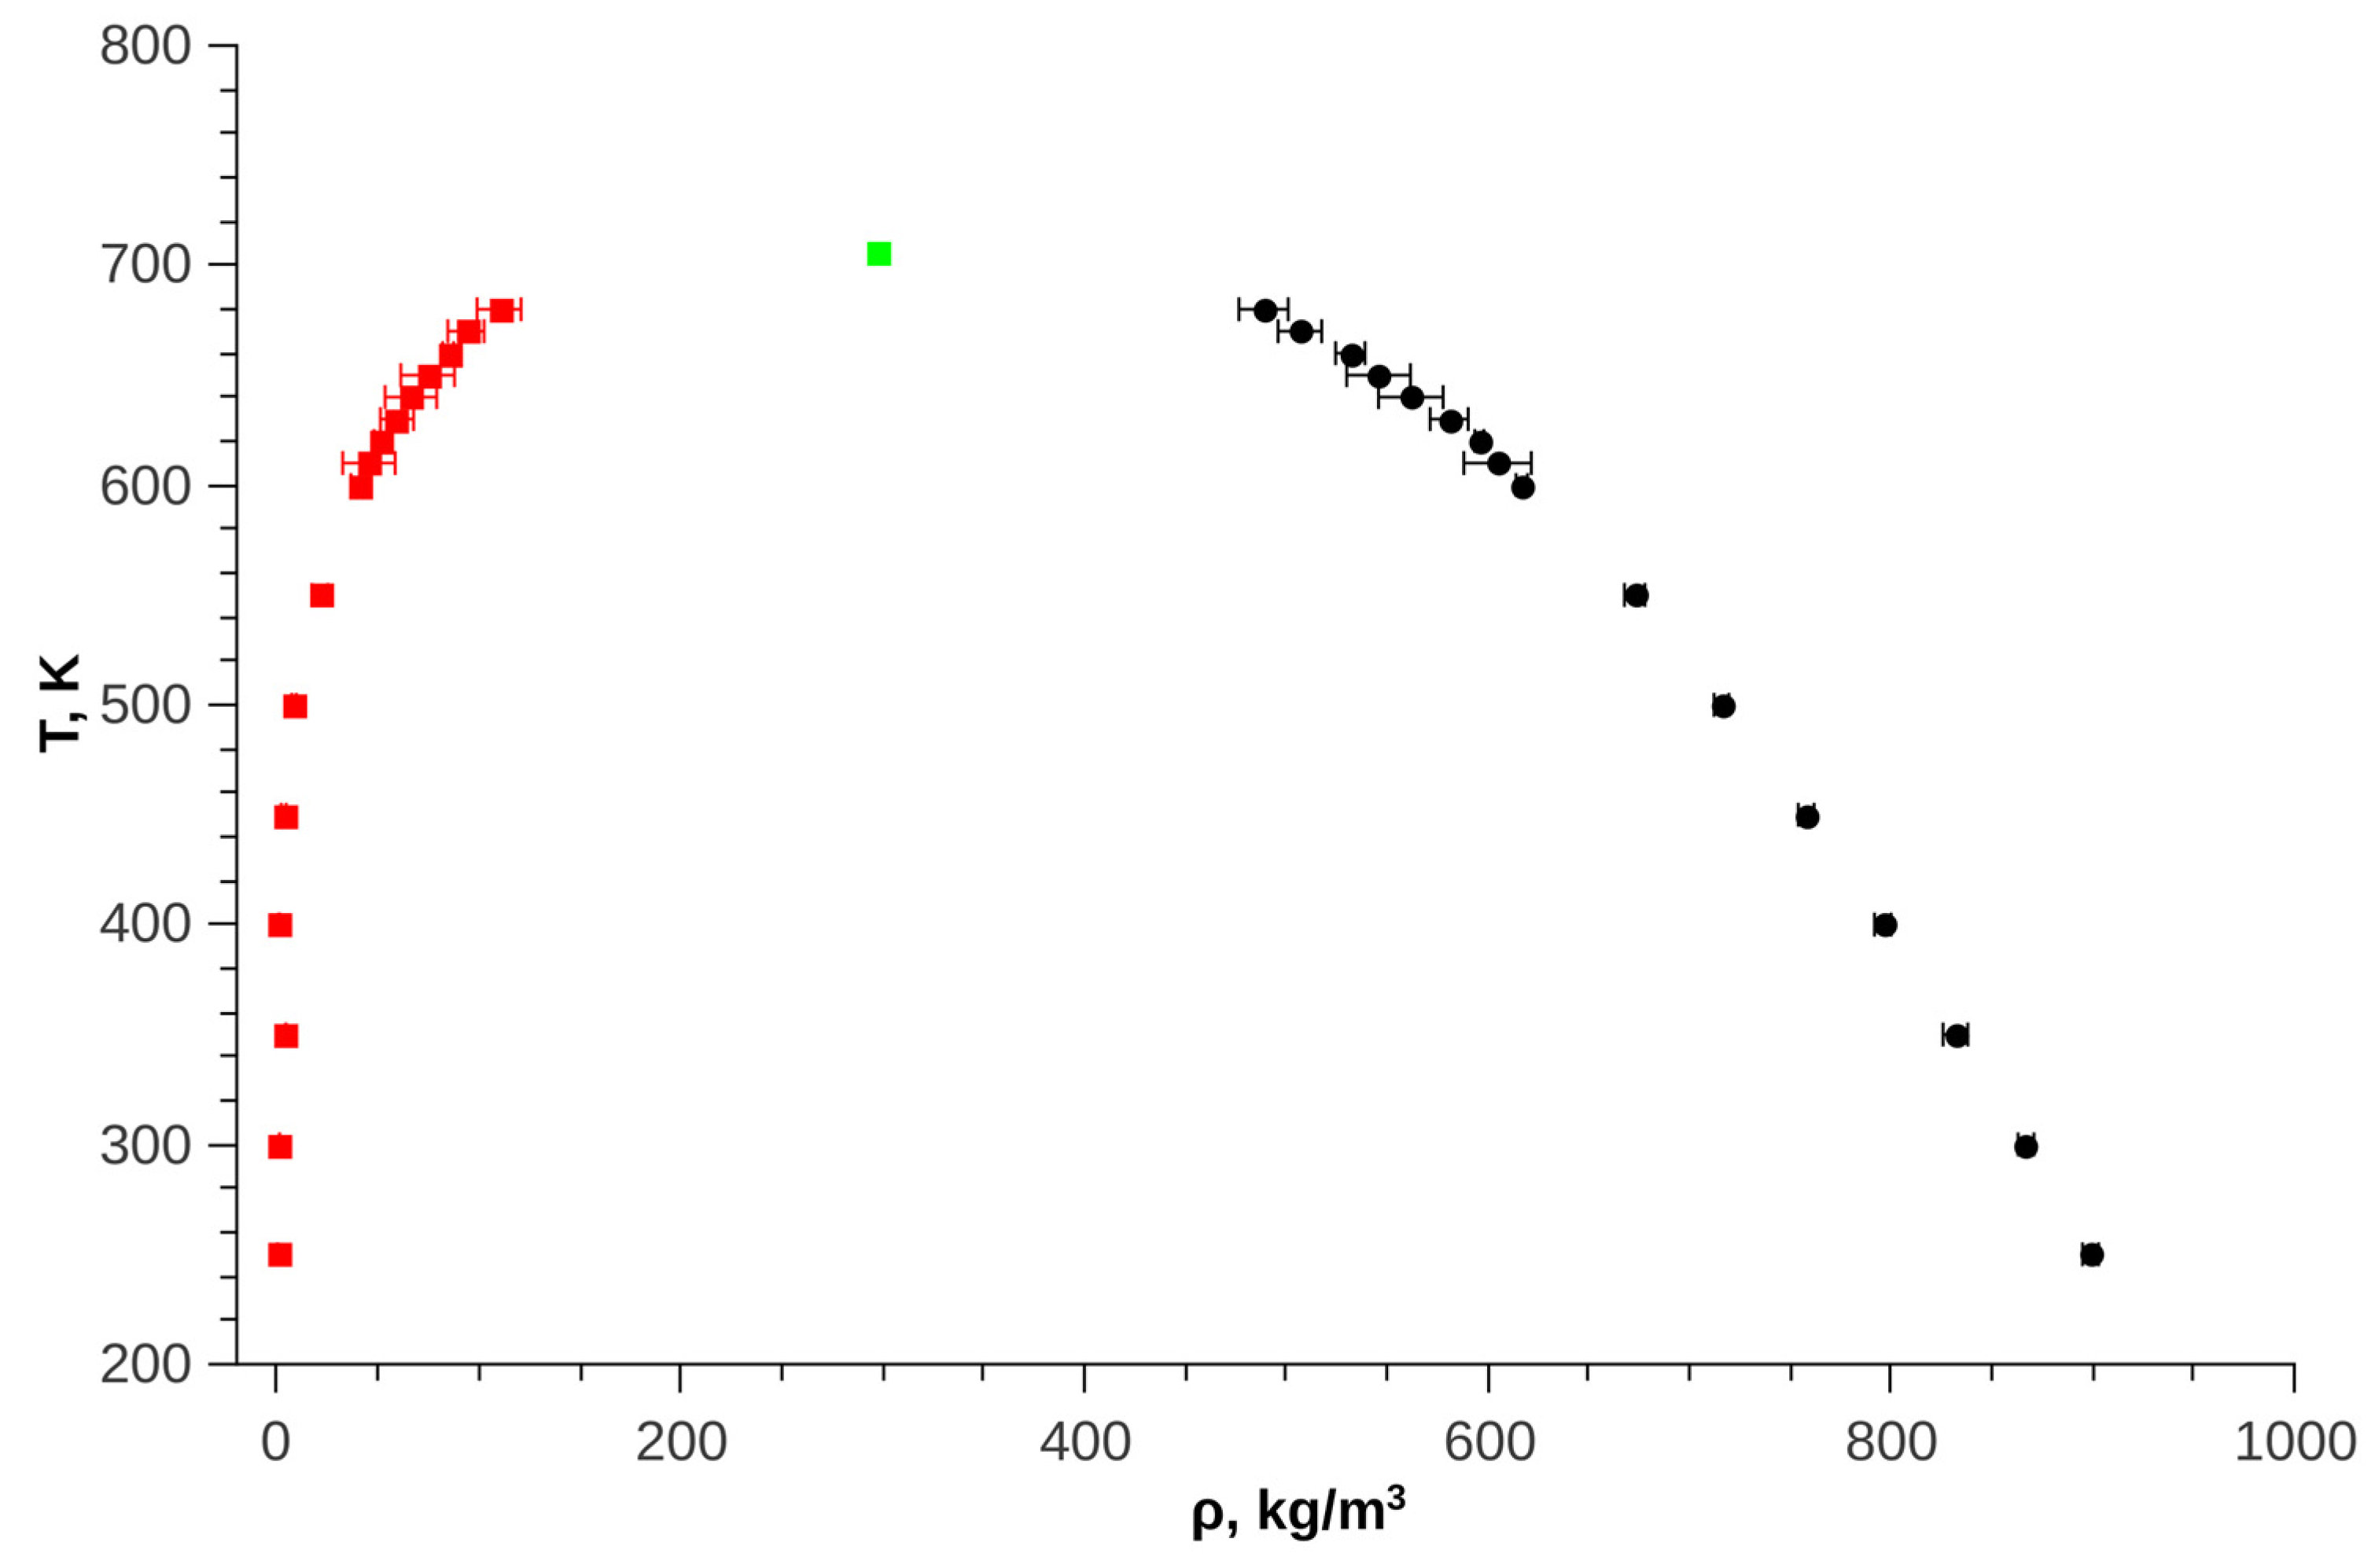
The obtained critical point parameter values (Tc = 706 K, ρc = 298 kg/m3, pc = 34.15 bar) are consistent with the values used in the equations of state [40] (Tc = 703.6 K, ρc = 288 kg/m3, pc = 32.0 bar). Currently, the direct use of molecular dynamics and Monte Carlo methods in chemical engineering calculations is limited by computational power. However, the use of these methods is justified when adjusting the parameters of “classical” models of phase equilibrium. In case of an insufficient amount of experimental data, it is possible to adjust the parameters using existing experimental data and supplement them with the results of a numerical experiment.
Figure 5 shows the results of calculating the phase diagram of pure trans-decalin.
In Figure 6 comparison of calculated values of saturated vapor pressure with experimental values is shown. A good agreement between experimental and calculated data can be seen.
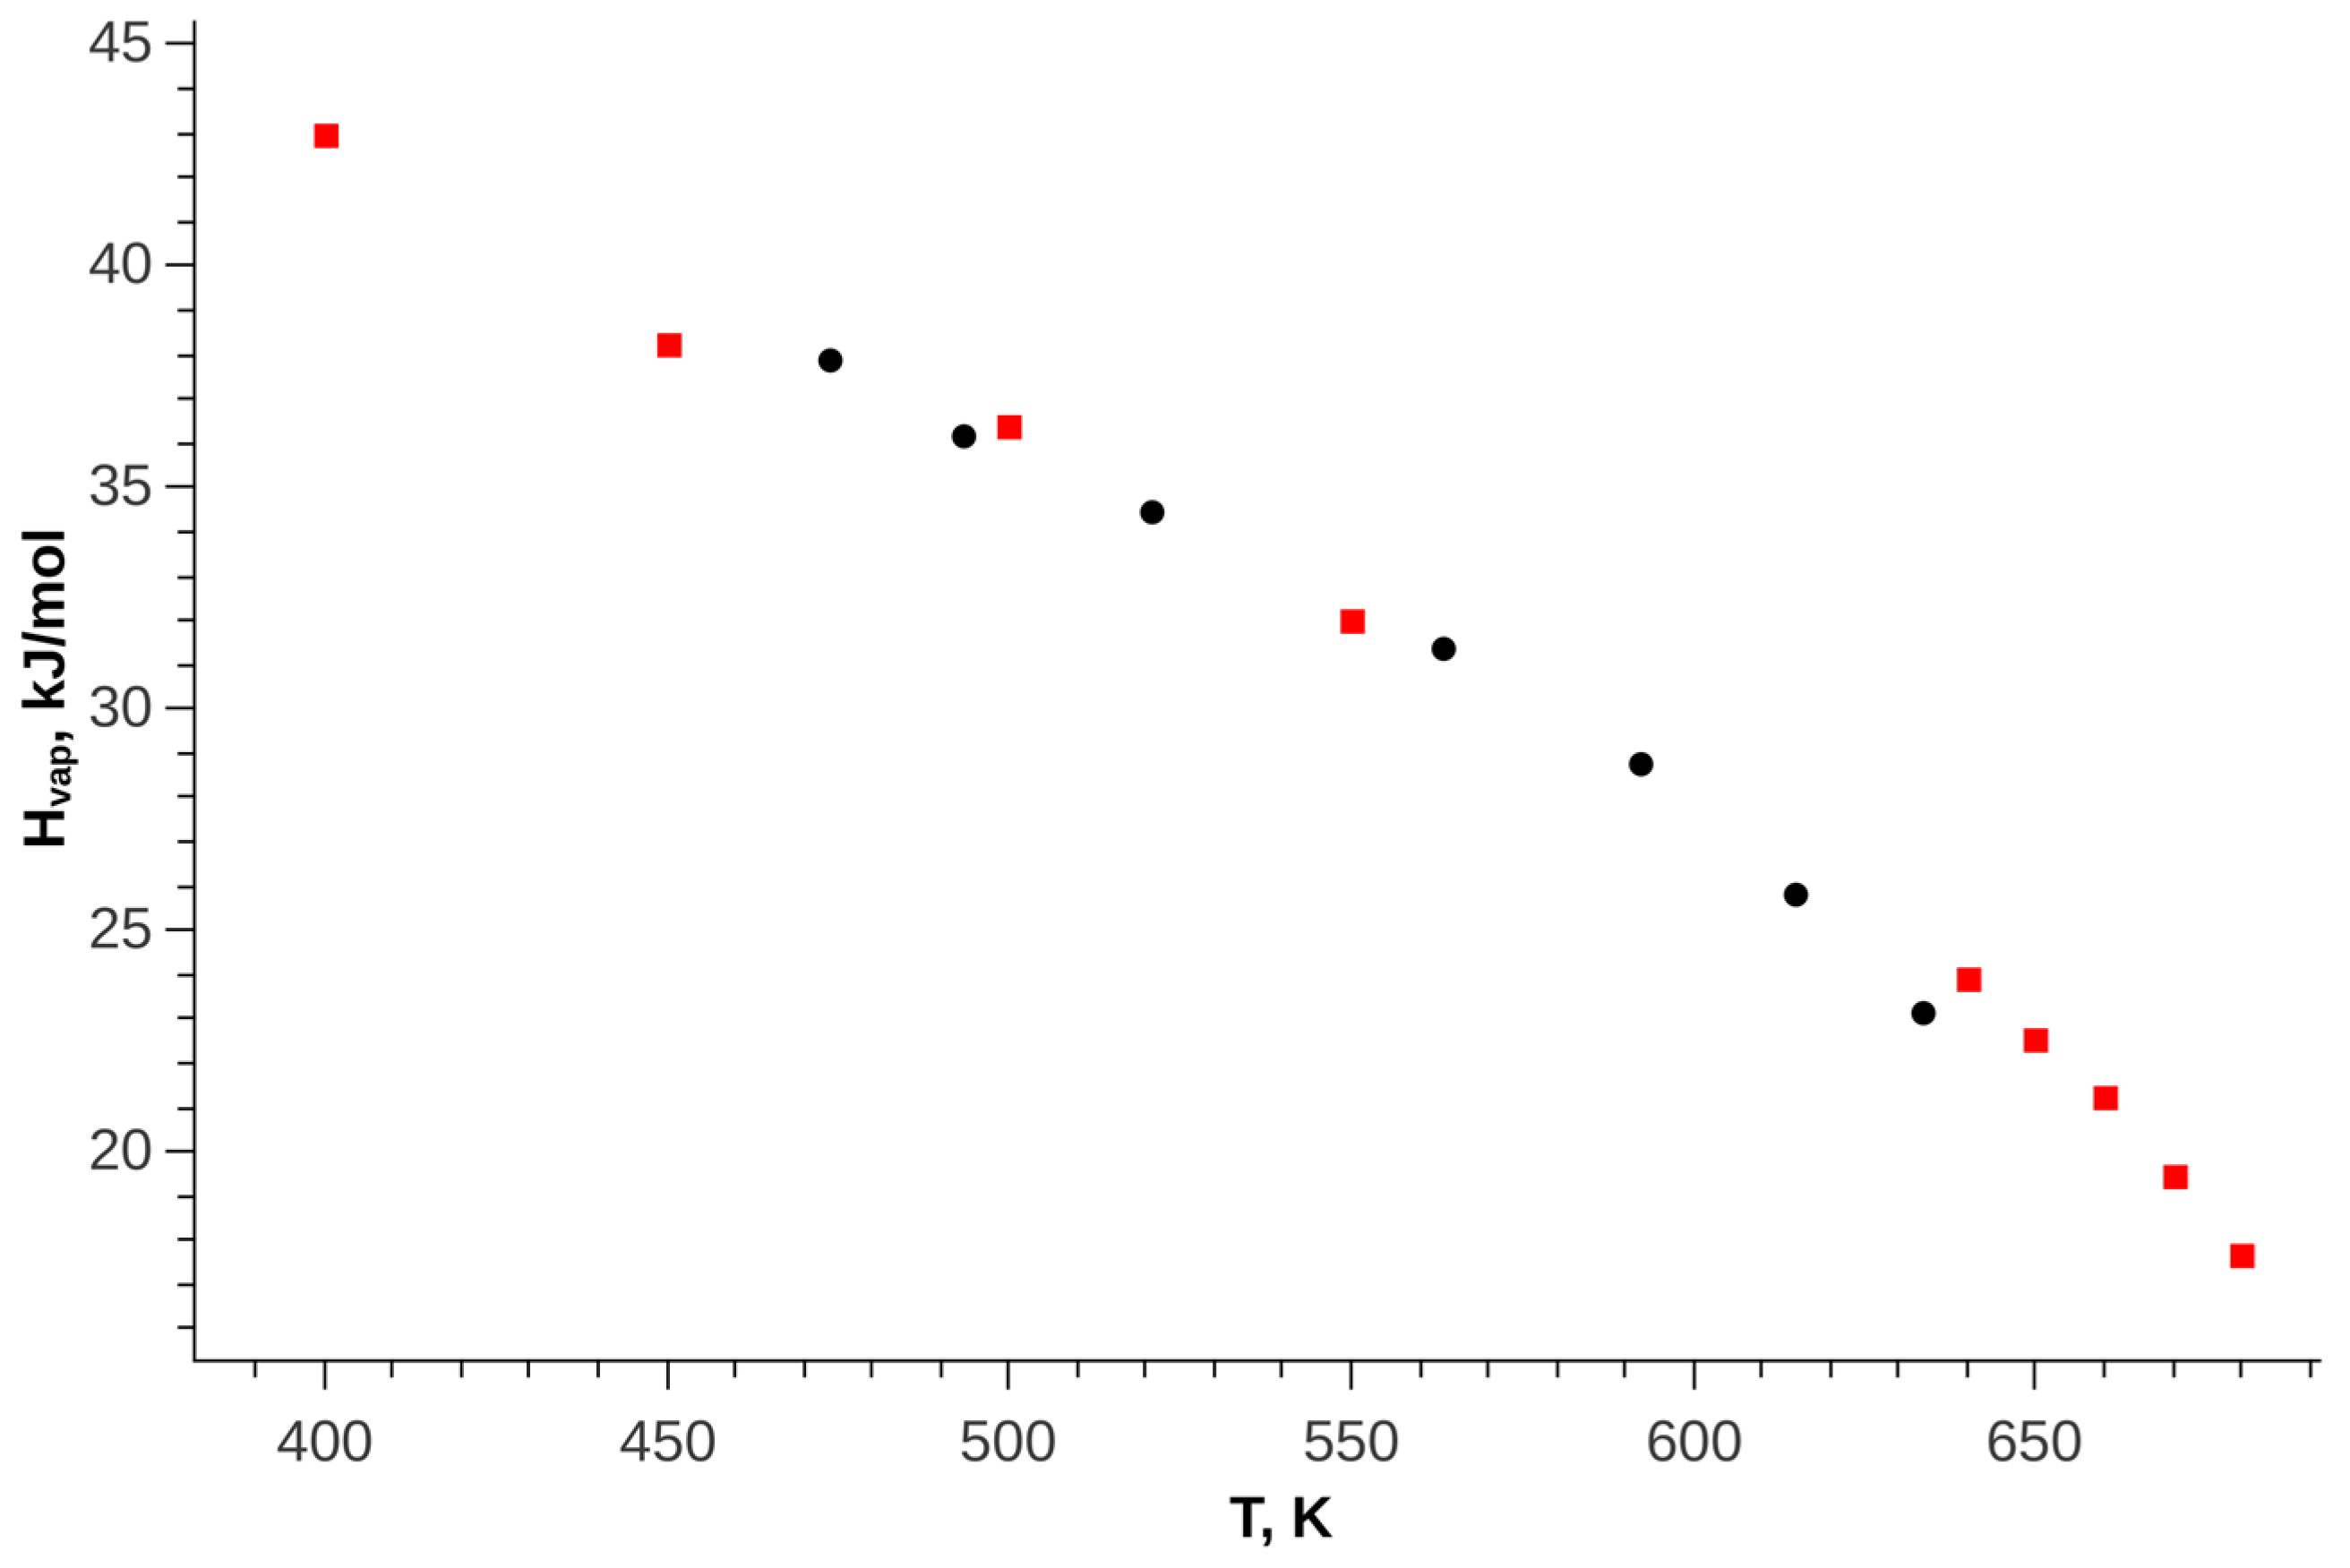
Figure 7 shows a comparison of the enthalpy of vaporization of trans-decalin with experimental data.
The densities of pure trans-decalin in the single-phase region were calculated at different temperatures and pressures. The comparison with experimental data [41] is given in Table 4. It can be seen that in the temperature range from 303.15 to 343.15 K, the found parameters show a slight overestimation of the density. The average deviation from the experimental data is 0.89%., the maximum is 1.15%.
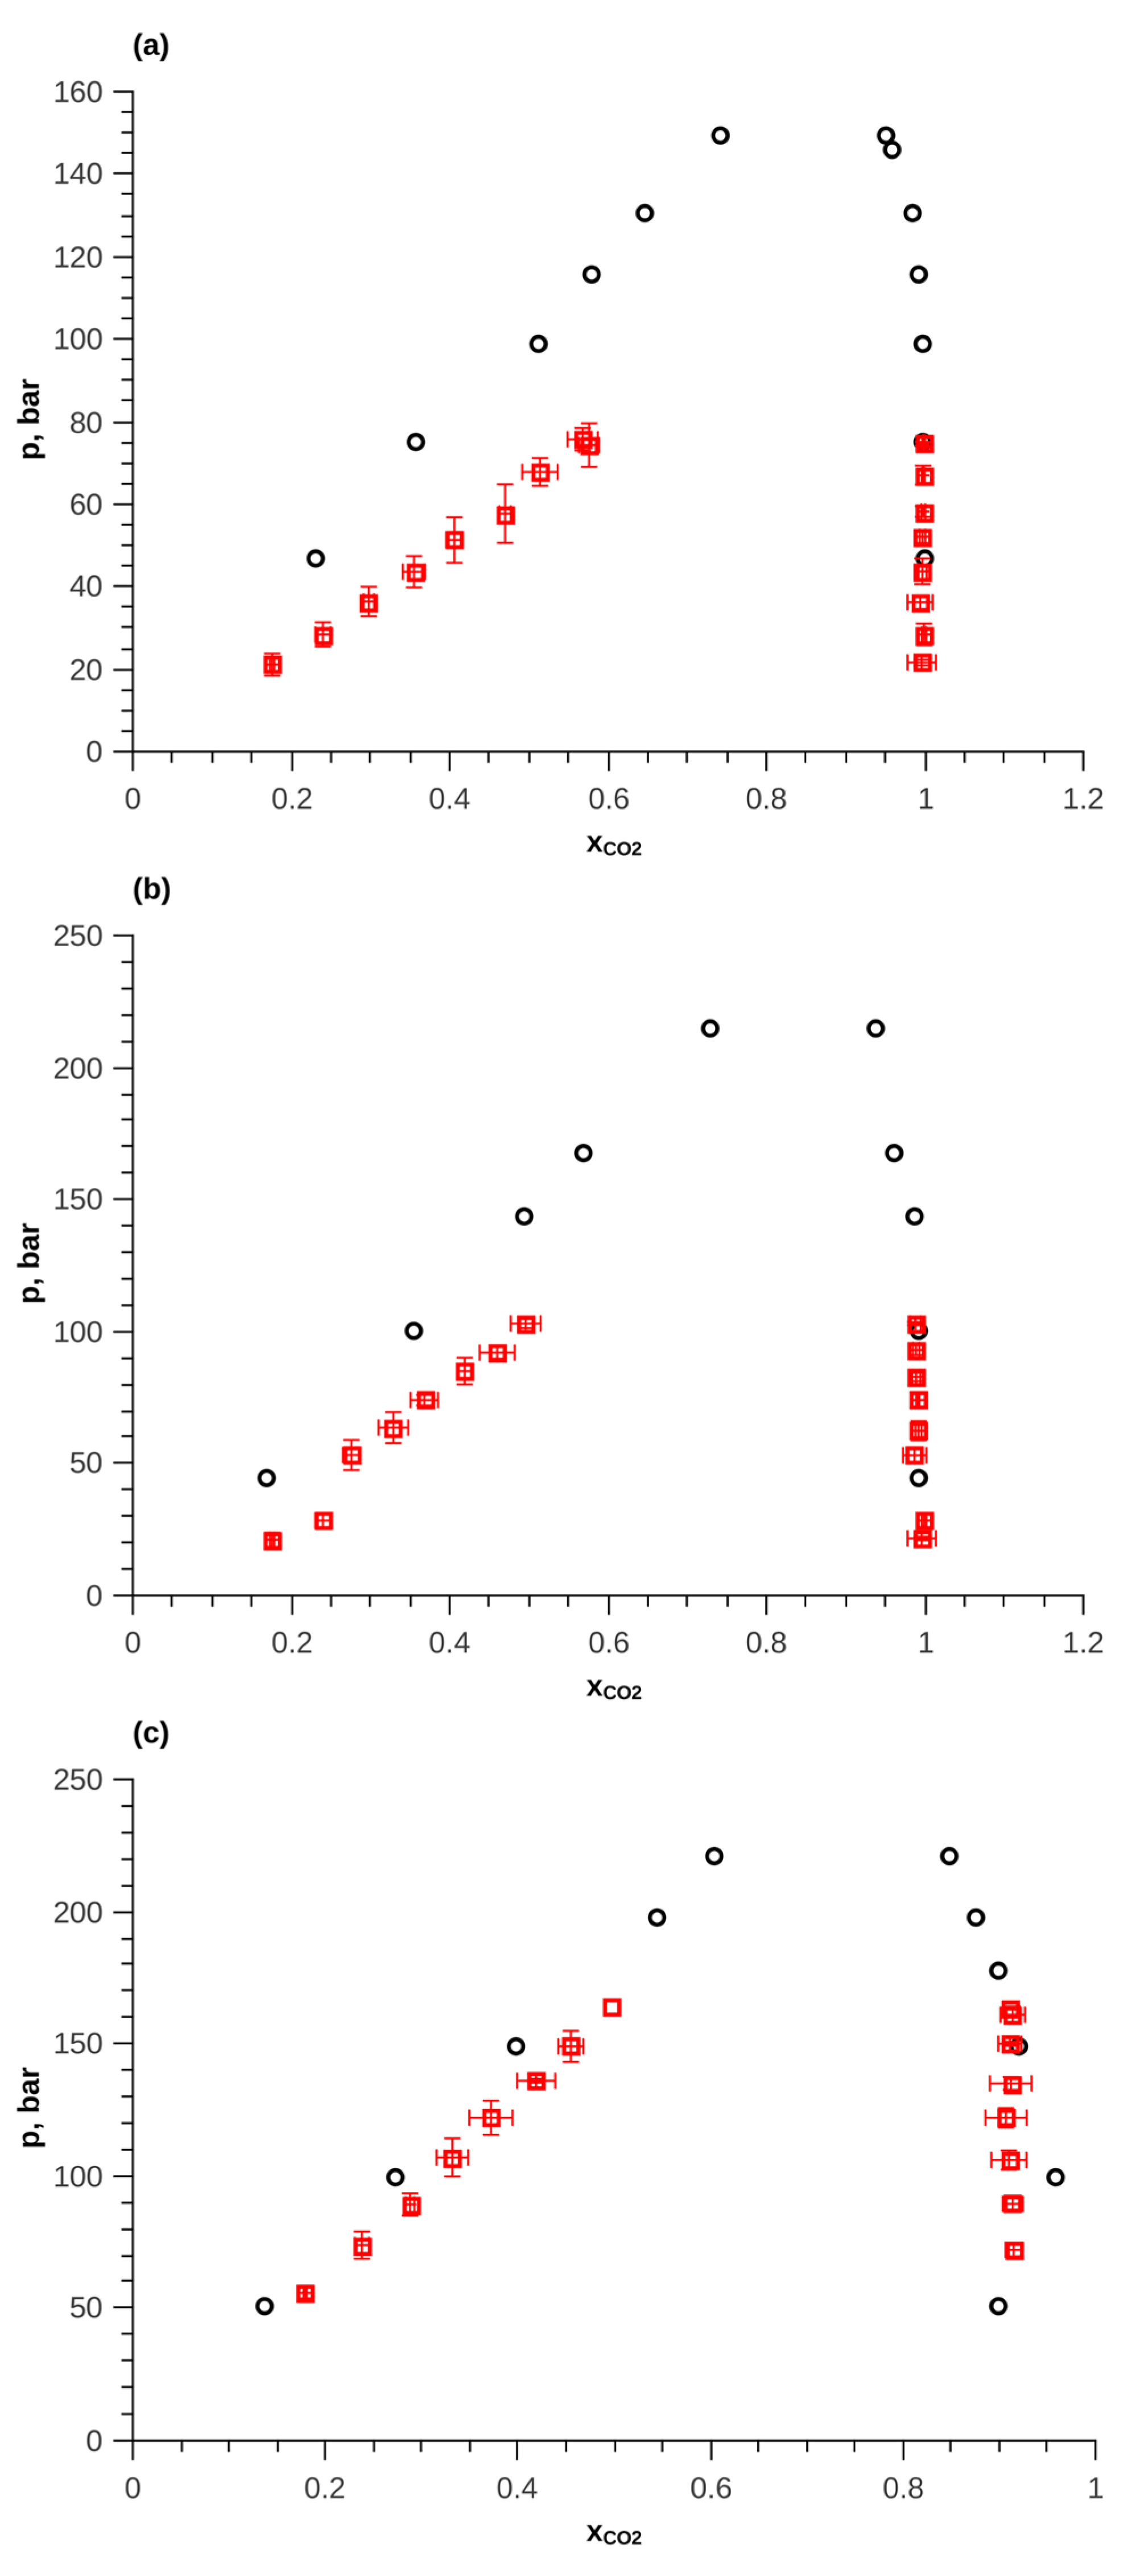
The found parameters of the trans-decalin force field were used to calculate the phase equilibrium of the CO2—trans-decalin mixture. To describe the intermolecular interactions of CO2, the TraPPE [42] force field was used, which provides high accuracy for the calculation of thermodynamic properties on saturation lines [43]. A comparison of the results of calculations of p–x,y diagrams with experimental data [44] is presented in Figure 8. The qualitative agreement of the results with the experimental data is visible. In a quantitative comparison, the obtained parameters show an underestimation of pressure. At a temperature of 345.4 K, a decrease in pressure by approximately 30% is observed. With increasing temperature, the deviation decreases to 5%. Since the force fields used provide high accuracy in calculating the saturated vapor pressure of pure trans-decalin and CO2, the increase in the error of calculating such pressure for a two-component system can only be explained by an incorrect description of the cross-interactions of trans-decalin molecules with CO2 molecules. Most likely, this is due to the presence of a small charge in the decalin molecule, the contribution of which is significantly manifested when interacting with a highly polar CO2 molecule. For example, in [45] proposed model with the additional charges in the ethylene molecule. This improved the description of phase equilibrium in mixtures with water and CO2. The description of phase equilibrium can also be improved by using corrective parameters in the mixing rule. Studying this phenomenon may be the subject of future research.
5. Conclusions
In this work, the parameters of intermolecular interaction of the CH group of trans-decalin were determined. The parameters were fitted to correctly describe the vapor pressure and density of pure trans-decalin. Calculations of various thermodynamic properties of trans-decalin on saturation lines and in the single-phase region, as well as the coordinates of the critical point, showed the high accuracy of the obtained results.
Using the found parameters, the phase equilibrium in the CO2—trans-decalin mixture was characterized. At a temperature of 345.5 K, the parameter values deviate in pressure for this mixture by about 30%. However, at higher temperatures, the deviation from the experimental values decreases.
In the force field that was utilized in this work, uncharged force interaction centers were used. Although there should be weak induced charges in the trans-decalin molecule. These charges can be found using quantum chemistry methods, which is the subject of future research.
Author Contributions
Software, investigation, writing—original draft, visualization I.P.A.; investigation, validation, writing—review and editing A.V.K. All authors have read and agreed to the published version of the manuscript.
Funding
The work was financially supported by the Ministry of Science and Higher Education of the Russian Federation within the framework of the state assignment No. 075-01508-23-00 of 29 December 2022 (Supercritical fluid technologies in polymer processing (FZSG-2023-0007)).
Data Availability Statement
Where no new data were created.
Conflicts of Interest
The authors declare no conflict of interest.
References
- Jorgensen, W.L.; Madura, J.D.; Swenson, C.J. Optimized Intermolecular Potential Functions for Liquid Hydrocarbons. J. Am. Chem. Soc. 1984, 106, 6638–6646. [Google Scholar] [CrossRef]
- Jorgensen, W.L.; Maxwell, D.S.; Tirado-Rives, J. Development and Testing of the OPLS All-Atom Force Field on Conformational Energetics and Properties of Organic Liquids. J. Am. Chem. Soc. 1996, 118, 11225–11236. [Google Scholar] [CrossRef]
- Robertson, M.J.; Tirado-Rives, J.; Jorgensen, W.L. Improved Peptide and Protein Torsional Energetics with the OPLS-AA Force Field. J. Chem. Theory Comput. 2015, 11, 3499–3509. [Google Scholar] [CrossRef] [PubMed]
- Vanommeslaeghe, K.; Hatcher, E.; Acharya, C.; Kundu, S.; Zhong, S.; Shim, J.; Darian, E.; Guvench, O.; Lopes, P.; Vorobyov, I.; et al. CHARMM General Force Field: A Force Field for Drug-like Molecules Compatible with the CHARMM All-Atom Additive Biological Force Fields. J. Comput. Chem. 2009, 31, 671–690. [Google Scholar] [CrossRef] [PubMed]
- Vanommeslaeghe, K.; Raman, E.P.; MacKerell, A.D. Automation of the CHARMM General Force Field (CGenFF) II: Assignment of Bonded Parameters and Partial Atomic Charges. J. Chem. Inf. Model. 2012, 52, 3155–3168. [Google Scholar] [CrossRef] [PubMed]
- Martin, M.G.; Siepmann, J.I. Transferable Potentials for Phase Equilibria. 1. United-Atom Description of n-Alkanes. J. Phys. Chem. B 1998, 102, 2569–2577. [Google Scholar] [CrossRef]
- Martin, M.G.; Siepmann, J.I. Novel Configurational-Bias Monte Carlo Method for Branched Molecules. Transferable Potentials for Phase Equilibria. 2. United-Atom Description of Branched Alkanes. J. Phys. Chem. B 1999, 103, 4508–4517. [Google Scholar] [CrossRef]
- Chen, B.; Siepmann, J.I. Transferable Potentials for Phase Equilibria. 3. Explicit-Hydrogen Description of Normal Alkanes. J. Phys. Chem. B 1999, 103, 5370–5379. [Google Scholar] [CrossRef]
- Wick, C.D.; Martin, M.G.; Siepmann, J.I. Transferable Potentials for Phase Equilibria. 4. United-Atom Description of Linear and Branched Alkenes and Alkylbenzenes. J. Phys. Chem. B 2000, 104, 8008–8016. [Google Scholar] [CrossRef]
- Klinov, A.; Anashkin, I. Diffusion in Binary Aqueous Solutions of Alcohols by Molecular Simulation. Processes 2019, 7, 947. [Google Scholar] [CrossRef]
- Aguado, J.; Serrano, D.P.; Vicente, G.; Sánchez, N. Effect of Decalin Solvent on the Thermal Degradation of HDPE. J. Polym. Environ. 2006, 14, 375–384. [Google Scholar] [CrossRef]
- Melucci, D.; Contado, C.; Mingozzi, I.; Reschiglian, P.; Dondi, F. Properties of Decalin as a Solvent in Thermal Field-Flow Fractionation. Chromatographia 1999, 49, 131–136. [Google Scholar] [CrossRef]
- Verruto, V.J.; Kilpatrick, P.K. Preferential Solvent Partitioning within Asphaltenic Aggregates Dissolved in Binary Solvent Mixtures. Energy Fuels 2007, 21, 1217–1225. [Google Scholar] [CrossRef]
- Khabriev, I.S.; Khairutdinov, V.F.; Gumerov, F.M.; Khuzakhanov, R.M.; Garipov, R.M.; Abdulagatov, I.M. VLE Properties and the Critical Parameters of Ternary Mixture of CO2+Toluene/Dichloromethane Involved in the SEDS Precipitation Process. J. Mol. Liq. 2021, 337, 116371. [Google Scholar] [CrossRef]
- Ghaderi, R.; Artursson, P.; Carlfors, J. Preparation of Biodegradable Microparticles Using Solution-Enhanced Dispersion by Supercritical Fluids (SEDS). Pharm. Res. 1999, 16, 676–681. [Google Scholar] [CrossRef]
- Eremin, R.; Kholmurodov, K.; Avdeev, M.; Petrenko, V.; Yasuoka, K. Molecular Dynamics Simulations on Trans- and Cis-Decalins: The Effect of Partial Atomic Charges and Adjustment of “Real Densities”. Int. J. Chem. 2012, 4, p14. [Google Scholar] [CrossRef]
- Morrow, B.H.; Harrison, J.A. Evaluating the Ability of Selected Force Fields to Simulate Hydrocarbons as a Function of Temperature and Pressure Using Molecular Dynamics. Energy Fuels 2021, 35, 3742–3752. [Google Scholar] [CrossRef]
- Morrow, B.H.; Harrison, J.A. Vapor–Liquid Equilibrium Simulations of Hydrocarbons Using Molecular Dynamics with Long-Range Lennard-Jones Interactions. Energy Fuels 2019, 33, 848–858. [Google Scholar] [CrossRef]
- Keasler, S.J.; Charan, S.M.; Wick, C.D.; Economou, I.G.; Siepmann, J.I. Transferable Potentials for Phase Equilibria–United Atom Description of Five- and Six-Membered Cyclic Alkanes and Ethers. J. Phys. Chem. B 2012, 116, 11234–11246. [Google Scholar] [CrossRef] [PubMed]
- Mollahosseini, A.; Abdelrasoul, A. Molecular Dynamics Simulation for Membrane Separation and Porous Materials: A Current State of Art Review. J. Mol. Graph. Model. 2021, 107, 107947. [Google Scholar] [CrossRef]
- Venable, R.M.; Krämer, A.; Pastor, R.W. Molecular Dynamics Simulations of Membrane Permeability. Chem. Rev. 2019, 119, 5954–5997. [Google Scholar] [CrossRef]
- Wadhwa, R.; Yadav, N.S.; Katiyar, S.P.; Yaguchi, T.; Lee, C.; Ahn, H.; Yun, C.-O.; Kaul, S.C.; Sundar, D. Molecular Dynamics Simulations and Experimental Studies Reveal Differential Permeability of Withaferin-A and Withanone across the Model Cell Membrane. Sci. Rep. 2021, 11, 2352. [Google Scholar] [CrossRef]
- Allen, M.P.; Tildesley, D.J. Computer Simulation of Liquids; Clarendon Press: Oxford, UK, 1989; ISBN 0-19-855645-4. [Google Scholar]
- Fincham, D.; Quirke, N.; Tildesley, D.J. Computer Simulation of Molecular Liquid Mixtures. I. A Diatomic Lennard-Jones Model Mixture for CO2/C2H6. J. Chem. Phys. 1986, 84, 4535–4546. [Google Scholar] [CrossRef]
- Chapela, G.A.; Martínez-Casas, S.E.; Varea, C. Square Well Orthobaric Densities via Spinodal Decomposition. J. Chem. Phys. 1987, 86, 5683–5688. [Google Scholar] [CrossRef]
- Panagiotopoulos, A.Z.; Quirke, N.; Stapleton, M.; Tildesley, D.J. Phase Equilibria by Simulation in the Gibbs Ensemble: Alternative Derivation, Generalization and Application to Mixture and Membrane Equilibria. Mol. Phys. 1988, 63, 527–545. [Google Scholar] [CrossRef]
- List of Software for Monte Carlo Molecular Modeling. Available online: https://en.wikipedia.org/wiki/List_of_software_for_Monte_Carlo_molecular_modeling (accessed on 1 July 2023).
- Martin, M.G. MCCCS Towhee: A Tool for Monte Carlo Molecular Simulation. Mol. Simul. 2013, 39, 1212–1222. [Google Scholar] [CrossRef]
- Glass, C.W.; Reiser, S.; Rutkai, G.; Deublein, S.; Köster, A.; Guevara-Carrion, G.; Wafai, A.; Horsch, M.; Bernreuther, M.; Windmann, T.; et al. Ms 2: A Molecular Simulation Tool for Thermodynamic Properties, New Version Release. Comput. Phys. Commun. 2014, 185, 3302–3306. [Google Scholar] [CrossRef]
- Nejahi, Y.; Barhaghi, M.S.; Schwing, G.; Schwiebert, L.; Potoff, J. Update 2.70 to “GOMC: GPU Optimized Monte Carlo for the Simulation of Phase Equilibria and Physical Properties of Complex Fluids”. SoftwareX 2021, 13, 100627. [Google Scholar] [CrossRef]
- Nejahi, Y.; Soroush Barhaghi, M.; Mick, J.; Jackman, B.; Rushaidat, K.; Li, Y.; Schwiebert, L.; Potoff, J. GOMC: GPU Optimized Monte Carlo for the Simulation of Phase Equilibria and Physical Properties of Complex Fluids. SoftwareX 2019, 9, 20–27. [Google Scholar] [CrossRef]
- Available online: https://elibrary.ru/item.asp?id=45822330 (accessed on 1 July 2023).
- Martínez, L.; Andrade, R.; Birgin, E.G.; Martínez, J.M. PACKMOL: A Package for Building Initial Configurations for Molecular Dynamics Simulations. J. Comput. Chem. 2009, 30, 2157–2164. [Google Scholar] [CrossRef]
- Nezbeda, I. Simulations of Vapor–Liquid Equilibria: Routine versus Thoroughness. J. Chem. Eng. Data 2016, 61, 3964–3969. [Google Scholar] [CrossRef]
- Robinson, D.S.; Kidnay, A.J.; Yesavage, V.F. The Enthalpy of Trans-Decalin between 360 and 700 K and at Pressures to 10.3 MPa. J. Chem. Thermodyn. 1985, 17, 855–864. [Google Scholar] [CrossRef]
- Seyer, W.F.; Mann, C.W. The Vapor Pressures of Cis- and Trans-Decahydronaphthalene. J. Am. Chem. Soc. 1945, 67, 328–329. [Google Scholar] [CrossRef]
- Camin, D.L.; Rossini, F.D. Physical Properties of Fourteen API Research Hydrocarbons, C9 to C15. J. Phys. Chem. 1955, 59, 1173–1179. [Google Scholar] [CrossRef]
- Densities of Polycyclic Hydrocarbons; Hall, K.R.; Marsh, K.N. (Eds.) Springer: Berlin/Heidelberg, Germany, 1999; Volume 8, ISBN 978-3-540-65162-8. [Google Scholar]
- Errington, J.R.; Panagiotopoulos, A.Z. Phase Equilibria of the Modified Buckingham Exponential-6 Potential from Hamiltonian Scaling Grand Canonical Monte Carlo. J. Chem. Phys. 1998, 109, 1093–1100. [Google Scholar] [CrossRef]
- Poling, B.E.; Prausnitz, J.M.; O’Connell, J.P. The Properties of Gases and Liquids, 5th ed.; McGraw-Hill: New York, NY, USA, 2001; ISBN 978-0-07-011682-5. [Google Scholar]
- Miyake, Y.; Baylaucq, A.; Zéberg-Mikkelsen, C.K.; Galliéro, G.; Ushiki, H.; Boned, C. Stereoisomeric Effects on Volumetric Properties under Pressure for the System Cis-+trans-Decalin. Fluid Phase Equilibria 2007, 252, 79–87. [Google Scholar] [CrossRef]
- Potoff, J.J.; Siepmann, J.I. Vapor–Liquid Equilibria of Mixtures Containing Alkanes, Carbon Dioxide, and Nitrogen. AIChE J. 2001, 47, 1676–1682. [Google Scholar] [CrossRef]
- Eggimann, B.L.; Sun, Y.; DeJaco, R.F.; Singh, R.; Ahsan, M.; Josephson, T.R.; Siepmann, J.I. Assessing the Quality of Molecular Simulations for Vapor–Liquid Equilibria: An Analysis of the TraPPE Database. J. Chem. Eng. Data 2020, 65, 1330–1344. [Google Scholar] [CrossRef]
- Inomata, H.; Arai, K.; Saito, S. Measurement of Vapor-Liquid Equilibria at Elevated Temperatures and Pressures Using a Flow Type Apparatus. Fluid Phase Equilibria 1986, 29, 225–232. [Google Scholar] [CrossRef]
- Shah, M.S.; Siepmann, J.I.; Tsapatsis, M. Transferable Potentials for Phase Equilibria. Improved United-atom Description of Ethane and Ethylene. AIChE J. 2017, 63, 5098–5110. [Google Scholar] [CrossRef]
Figure 1.
Molecular structure of trans- and cis- decalin.

Figure 2.
Saturated vapor pressure of trans-decalin as a function of temperature at σ = 3.6 Å and various values of the parameter ε; symbols—simulation results, lines—experimental data.
Figure 2.
Saturated vapor pressure of trans-decalin as a function of temperature at σ = 3.6 Å and various values of the parameter ε; symbols—simulation results, lines—experimental data.

Figure 3.
Dependence of ε/kB on σ, found from saturated vapor pressure, points—simulation results, line—polynomial approximation.
Figure 3.
Dependence of ε/kB on σ, found from saturated vapor pressure, points—simulation results, line—polynomial approximation.

Figure 4.
Trans-decalin densities as a function of temperature at atmospheric pressure for different values of the parameter σ, the value of ε/kB was found in Figure 2. Symbols—simulation results, line—experimental data [38].

Figure 5.
Phase diagram of trans-decalin, green dot—critical point, red dots – vapor line, black dots—liquid line.
Figure 5.
Phase diagram of trans-decalin, green dot—critical point, red dots – vapor line, black dots—liquid line.

Figure 6.
Saturated vapor pressure of trans-decalin, black symbols—experimental data, circles—[35], squares—[37], diamonds—[36], red triangles—simulation results.

Figure 7.
The heat of vaporization on the saturation line, black circles—experimental data [36], red squares—simulation results.
Figure 7.
The heat of vaporization on the saturation line, black circles—experimental data [36], red squares—simulation results.

Figure 8.
p—x,y diagram of CO2—trans-decalin mixture; black circles—experimental data, red squares—simulation results with the found parameters. (a)—T = 345.4 K. (b)—T = 399.7 K. (c) T = 523.5 K.
Figure 8.
p—x,y diagram of CO2—trans-decalin mixture; black circles—experimental data, red squares—simulation results with the found parameters. (a)—T = 345.4 K. (b)—T = 399.7 K. (c) T = 523.5 K.


Table 1.
Intermolecular interaction parameters of trans-decalin.
| Interaction Site | σ, Å | ε/kB, K |
|---|---|---|
| CH (this paper) | 5.0 | 9.0 |
| CH2 | 3.91 | 52.5 |
Table 2.
Intramolecular interaction parameters of trans-decalin.
| Type | Parameter | Value | Unit |
|---|---|---|---|
| Bonds (fixed) | |||
| CH2—CH2 | b0 | 1.54 | Å |
| CH—CH | b0 | 1.54 | Å |
| CH2—CH | b0 | 1.54 | Å |
| CH2—CH—CH | θ0 kθ/kB | 114 62,500 | deg K/rad2 |
| CH2—CH2—CH | θ0 kθ/kB | 114 62,500 | deg K/rad2 |
| CH2—CH2—CH | θ0 kθ/kB | 114 62,500 | deg K/rad2 |
| ) | |||
| X—CH2—CH2-X | c0/kB c1/kB c2/kB c3/kB | 5073 6840 3509 63 | K K K K |
| X—CH2—CH-X | c0/kB c1/kB c2/kB c3/kB | 5073 6840 3509 63 | K K K K |
| X—CH—CH-X | c0/kB c1/kB c2/kB c3/kB | 5073 6840 3509 63 | K K K K |
* X—any site. —angle, —dihedral angle, b0, , , , ,—parameters.
Table 3.
Phase equilibrium conditions of pure trans-decalin.
| T, K | p, bar | Δp, bar | ρx, kg/m3 | Δρx, kg/m3 | ρy, kg/m3 | Δρy, kg/m3 | Hvap, kJ/mol | ΔHvap, kJ/mol |
|---|---|---|---|---|---|---|---|---|
| 400 | 0.24 | 0.05 | 796.28 | 4.11 | 1.03 | 0.20 | 42.99 | 11.63 |
| 450 | 0.84 | 0.30 | 758.26 | 3.91 | 3.23 | 1.20 | 38.23 | 11.63 |
| 500 | 2.34 | 0.29 | 715.85 | 3.65 | 8.41 | 1.11 | 36.40 | 1.45 |
| 550 | 6.04 | 0.96 | 672.88 | 5.07 | 21.25 | 3.95 | 32.01 | 1.60 |
| 600 | 11.28 | 1.23 | 617.35 | 2.82 | 40.35 | 3.86 | - | - |
| 610 | 12.72 | 2.71 | 604.77 | 16.72 | 45.53 | 12.96 | - | - |
| 620 | 14.23 | 0.87 | 596.46 | 2.24 | 52.00 | 3.97 | - | - |
| 630 | 16.07 | 1.57 | 580.66 | 9.43 | 59.40 | 8.22 | - | - |
| 640 | 17.93 | 2.09 | 562.16 | 16.05 | 66.34 | 12.84 | 23.95 | 0.39 |
| 650 | 19.89 | 2.03 | 545.94 | 15.80 | 74.62 | 13.34 | 22.58 | 0.32 |
| 660 | 22.22 | 0.50 | 532.17 | 7.29 | 84.78 | 2.71 | 21.23 | 0.52 |
| 670 | 24.09 | 1.28 | 506.69 | 10.79 | 93.63 | 8.97 | 19.47 | 0.68 |
| 680 | 26.96 | 0.96 | 489.08 | 12.19 | 110.23 | 10.87 | 17.68 | 0.34 |
Table 4.
Experimental (ex) and calculated (MC) density of trans-decalin as a function of pressure at various temperatures.
Table 4.
Experimental (ex) and calculated (MC) density of trans-decalin as a function of pressure at various temperatures.
| p, bar | T = 303.15 K | T = 323.15 K | T = 343.15 K | |||||||||
|---|---|---|---|---|---|---|---|---|---|---|---|---|
| ρex, kg/m3 | ρMC, kg/m3 | ΔρMC, kg/m3 | Relative Deviation% | ρex, kg/m3 | ρMC, kg/m3 | ΔρMC, kg/m3 | Relative Deviation% | ρex, kg/m3 | ρMC, kg/m3 | ΔρMC, kg/m3 | Relative Deviation% | |
| 1 | 862.1 | 867.3 | 1.7 | 0.60 | 847.1 | 854.8 | 1.9 | 0.90 | 832 | 838.2 | 5.3 | 0.74 |
| 100 | 868.7 | 874.0 | 2.6 | 0.60 | 854.4 | 862.0 | 2.1 | 0.88 | 840.1 | 846.7 | 2.9 | 0.78 |
| 200 | 874.6 | 881.9 | 2.1 | 0.83 | 861 | 868.4 | 2.8 | 0.86 | 847.4 | 855.7 | 2.1 | 0.97 |
| 300 | 880.3 | 886.7 | 2.9 | 0.73 | 867.1 | 874.7 | 2.1 | 0.87 | 854.1 | 862.4 | 3.3 | 0.96 |
| 400 | 885.6 | 893.5 | 2.4 | 0.88 | 872.8 | 882.0 | 4.2 | 1.04 | 860.3 | 869.7 | 3.1 | 1.08 |
| 500 | 890.6 | 899.1 | 1.8 | 0.95 | 878.3 | 887.1 | 1.0 | 1.00 | 866.1 | 874.9 | 2.0 | 1.00 |
| 600 | 895.3 | 903.0 | 1.8 | 0.85 | 883.4 | 892.6 | 3.8 | 1.03 | 871.5 | 881.6 | 2.7 | 1.15 |
Disclaimer/Publisher’s Note: The statements, opinions and data contained in all publications are solely those of the individual author(s) and contributor(s) and not of MDPI and/or the editor(s). MDPI and/or the editor(s) disclaim responsibility for any injury to people or property resulting from any ideas, methods, instructions or products referred to in the content. |
© 2023 by the authors. Licensee MDPI, Basel, Switzerland. This article is an open access article distributed under the terms and conditions of the Creative Commons Attribution (CC BY) license (https://creativecommons.org/licenses/by/4.0/).
Share and Cite
MDPI and ACS Style
Anashkin, I.P.; Klinov, A.V. Force Field for Calculation of the Vapor-Liquid Phase Equilibrium of trans-Decalin. ChemEngineering 2024, 8, 6. https://doi.org/10.3390/chemengineering8010006
AMA Style
Anashkin IP, Klinov AV. Force Field for Calculation of the Vapor-Liquid Phase Equilibrium of trans-Decalin. ChemEngineering. 2024; 8(1):6. https://doi.org/10.3390/chemengineering8010006
Chicago/Turabian StyleAnashkin, Ivan P., and Alexander V. Klinov. 2024. "Force Field for Calculation of the Vapor-Liquid Phase Equilibrium of trans-Decalin" ChemEngineering 8, no. 1: 6. https://doi.org/10.3390/chemengineering8010006