4.1. Test Problem 1
The main purposes of this first test case are: (i) to verify that we have correctly implemented the lookup table method (i.e., that it produces the same solutions as analytical evaluation of the nonlinear soil characteristics); (ii) to assess whether the lookup table method is robust (i.e., that it produces accurate solutions over a range of discretizations, as well as for varying numbers and distributions of lookup points); and (iii) to compare the computational efficiency and accuracy (mass balance error) of the lookup table approach against the analytical approach. This assessment is carried out by considering a one-dimensional vertical drainage through a layered soil of 2 m in depth from initially saturated conditions. Initially, the pressure head at the base of the column is reduced from 200 cm to 0 cm. During the subsequent drainage, for a duration of 12.15 d (1,050,000 s), a no flow boundary condition is imposed at the top, and a Dirichlet boundary condition is imposed at the base of the column. The domain of the soil column is parameterized by the van Genuchten relationships. The hydraulic properties of the soils are given in
Table 1. The soil layers have different saturated hydraulic conductivity (
Ks), but the same values for the van Genuchten parameters (
θs,
θr,
α and
n). The soil profile is Soil 1 for 0 < z < 80 cm and 140 cm < z < 200 cm and Soil 2 for 80 cm < z < 140 cm.
To obtain the analytical and lookup numerical solutions, the flow domain is discretized using two uniform grids consisting of 50 and 150 layers. The time discretizations are performed in a simple manner using a constant value
s and 1000 s. The numerical results for this problem are obtained using Picard iteration and with 31 and 151 as the number of lookup points (NLKP) distributed both uniformly and non-uniformly for each set of layer and time step discretizations.
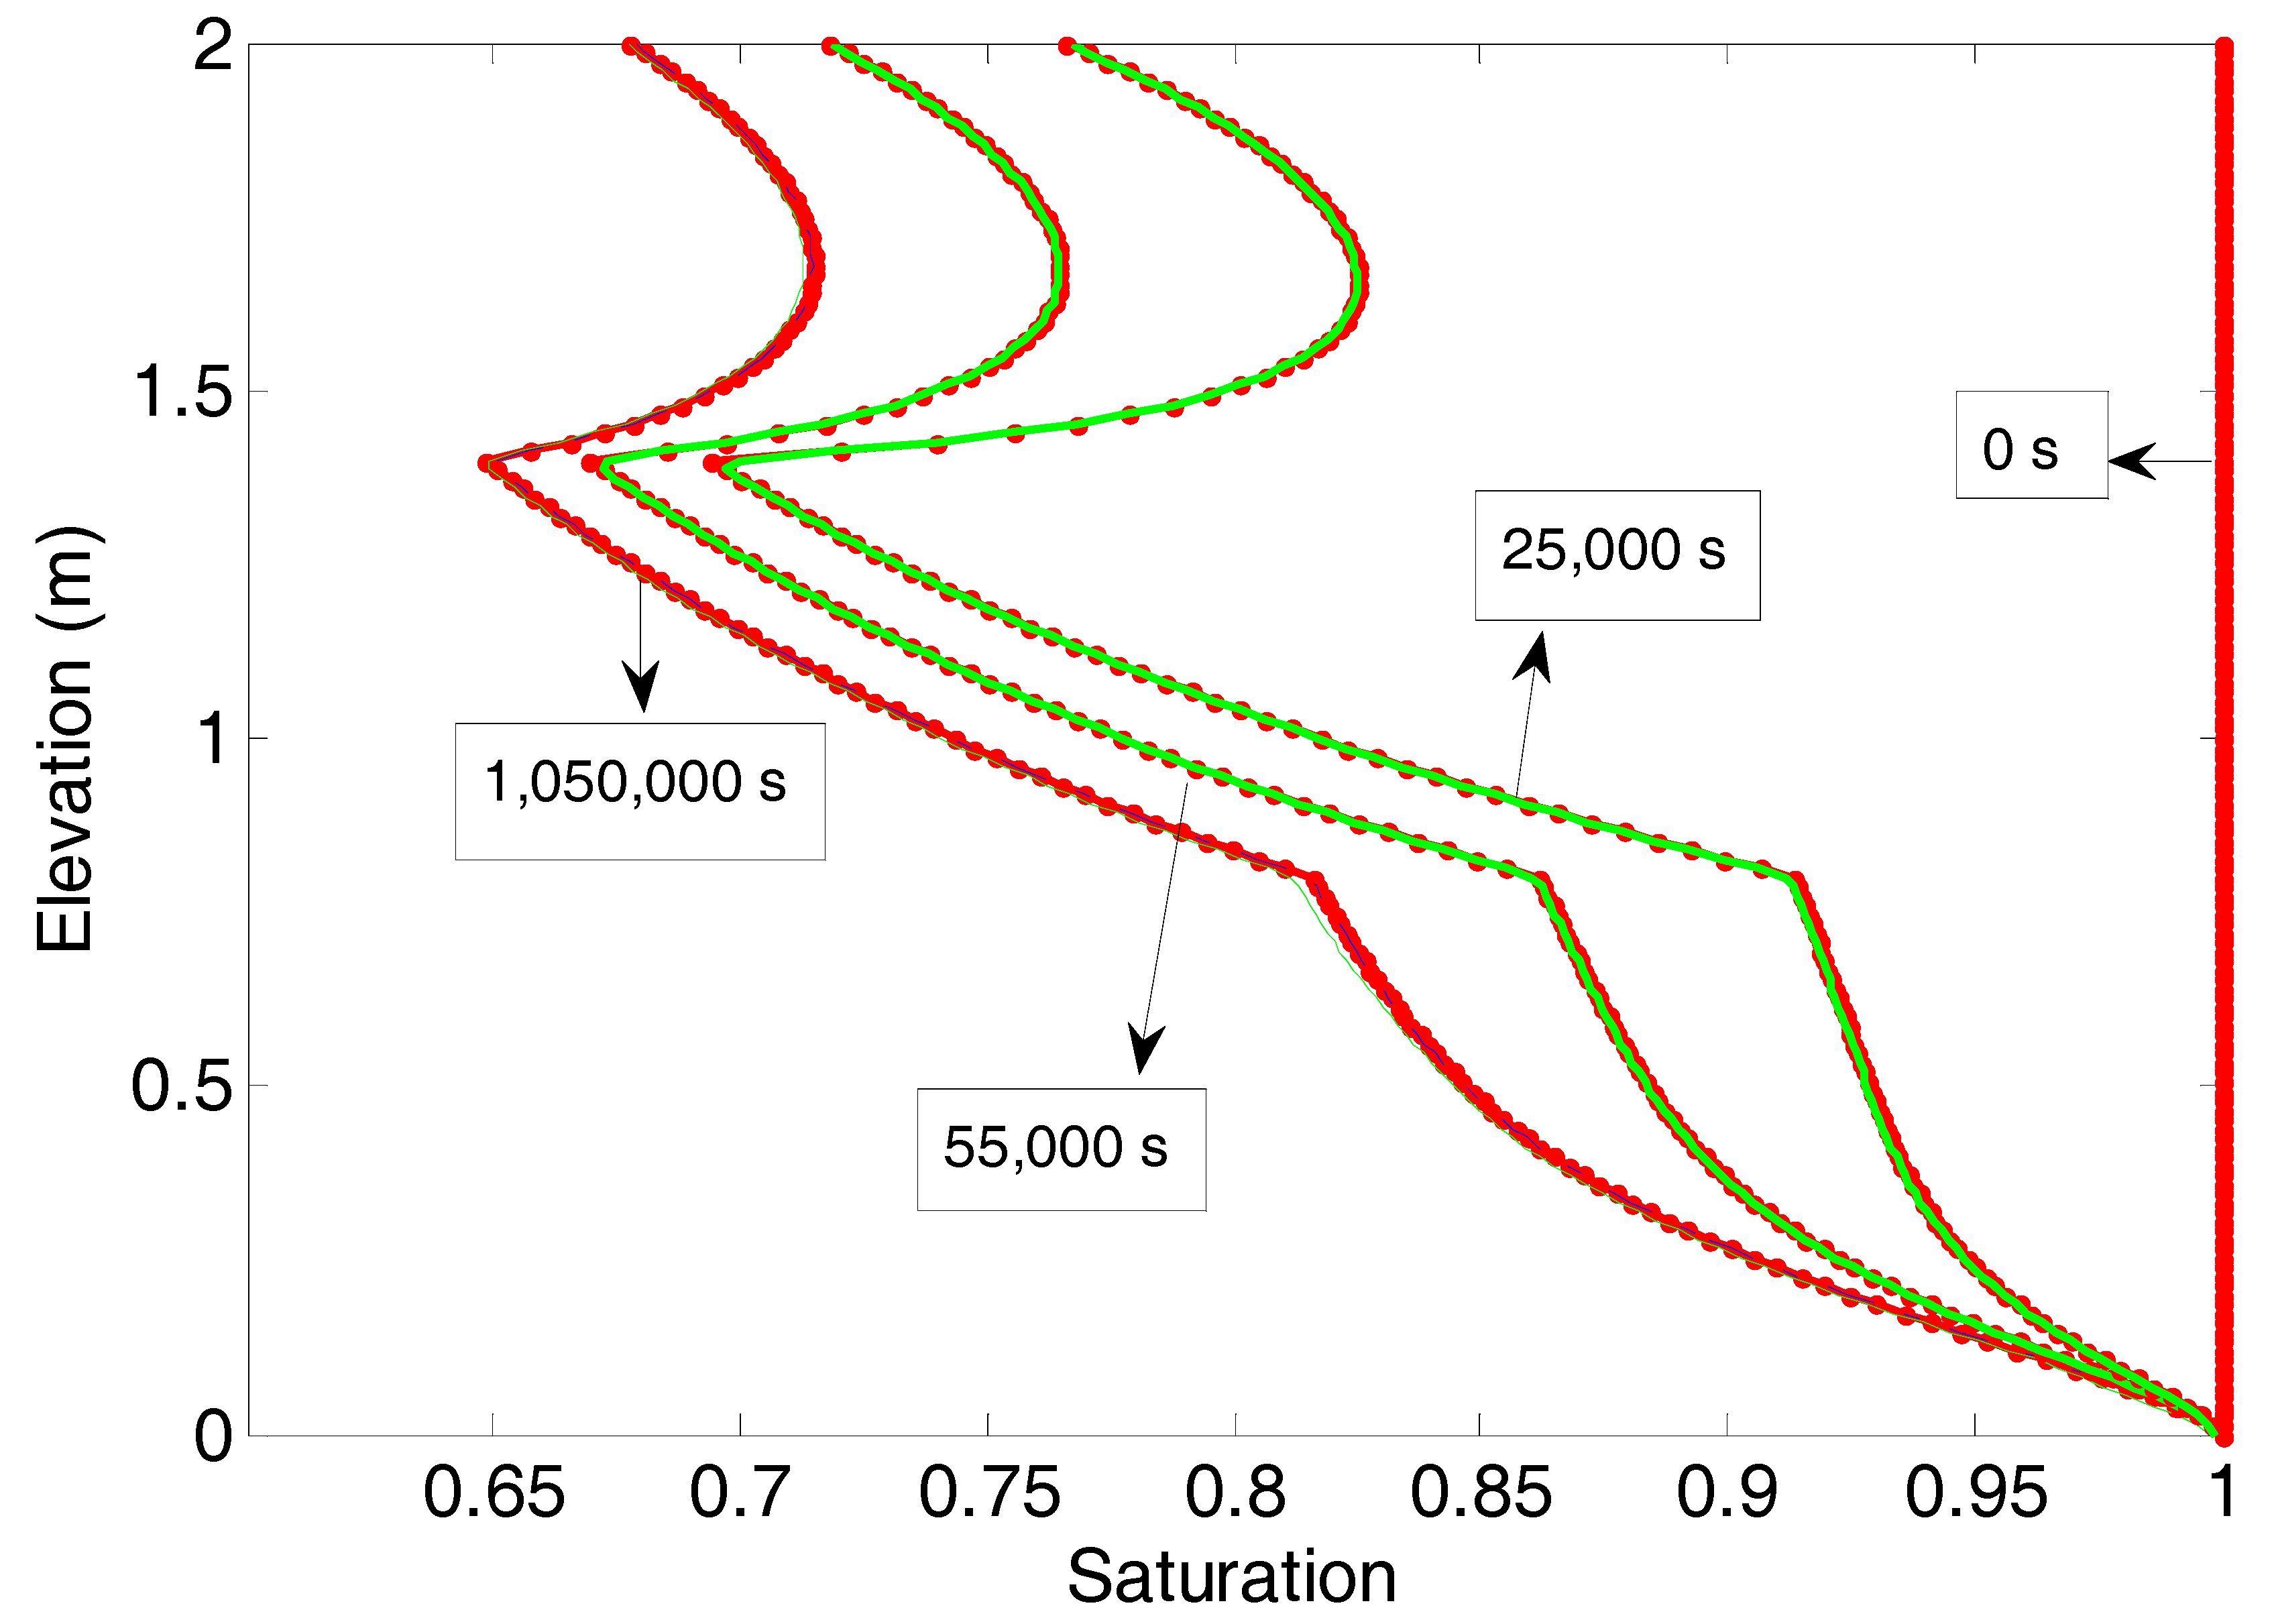
Figure 1 shows the saturation profiles at four different times, at the start of drainage (0 s), at 250,000 s (2.9 d), at 550,000 s (6.4 d) and at 1,050,000 s (12.15 d), for both the analytical and lookup table approaches for the 150-layer,
s discretization case. A very good agreement is exhibited between the analytical and lookup table results for both NLKP values, showing the accuracy of the lookup table approach even for a relatively small number of lookup points.
Table 2 shows that the lookup table approach performs consistently (high accuracy) for all combinations of temporal and grid discretization and the number and distribution of lookup points. It is also of the same order of efficiency as the analytical approach (slightly better than analytical for NLKP = 31 and slightly worse for NLKP = 151).
4.2. Test Problem 2
For Test Cases 2 and 3, we will focus solely on the lookup table approach in order to examine its performance under different configurations. Unlike the first test case, Test Problems 2 and 3 will feature heterogeneity not only in
Ks, but also in the retention curve parameters. Indeed, Test Problem 2 is identical to Test Problem 1, but with different layer thicknesses and with the addition of heterogeneity in the soil moisture retention curves, represented this time with the Brooks–Corey model. This problem is considered to be a challenging test for numerical methods because a sharp discontinuity in the moisture content occurs at the interface between two material layers [
41,
42,
43]. During downward draining, the middle coarse soil tends to restrict drainage from the upper fine soil, and high saturation levels are maintained in the upper fine soil for a considerable period of time. The hydraulic properties of the soils are given in
Table 3. The soil profile is Soil 1 for 0 < z < 60 cm and 120 cm < z < 200 cm and Soil 2 for 60 cm < z < 120 cm.
To compare the performance between the uniform and non-uniform distributions of lookup points, a fine mesh of 150 elements and a coarser mesh of 50 elements with two time step sizes ( = 100 s and 1000 s) and two sets of lookup table points (NLKP = 31 and 151) in the domain of the moisture curves are considered. Eight runs were performed for each of the iteration schemes (Picard and Newton).
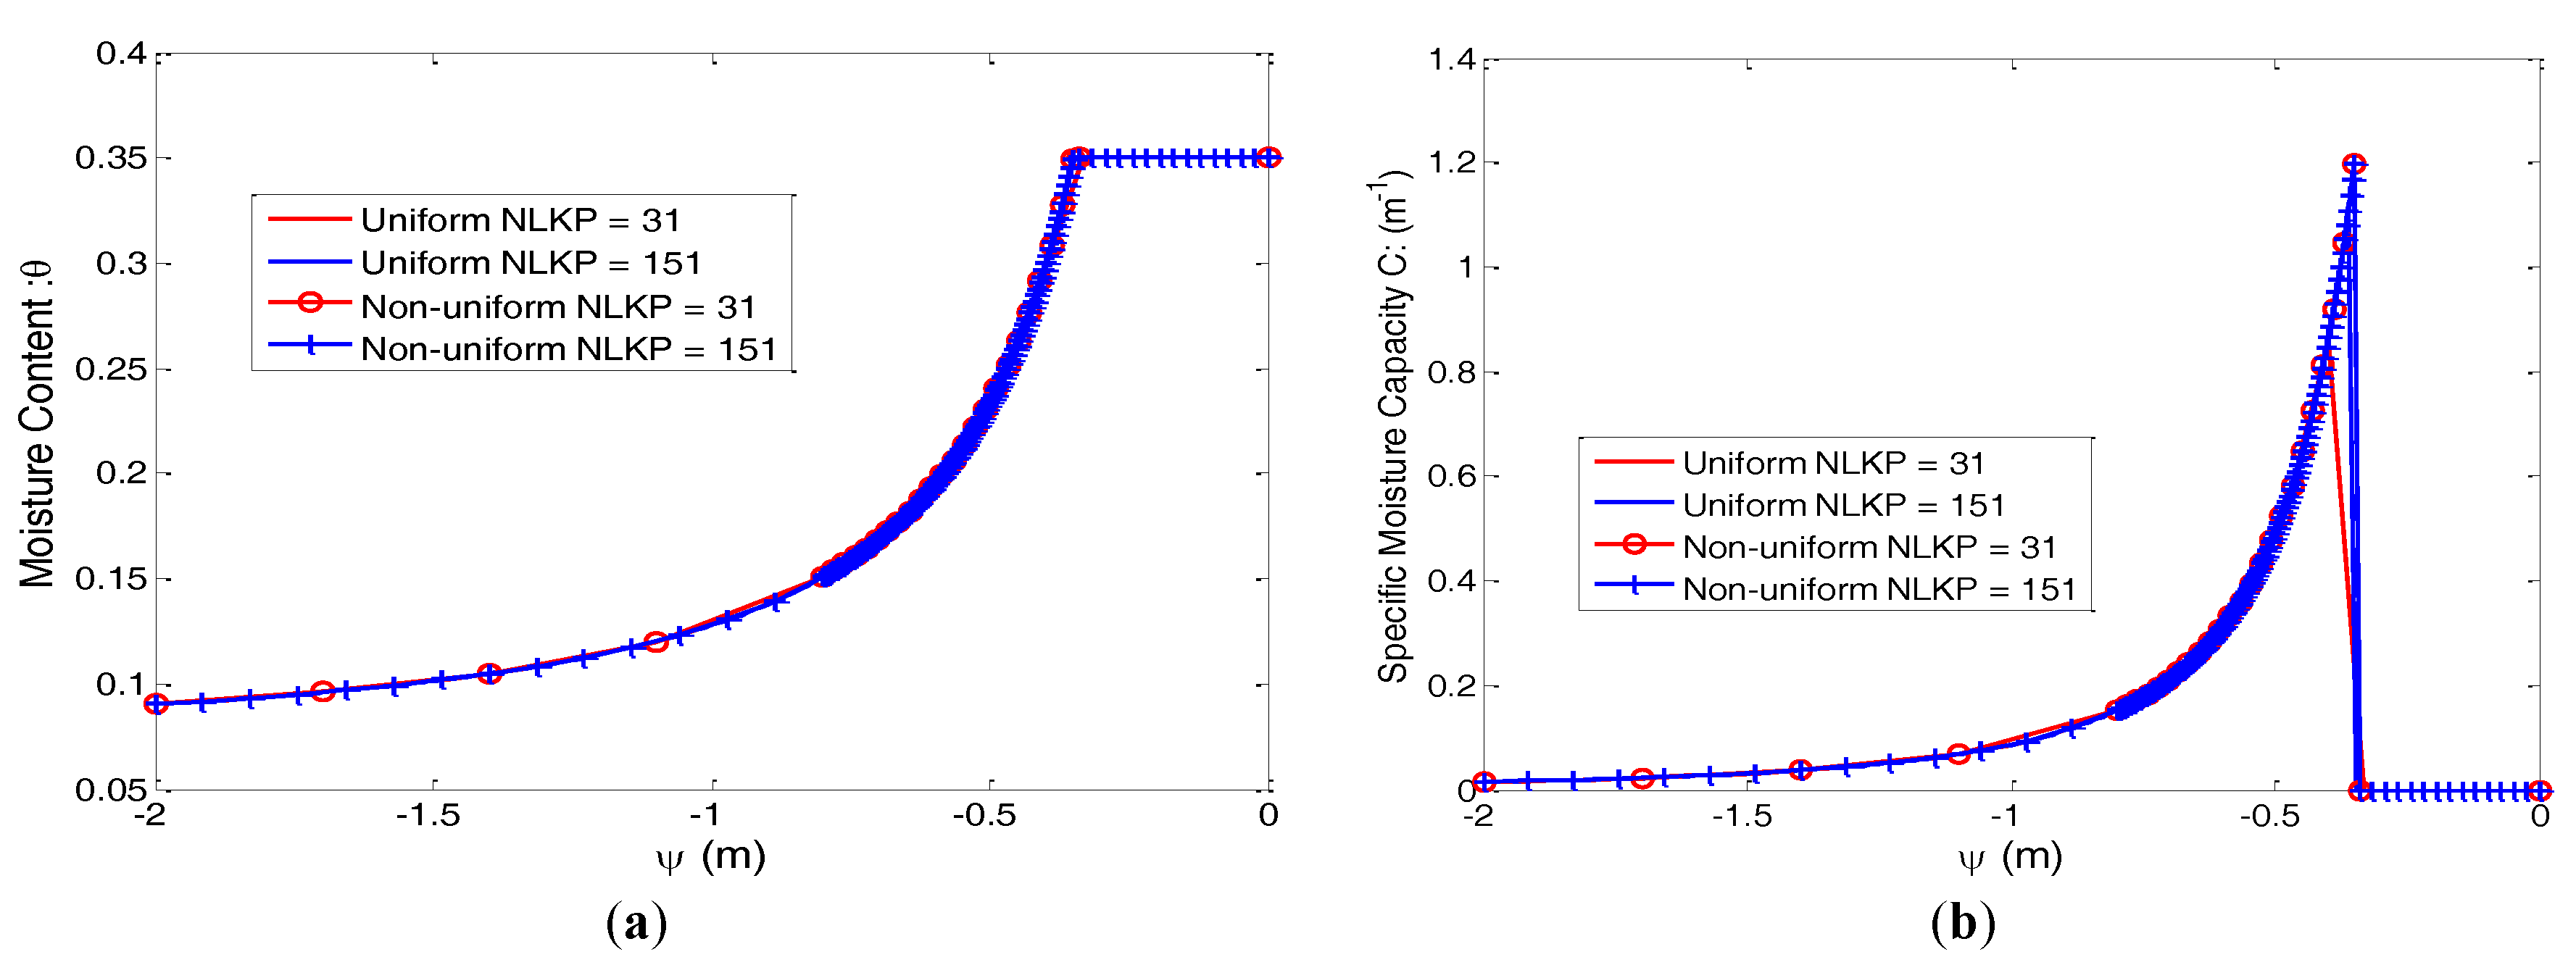
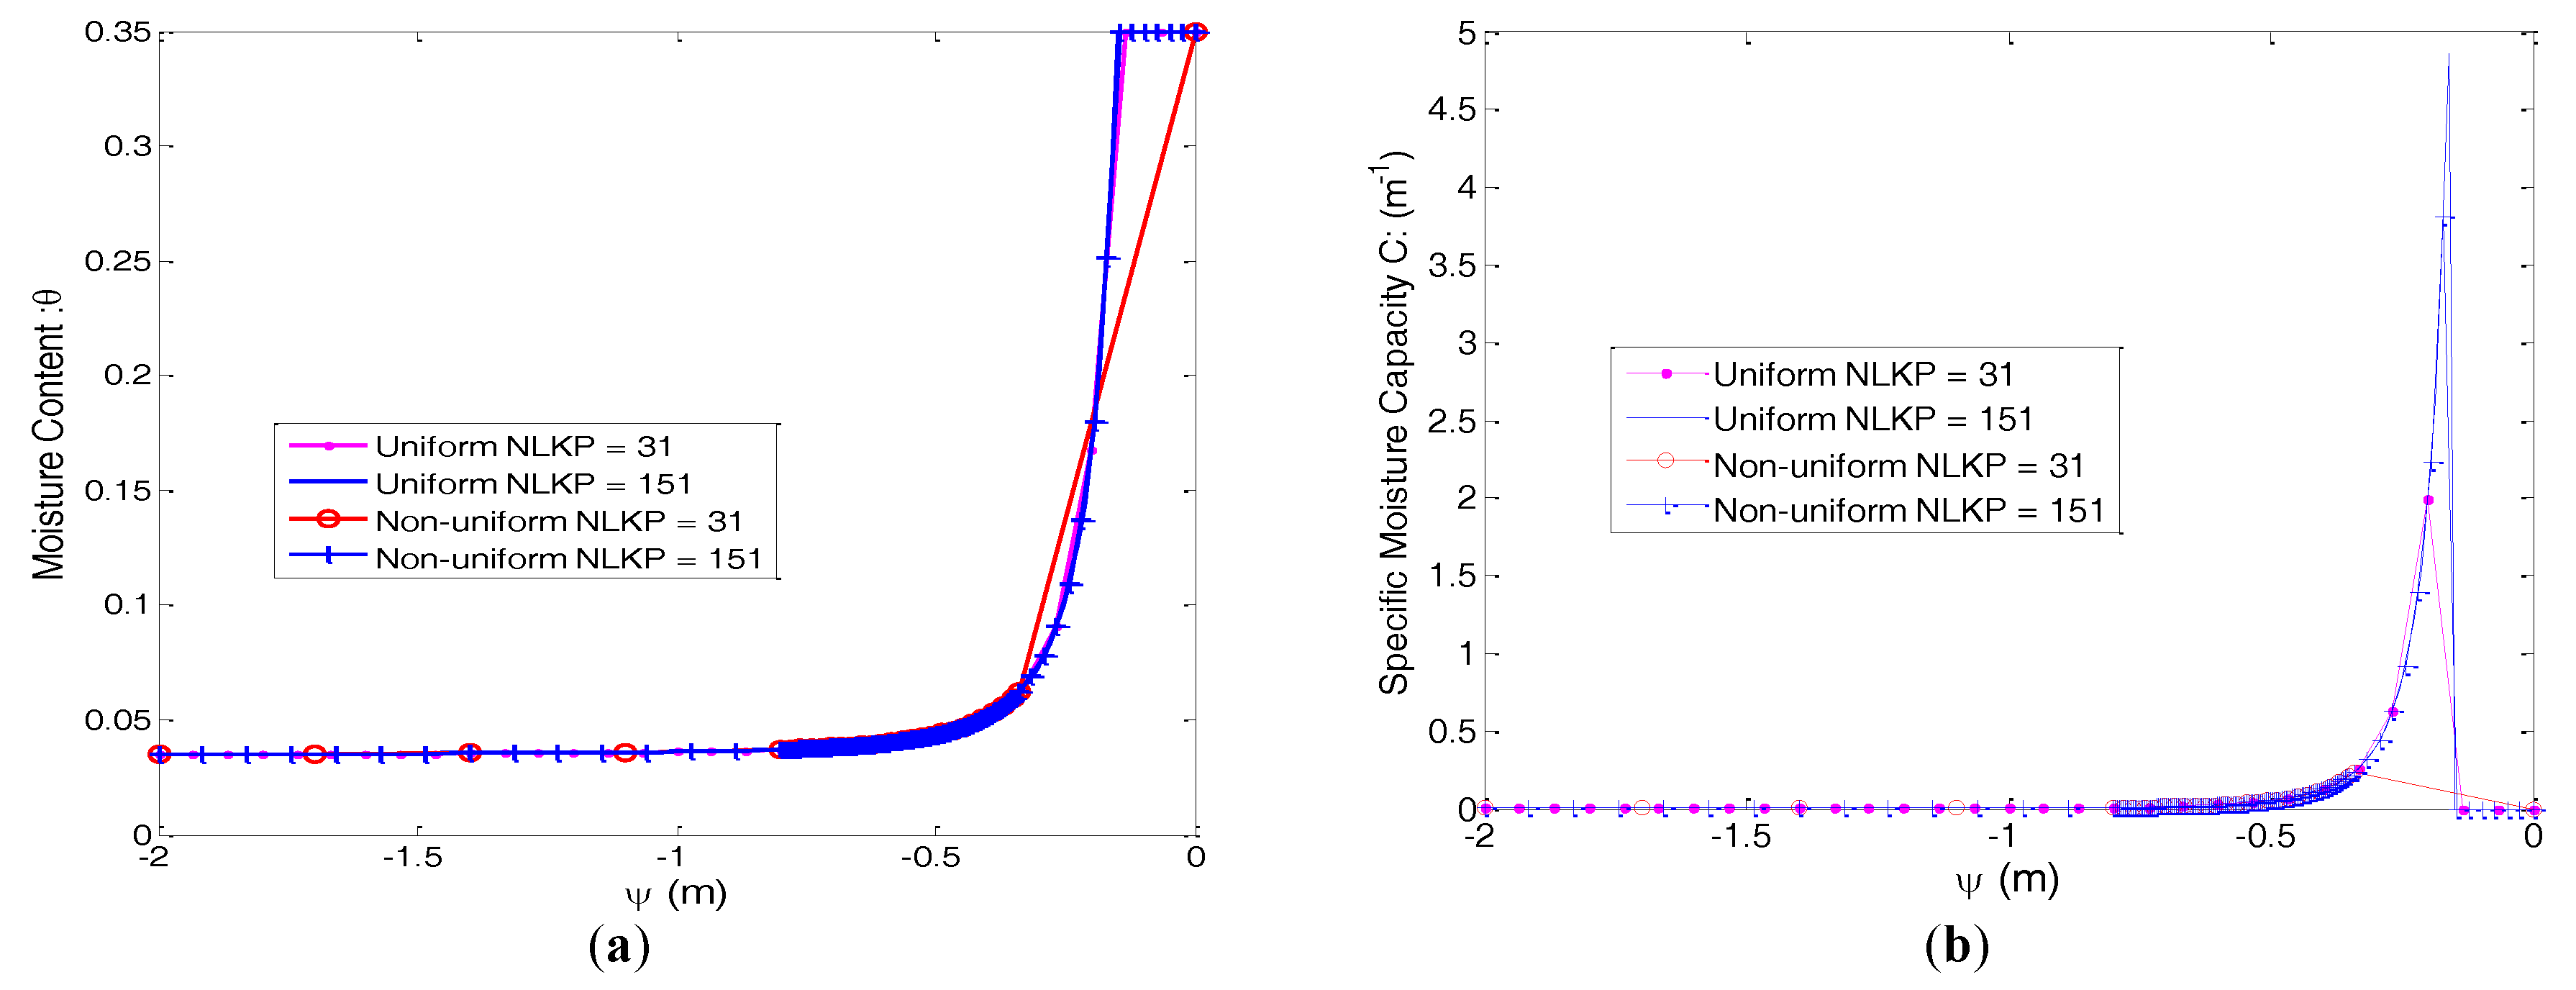
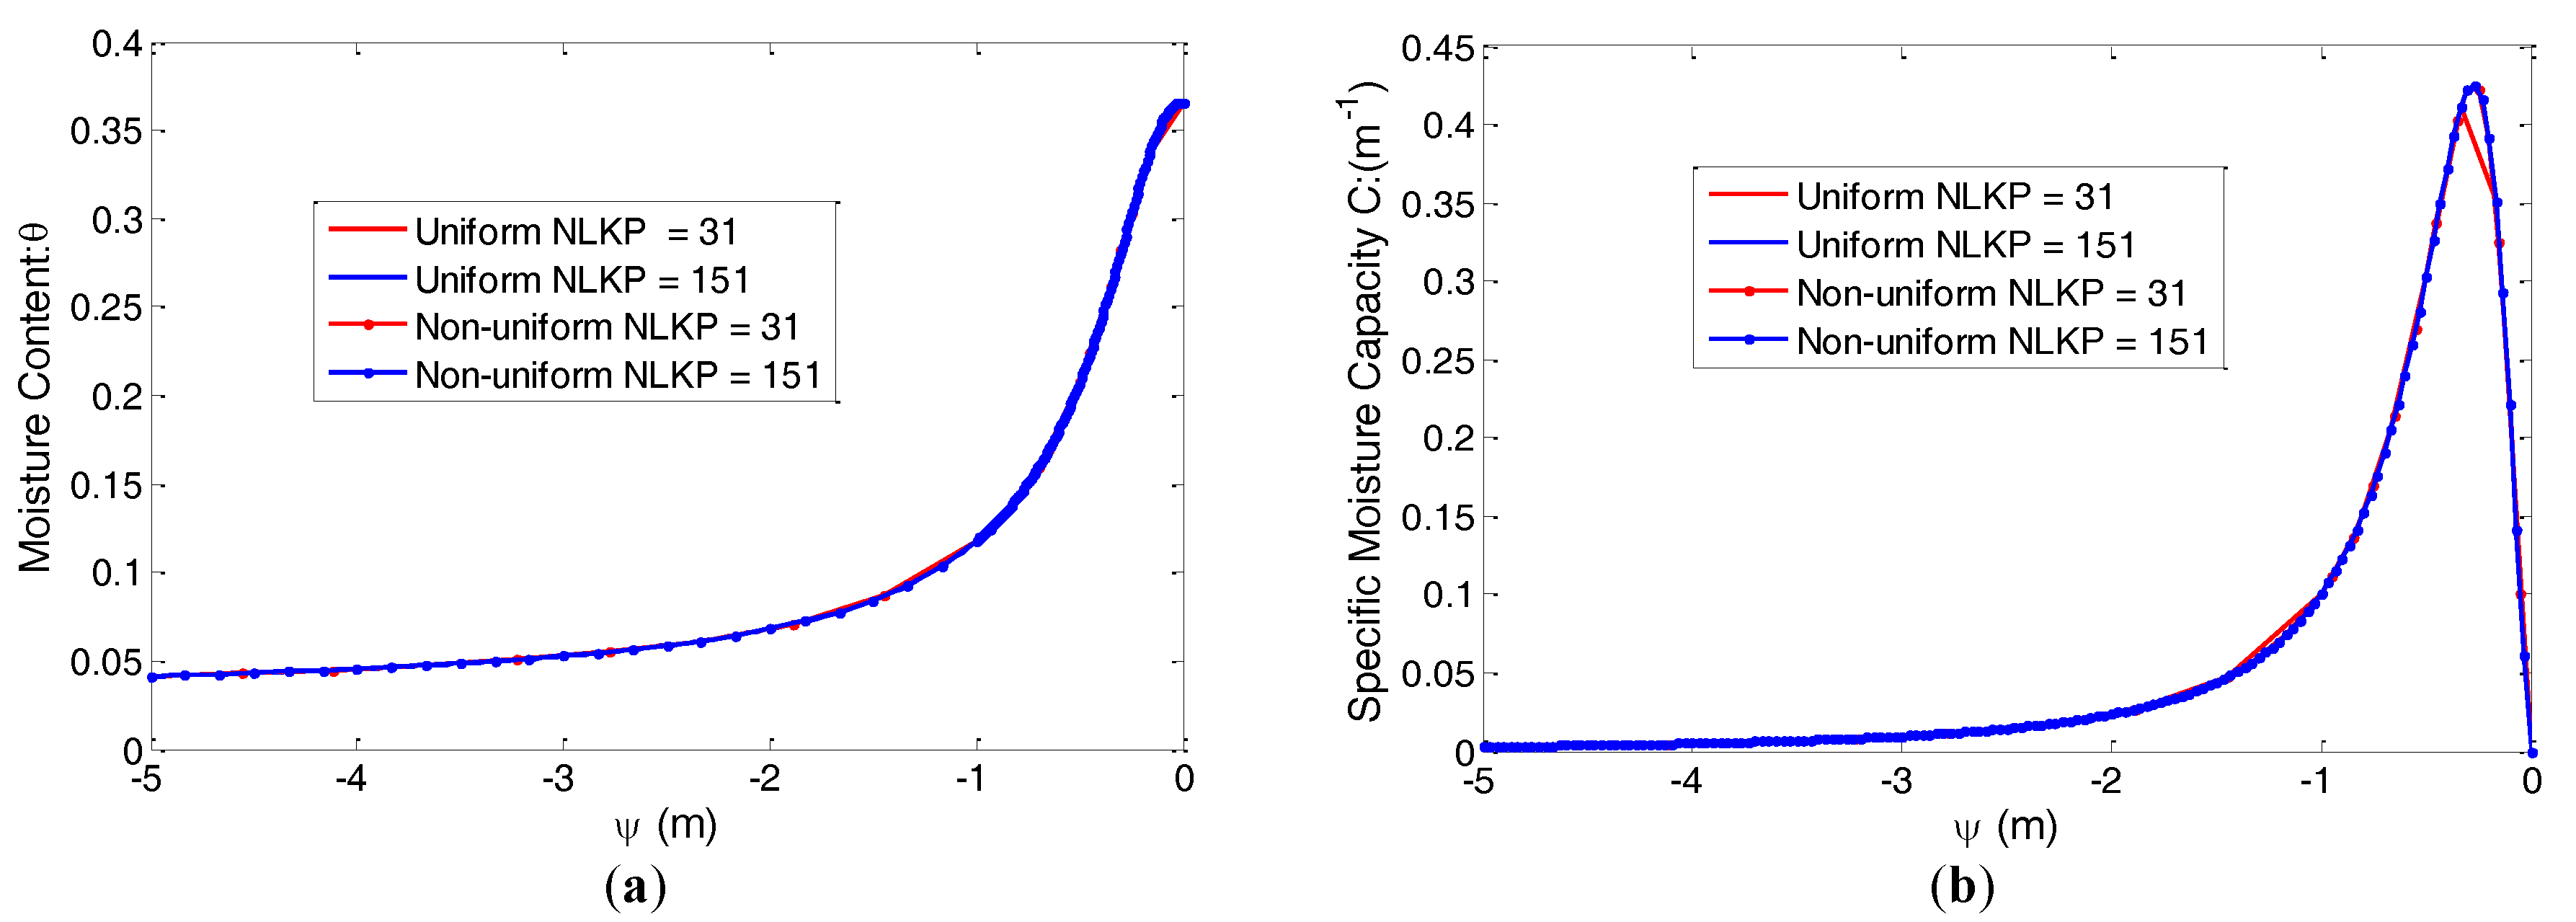
The soil moisture curves of the moisture content (
) and specific moisture capacity (
) for the uniform and non-uniform distribution of lookup points evaluated by the Brooks–Corey model are presented in
Figure 2 (Soil 1) and
Figure 3 (Soil 2). Highly nonlinear natures are clearly shown in the illustrated figures and make good challenges for a numerical algorithm.
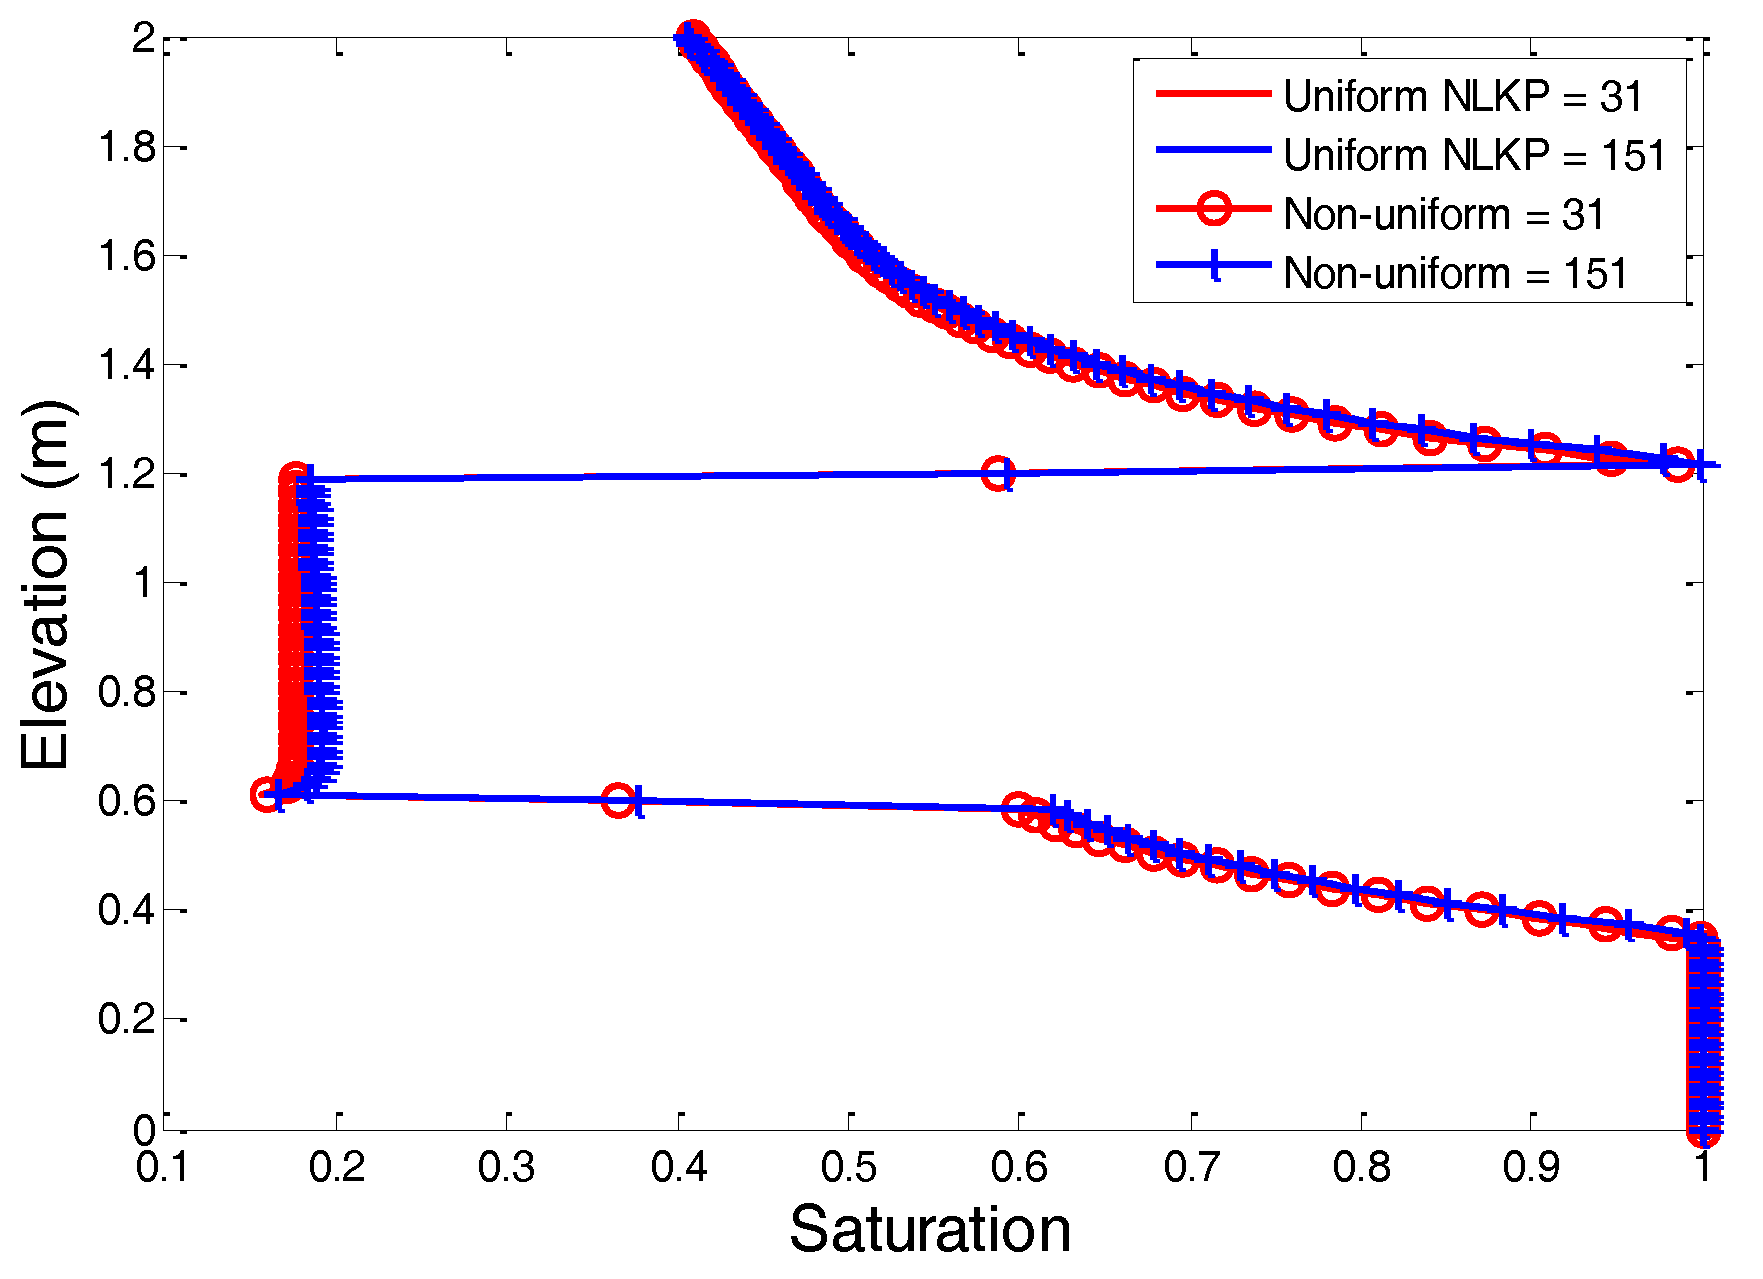
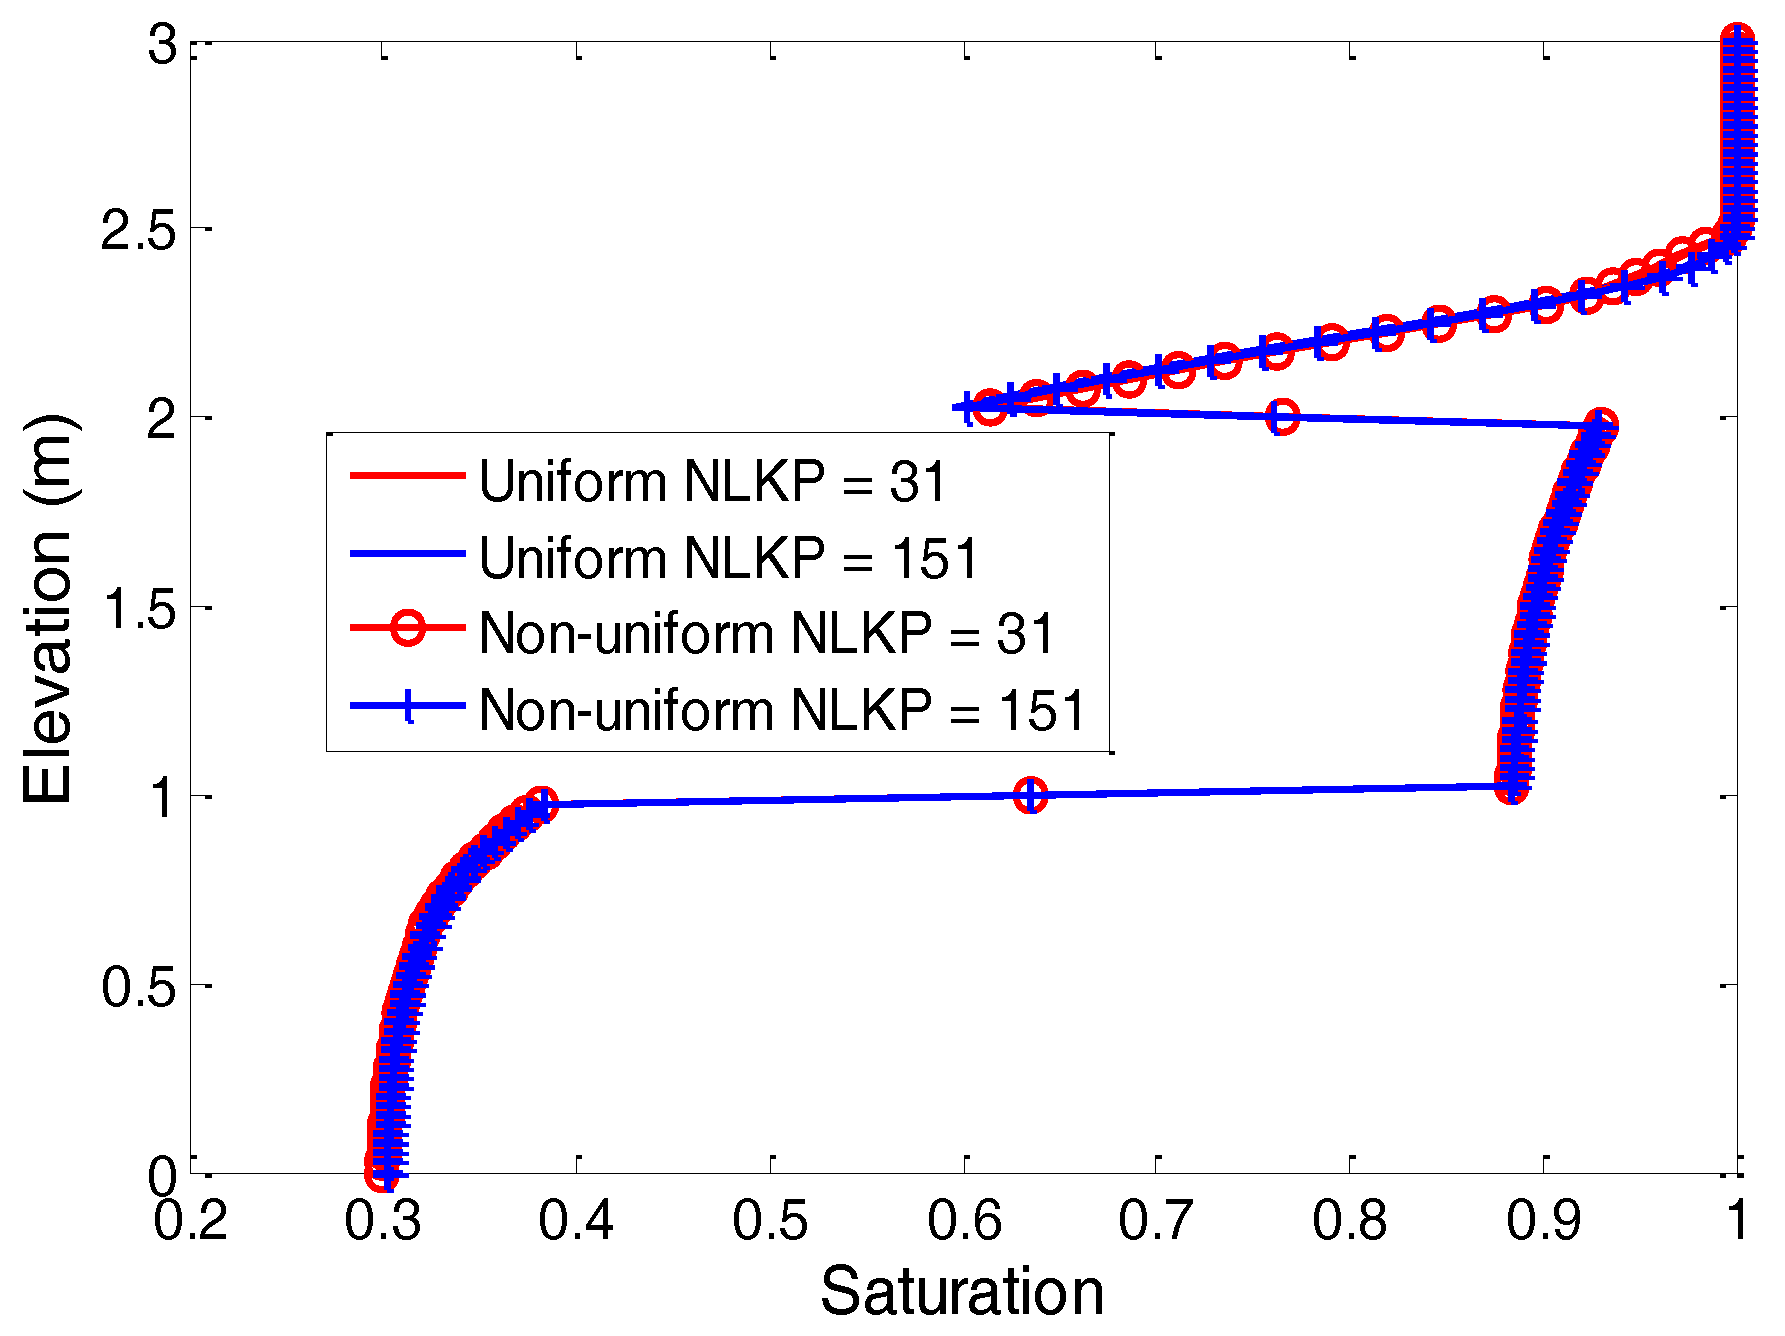
Figure 4 shows the saturation profiles at time 12.15 days for the various combinations simulated with the Picard scheme. It is shown that the solutions for 31 and 151 uniform and non-uniform lookup table points coincide very well. This implies that for the soil moisture retention curves, 31 lookup points are sufficient to obtain an efficient numerical solution of Richards’ equation.
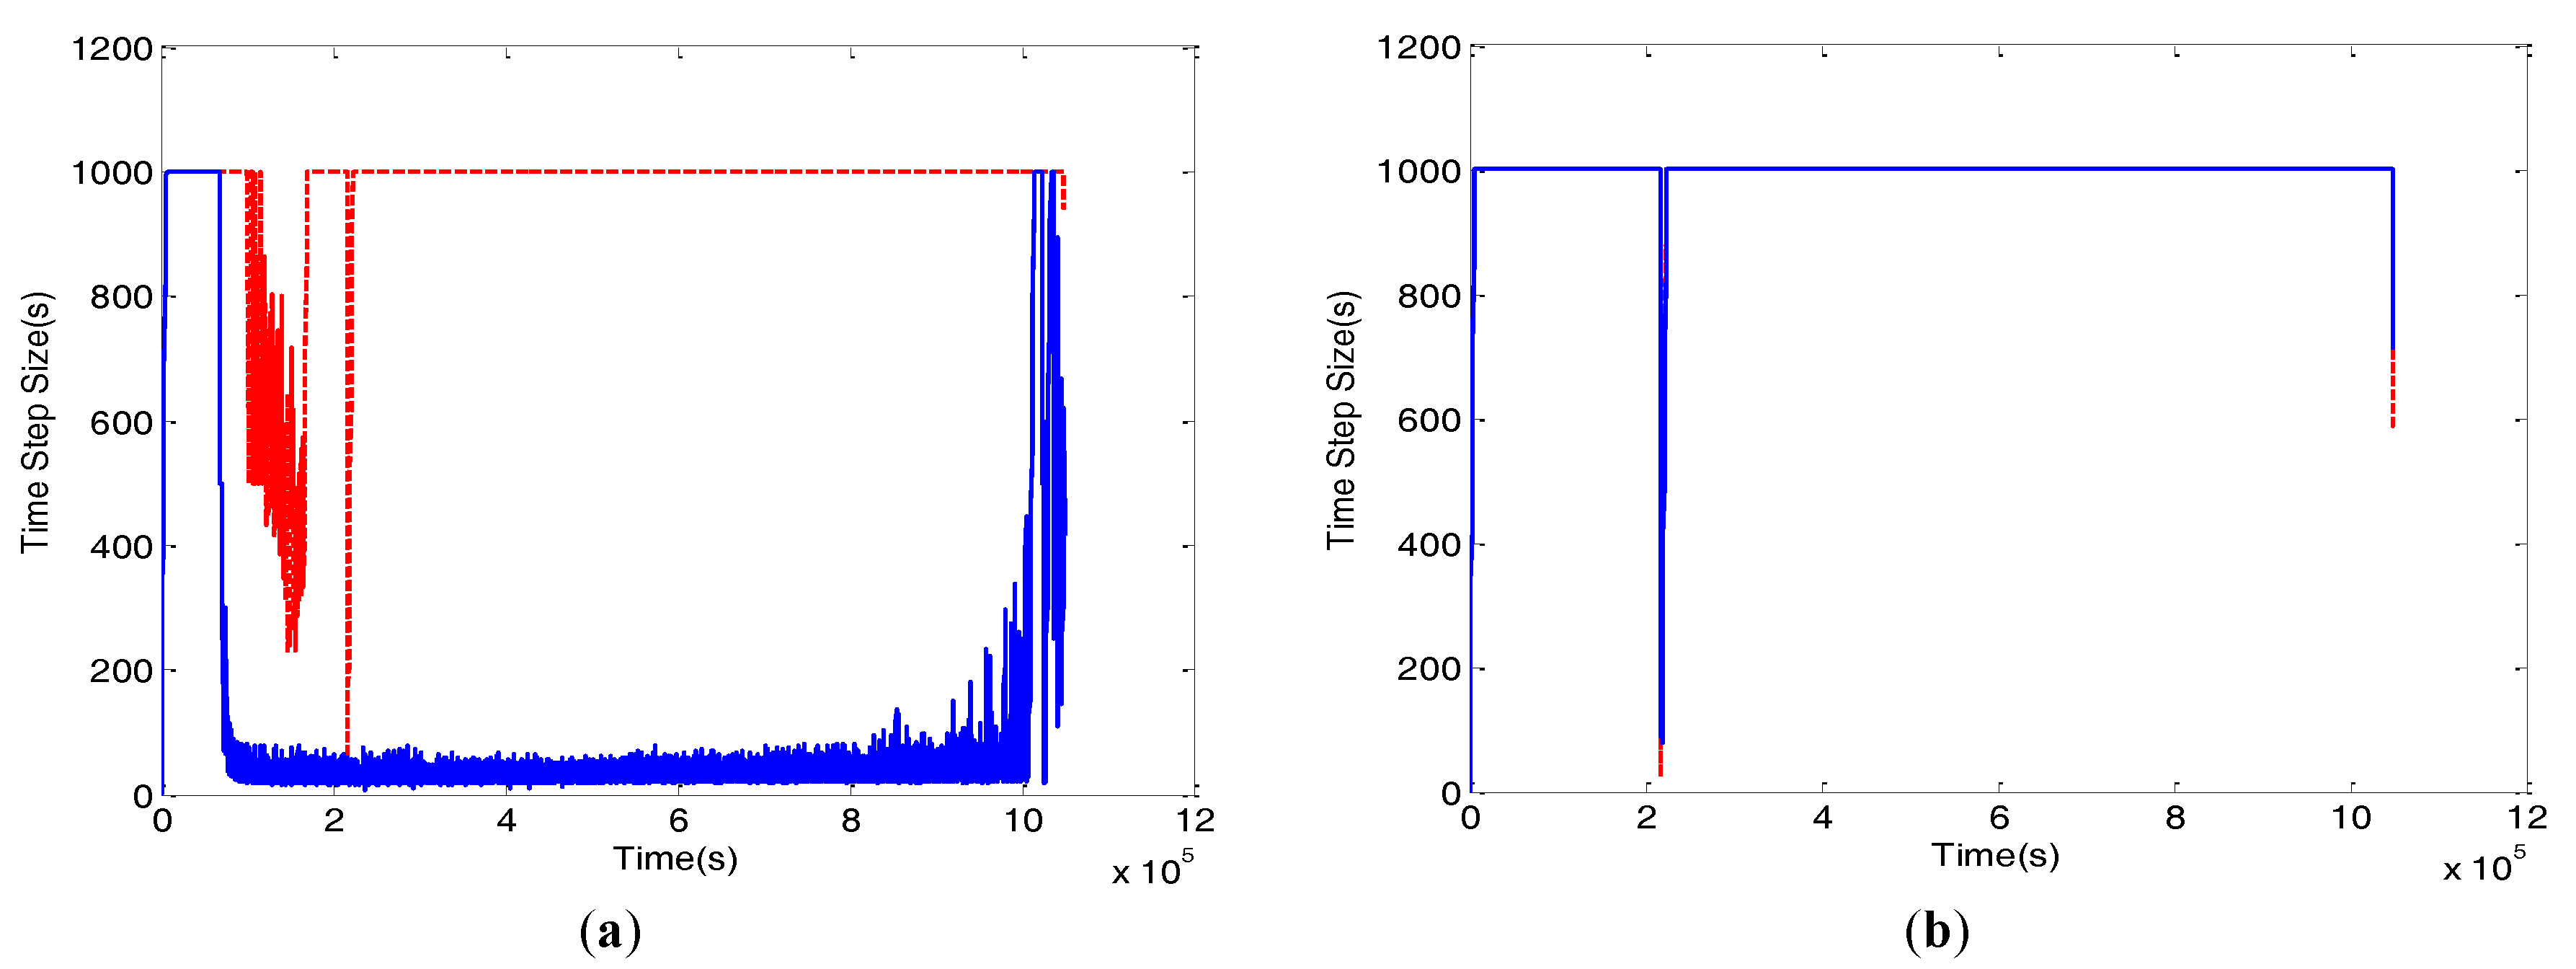
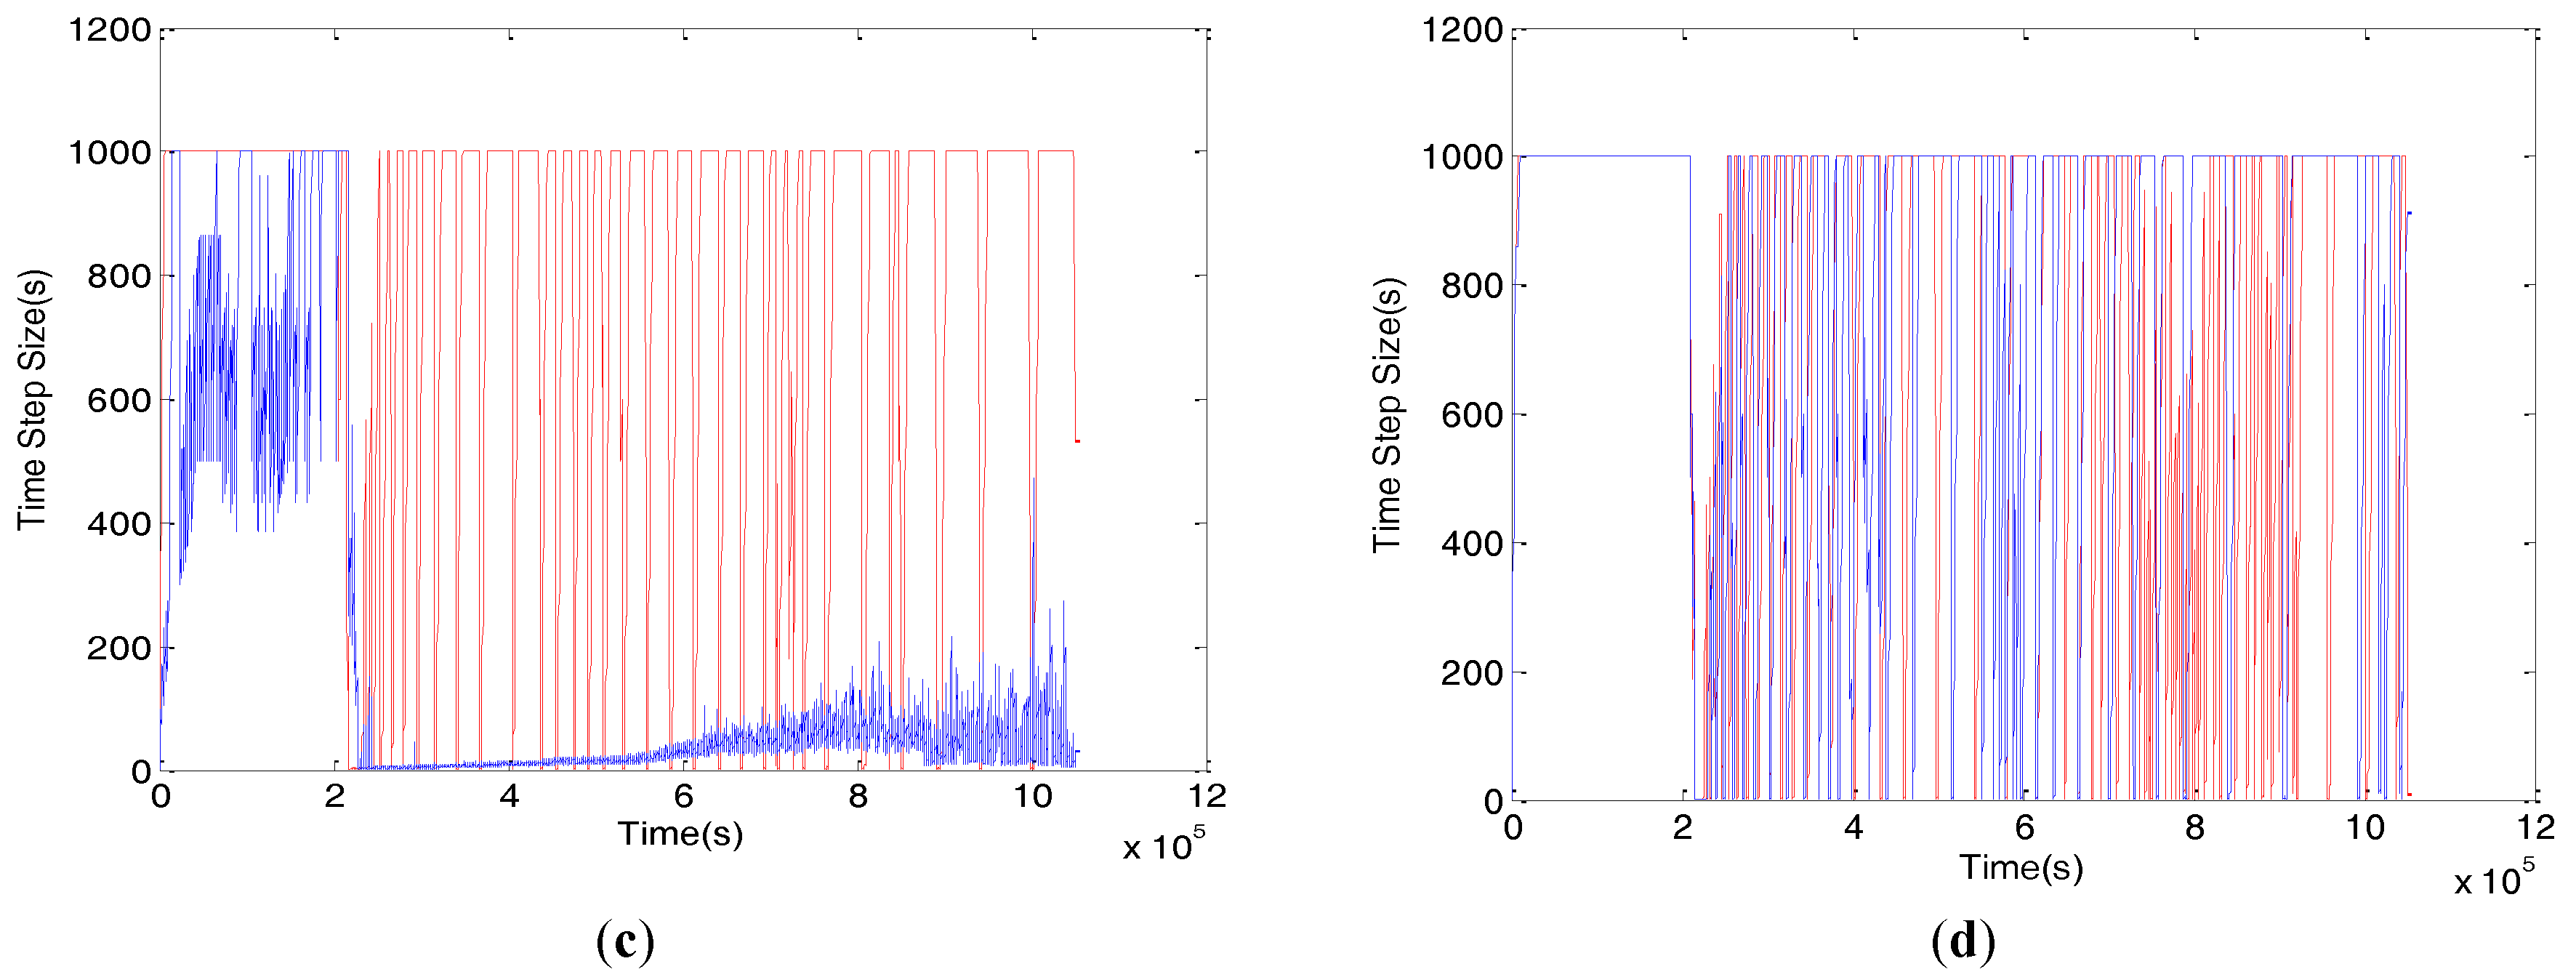
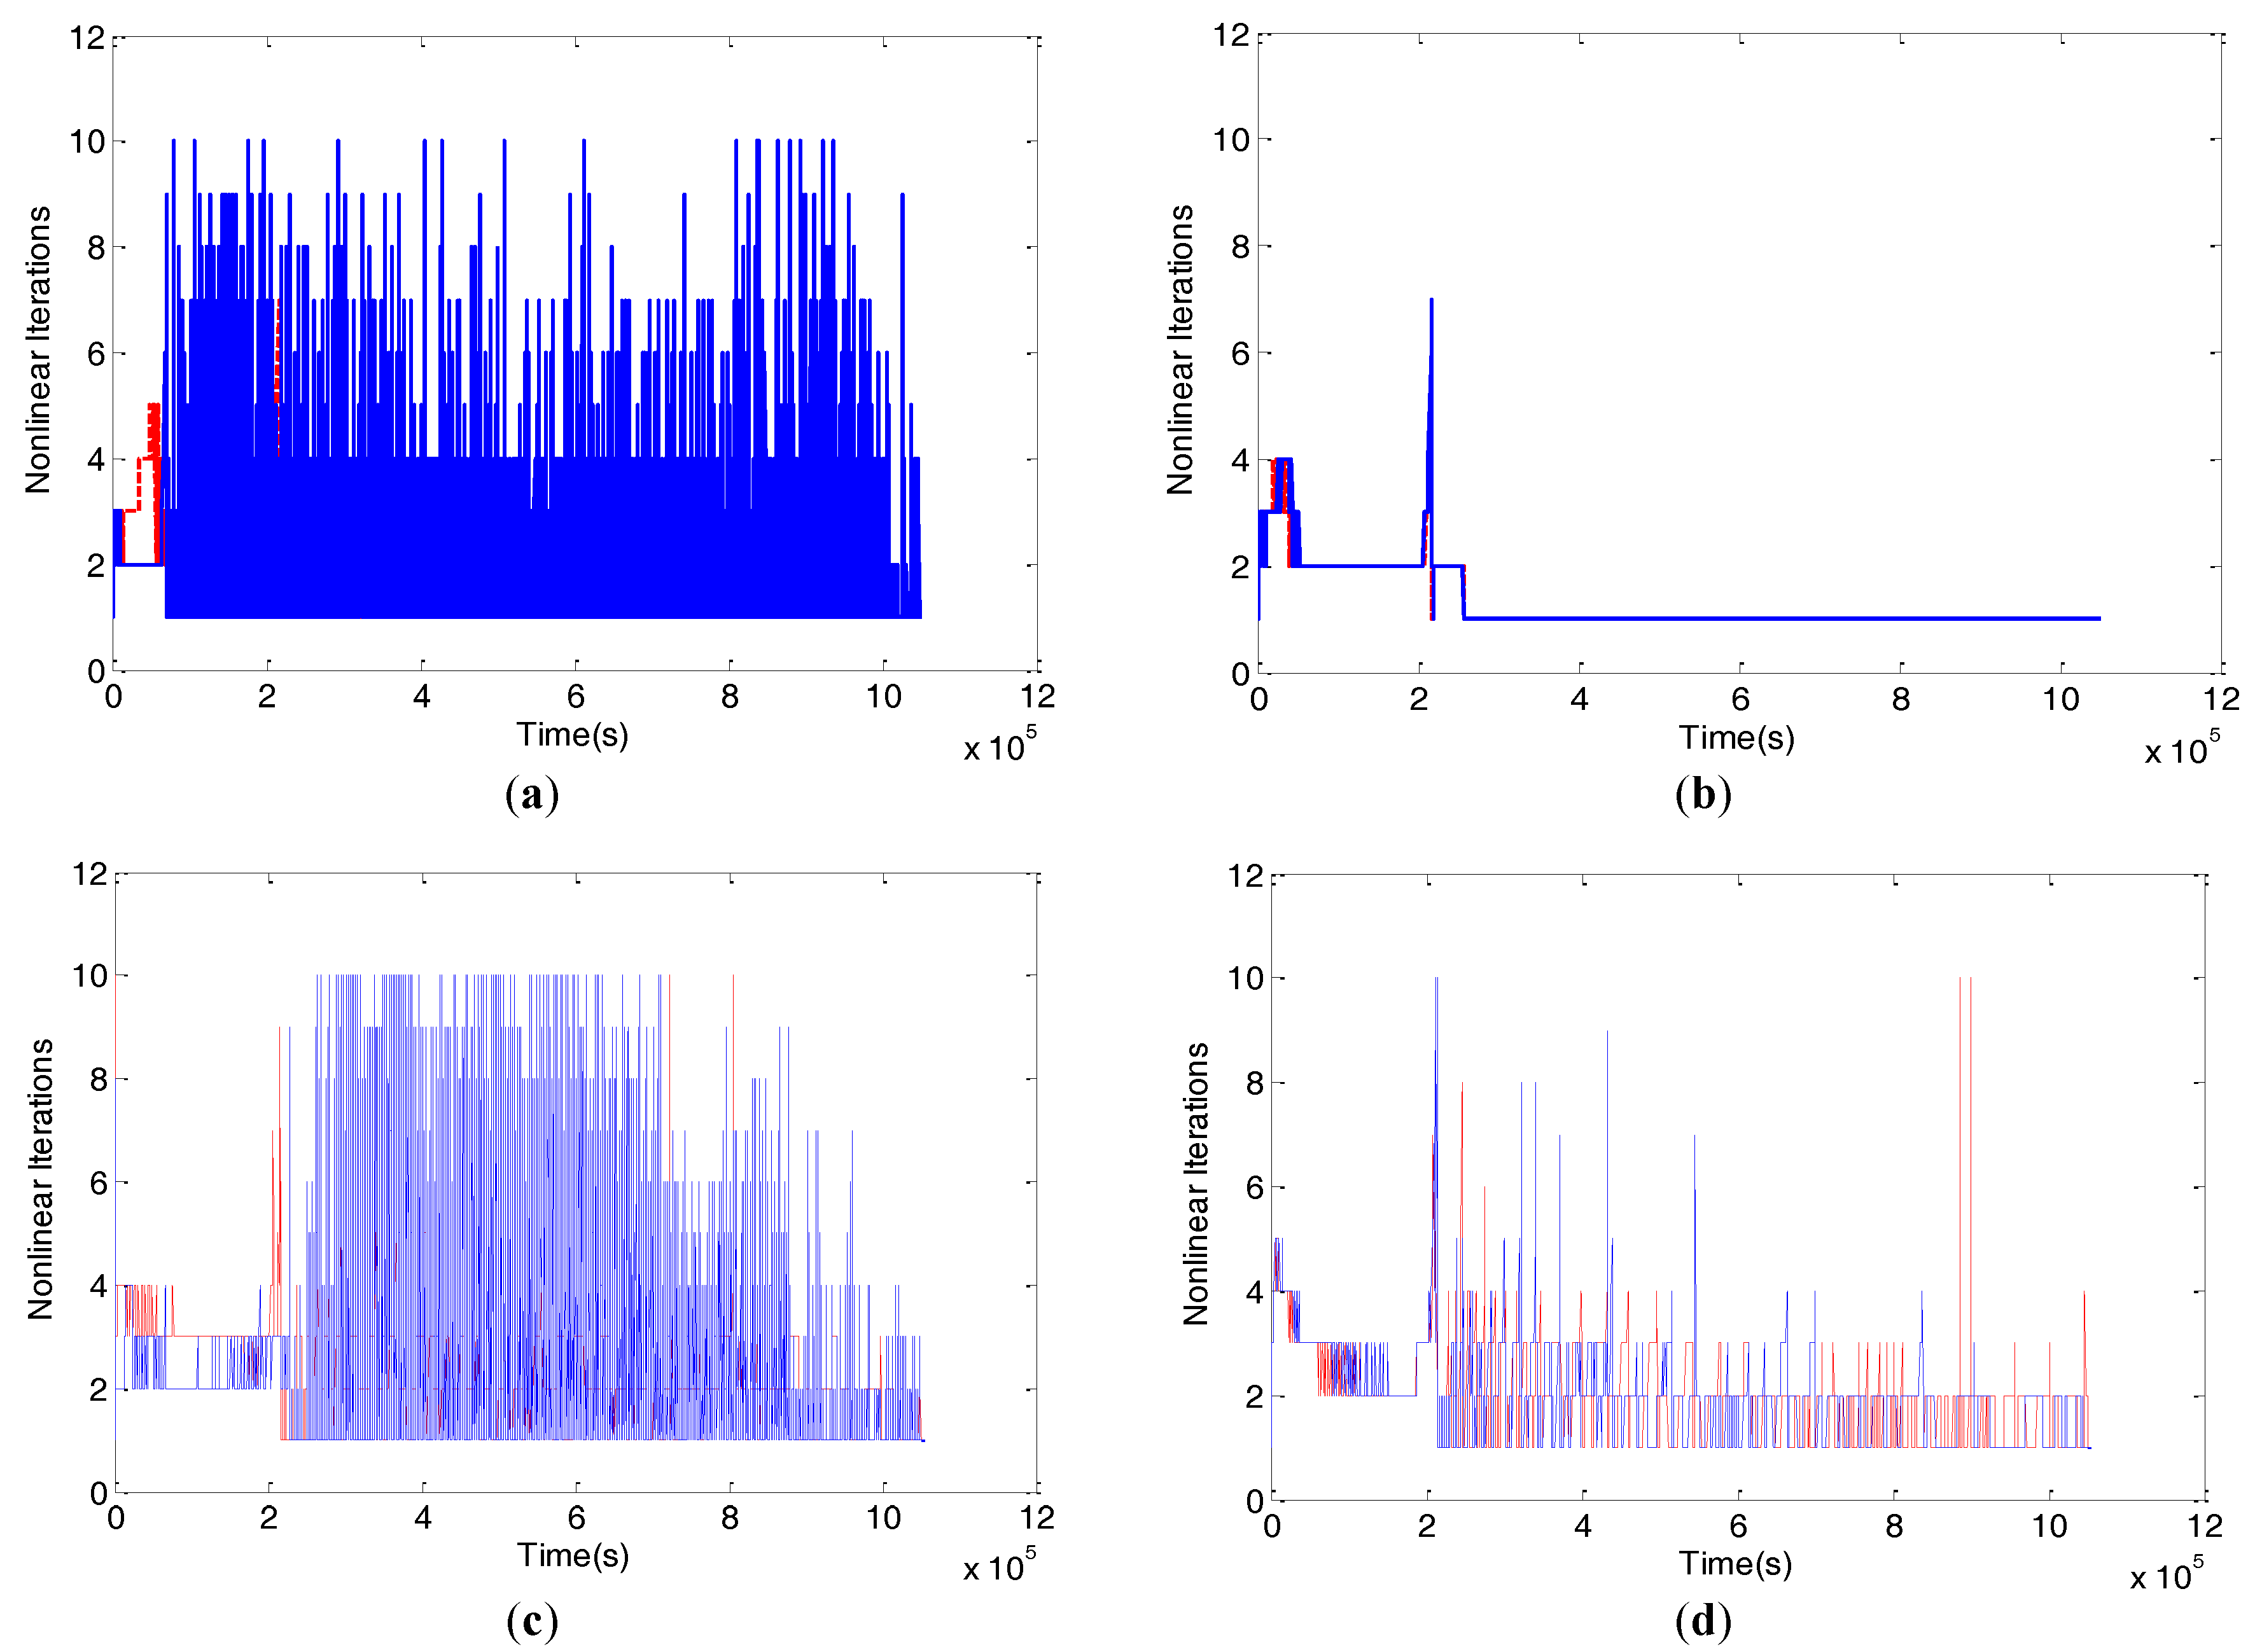
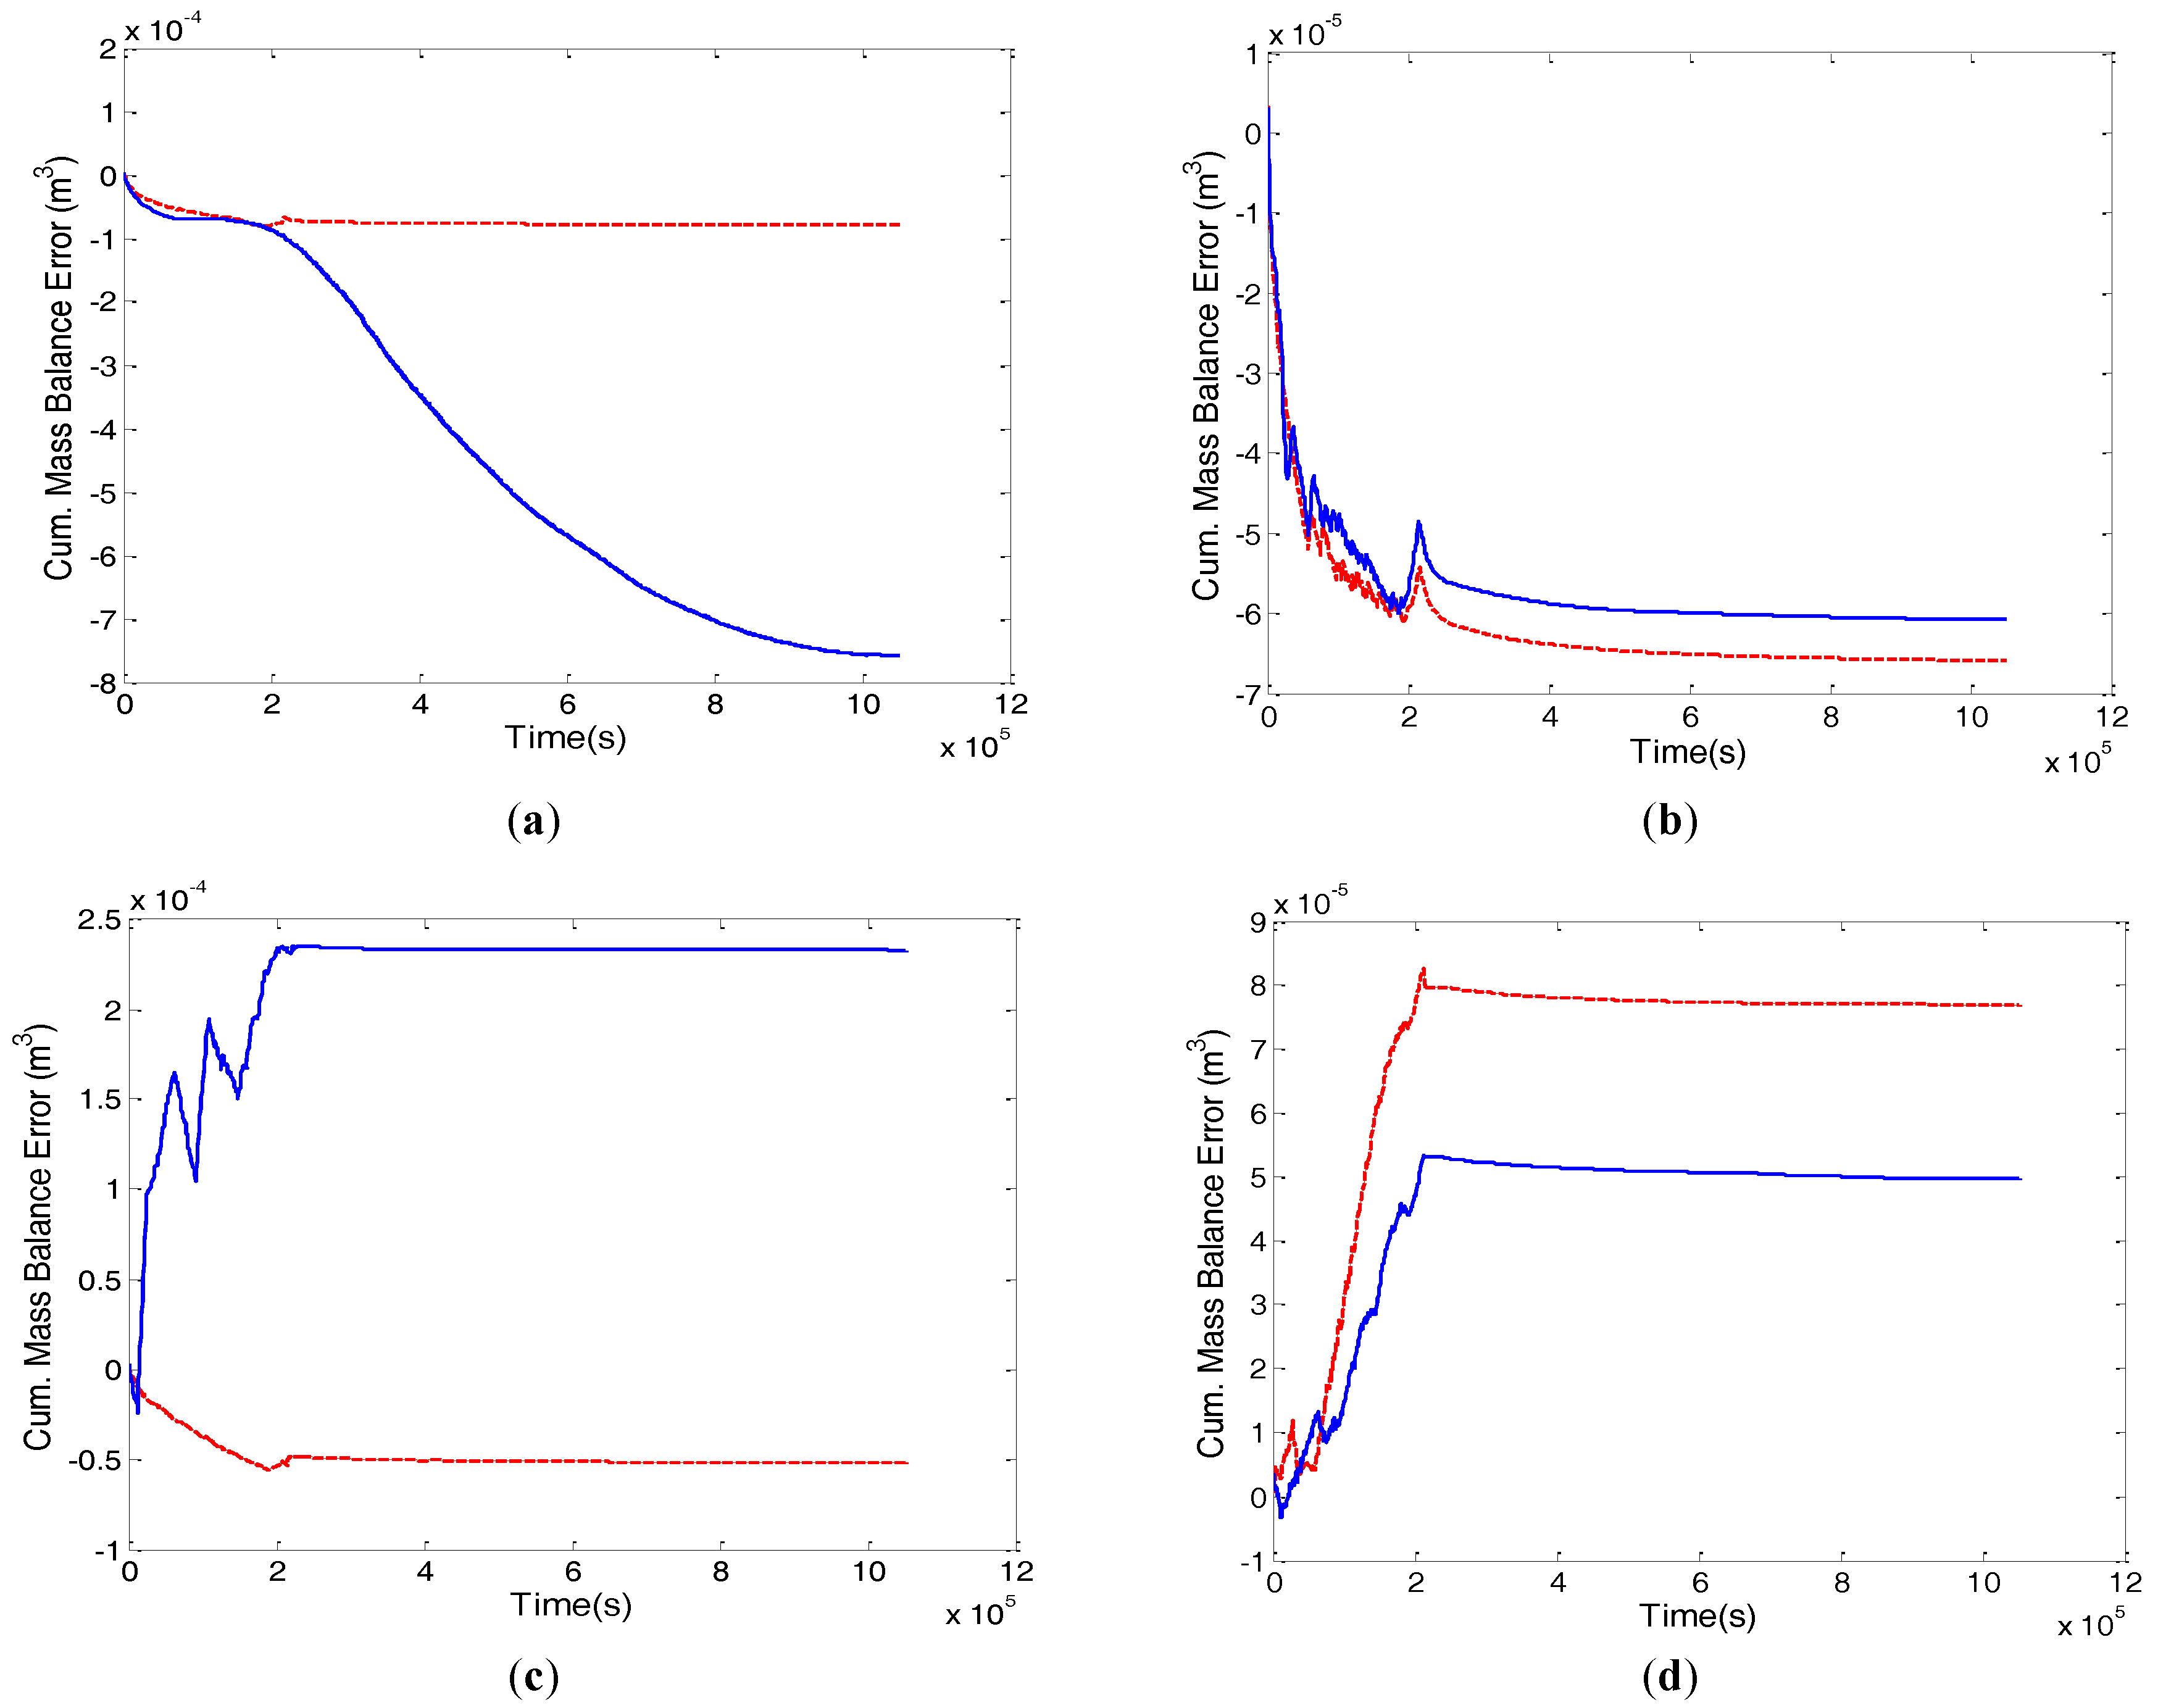
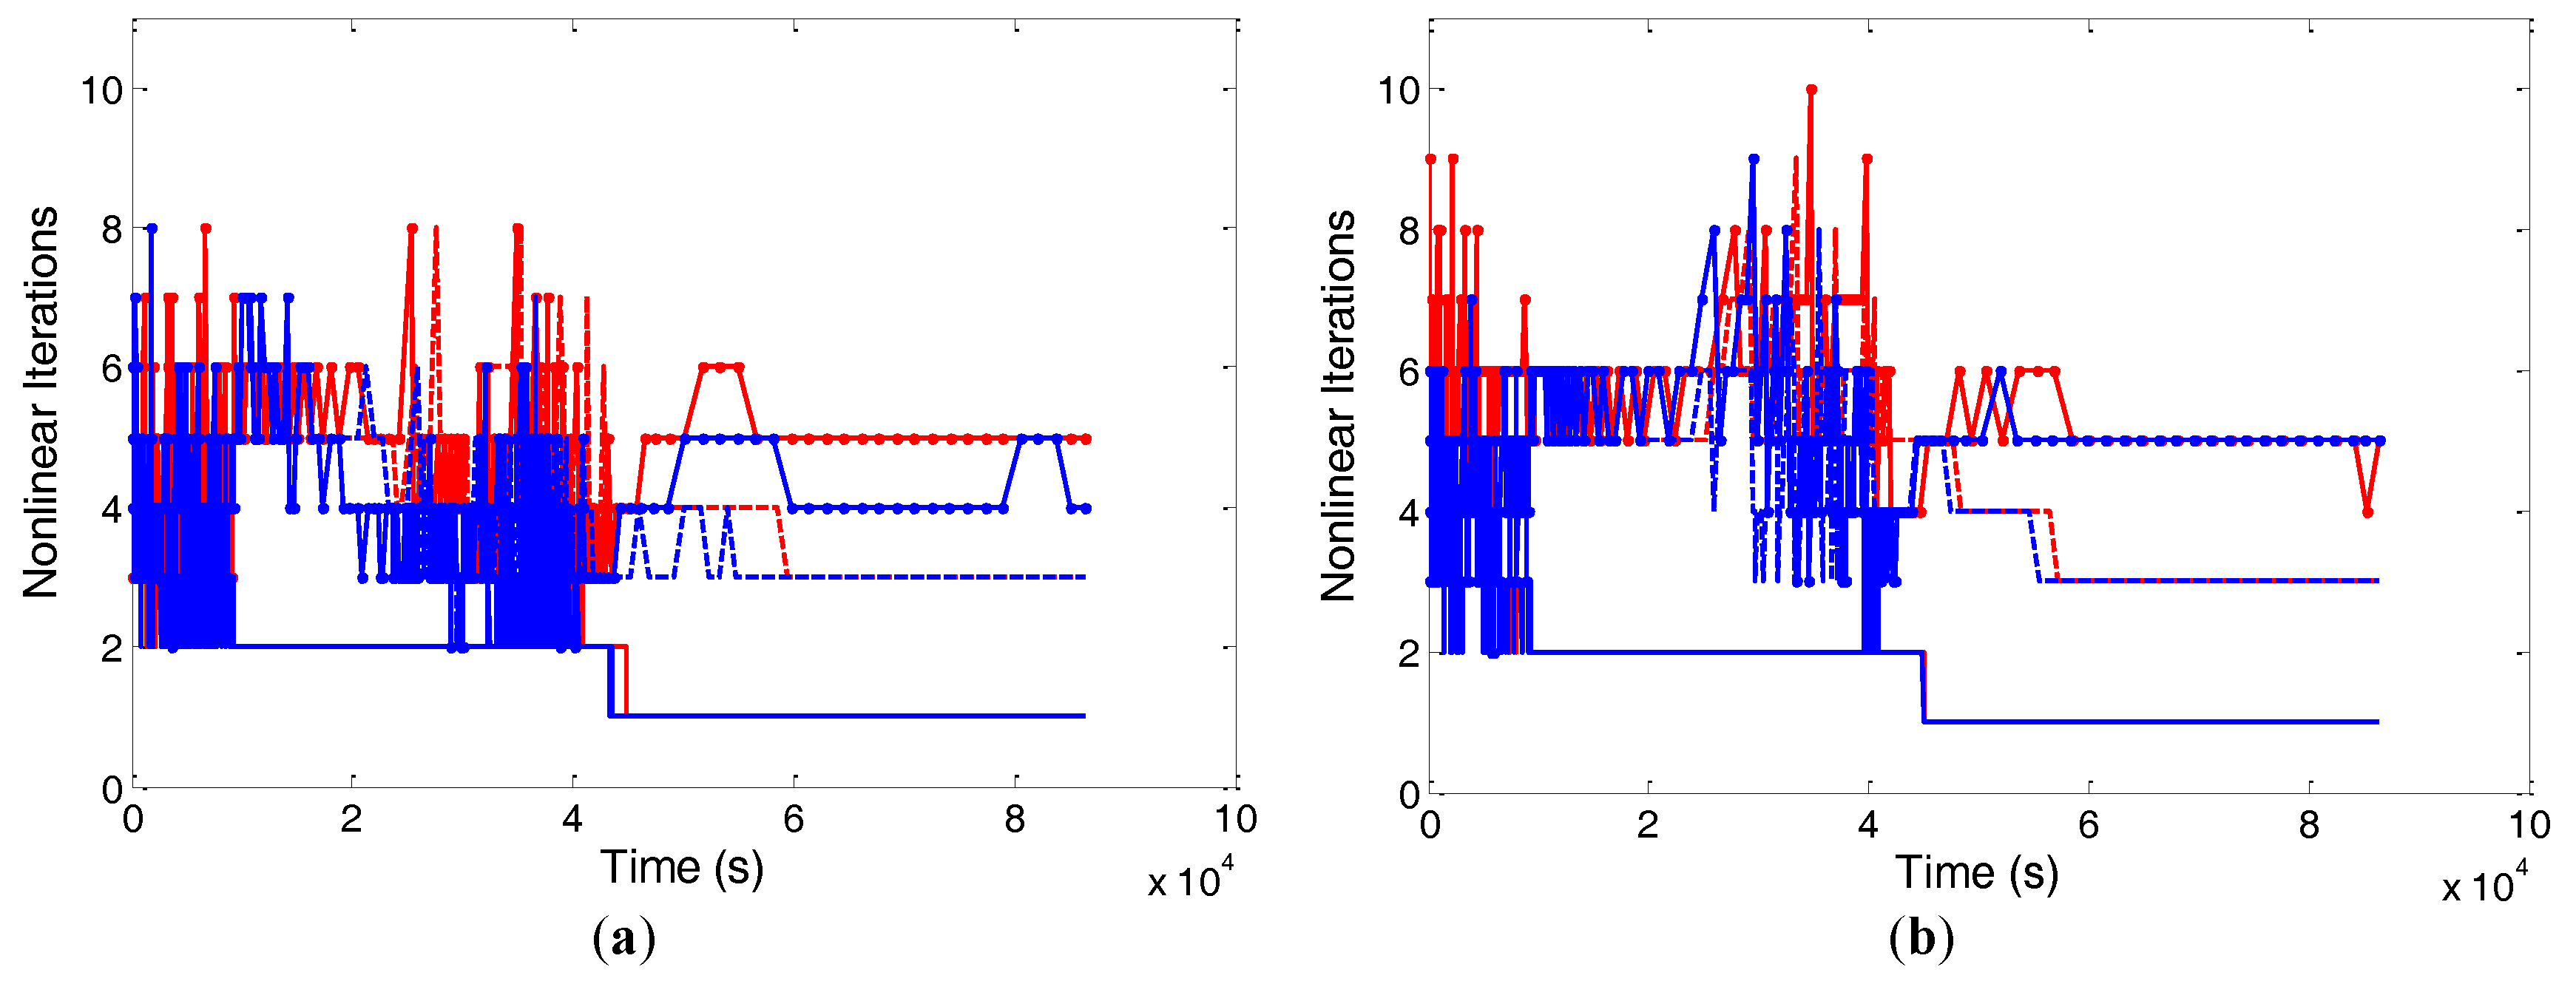
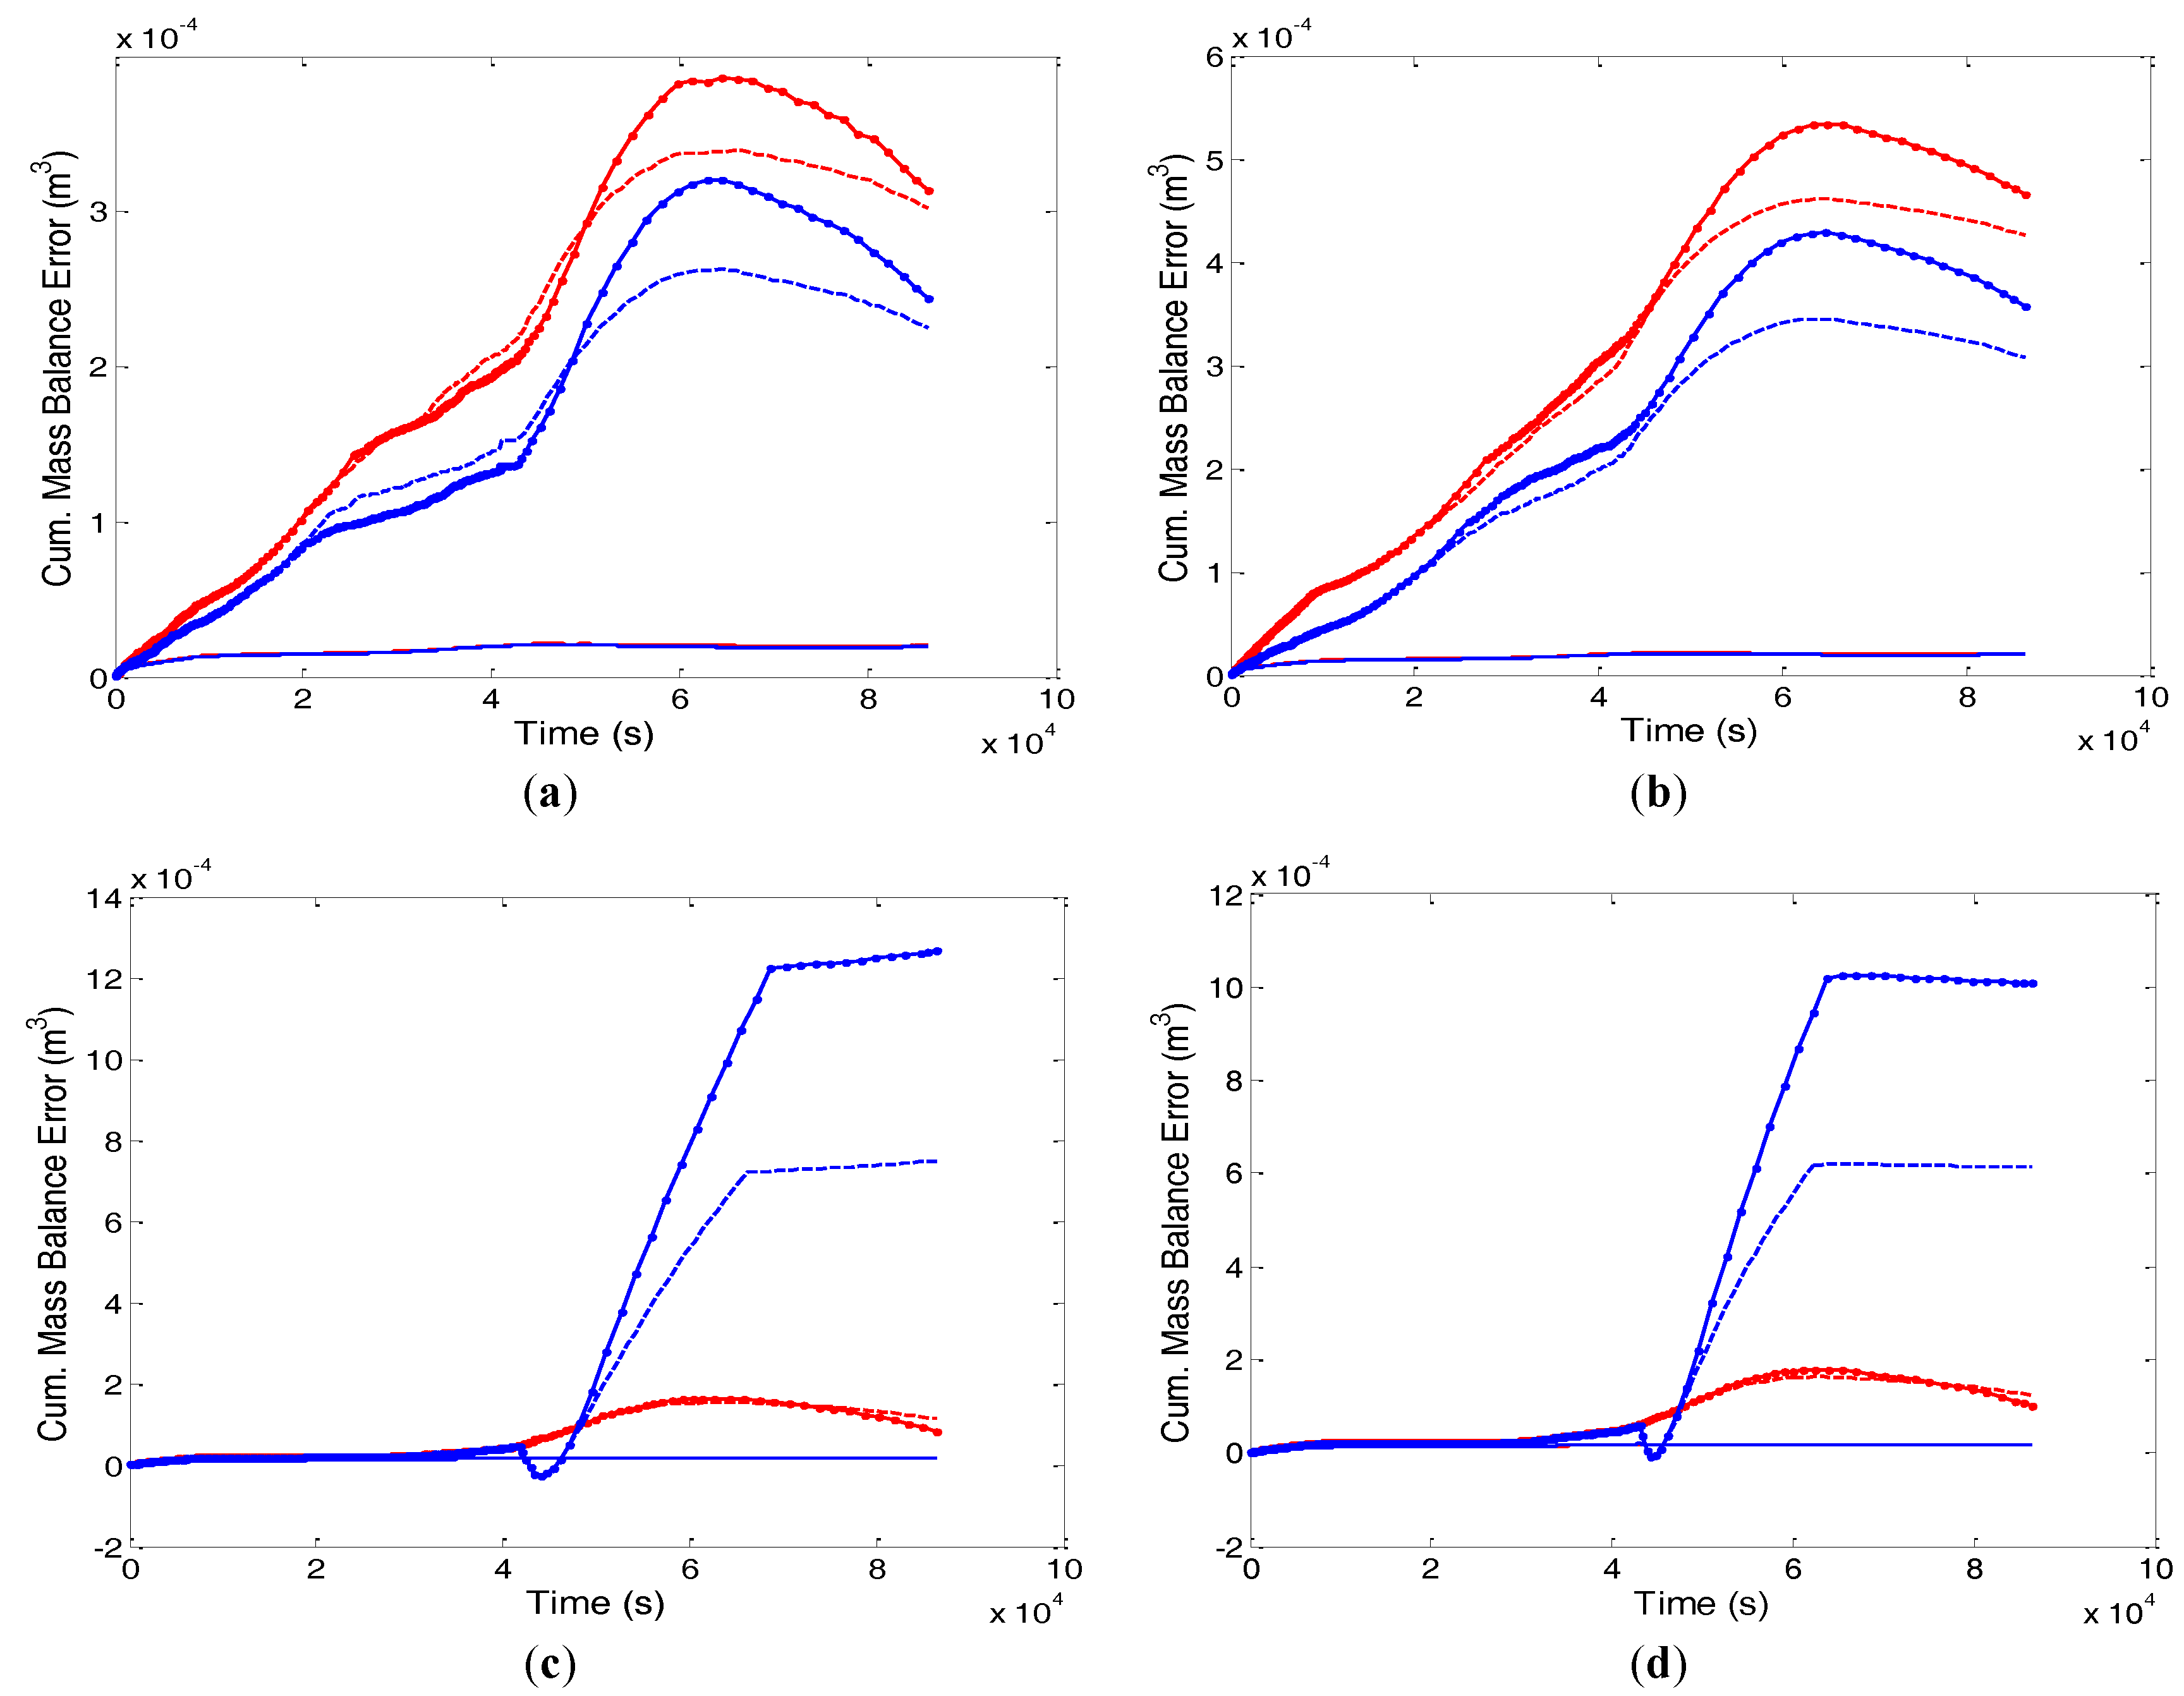
The time stepping, nonlinear convergence and cumulative mass balance error behavior for 150 layers with a step size of 1000 s of uniform and non-uniform NLKP are illustrated in
Figure 5,
Figure 6 and
Figure 7, respectively. Graphs for the 150 layer simulation with 100 s and for the 50 layer cases are not presented here, but the observed results are discussed.
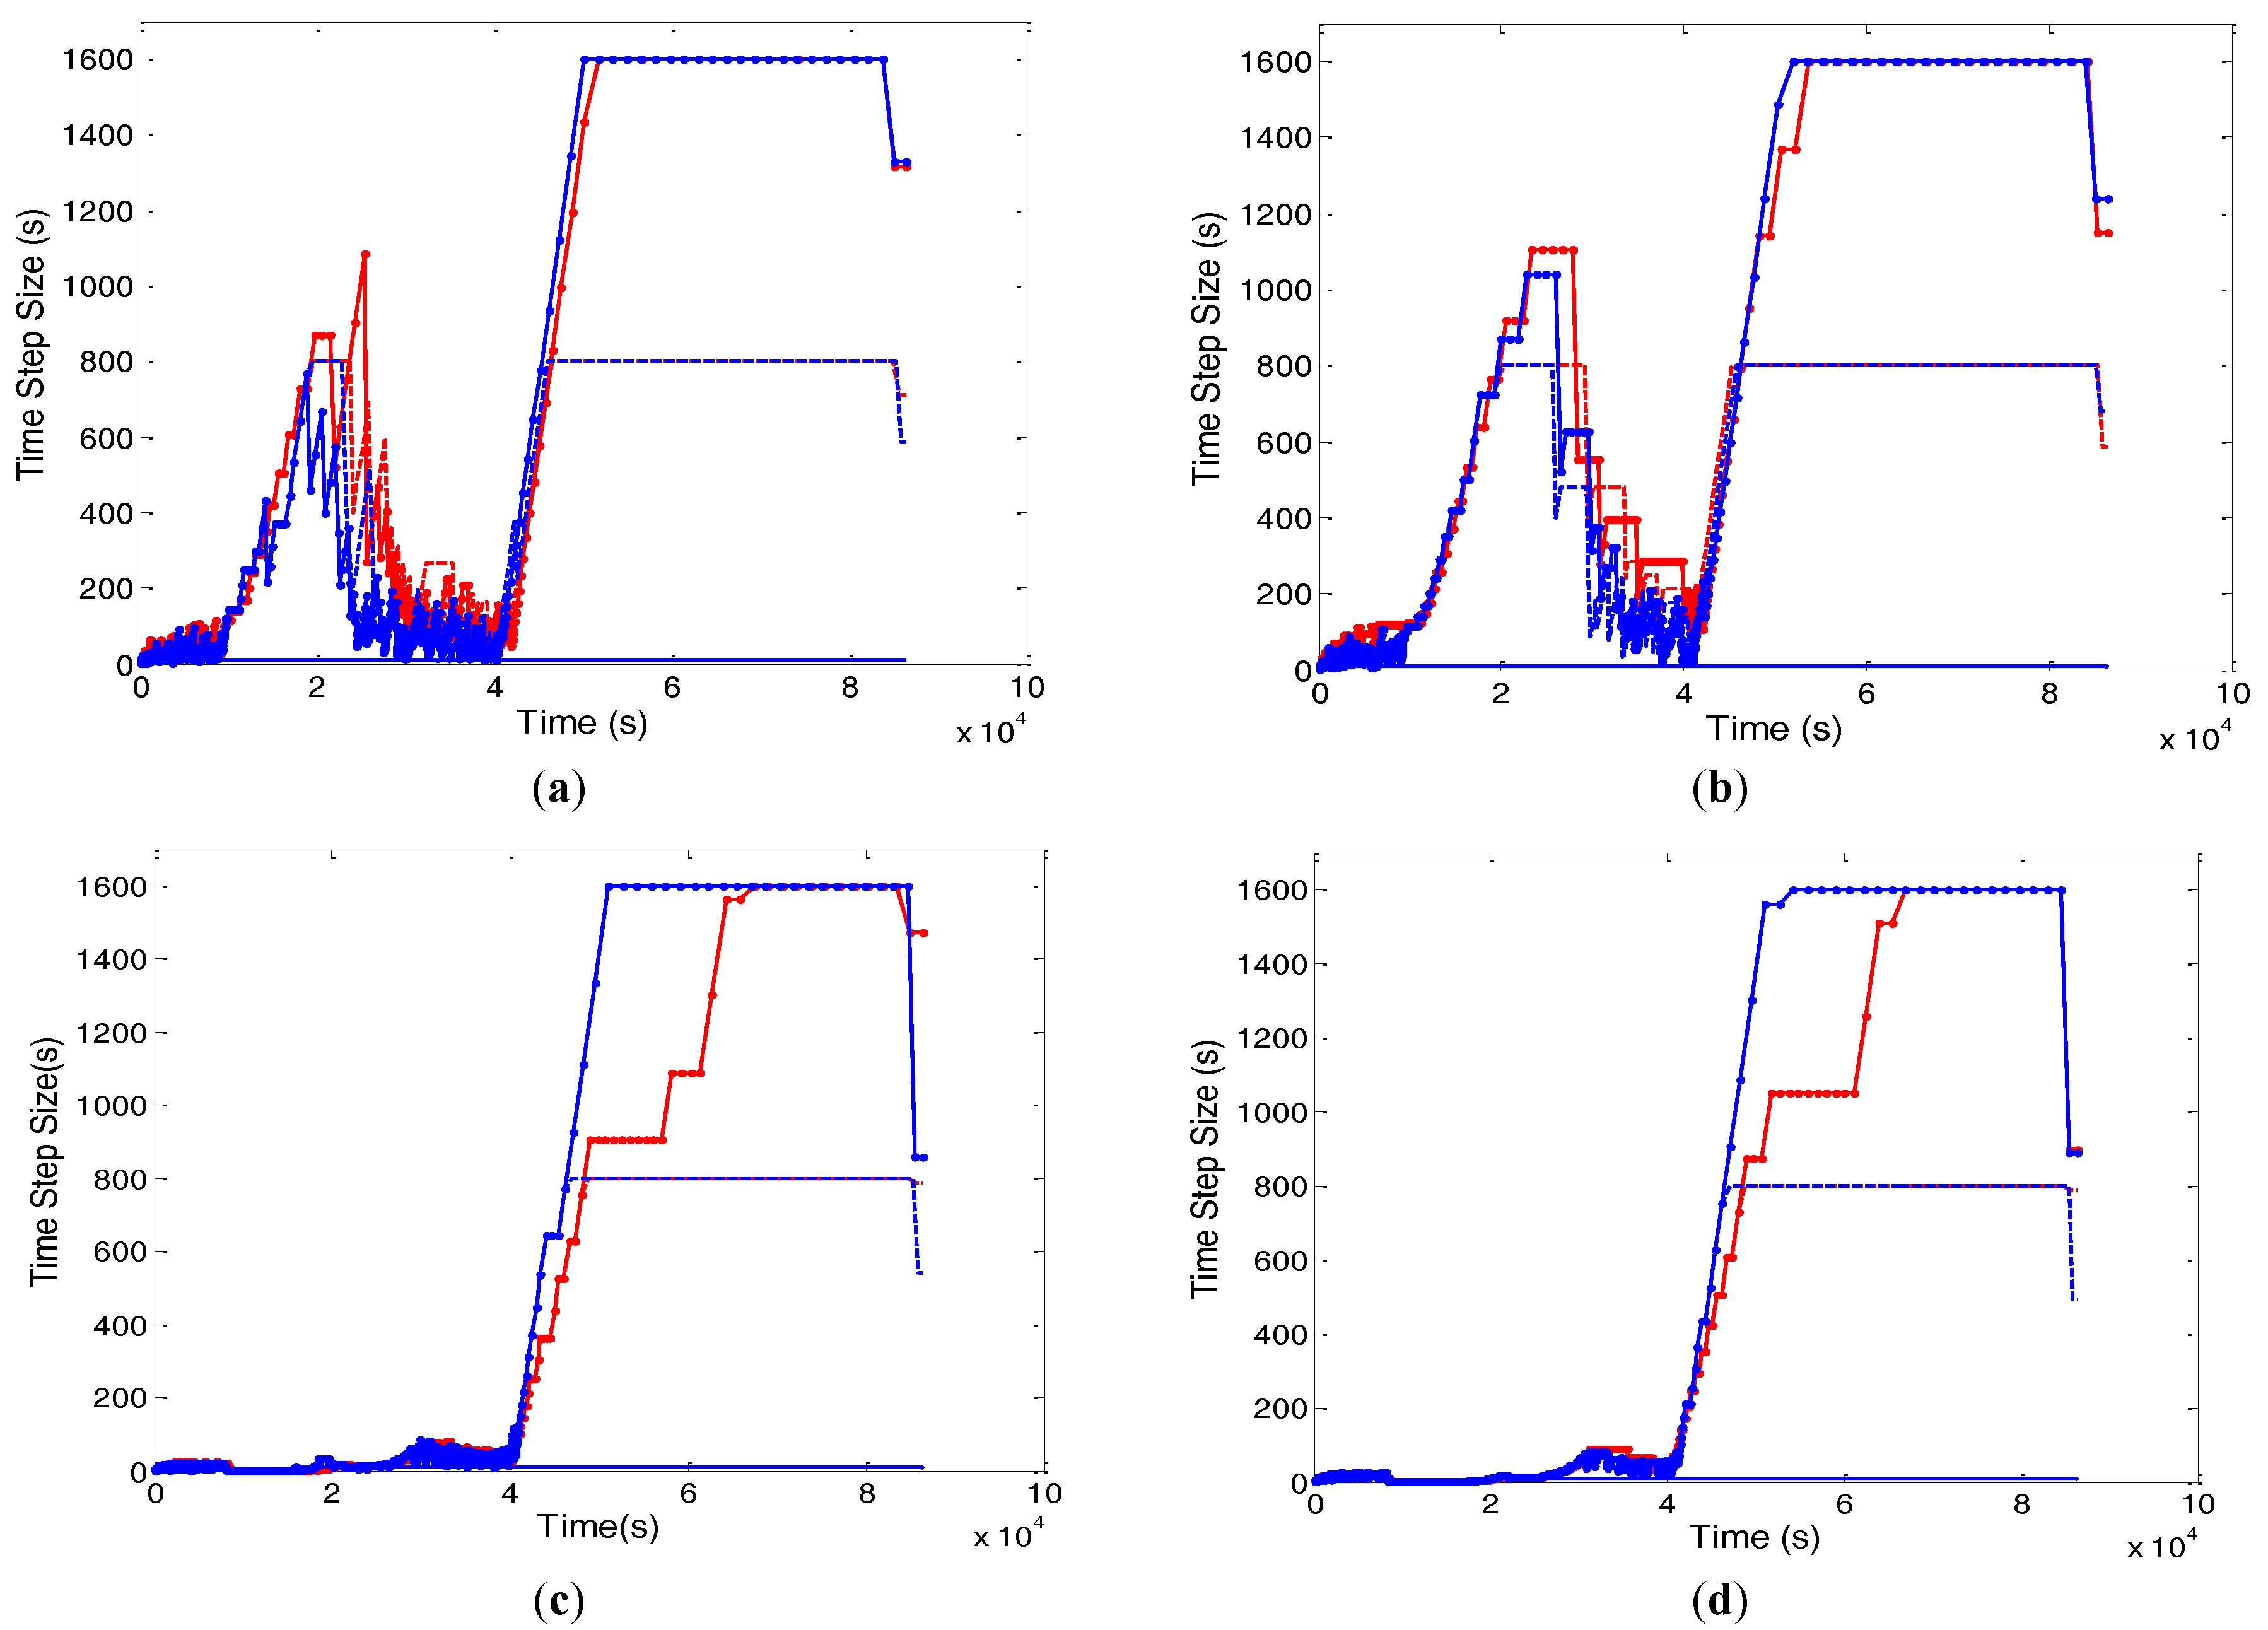
The graphical representation of time stepping (
Figure 5) for NLKP = 31 shows that the non-uniform case never achieved the assigned maximum time step size of 1000 s for 150 layers except at the beginning and end time and that the uniform distribution shows the same behavior during the simulation period 1.0 × 10
5 s to 2 × 10
5 s. On the other hand, for NLKP = 151, both uniform and non-uniform cases of 150 layers achieved a maximum step size 1000 s. The performance of 50 layers with 31 lookup points is similar to 150 layers. Furthermore, it is found that the simulation is completed with the maximum step size 1000 s, except at the time near about 2 × 10
5 s for 50 layers in the case of the uniform distribution.
For the Newton scheme, after 2.122 × 10⁵ s the uniform and non-uniform cases for all of the vertical layers with NLKP = 31 were unable to achieve the maximum step size 100 s throughout the simulation. Better performance is shown for the 1000 s case of 50 and 150 layers with NLKP = 31. For NLKP = 151, the time stepping behavior of the uniform and non-uniform cases is almost the same for both vertical discretizations.
In
Figure 6, the top two plots show the nonlinear iterations per time step of the Picard technique. Here, it is clear that the non-uniform distribution has difficulty meeting the convergence criterion for 150 layers with NLKP = 31 (similar results were obtained for 50 layers), whereas the uniform distribution needed only one iteration per time step for time step sizes of 1000 s. For 150 layers (as well as 50 layers) with NLKP = 151, both the uniform and non-uniform cases give almost the same behavior. The Newton scheme (bottom two plots of
Figure 6) shows similar behaviors as we found in the Picard case. In this case, the uniform distribution of NLKP = 31 performs better than NLKP = 151.
Figure 7 shows the profiles of total volumetric mass balance error obtained from the uniform and non-uniform case of Picard and Newton techniques of 150 layers. The uniform distribution of NLKP = 31 and NLKP = 151 shows smaller errors for both the Picard and Newton schemes.
The comparison of the computational performance of the lookup table tests is summarized in
Table 4 for the Picard and Newton schemes for the runs with and
. Efficiency analysis of performance indicators for the Picard and Newton schemes is discussed as follows.
For the Picard scheme, the case of 50 layers, uniform distributions give better results for all criteria except CPU with for both sets (31 and 151) of lookup points; however, for the case (results not shown), the non-uniform distribution gives better results on the basis of mass balance error and linear iterations per nonlinear iteration, and for 150 layers of NLKP = 31 with the 100 s and 1000 s cases, the performance of uniform distribution is better than non-uniform on the basis of volumetric mass balance error. On the other hand, for 151 lookup points, the non-uniform case results are better than the uniform case for both time step sizes. For 50 layers and NLKP = 31, in terms of mass balance in percentage error, the uniform case performs better than the non-uniform for the 100 s time step size, but for the 1000 s case, the performance is reversed. Non-uniform performs better than uniform for both time step sizes with NLKP = 151. For the 150 layers case, the uniform distribution is the better strategy for all of the investigated cases (100 s and 1000 s and NLKP = 31 and 151). For both the 50 and 150 layer cases, when 100 s is considered, the uniform distribution takes fewer time steps for every set of NLKP. For 150 layers with NLKP = 31, the uniform case needs only 10,558 time steps to complete the simulation, whereas the non-uniform lookup distribution takes many more time steps (28,699). For both layer discretizations with NLKP = 151, the uniform and non-uniform cases take a comparable number of time steps for the time step size of 1000 s, but for the 31 lookup point case (with 100 s), uniform is much better than non-uniform. The uniform distribution is better at achieving the maximum time step size for 100 s for both vertical layers with 31 and 151 NLKP. For 1000 s and NLKP = 151, the non-uniform distribution case is better than the uniform distribution. On the overall assessment of this case, the uniform distribution points need fewer iterations to achieve convergence for all of the cases. The results show that the uniform distribution needs fewer linear iterations per nonlinear iteration to satisfy the termination criteria, except for the case of NLKP = 151 with 1000 s of 150 layers. Very little back stepping (only 17) occurs in the case of uniform distribution, but for the non-uniform case, this happened 6969 times for 150 layers with NLKP = 31. Thus, a back stepping assessment implies uniform distributions are preferable.
For the Newton scheme, the findings are: for the 100 s case, at 50 layers, the non-uniform distribution gives better results than the uniform distribution for NLKP = 31 for both cumulative mass balance error in and also in percentage, but completely opposite results are found for NLKP = 151. Uniform distributions of 150 layers clearly show superior performance for both NLKP with 100 s. For the 1000 s case, it is the non-uniform distributions that perform better. For the NLKP = 151 case, uniform is better than non-uniform for both grid discretizations, but for NLKP = 31, non-uniform takes fewer time steps than the uniform distribution for 100 s. Except for NLKP = 31 of 50 layers for the 1000 s case, uniform needs fewer time steps than non-uniform. The uniform distribution with 151 lookup points of both spatial discretizations achieved bigger average time step sizes for 100 s and 1000 s, but for 31 lookup points, the non-uniform case achieves a larger average time step size. For all of the cases, uniform distributions take fewer nonlinear iterations per time step to meet the convergence criterion. For the 50 layer case, non-uniform needs fewer linear iterations per nonlinear iteration to satisfy the termination criteria for all of the cases. For the 150 layers case, the uniform distribution leads to advanced performance except for NLKP = 151 with 100 s. For 50 layers, the uniform distribution of lookup points does more back stepping than the non-uniform case for NLKP = 31, but when NLKP = 151, it does less back stepping for both step sizes. For 150 layers with NLKP = 151, the uniform distribution does less back stepping than the non-uniform, but with 31 points, the opposite occurred. The number of solver failures is less for all of the cases of uniform distributions with 150 layers, but it is more for 50 layers.
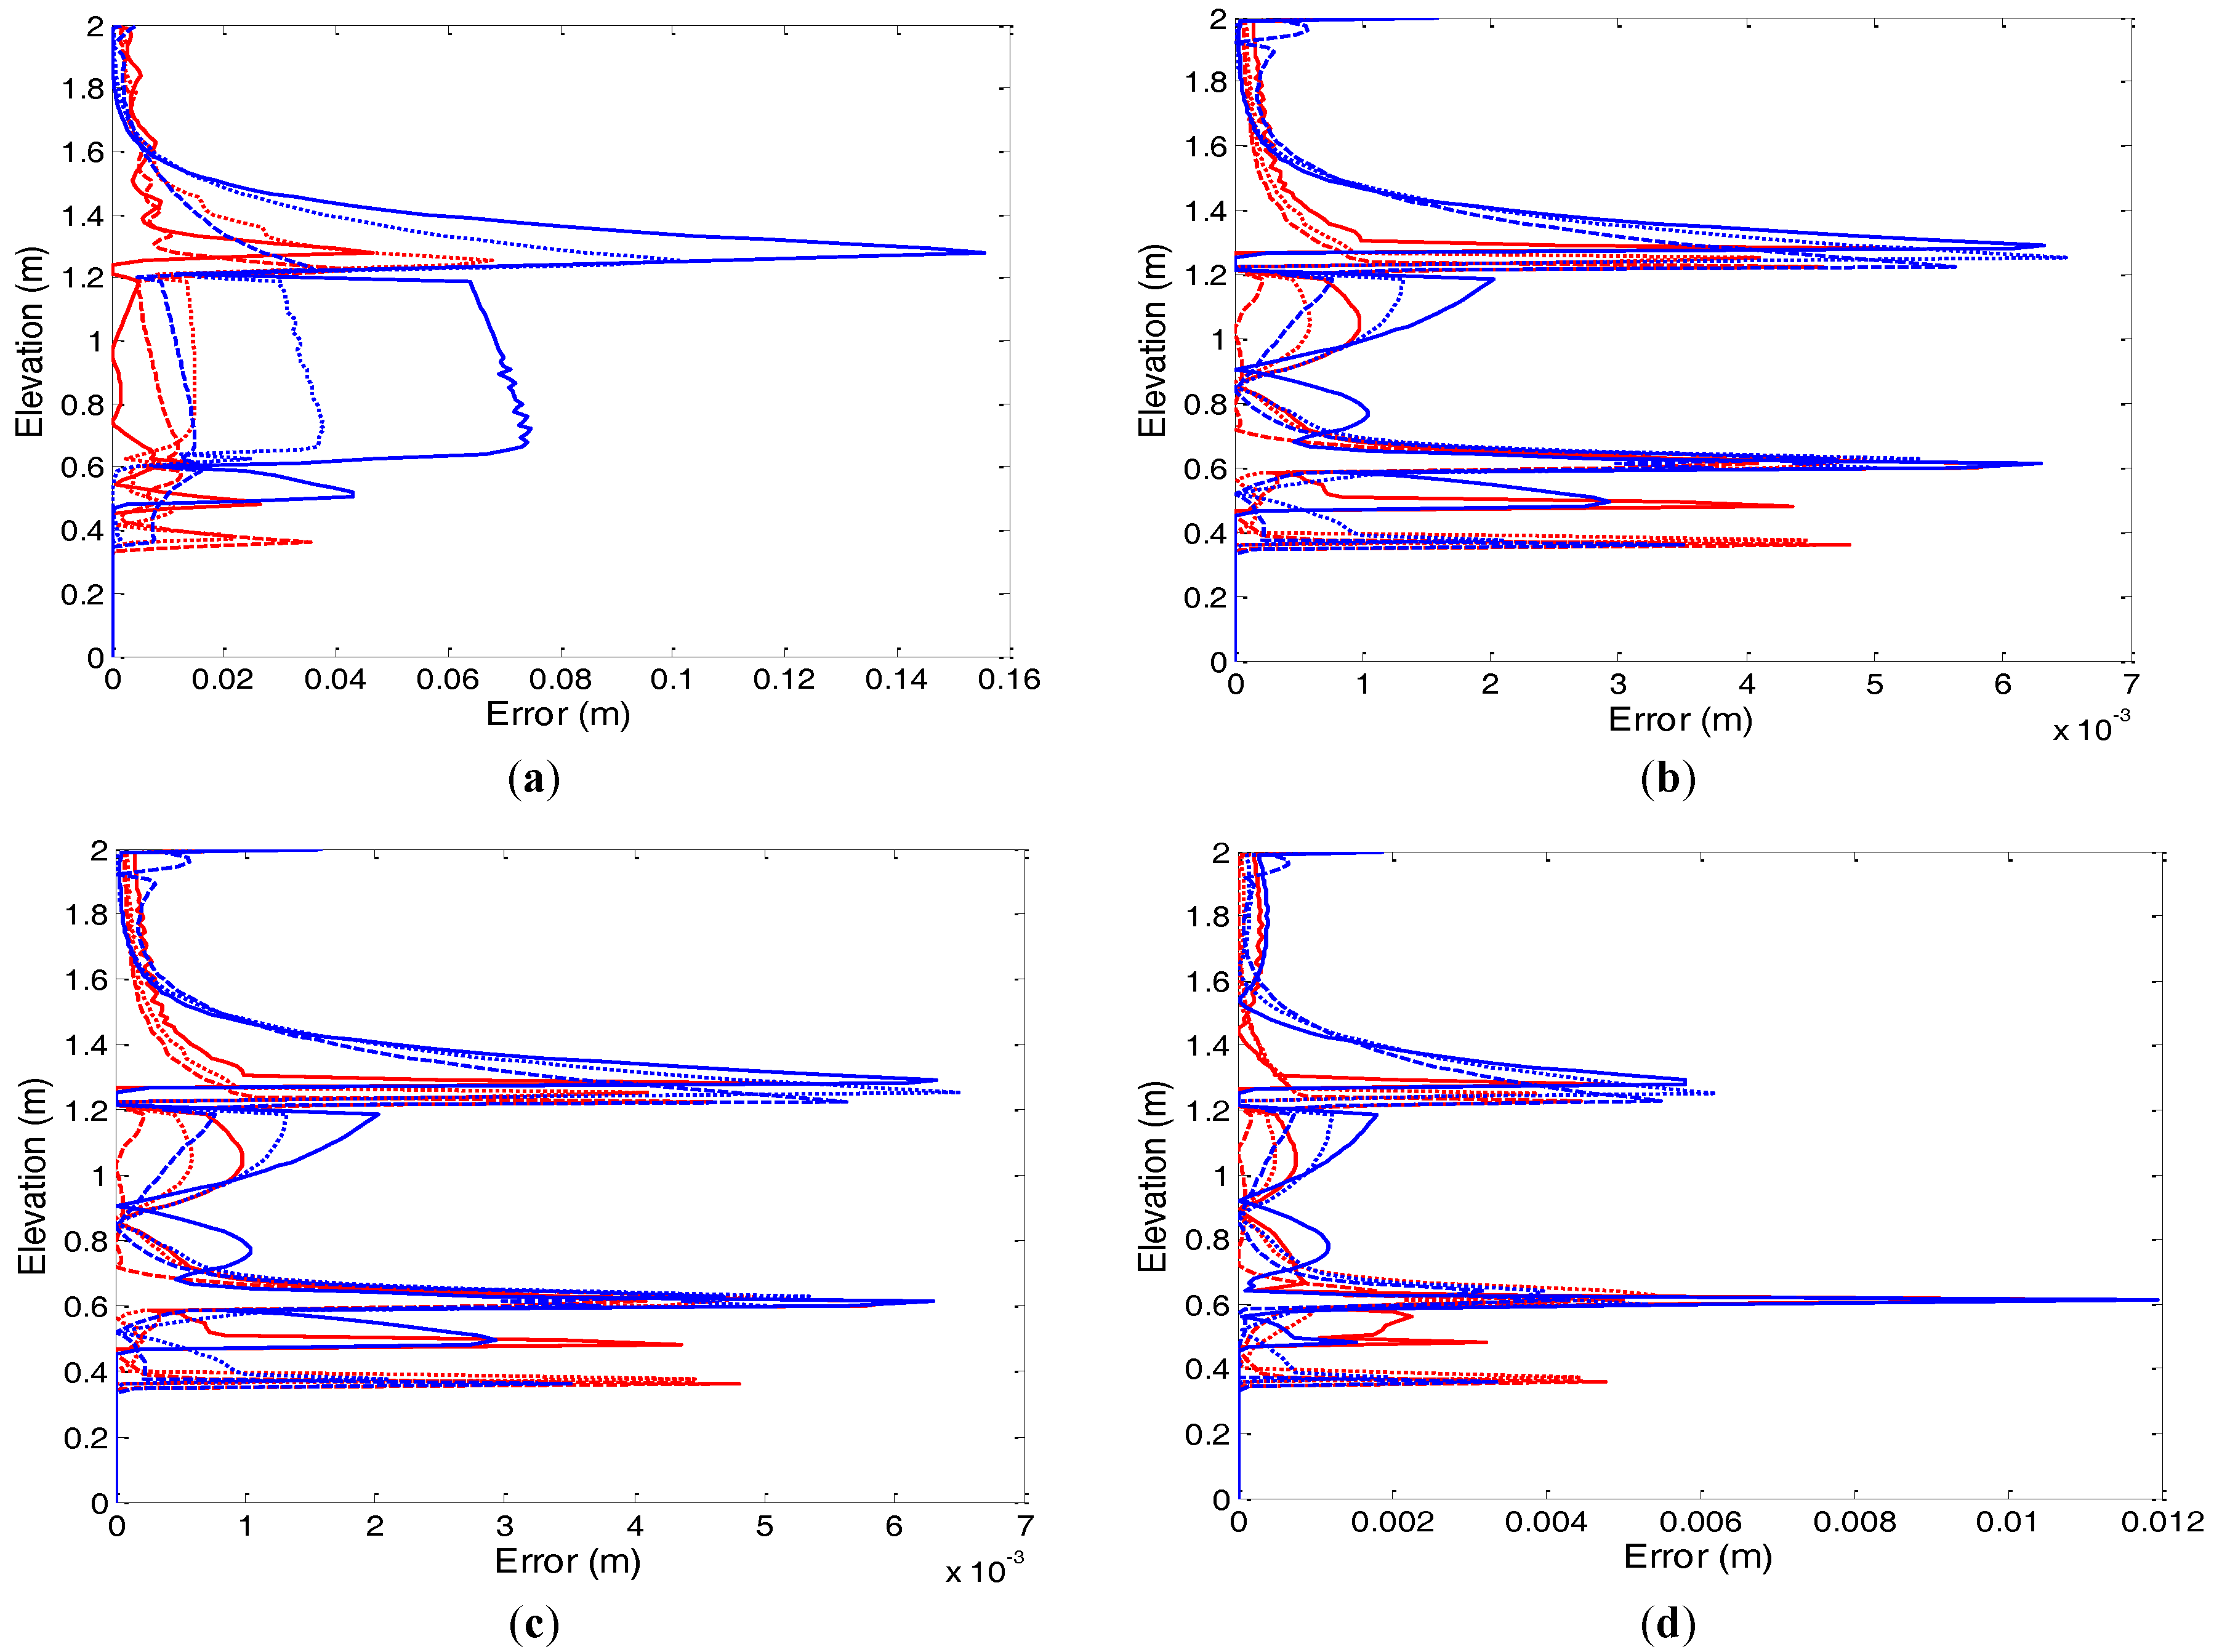
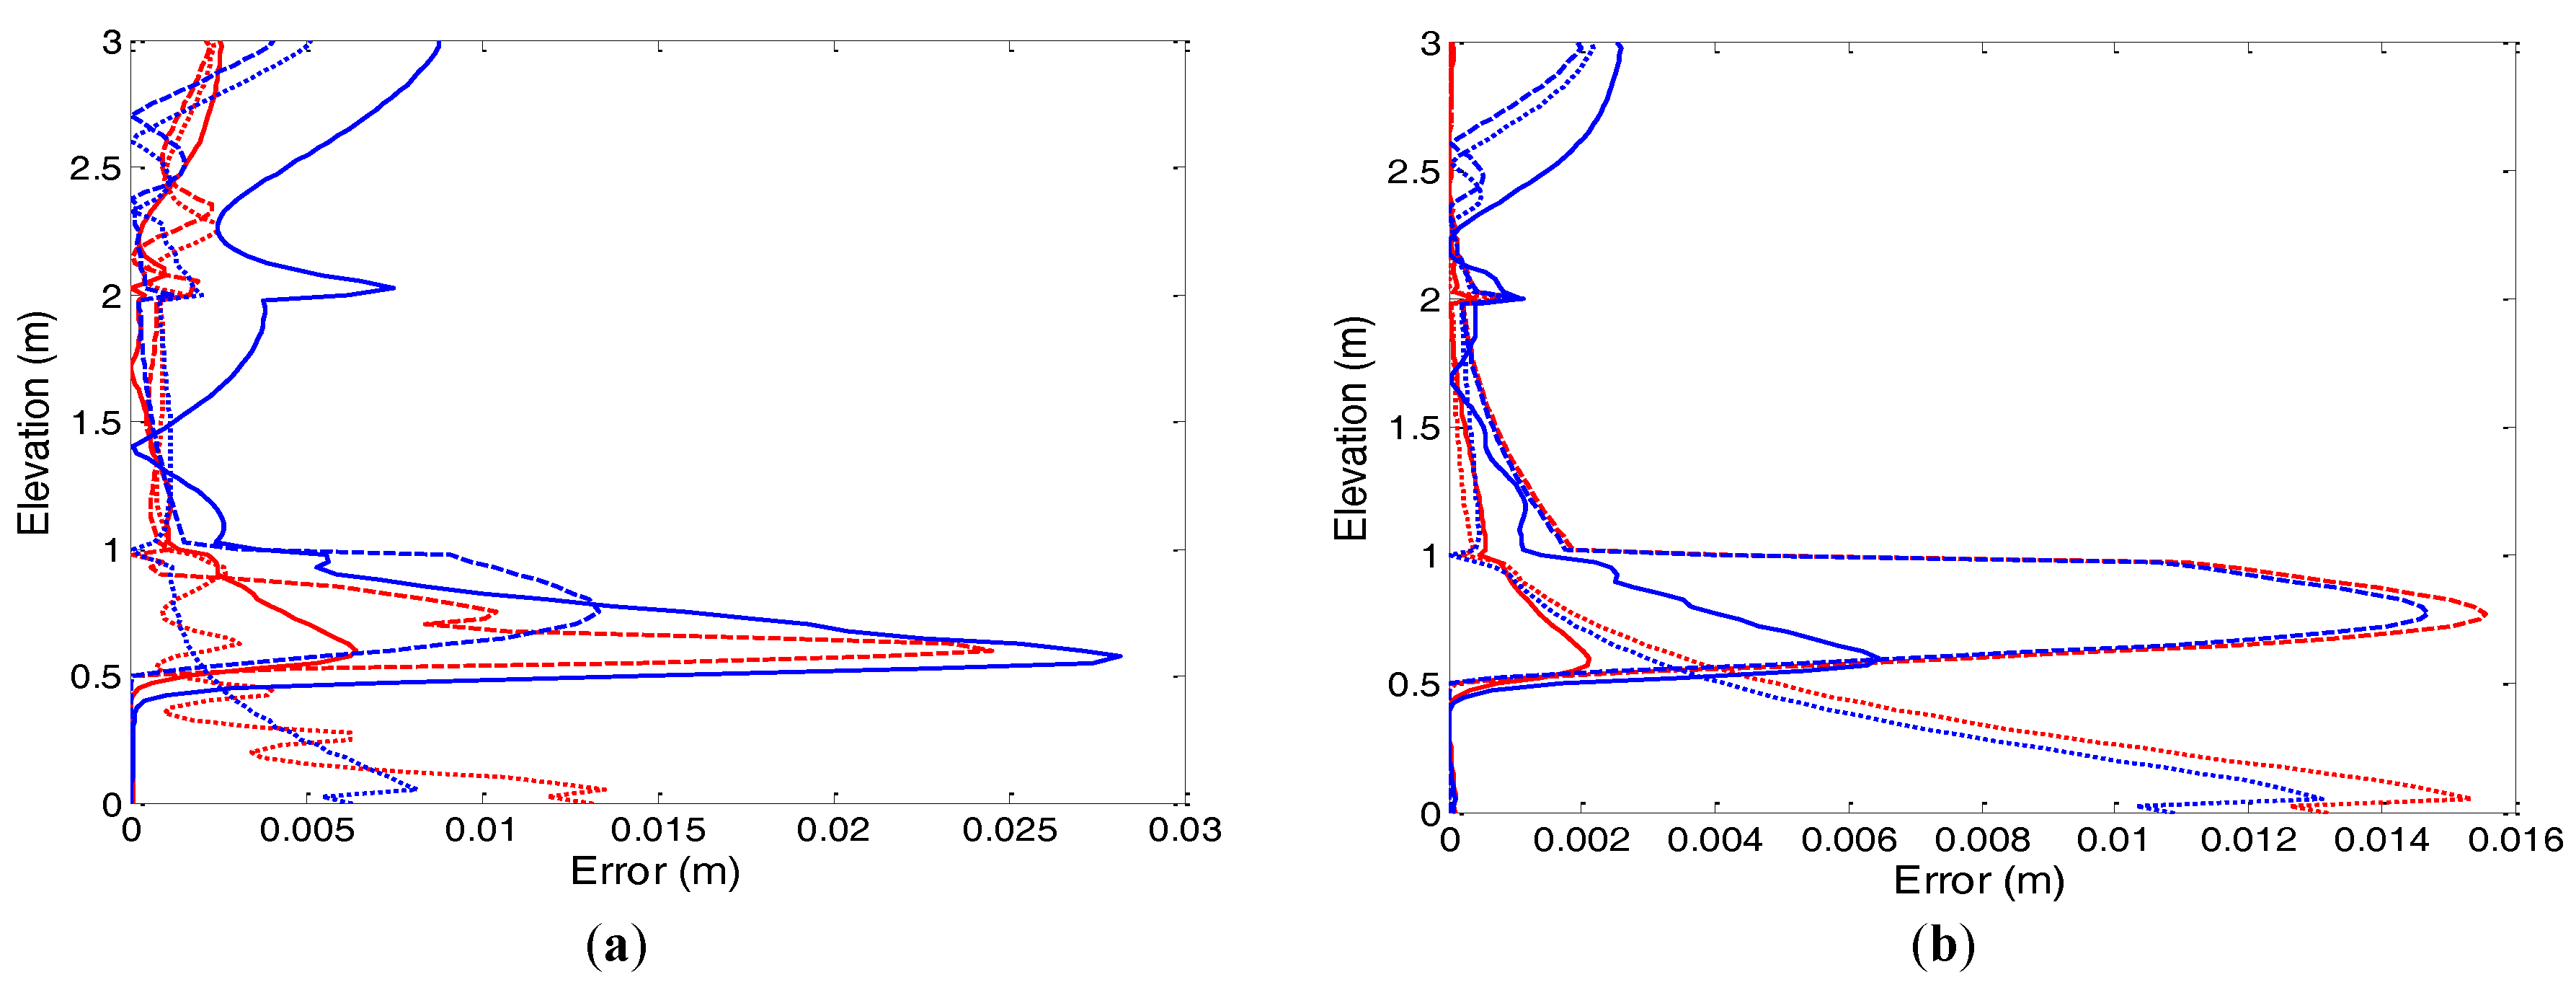
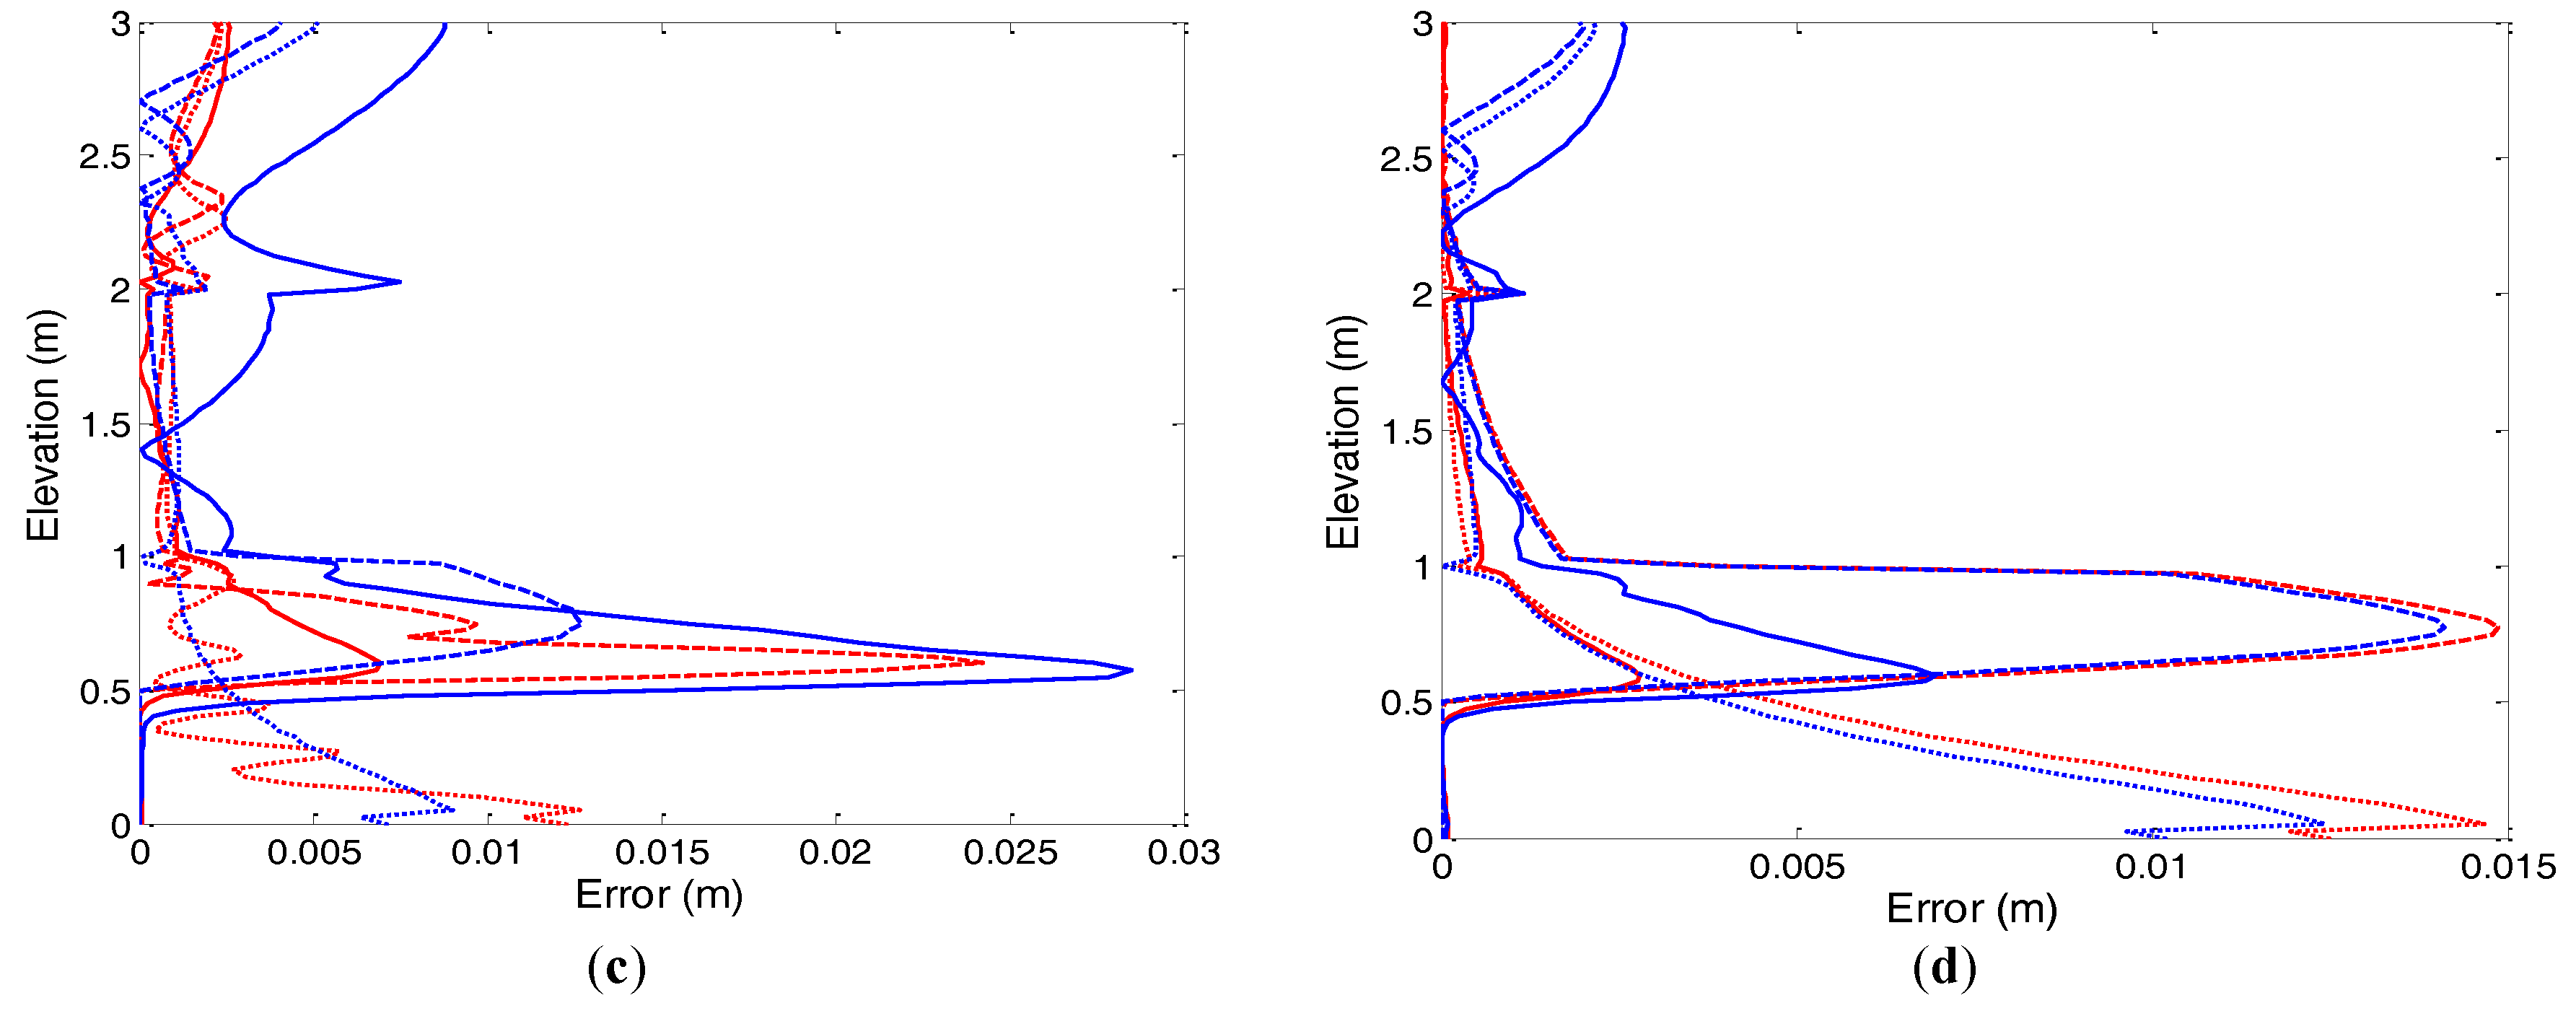
The root mean squared error (RMSE) behavior for the lookup tests under Picard and Newton iterations is shown in
Figure 8 for the case 100 s, and the results are summarized in
Table 5. The RMSEs are evaluated using the generated reference solution (301 nodes in the vertical soil column, 301 lookup points, step size 1 s and specified nonlinear tolerance 10
−3. The results from these figures show that the uniform distribution scheme is as efficient as the non-uniform distribution method for all cases. Similar performance is observed for the step size of 1000 s of 50 and 150 layers.
4.3. Test Problem 3
The present test problem involves one-dimensional flow into an initially dry, 3 m deep, layered soil of sand and clay. The van Genuchten model is used to describe the soil moisture retention curves. The hydraulic properties of the sand and clay are given in
Table 6, and the initial pressure head is set to −480 cm. The soil profile is sand for 0 < z < 100 cm and 200 cm < z < 300 cm and clay for 100 cm < z < 200 cm. A no-flow boundary condition is applied everywhere except for a water flux rate of 50 cm/day that is applied to the top of the vertical soil column, and the simulation period is one day. This problem was specifically devised for testing the numerical algorithm’s ability to survive both very dry conditions and transitions to a saturated state.
To explore the behavior of lookup table points for solving Richards’ equation, two levels of spatial grid sizes, (120 layers), three different time step sizes, 10 s, 800 s and 1600 s, and two sets of lookup points (31 and 151) in the soil moisture retention curves were used in the simulation. This kind of test problem is very complicated to simulate. The lookup points are concentrated in the sharp region of the moisture curves for the non-uniform distribution case. There are 24 runs in total for the iteration schemes (Picard and Newton).
The van Genuchten soil moisture curves for the uniform and non-uniform distribution of lookup points are presented in
Figure 9 and
Figure 10. The computed water saturation after one day is illustrated in
Figure 11 for all cases of uniform and non-uniform distribution strategies. All solutions obtained using both grid discretizations are in good agreement. Although numerical solutions to hydrological models are known to be quite sensitive to grid resolution [
44,
45,
46], both of the grid sizes used in this test problem (60 layers and 120 layers) are sufficient to capture accurately the dynamics of this infiltration test case.
The time stepping, nonlinear convergence and cumulative mass balance error plots for the 120 layers case of uniform and non-uniform NLKP are presented in
Figure 12,
Figure 13 and
Figure 14 for the Picard and Newton schemes. From the Picard time stepping graph (top two of
Figure 12), the uniform distribution takes bigger time steps for the two sets of lookup points with 800 s and 1600 s from the beginning to 40,000 s, after which, there is little difference between the behavior of the uniform and non-uniform distributions. For 10 s, both the uniform and non-uniform cases run with the maximum step size until the end of the simulation. For the Newton case, after 40,000 s, the non-uniform case performs better for all runs with 1600 s. Before this time, the uniform and non-uniform cases behave comparably for all runs. The evolution of nonlinear Picard iterations (
Figure 13) shows that the non-uniform case needs fewer iterations per time step compared to the uniform distribution of 800 s and 1600 s step sizes for each NLKP. Better performance is shown for the case of 10 s. On the other hand, converse results are obtained for the Newton run. The dissimilarity in performance of the two iterative schemes on account of convergence behavior is exhibited for this test problem compared to the previous problem. The cumulative mass balance error graphs for Picard and Newton (
Figure 14) show that Picard performs better with uniformly-distributed lookup points, while Newton does better in the non-uniform case.
Table 7 summarizes the results of the lookup table tests of the numerical model for the Picard and Newton iterative schemes. The computational performances are discussed one by one for the Picard and Newton schemes as follows.
Non-uniform spatial discretizations in the retention curves give smaller volumetric mass balance errors for all layers and step sizes of the Picard iterative technique. According to the results in percentage mass balance error, the non-uniform case again performs better. For all combinations of NLKP and step sizes, the uniform allocation approach required a smaller number of time steps than the non-uniform case to complete the one-day simulation. On the basis of average time step size per time step, for all categories, the uniform distribution attained a larger value than the non-uniform case. Except for the time step size 1600 s case, non-uniform meshes needed fewer nonlinear iterations per time step to meet the convergence criteria. For each selection of NLKP with every time step size, less back stepping occurred for the uniform case.
For the Newton scheme, observations are: uniformly distributed lookup points produce smaller volumetric mass balance errors than the non-uniform case for 800 s and 1600 s and for both settings of NLKP and vertical layer discretization. On the other hand, for the 10 s time step size, very close values are obtained for the uniform and non-uniform approaches. On the basis of percentage error of volumetric mass balance outcomes, the same behavior is found for uniform and non-uniform cases, as we saw for total volumetric mass balance error. The uniform strategy needs many more time steps to complete the simulation for the cases of time step size 800 s and 1600 s for 120 layers. For NLKP = 31 of 60 layers, the average time step for uniform distributions is larger than for non-uniform in the case of 10 s and 800 s, but for the 1600 s, the non-uniform case is larger. In the case of NLKP = 31 of 120 layers, the non-uniform achieves bigger step sizes for 10 s and 800 s, but not for the 1600 s case. For NLKP = 151 of 120 layers, in the 800 s and 1600 s cases, uniform distributions perform better, but not for the 10 s case. For the 60 layers case, the non-uniform distribution takes fewer nonlinear iterations per time step except for the 1600 s case. In the case of 10 s with NLKP = 151 of 120 layers, the uniform and non-uniform runs achieve a very close value of nonlinear iterations per time step (4.06 and 4.07, respectively). Fewer back steps occur for all of the uniform distribution cases compared to the non-uniform distribution of lookup points. There is little difference between uniform and non-uniform distributions in terms of linear solver failures.
The RMSE performance for uniform and non-uniform distributions of lookup points is shown in
Figure 15 for the Picard (top two) and Newton (bottom two) schemes. The numerically-generated reference solution is made with a dense grid,
(240 layers), NLKP = 301, time step size is 1 s, convergence tolerance of
. The comparison of calculated RMSE at three different times (32,000 s, 56,000 s and 86,400 s) for both cases are presented in
Table 8. For the Picard method, for NLKP = 31 with 10 s, the uniform case shows smaller error only at time 32,000 s, while at times 56,000 s and 86,400 s, the non-uniform case performs better. Note that, for 800 s and 1600 s, the non-uniform case gives smaller values than the uniform case for both layers, except at time 56,000 s. For NLKP = 151 and 60 layers, the uniform case shows smaller root mean squared errors than non-uniform, but for 120 layers, the values are same at the three time levels for 10 s. For 800 s and 1600 s, the non-uniform distribution performs better for each of the layers at the three indicated simulation time levels. For the Newton iterative scheme, we found that the RMSE values at the three different times for the uniform distribution are smaller than for the non-uniform distribution for all cases except 10 s.
