Estimation of Peak Discharge in a Poorly Gauged Catchment Based on a Specified Hyetograph Model and Geomorphological Parameters: Case Study for the 23–24 October 2008 Flood, KALAYA Basin, Tangier, Morocco

Abstract
:1. Introduction
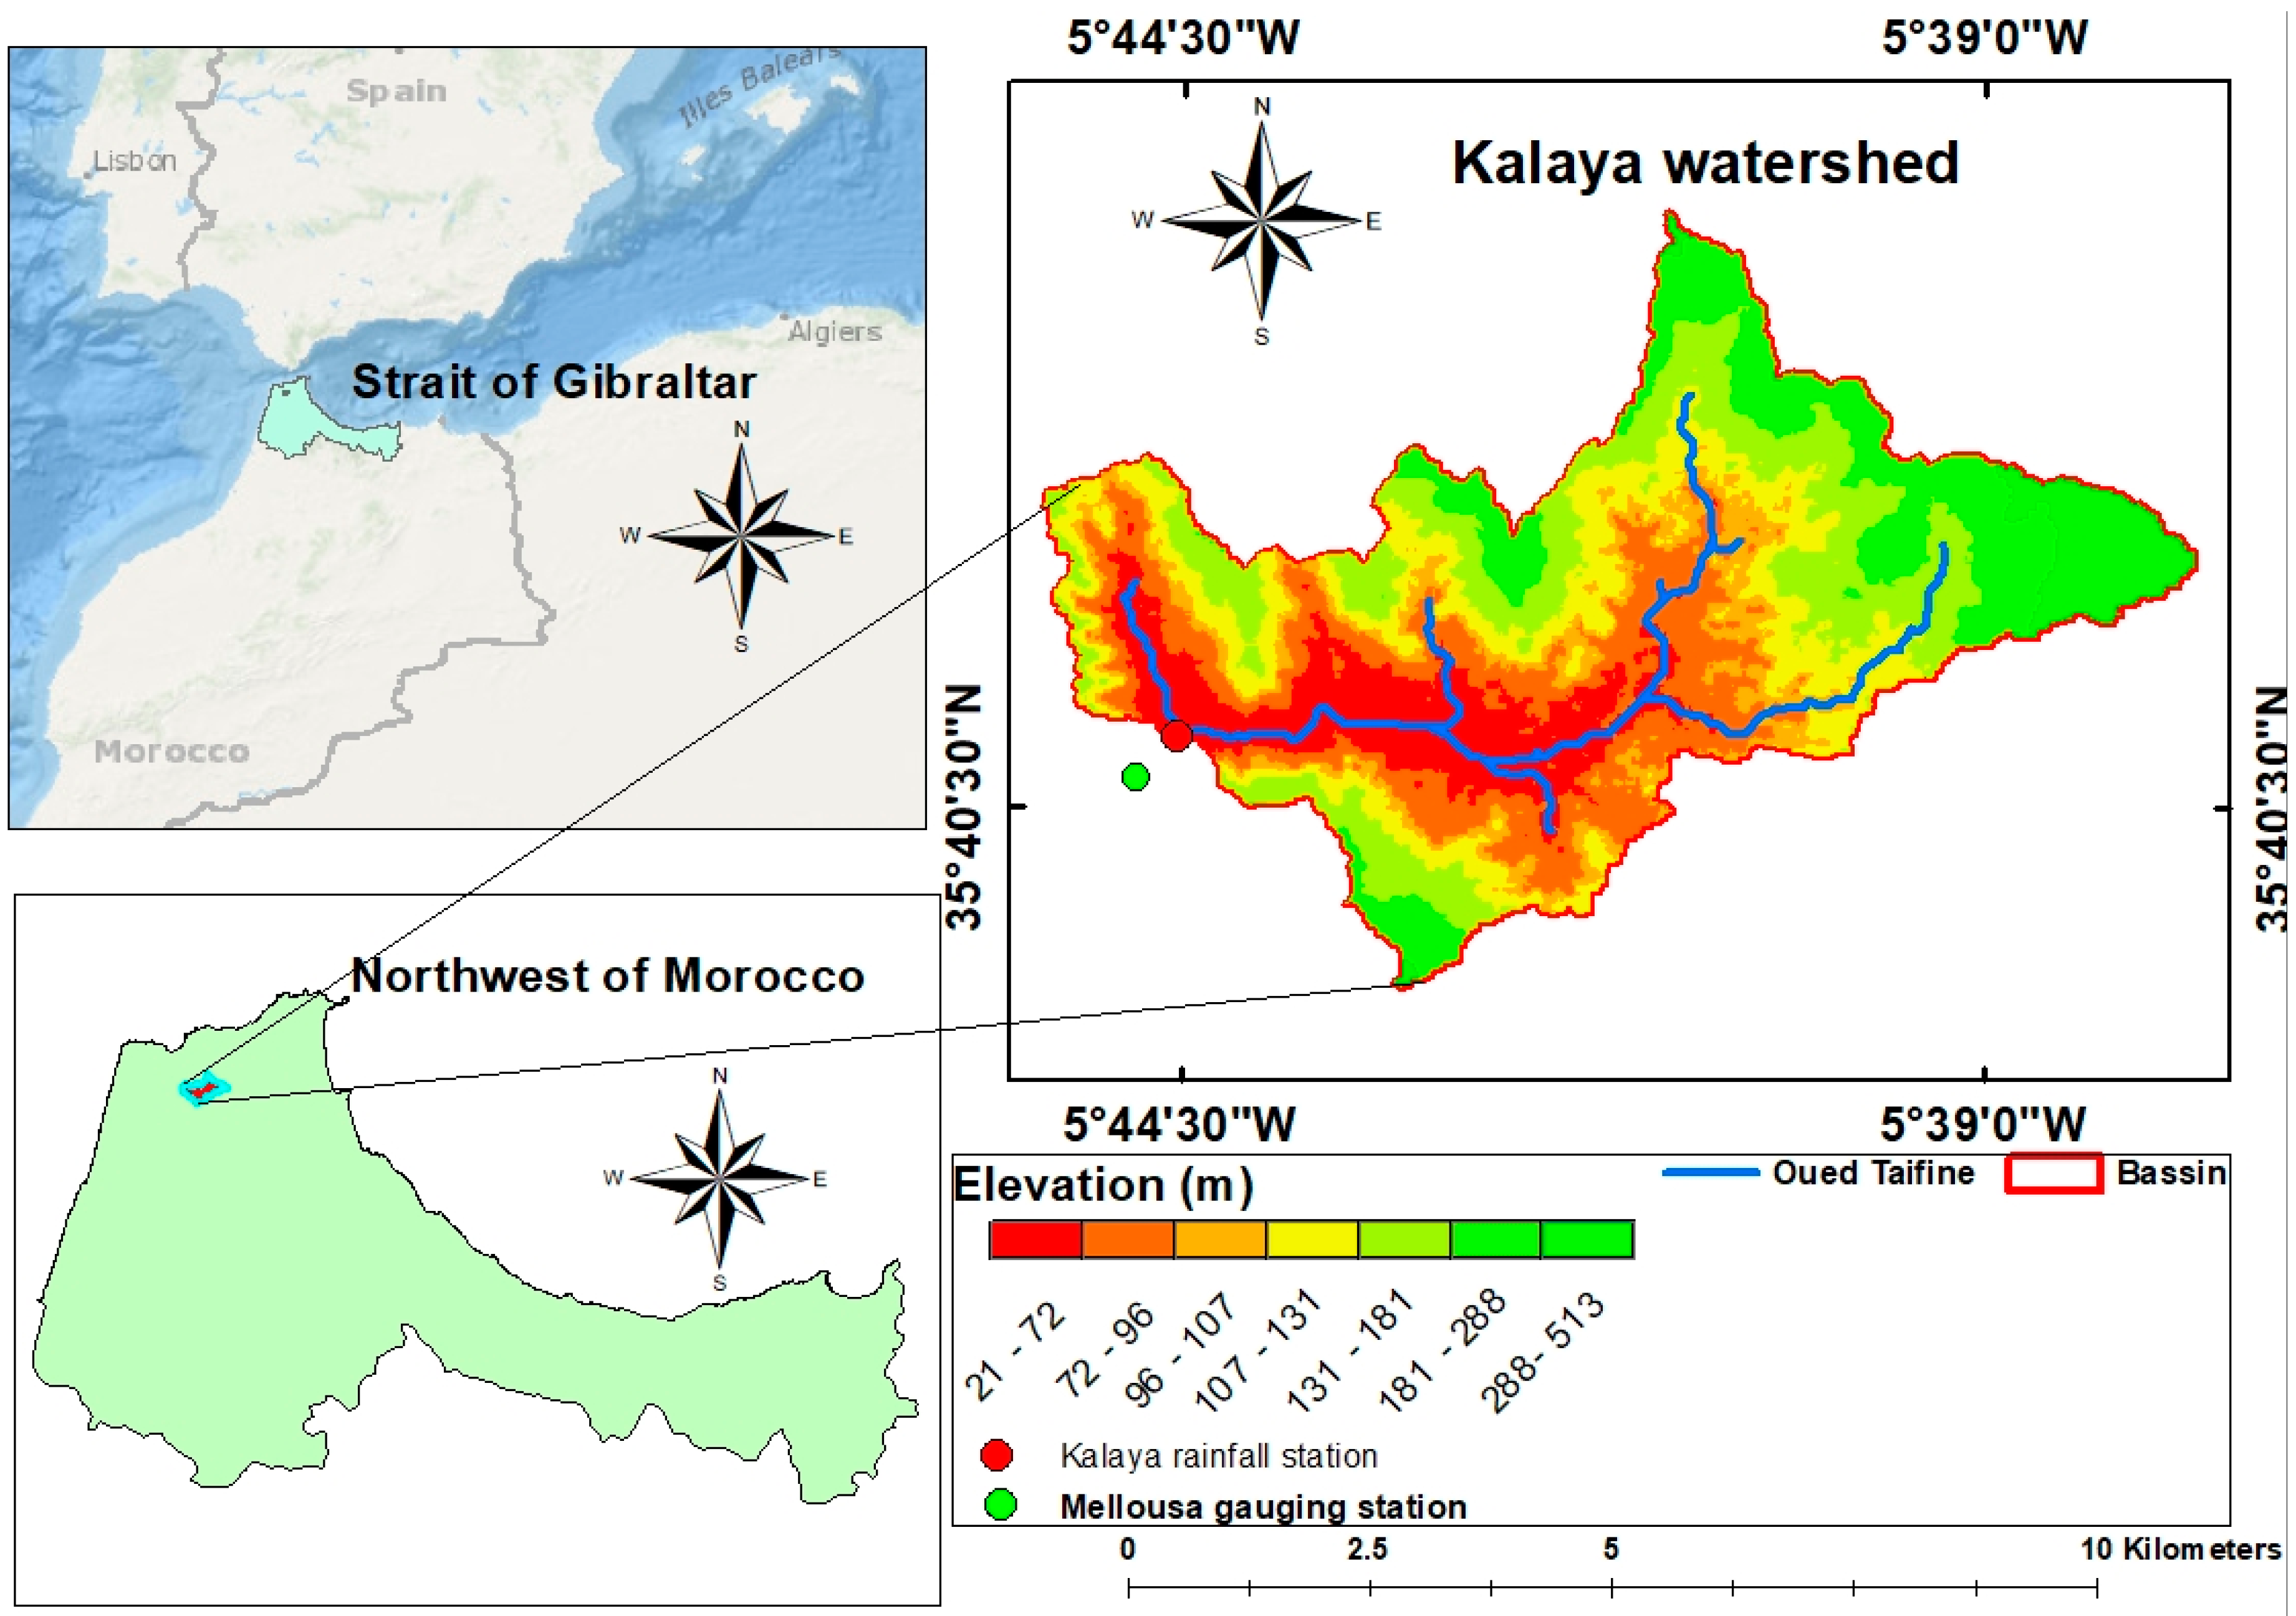
2. Study Area
3. Materials and Methods
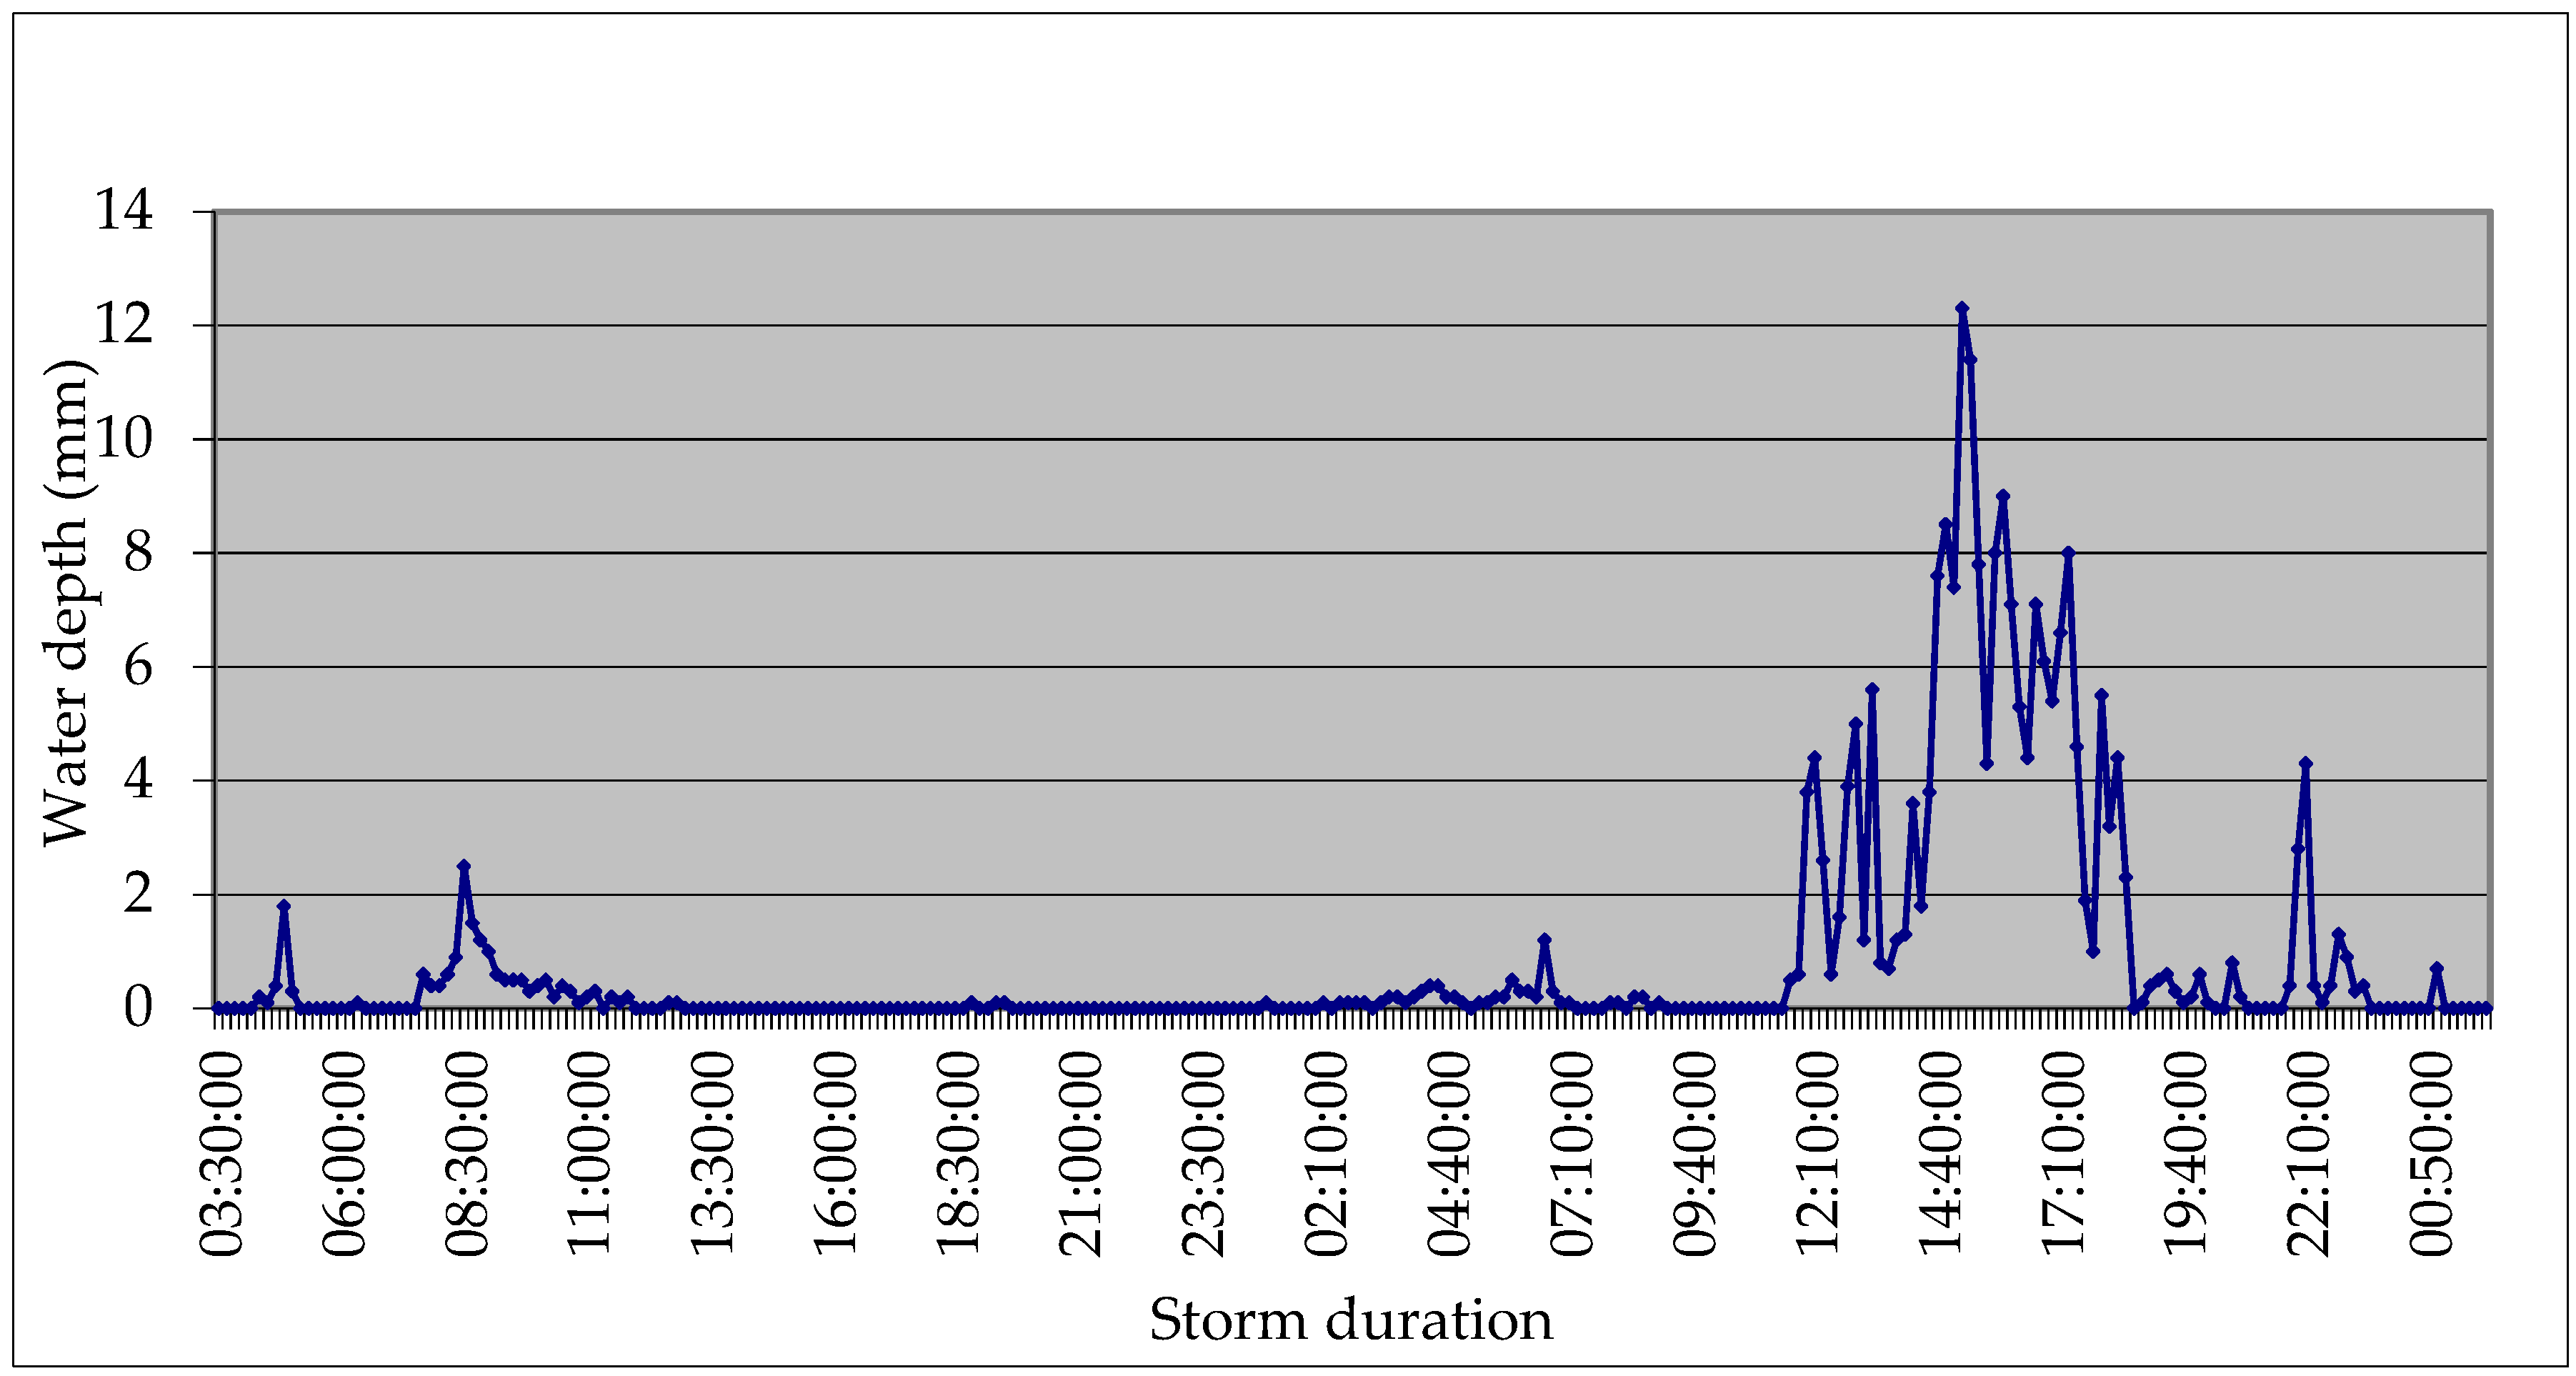
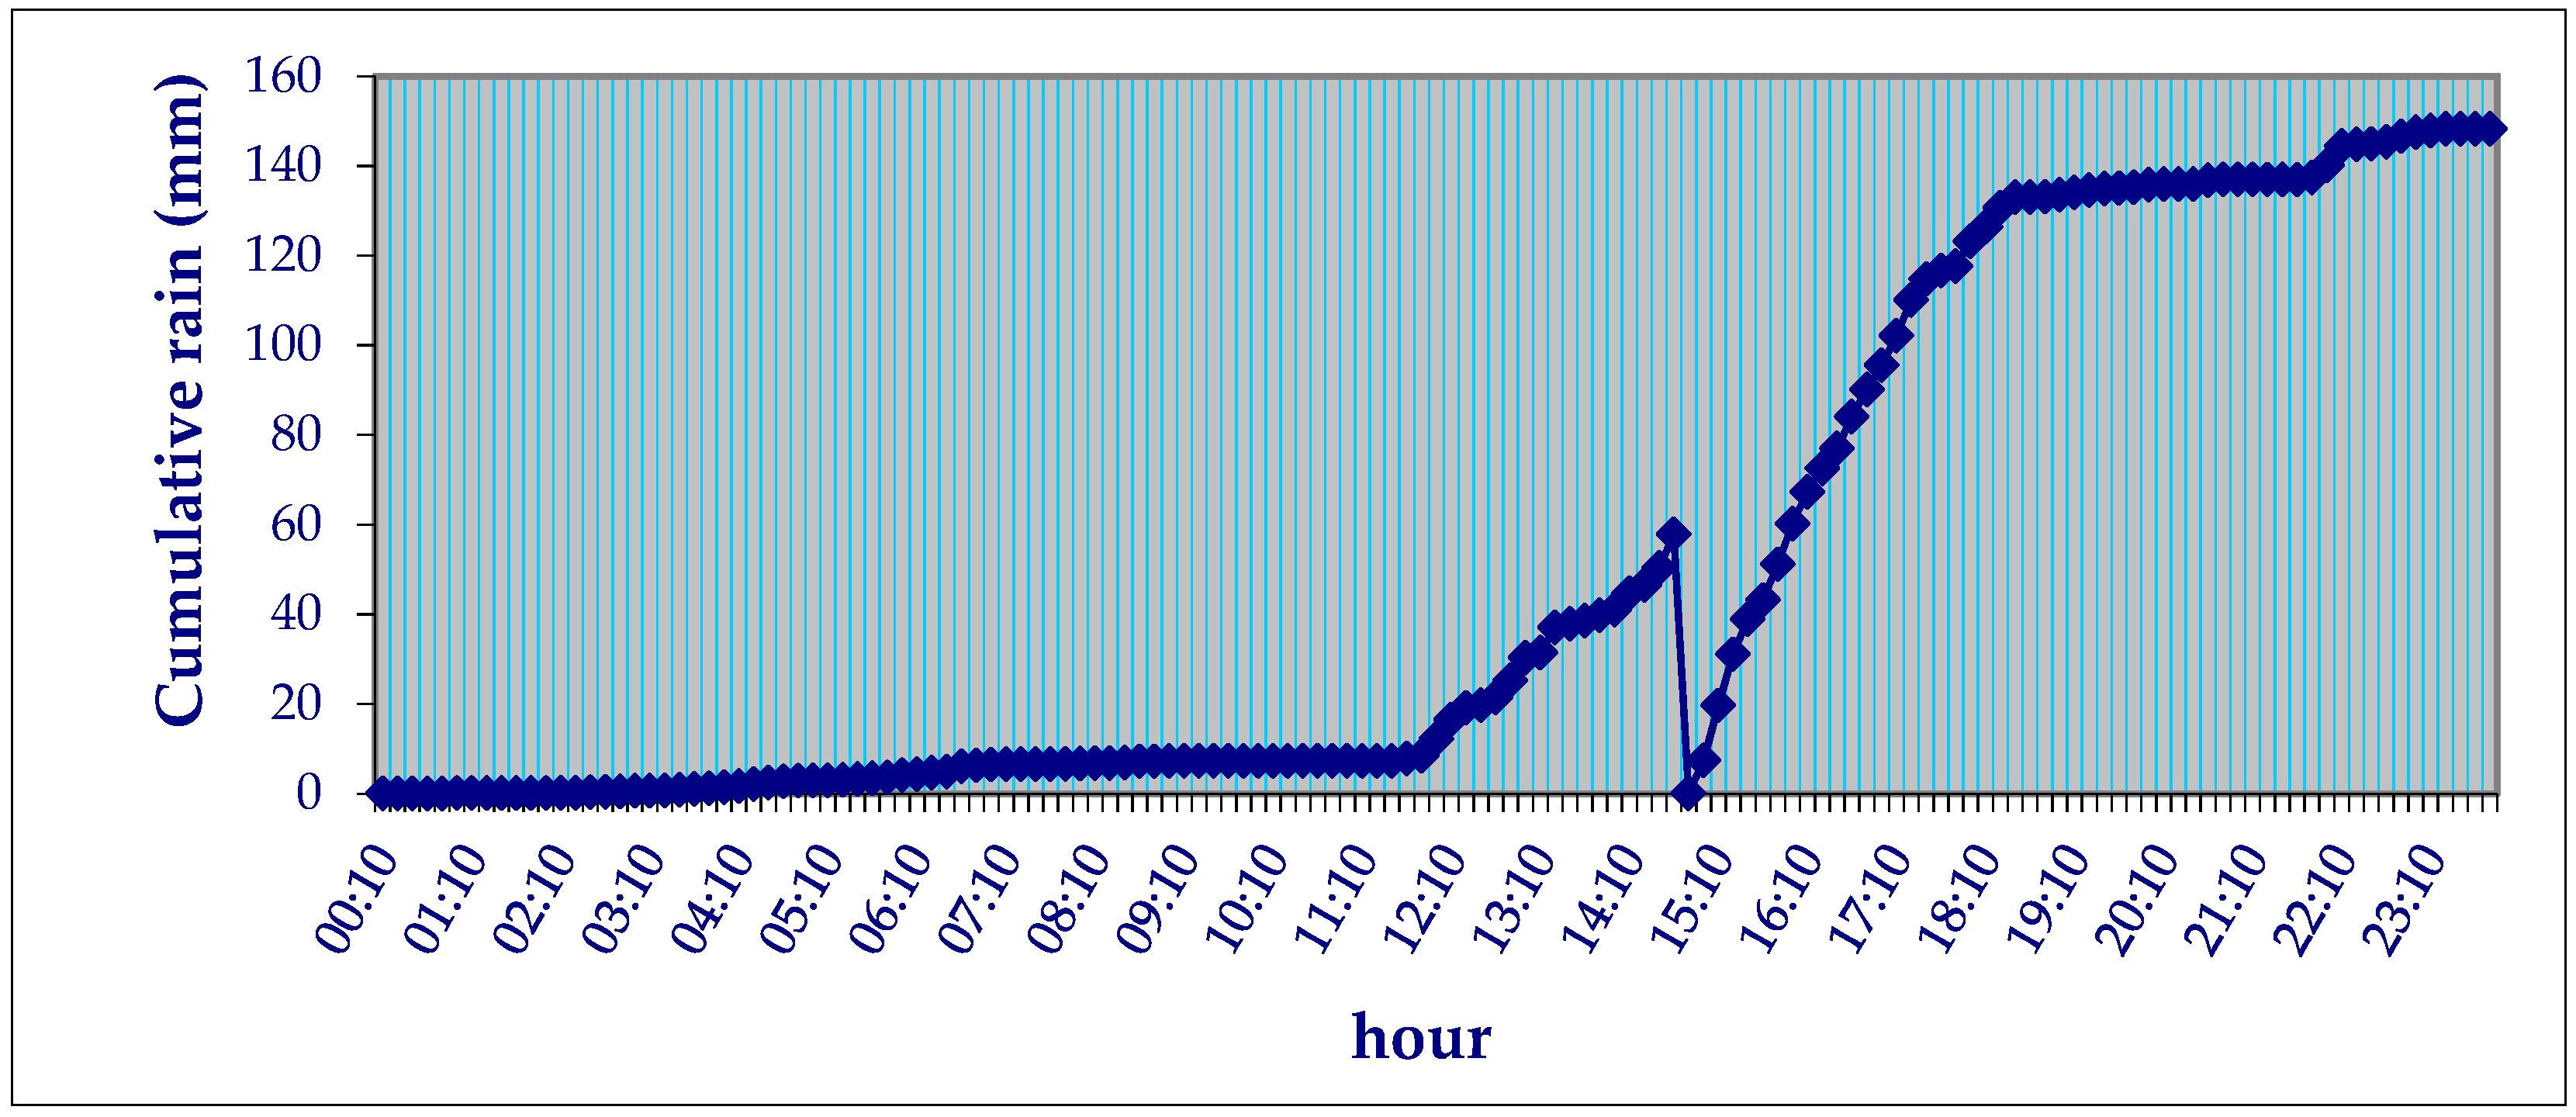
3.1. Analysis of Rainfall Data
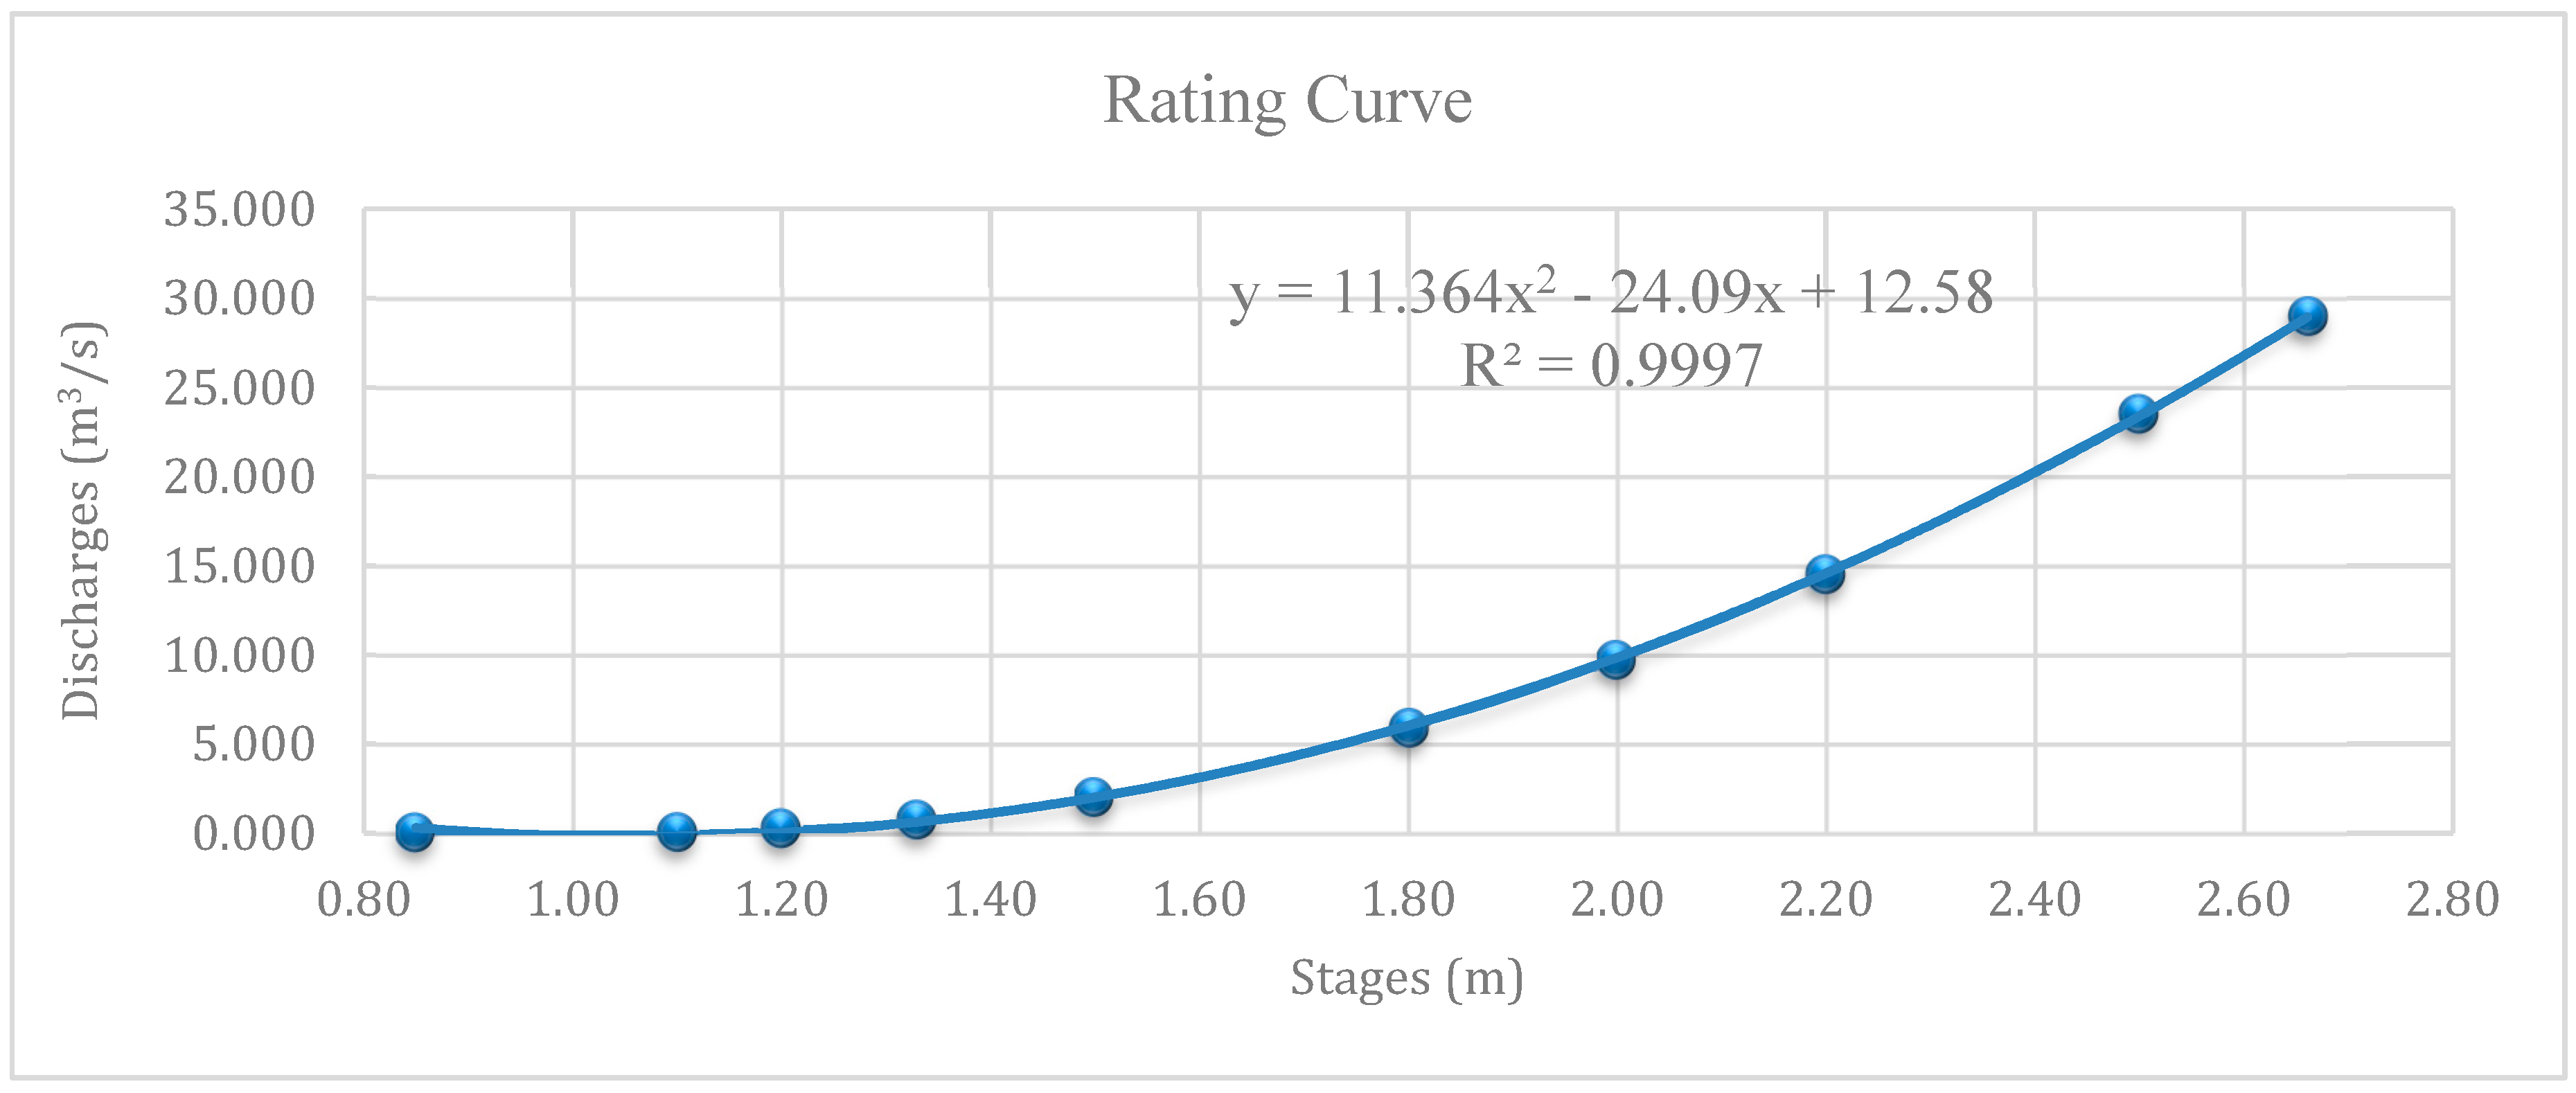
3.2. Instantaneous Flows Determination
- (m3/s) = Rate of calculated flow width.
- (m) = Corresponding side reference to the flow rate qi.
- (m) = Gauge reference medium side (m).
- Q (m3/s) = Total rate of flow corresponding to the medium side H.
4. Results
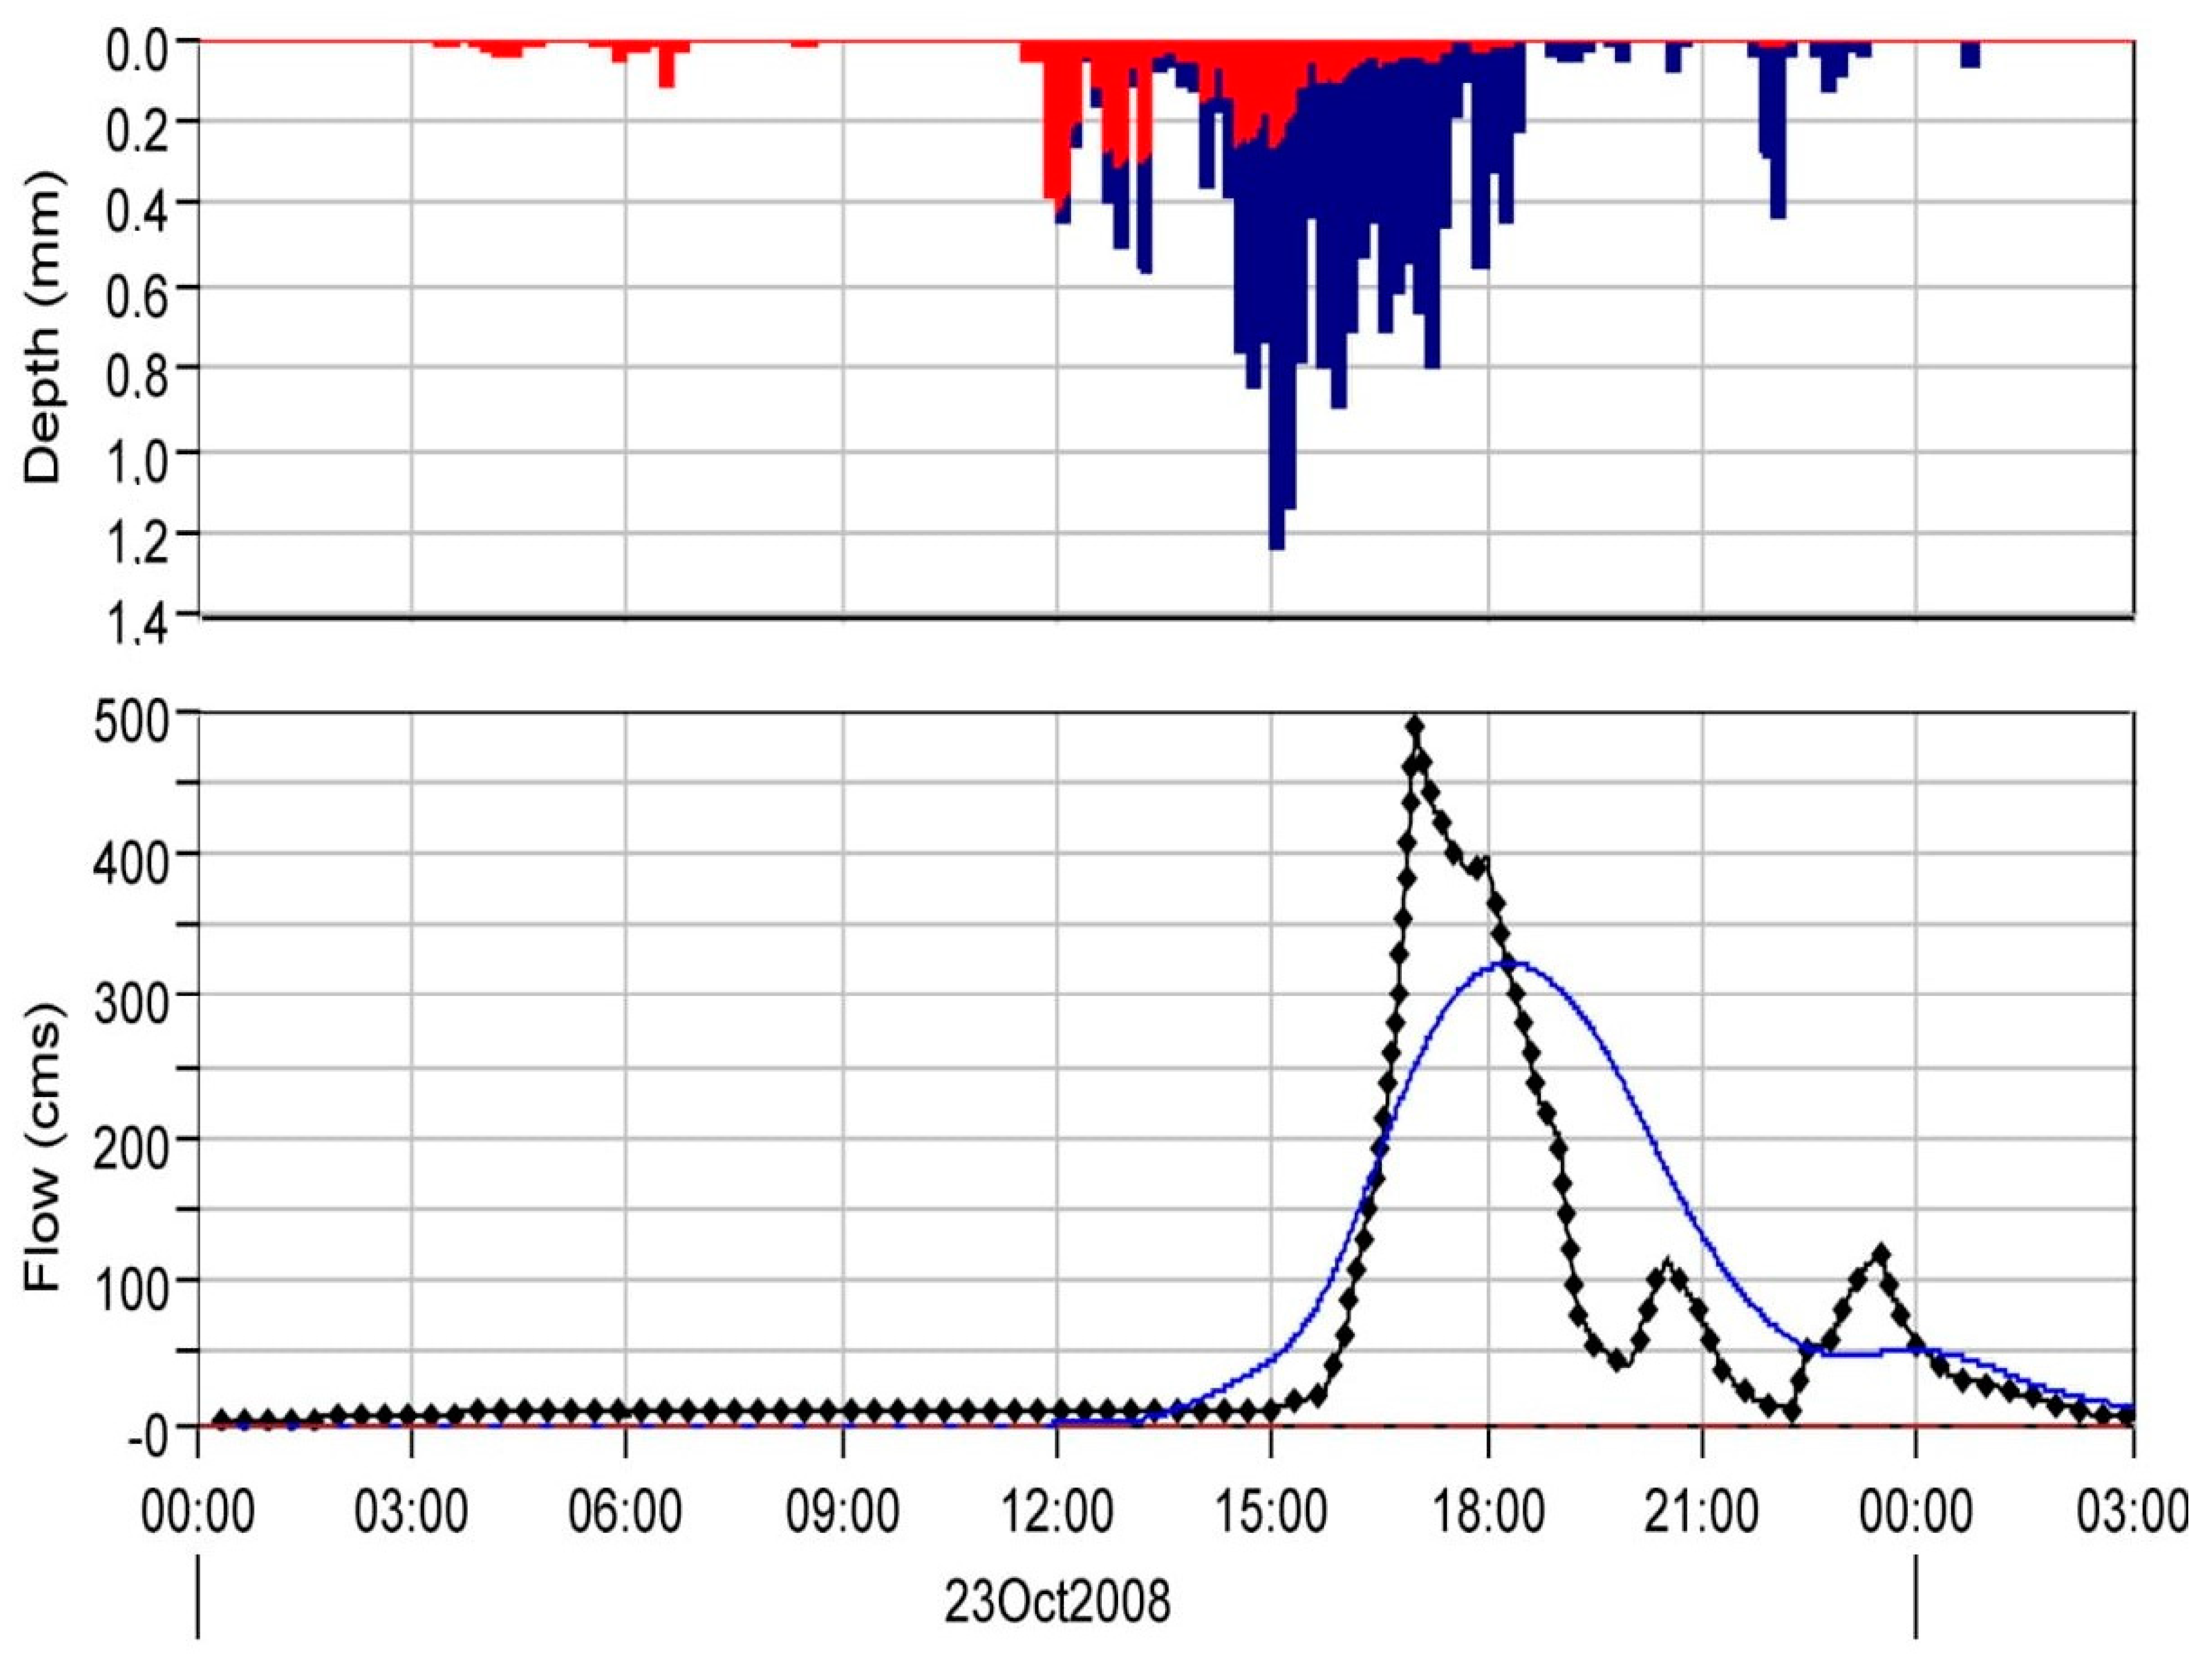
4.1. HEC-HMS Modeling
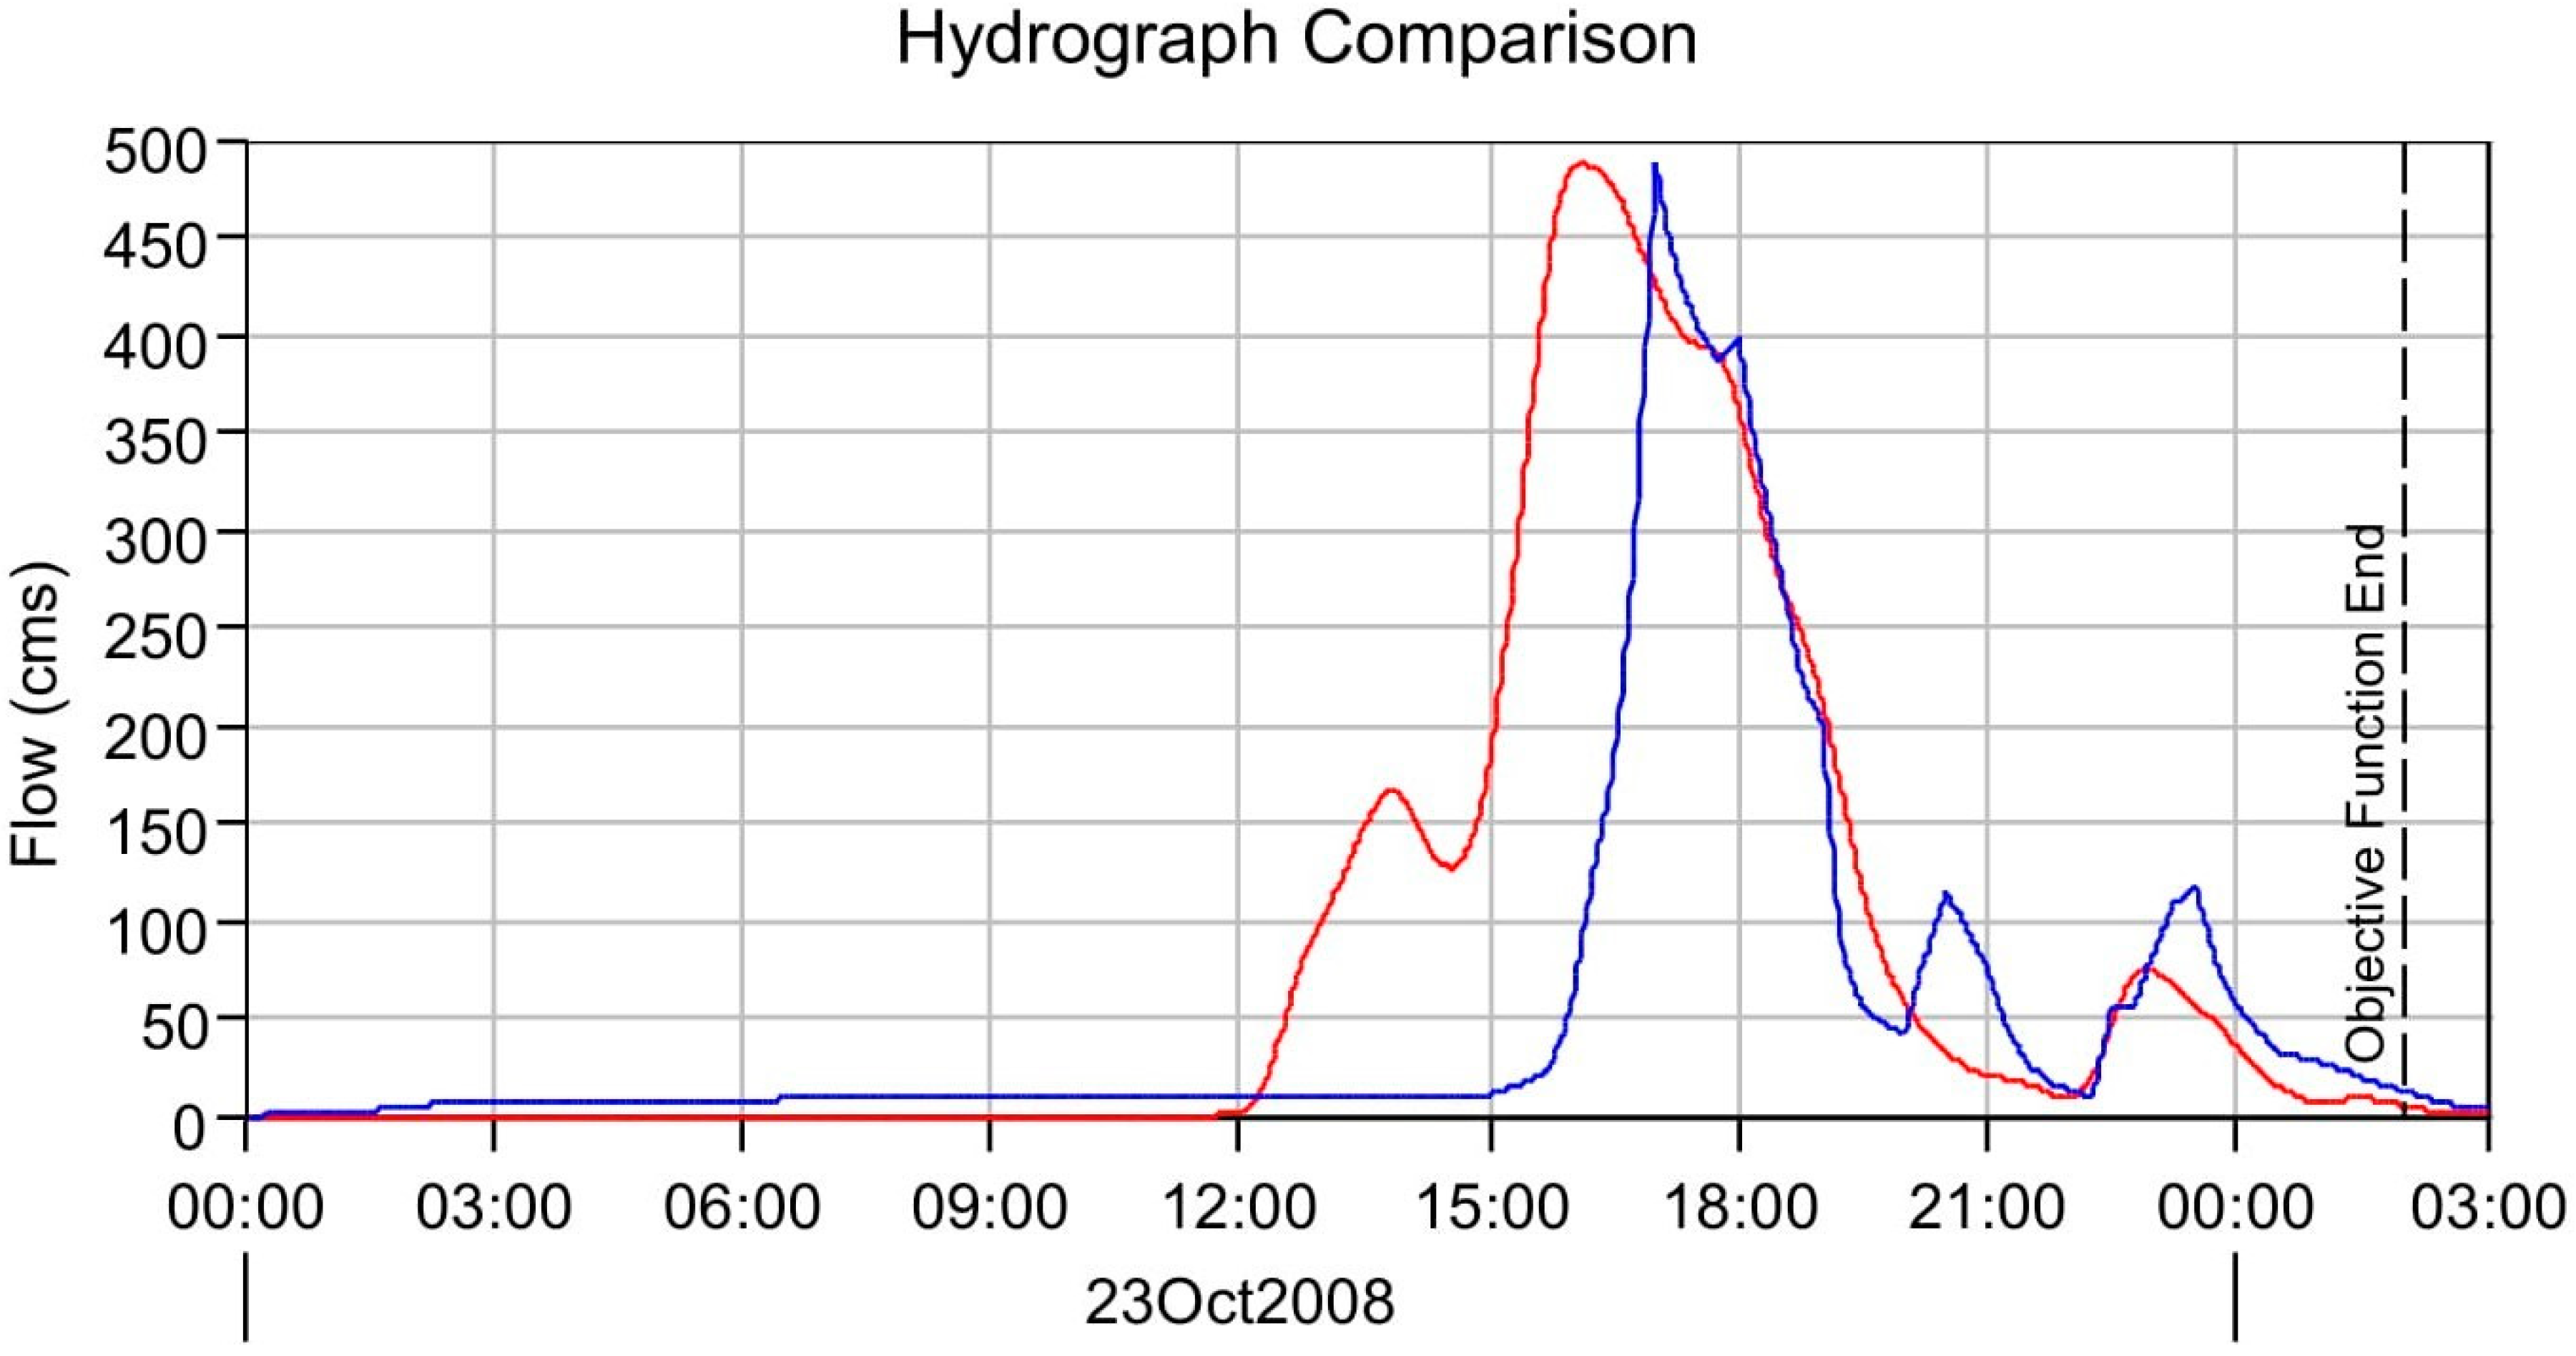
4.2. Calibration Approch
5. Conclusions
Author Contributions
Funding
Conflicts of Interest
References
- Werren, G.; Lasri, M. Cartographie du Danger D’inondation. In Guide Pratique Pour L’application de la Méthode Suisse au Maroc; université de Lausanne and université Sidi Mohamed Ben Abdellah: Fès, Maroc, 2014. [Google Scholar]
- Norbiato, D.; Borga, M.; Sangati, M.; Zanon, F. Regional frequency analysis of extreme precipitation in the eastern Italian Alps and the August 29, 2003 flash flood. J. Hydrol. 2007, 345, 149–166. [Google Scholar] [CrossRef]
- Creutin, J.D.; Borga, M. Radar hydrology modifies the monitoring of flashflood hazard. Hydrol. Process. 2003, 17, 1453–1456. [Google Scholar] [CrossRef]
- Koutroulis, A.G.; Tsanis, I.K. A method for estimating flash flood peak discharge in a poorly gauged basin: Case study for the 13–14 January 1994 flood, Giofiros basin, Crete, Greece. J. Hydrol. 2010, 385, 150–164. [Google Scholar] [CrossRef]
- Lumbroso, D.; Gaume, E. Reducing the uncertainty in indirect estimates of extreme flash flood discharges. J. Hydrol. 2012, 414–415, 16–30. [Google Scholar] [CrossRef]
- Buchanan, T.J.; Somers, W.P. Discharge Measurements at Gaging Stations; Techniques of Water-Resources Investigation of the United States Geological Survey: Reston, VA, USA, 1969. [Google Scholar]
- Olson, S.A.; Norris, J.M. U.S. Geological Survey Streamgaging; U.S. Geological Survey Fact Sheet: Reston, VA, USA, 2005; pp. 2005–3131.
- Conesa-Garcia, C.; Caselles-Miralles, V.; Sanchez, J.M.; Garcia-Lorenzo, R. Hydraulic Geometry, GIS and Remote Sensing, Techniques against Rainfall-Runoff Models for Estimating Flood Magnitude in Ephemeral Fluvial Systems. Remote Sens. 2010, 2, 2607–2628. [Google Scholar] [CrossRef] [Green Version]
- Nouh, M. Effects of rainfall runoff model assumptions on optimal storm sewer system design. Arab. J. Sci. Eng. 1985, 12, 19–35. [Google Scholar]
- Huff, F. Time distribution of rainfall in heavy storms. Water Resour. Res. 1967, 3, 1007–1019. [Google Scholar] [CrossRef]
- Gaume, E.; Bain, V.; Bernardara, P.; Newinger, O.; Barbuc, M.; Bateman, A.; Blaškovicová, L.; Blöschl, G.; Borga, M.; Dumitrescu, A.; et al. A compilation of data on European flash floods. J. Hydrol. 2009, 367, 70–78. [Google Scholar] [CrossRef] [Green Version]
- Graef, F.; Haigis, J. Spatial and temporal rainfall variability in the Sahel and its effects on farmers’ management strategies. J. Arid Environ. 2001, 48, 221–231. [Google Scholar] [CrossRef]
- Ghimire, B.; Reddy, M.J. Development of stage-discharge rating curve in river using genetic algorithms and model tree. In Proceedings of the International Workshopadvances in Statistical Hydrology, Taormina, Italy, 23–25 May 2010. [Google Scholar]
- Pan, F.; Wang, C.; Xi, X. Constructing river stage-discharge rating curves using remotely sensed river cross-sectional inundation areas and river bathymetry. J. Hydrol. 2016, 540, 670–687. [Google Scholar] [CrossRef]
- Herschy, R.W. Streamflow Measurement; Elsevier Applied Science Publishers: New York, NY, USA, 1985. [Google Scholar]
- Dottori, F.; Martina, M.L.V.; Todini, E. A dynamic rating curve approach to indirect discharge measurement. Hydrol. Earth Syst. Sci. 2009, 13, 847–863. [Google Scholar] [CrossRef] [Green Version]
- Jothityangkoon, C.; Hirunteeyakul, C.; Boonrawd, K.; Sivapalan, M. Assessing the impact of climate and land use changes on extreme floods in a large tropical catchment. J. Hydrol. 2013, 490, 88–105. [Google Scholar] [CrossRef]
- Goodrich, D.; Woolhiser, D.; Unkrich, C. Rainfall-sampling impacts on runoff. In Hydraulics/Hydrology of Arid Lands; French, R.H., Ed.; American Society of Civil Engineers: New York, NY, USA, 1990; pp. 519–524. [Google Scholar]
- Mosley, M.P.; McKerchar, A.I. Streamflow, Handbook of Hydrology; Maidment, D.R., Ed.; McGraw-Hill: New York, NY, USA, 1992. [Google Scholar]
- Leopold, L.B.; Wolman, M.G.; Miller, J.P. Fluvial Processes in Geomorphology; W.H. Freeman: San Francisco, CA, USA, 1964. [Google Scholar]
- USDA. Summary Report: National Resources Inventory (Revised December 2001); US Department of Agriculture, Natural Resource Conservation Service: Washington, DC, USA, 1997.
- Ramirez, J.A. Prediction and Modeling of Flood Hydrology and Hydraulics. In Chapter 11 of Inland Floods Hazards: Human, Riparian and Aquatics Communities; Wohl, E., Ed.; Cambridge University Press: Cambridge, UK, 2000. [Google Scholar]
- Khaddor, I.; Alaoui, A.H. Production of a Curve Number map for Hydrological simulation—Case study: Kalaya Watershed located in Northern Morocco. Int. J. Innov. Appl. Stud. 2014, 9, 1691–1699. [Google Scholar]
- Cunderlik, J.M.; AndSimonovic, S.P. Inverse flood risk modeling under changing climatic conditions. Hydrol. Process. 2007, 21, 563–577. [Google Scholar] [CrossRef]
- McColl, C.; Aggett, G. Land-use forecasting and hydrologic model integration for improved land-use decision support. J. Environ. Manag. 2007, 84, 494–512. [Google Scholar] [CrossRef] [PubMed]
- Guo, J.C.Y.; Hargadin, K. Conservative Design Rainfall Distribution. J. Hydrol. Eng. 2009, 14. [Google Scholar] [CrossRef]
- Al-Rawas, G.A.; Valeo, C. Characteristics of rainstorm temporal distributions in arid mountainous and coastal regions. J. Hydrol. 2009, 376, 318–326. [Google Scholar] [CrossRef]
- Casas, A.; Benito, G.; Thorndycraft, V.R.; Rico, M. The topographic data source of digital terrain models as a key element in the accuracy of hydraulic flood modelling. Earth Surf. Process. Landf. 2006, 31, 444–456. [Google Scholar] [CrossRef]
- Vidal, J.-P.; Moisan, S.; Faure, J.-B.; Dartus, D. River model calibration, from guidelines to operational support tools. Environ. Model. Softw. 2007, 22, 1628–1640. [Google Scholar] [CrossRef] [Green Version]
- Morvan, H.; Knight, D.; Wright, N.; Tang, X.; Crossley, A. The concept of roughness in fluvial hydraulics and its formulation in 1D, 2D and 3D numerical simulation models. J. Hydraul. Res. 2008, 46, 191–208. [Google Scholar] [CrossRef] [Green Version]
- Paarlberg, A.J.; Dohmen-Janssen, C.M.; Hulscher, S.J.M.H.; Termes, P.; Schielen, R. Modelling the effect of time-dependent river dune evolution on bed roughness and stage. Earth Surf. Process. Landf. 2010, 35, 1854–1866. [Google Scholar] [CrossRef]
- World Meteorological Organization. Manual on Stream Gauging, Volume II—Computation of Discharge; WMO-No. 1044; World Meteorological Organization: Geneva, Switzerland, 2010; ISBN 978-92-63-11044-2. [Google Scholar]
- Van der Klis, H. Uncertainty Analysis Applied to Numerical Models of River Bed Morphology. Ph.D. Thesis, University of Delft, Delft, The Netherlands, 2003. [Google Scholar]
- Paarlberg, A.J. Modelnauwkeurigheid en-Onzekerheden van in Nederland Toegepaste Hydraulische Modellen: Verslag van Interviews met Waterbeheerders en Modelexperts (in Dutch); Civil Engineering and Management Research Report 2007R-001/WEM-001; University of Twente: Enschede, The Netherlands, 2007. [Google Scholar]
- Warmink, J.J.; Booij, M.J.; van der Klis, H.; Hulscher, S.J.M.H. Uncertainty in water level predictions due to various calibrations. In Proceedings of the CAIWA 2007, Basel, Switzerland, 12–15 November 2007; pp. 1–18. [Google Scholar]
- United States Army Corp of Engineering (USACE). Hydrologic Modeling System HEC-HMS; USACE: Washington, DC, USA, 2000. [Google Scholar]
- Scharffenber, W.A.; Fleming, M.J. Hydrological Modeling System HEC-HMS User’s Manual; United States Army Corps of Engineers: Davis, CA, USA, 2010.


| 9 Section | Period | Velocity (m/s) | Perimeter (m) | Roughness | Water Levels (m) | Discharge (m3/s) |
|---|---|---|---|---|---|---|
| 1 | 12/11/2012 | 0.316 | 0.12 | 0.004 | 1.00 | 0.023 |
| 2 | 11/03/2008 | 0.303 | 0.08 | 0.004 | 1.10 | 0.040 |
| 3 | 18/02/2008 | 0.342 | 0.11 | 0.004 | 1.20 | 0.250 |
| 4 | 22/01/2008 | 0.381 | 0.08 | 0.004 | 1.33 | 0.750 |
| 5 | 24/12/2007 | 0.29 | 0.08 | 0.004 | 1.50 | 2.000 |
| 6 | 11/06/2013 | 0.168 | 0.07 | 0.004 | 1.80 | 5.900 |
| 7 | 13/05/2013 | 0.148 | 0.07 | 0.004 | 2.00 | 9.700 |
| 8 | 11/02/2013 | 0.353 | 0.12 | 0.004 | 2.20 | 14.500 |
| 9 | 21/04/2008 | 0.45 | 0.24 | 0.004 | 2.50 | 23.500 |
| 10 | 09/12/2003 | 1.813 | 1.18 | 0.004 | 2.66 | 28.971 |
| S. deviation | 0.62 | 10.55 |
| Physical Components | Loss Method | Transform Method | |||
|---|---|---|---|---|---|
| Surface (Km2) | Slope (%) | Perimeter (Km) | Initial Abstraction (mm) | Average CN | Lag Time (hours) |
| 37.3 | 8.47 | 13.205 | 8 | 82.07 | 2.082715 |
| Bassin | Drainage Area Km2 | Peak Discharge m3/s | Peak Time | Volume (1000 m3) |
|---|---|---|---|---|
| KALAYA | 37 | 321.9 | 23 October 2008, 18:18 | 5553.8 |
| Parameter | Initial Value | Optimized Value | Objective Function Sensitivity |
|---|---|---|---|
| Curve Number | 82 | 89.162 | 7.68 |
| Initial Abstraction (mm) | 8 | 7.3789 | −43.47 |
| SCS Lag (min) | 124.9629 | 36.286 | −30.05 |
| Measure | Simulated | Observed | Difference | Percent Difference |
|---|---|---|---|---|
| Volume | 5593.4 | 5193.3 | 400.1 | 7.42 |
| Peak Flow | 321.9 | 486.7 | 164 | 40.52 |
| Time of Peak | 23 October 2008, 16:07 | 23 October 2008, 17:00 | ||
| Time of Center of Mass | 23 October 2008, 17:03 | 23 October 2008, 17:03 |
© 2019 by the authors. Licensee MDPI, Basel, Switzerland. This article is an open access article distributed under the terms and conditions of the Creative Commons Attribution (CC BY) license (http://creativecommons.org/licenses/by/4.0/).
Share and Cite
Khaddor, I.; Achab, M.; Ben jbara, A.; Hafidi Alaoui, A. Estimation of Peak Discharge in a Poorly Gauged Catchment Based on a Specified Hyetograph Model and Geomorphological Parameters: Case Study for the 23–24 October 2008 Flood, KALAYA Basin, Tangier, Morocco. Hydrology 2019, 6, 10. https://doi.org/10.3390/hydrology6010010
Khaddor I, Achab M, Ben jbara A, Hafidi Alaoui A. Estimation of Peak Discharge in a Poorly Gauged Catchment Based on a Specified Hyetograph Model and Geomorphological Parameters: Case Study for the 23–24 October 2008 Flood, KALAYA Basin, Tangier, Morocco. Hydrology. 2019; 6(1):10. https://doi.org/10.3390/hydrology6010010
Chicago/Turabian StyleKhaddor, Iliasse, Mohammed Achab, Abdelkader Ben jbara, and Adil Hafidi Alaoui. 2019. "Estimation of Peak Discharge in a Poorly Gauged Catchment Based on a Specified Hyetograph Model and Geomorphological Parameters: Case Study for the 23–24 October 2008 Flood, KALAYA Basin, Tangier, Morocco" Hydrology 6, no. 1: 10. https://doi.org/10.3390/hydrology6010010