Article

Understanding Consumer Preferences for Australian Sparkling Wine vs. French Champagne

1
School of Agriculture, Food and Wine, The University of Adelaide, Waite Campus, PMB 1, Glen Osmond, SA 5064, Australia
2
School of Pharmacy and Medical Sciences, University of South Australia, GPO Box 2471, Adelaide SA 5001, Australia
3
School of Medical and Applied Sciences, Central Queensland University, Rockhampton, Qld 4701, Australia
*
Author to whom correspondence should be addressed.
Beverages 2016, 2(3), 19; https://doi.org/10.3390/beverages2030019
Submission received: 19 May 2016 / Revised: 20 July 2016 / Accepted: 20 July 2016 / Published: 26 July 2016

Abstract

:
Sparkling wine represents a small but significant proportion of the Australian wine industry’s total production. Yet, Australia remains a significant importer of French Champagne. This study investigated consumer preferences for Australian sparkling wine vs. French Champagne and any compositional and/or sensorial bases for these preferences. A range of French and Australian sparkling wines were analyzed by MIR spectroscopy to determine if sparkling wines could be differentiated according to country of origin. A subset of wines, comprising two French Champagnes, a French sparkling wine and three Australian sparkling wines, were selected for (i) descriptive analysis to characterize their sensory profiles and (ii) acceptance tests to determine consumer liking (n = 95 Australian wine consumers). Significant differences were observed between liking scores; on average, the $70 French Champagne was liked least and the $12 Australian sparkling wine liked most, but segmentation (based on individual liking scores) identified clusters comprising consumers with distinct wine preferences. Interestingly, when consumers were shown wine bottle labels, they considered French wines to be more expensive than Australian wines, demonstrating a clear country of origin influence.

Graphical Abstract

1. Introduction

Traditional sparkling winemaking, i.e., via the Méthode Champenoise (in Champagne, France) or the Méthode Traditionelle (elsewhere), involves two successive fermentations [1]. During primary fermentation, grape must is transformed into base wine; secondary fermentation then occurs (in the bottle) following addition of liqueur de tirage (a suspension of yeast and sugar), to generate the carbon dioxide required to give the essence of sparkling wine, i.e., the ‘bubble’. However, the compositional changes that occur during ageing on yeast lees typically determine the sensory and foaming properties of sparkling wine and, therefore, sparkling wine style and quality [1].
Sparkling wine has accounted for almost 10% of Australian domestic wine production since the late 1980s [2] and represents a market niche for which there is growing consumer interest. Between 2000 and 2015, the number of Australian sparkling wine producers increased from 341 to 1015 [3], and annual production in 2014 reached 35 ML [2]. Yet, Australia remains a significant importer of French Champagne; in 2012, almost 20% of Australian sparkling wine sales (by value) comprised Champagne [4]. Champagne has a clear target market (the affluent), functional quality (due to strict production control and product consistency), product positioning, and brand protection (exclusivity) [5]. Not surprisingly, Champagne remains the unequivocal benchmark for sparkling wine around the world.
The composition and sensory properties of wine, including sparkling wine, are complex and depend on a range of factors including grape variety, regional climate, production methods, packaging, and storage conditions. It is therefore not surprising that wine marketing and consumer behavior researchers agree that purchasing wine involves risk [6,7] and that consumers tend to rely on extrinsic cues, such as price, packaging, labelling, and brand, to evaluate quality and mitigate risk [8,9]. Prior consumption, wine style, grape variety, occasion, and price are factors that typically influence wine consumers’ purchasing and consumption behavior [10,11]. However, country of origin has also been shown to influence consumer perceptions of wine quality [12,13]. The use of geographical origin information in marketing strategies and wine bottle labelling can afford quality differentiation [14] that influences consumer decision-making and, therefore, wine sales [15]. Country of origin effects are considered especially important where products have an established cultural heritage and there is high-low culture distinction [7] as is undoubtedly the case for Champagne. The tradition, heritage, and prestige associated with the Champagne brand infer superior product quality and reliability, whereas Australian sparkling wine brands are comparatively unknown and therefore represent a purchase risk [16] despite premium Australian sparkling wines being made from the same grape varieties (Chardonnay, Pinot Noir, and Pinot Meunier) and production methods (Méthode Traditionelle) employed in France to produce Champagne. Quality perceptions of sparkling wine are also closely associated with consumers’ wine involvement, i.e., highly involved consumers recognize brand names as trademarks of quality for which they are willing to pay a premium [5].
Previous research has investigated the influence of grape variety, yeast selection, and lees ageing on sparkling wine composition and/or sensory properties [17,18,19,20,21,22,23,24,25], albeit these studies largely focus on French Champagne or Spanish Cava. To date, compositional comparisons between Australian sparkling wine and French Champagne have not been reported in the literature. Mid-infrared (MIR) spectroscopy has previously been used to discriminate wines according to grape variety [26,27] or geographical origin [28,29,30], and, in the case of sparkling wine, according to production method and wine style [31]. This study aimed to investigate consumer preferences for Australian sparkling wine vs. French Champagne and to define any compositional and/or sensorial drivers for these preferences using a combination of MIR spectroscopy and principal component analysis (PCA), together with descriptive analysis (DA).

2. Materials and Methods

2.1. Chemical Analysis of French and Australian Sparkling Wines

A range of commercially available French (n = 24) and Australian (n = 21) sparkling wines were sourced from Australian wineries or wine stores. French wines comprised Champagnes (n = 23) priced from $40 to $135 and a $12 sparkling wine (from Beaune); while Australian wines comprised Méthode Traditionelle sparkling wines (n = 20) priced from $25 to $90 (from wine regions across Australia) and a $12 sparkling wine (made via the Charmat method). All wine prices are for 750 mL bottles in Australian dollars (AUD).

2.1.1. Basic Wine Composition

Samples were degassed using an ultrasonic bath (Sonorex Digitec DT 1028F, Bandelin Electronic GmbH & Co. KG, Berlin, Germany) according to methods described previously [31] and basic composition determined [32]. The pH and titratable acidity (TA, expressed as g/L tartaric acid) of degassed wines were measured with an autotitrator (Compact Titrator, Crison Instruments SA, Allela, Spain). Ethanol content (% alcohol by volume, abv) was measured with an alcolyzer (Anton Paar, Graz, Austria). Residual sugar (i.e., glucose and fructose) were measured enzymatically (Boehringer-Mannheim, R-BioPharm, Darmstadt, Germany) with a liquid handling robot (CAS-3800, Corbett Robotics, Eight Mile Plain, Qld, Australia) and spectrophotometric plate reader (Infinite M200 Pro, Tecan, Grödig, Austria). Total phenolics were measured as the absorbance of wine at 280 nm using a UV-Vis spectrophotometer (GBC Scientific Equipment, Melbourne, Australia).

2.1.2. Attenuated Total Reflectance Mid-Infrared Spectroscopy (ATR-MIR)

Sparkling wine samples (degassed, ca. 0.5 mL) were scanned using a platinum diamond ATR single reflection sampling module cell mounted in a Bruker Alpha instrument (Bruker Optics GmbH, Ettlingen, Germany). The MIR spectra of samples were recorded using OPUS software (Version 7, Bruker Optics) by taking the average of 32 scans at a resolution of 8 cm−1, acquired between 4000 and 400 cm−1, with a scanner velocity of 7.5 kHz and a background of 32 scans. Background reference spectra were recorded using air every 4 samples. MIR spectra were then exported from OPUS into The Unscrambler (Edition 10.2, CAMO ASA, Oslo, Norway) for chemometric analysis. Spectra were pre-processed using the second-derivative transformation, the Savitzky-Golay derivation, and smoothing (20-point and 2nd-order filtering operation) to reduce baseline variation and to enhance spectral features. PCA was performed on both the entire spectral range (4000 to 400 cm−1) and the MIR ‘fingerprint’ (i.e., 1500 to 900 cm−1).

2.2. Sensory Analysis of French and Australian Sparkling Wines

A subset of six sparkling wines, comprising 2 French Champagnes (hereafter referred to as ‘F$70’ and ‘F$40’), the French sparkling wine (hereafter ‘F$12’), two Australian Méthode Traditionelle sparkling wines (hereafter ‘A$70’ and ‘A$40’), and the Australian Charmat sparkling wine (hereafter ‘A$12’) were selected for sensory analysis. Sensory studies were approved by the Human Research Ethics Committee of the University of Adelaide (H-2012-150).

2.2.1. Descriptive Analysis (DA)

Sensory profiles of the subset of 6 sparkling wines were determined by DA in a purpose-built sensory laboratory. An existing sparkling wine DA panel comprising ten panelists (9 females and 1 male), ranging in age from 23 to 55, was assembled. This panel had previously undergone 12 h of training for DA of Australian sparkling white wines [31] which involved identification of appropriate sensory attributes and reference standards, scale use, and recognizing and scoring the intensity of sensory attributes. In the current study, panelists underwent four hours of additional training during which attributes were generated for the subset of sparkling wines and panelist performance (i.e., reproducibility and repeatability) was evaluated. The aroma and flavor intensity of eleven attributes (citrus, tropical, floral, confectionary, yeasty, toasty, meaty/savoury, mushroom/earthy, honey, vanilla caramel, and aged/developed) were evaluated, together with the intensity of two additional aroma attributes (stone fruit and pome fruit) and three palate attributes (sweetness, acidity, and complexity). Where reference standards were used, their preparation is shown in Table 1.
Formal evaluations commenced when panel performance gave good agreement (based on panelist by sample interactions). Two formal evaluation sessions were held, with 9 wines presented in each session, such that all wines were assessed in triplicate (i.e., 18 samples total per panelist). Wines (30 mL) were assigned random three digit codes and served at 5 °C, in covered XL5 (ISO standard) 215 mL stemmed wine glasses (as per training sessions), using a randomized presentation order, with wines presented in brackets of three to minimize warming and loss of carbon dioxide. Panelists evaluated wines in isolated tasting booths at 22–23 °C and recorded the intensity of each sensory attribute using FIZZ data acquisition software (Version 2.47b, Biosystèms, Couternon, France) and 15 cm unstructured line scales with anchor points of ‘low’ and ‘high’ placed at 10% and 90% on the scale, respectively. To prevent sensory fatigue, 45 second breaks were enforced between samples and 3 minute breaks between brackets. Panelists were provided with filtered water and plain crackers for use as palate cleansers. Reference standards were available to panelists throughout final evaluations. Sensory data were exported from FIZZ for statistical analysis using SENPAQ software (Version 5.01, Qi Statistics, Reading, United Kingdom).

2.2.2. Consumer Acceptance Testing

Wine consumers (n = 95, 61 female, 34 male) were recruited using a variety of methods, including flyers, social networking sites (e.g., Facebook), and email. Participants were screened against inclusion criteria requiring regular sparkling wine consumption (i.e., on at least twelve occasions per year), being of legal drinking age (i.e., ≥18 years of age), and of Australian residency. Acceptance tests were conducted during focus groups that investigated wine consumers’ perceptions of Champagne and sparkling wine and purchasing behavior. The tests were held in sensory laboratories at either the University of South Australia or the University of Adelaide. During the focus groups, consumers answered demographic questions regarding their gender, age, education, and household income. Consumers were then asked to rate their hedonic liking of the selected sparkling wines using 9-point scales with anchors at 1 = ‘dislike extremely’, 5 = ‘neither like nor dislike’, and 9 = ‘like extremely’. Prior to wine evaluation, consumers were instructed on how to assess the wine and to use the hedonic scale. Consumers were also asked to indicate how much they would expect to pay for a 750 mL bottle of each wine (i.e., from <$10 to >$100, given as $10 increments) and whether they believed the wine to be French or Australian in origin. Wines (30 mL) were assigned random three digit codes and served at 5 °C, in covered 160 mL stemmed sparkling wine glasses, using a randomized presentation order, with wines presented in brackets of three to minimize warming and loss of carbon dioxide. Filtered water and plain crackers were provided as palate cleansers. Consumers were, lastly, presented with the front labels of each wine and again asked to indicate how much they would expect to pay for a 750 mL bottle (from <$10 to >$100, given as $10 increments). Participants were not informed that these labels corresponded to the sparkling wines they had tasted until after they had completed the task. Consumer data were analyzed using a combination of descriptive and multivariate techniques, including analysis of variance (to determine significant differences between hedonic ratings) and cluster analysis (to segment consumers based on individual hedonic scores).

2.3. Ethical Statement

DA panelists and wine consumers gave informed consent before they participated in the study. The study was approved by the Human Research Ethics Committee of The University of Adelaide (Project No. H-2014-150).

3. Results and Discussion

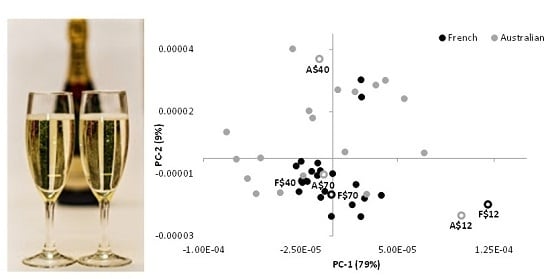
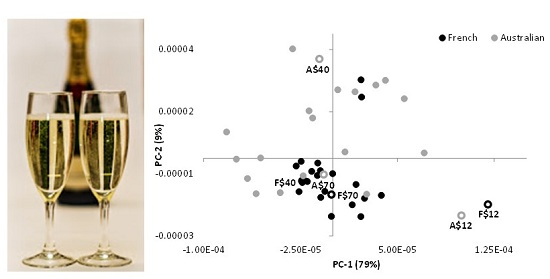
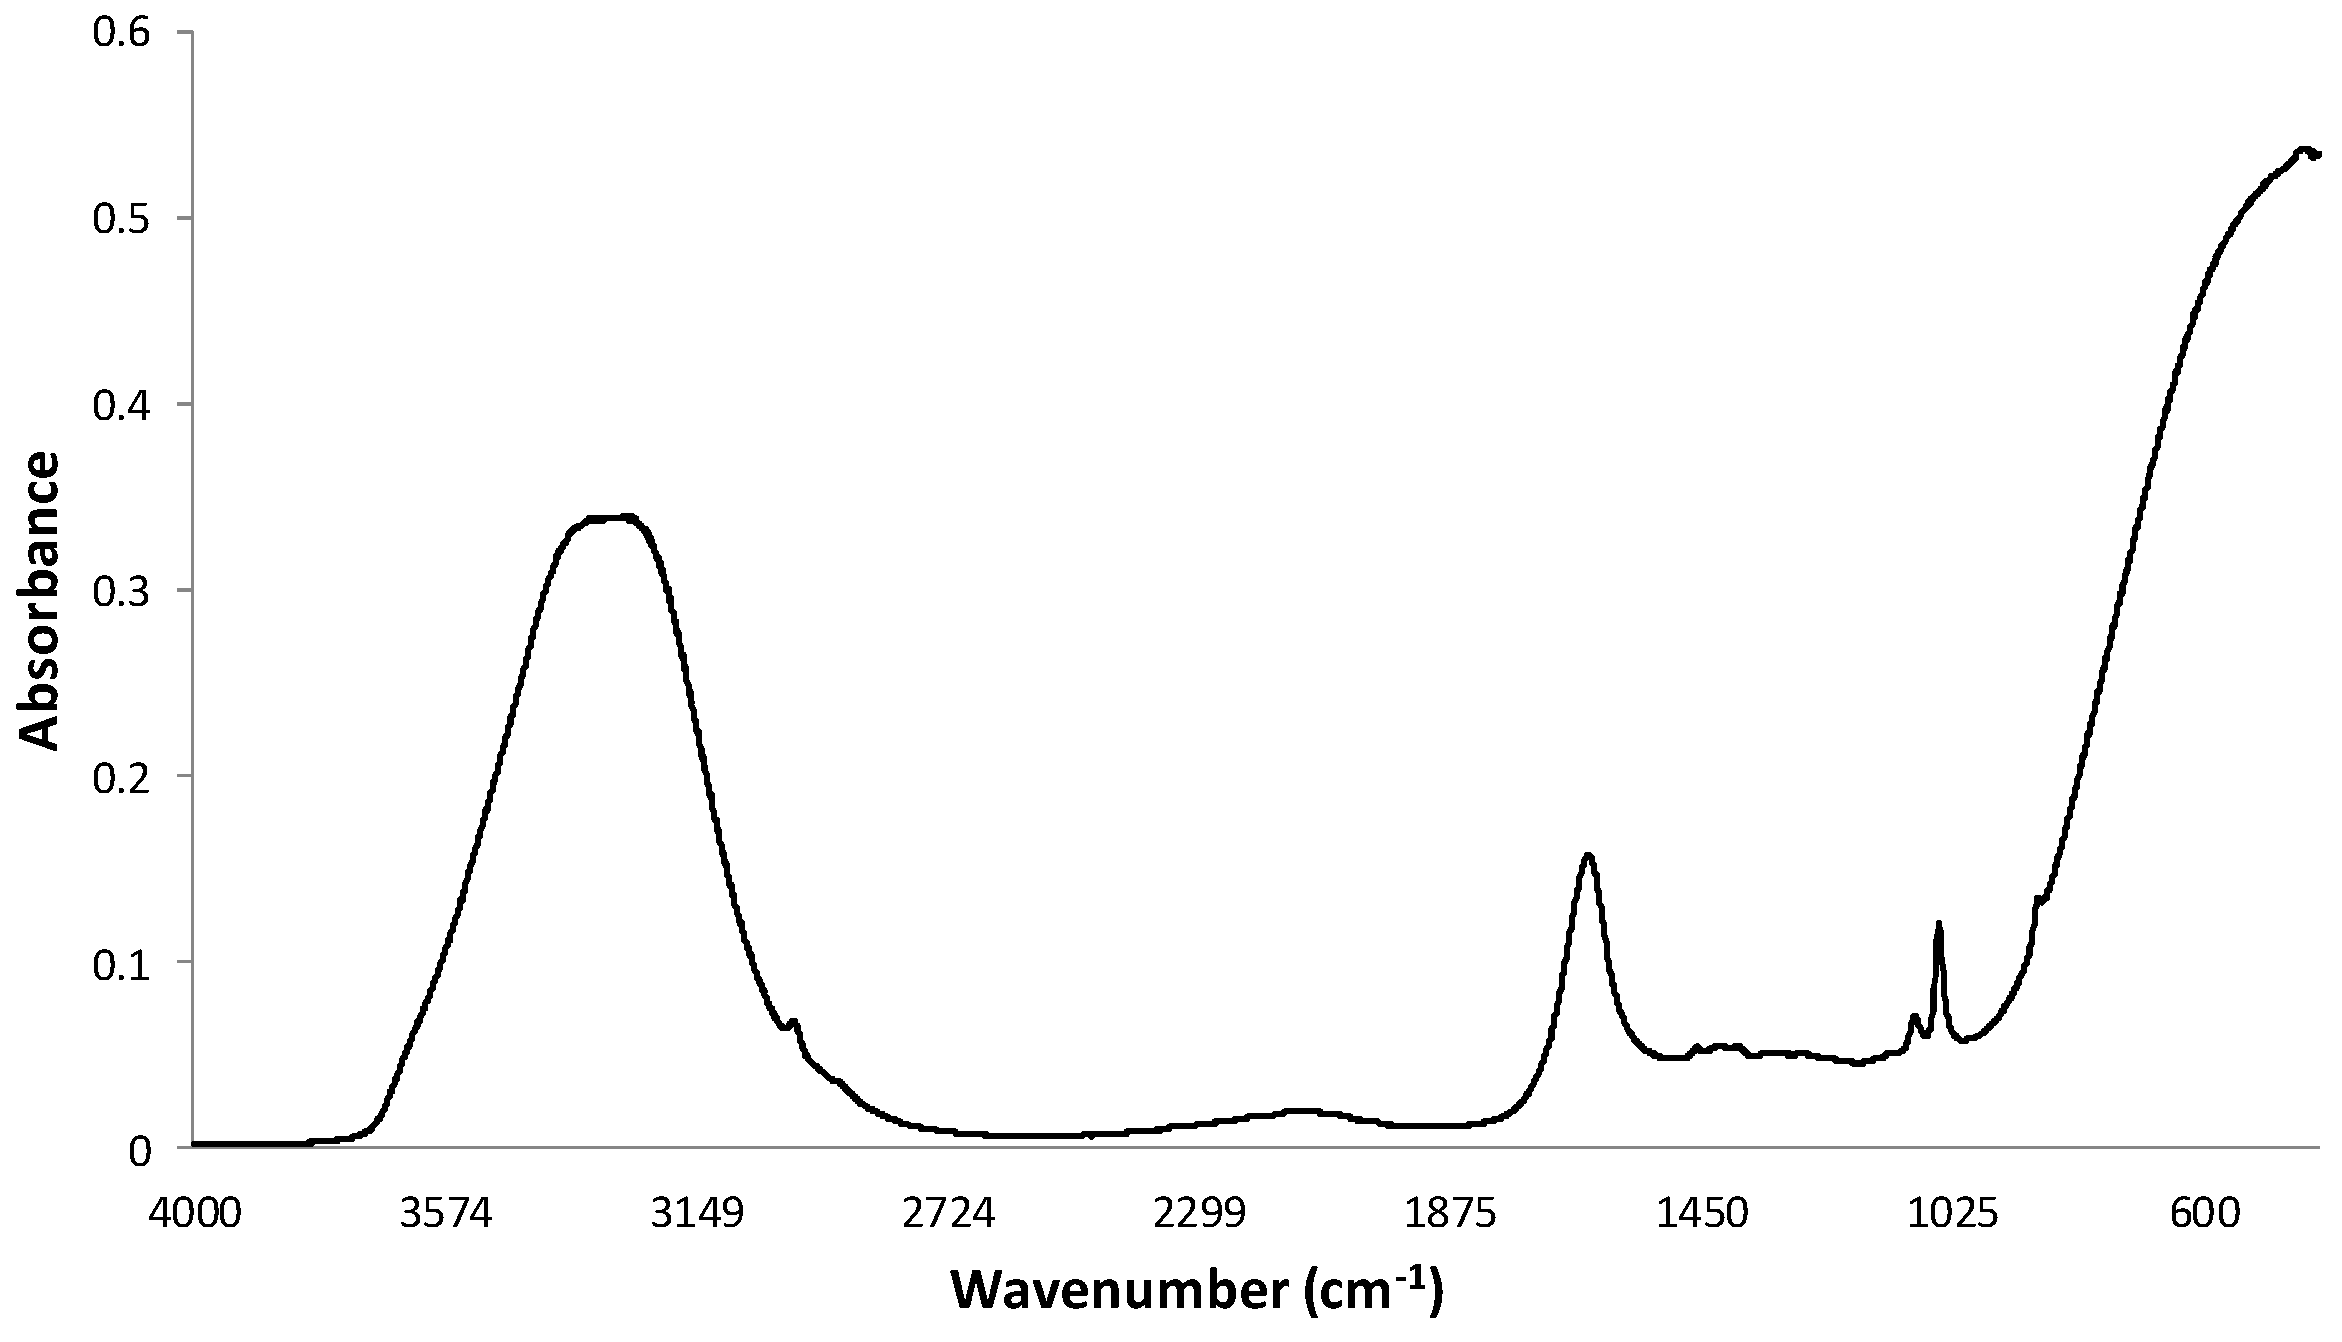
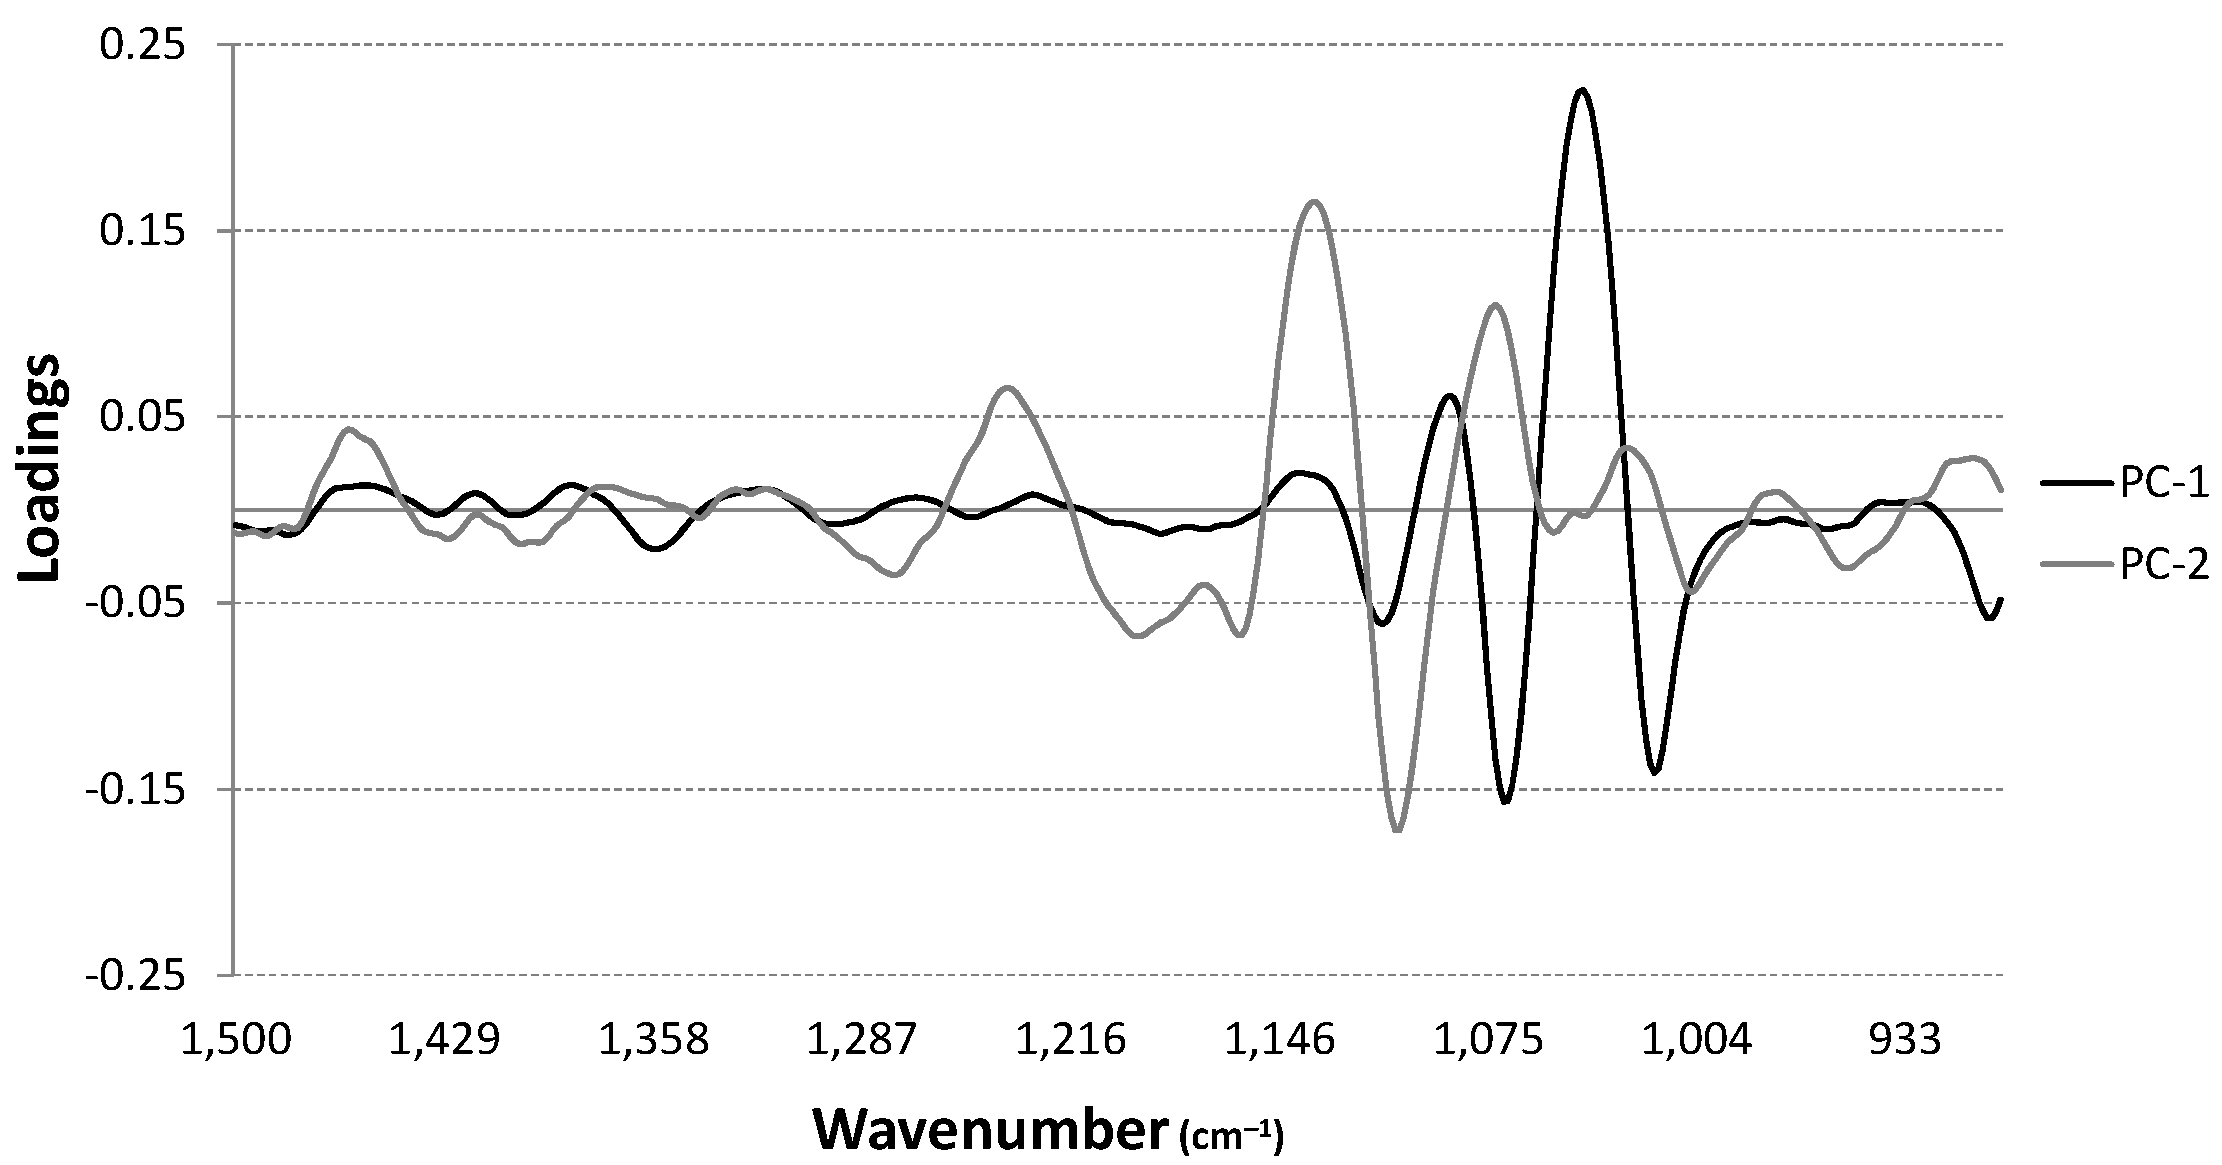
3.1. ATR-MIR Analysis of Sparkling Wines

Standard wine analyses, i.e., determinations of pH, TA, residual sugar, alcohol, and total phenolics (Table 2), together with MIR spectroscopy measurements, were performed on a range of commercially available French and Australian sparkling wines (predominantly Champagne (i.e., n = 23/24) and Méthode Traditionelle sparkling wine (n = 20/21), respectively) in order to investigate compositional differences between wines from different geographical origins.
Irrespective of country of origin, wines had similar pH, TA, residual sugar, and alcohol content, but French wines tended to have slightly higher total phenolics (Table 2). The relatively high levels of acidity (i.e., 6.1 to 9.7 g/L TA) and low alcohol content (i.e., 10.8% to 13.0% abv) observed were characteristic of sparkling wine styles [33].
MIR spectra were collected for all sparkling wines (Figure 1), but most of the variation observed was found to occur within the fingerprint region, i.e., between 1500 and 900 cm−1. Multivariate analysis was therefore performed on spectral data from the MIR fingerprint. The PCA score plot of the first two principal components (PCs) derived from MIR spectra is shown in Figure 2, with PC1 and PC2 explaining 79 and 9% of the observed variation, respectively.
The majority of the French Champagnes, including F$40 and F$70, clustered together in the lower quadrants, which likely reflects product consistency that can be attributed to strict production regulations, i.e., the Appellation d’Origine Contrôlée. In contrast, Australian sparkling wines were distributed across all quadrants, suggesting far greater stylistic variation; albeit a number of premium Australian sparkling wines, including A$70, clustered amongst the French Champagnes. Interestingly, but not surprisingly, the two $12 sparkling wines, i.e., F$12 and A$12, were situated together in the bottom right quadrant away from the other sparkling wines. This is likely due to compositional differences that can also be attributed to production method, i.e., these wines were not made using Méthode Champenoise or Méthode Traditionelle. These wines also had comparatively low TA and alcohol levels (Table 2), which might reflect a lighter, softer sparkling wine style.
The loadings obtained for the first two PCs for the fingerprint region of MIR spectra were evaluated to determine the factors that influenced the separation patterns observed in the PCA biplot (Figure 3). PC-1 loadings were highest at 1042, 1069, and 1018 cm−1, suggesting residual sugar and alcohol content influenced separation, in agreement with a recent study concerning classification of Australian sparkling wine style and quality by MIR spectroscopy in which residual sugar and alcohol content were identified as the factors driving variation between samples in the first PC [31]. Certainly, when the alcohol content of wines was considered, sparkling wines with higher alcohol levels (i.e., 12.9% to 13.0% abv) were positioned to the far left of the score plot, whereas those wines with lower alcohol (i.e., 10.8% to 11.4% abv) were located to the far right. Thus, separation across PC-1 tended to be based on alcohol content. PC-2 loadings suggested phenolics and organic acids may also have contributed to the clustering patterns observed for sparkling wines. While the highest loadings were observed at 1070, 1105, and 1130 cm−1 (indicative of sugars and alcohol), positive loadings in the region between 1475 and 1440 cm−1 may be attributable to C–C stretching vibrations of phenyl groups, i.e., such as those in phenolic compounds, and/or absorbance by C=O, C=C, C–H2 and C–H3 bonds, associated with organic acids and aldehydes. Interestingly, two French Champagne ‘outliers’ were observed in the top right quadrant, i.e., clearly separated from the other Champagne samples. However, a reasonable explanation for the clustering of these wines could not be offered based on consideration of the loadings or basic wine composition, and would instead require more detailed compositional analysis.

3.2. Sensory Analysis of Selected Sparkling Wines

Descriptive analysis and consumer acceptance tests were subsequently undertaken on a subset of sparkling wines, which included both French and Australian sparkling wines, at three distinct price points: $12, $40, and $70. Wines were specifically selected to reflect consumer demand (based on recommendations provided by the wine store from which they were sourced) and, therefore, included prominent brands.

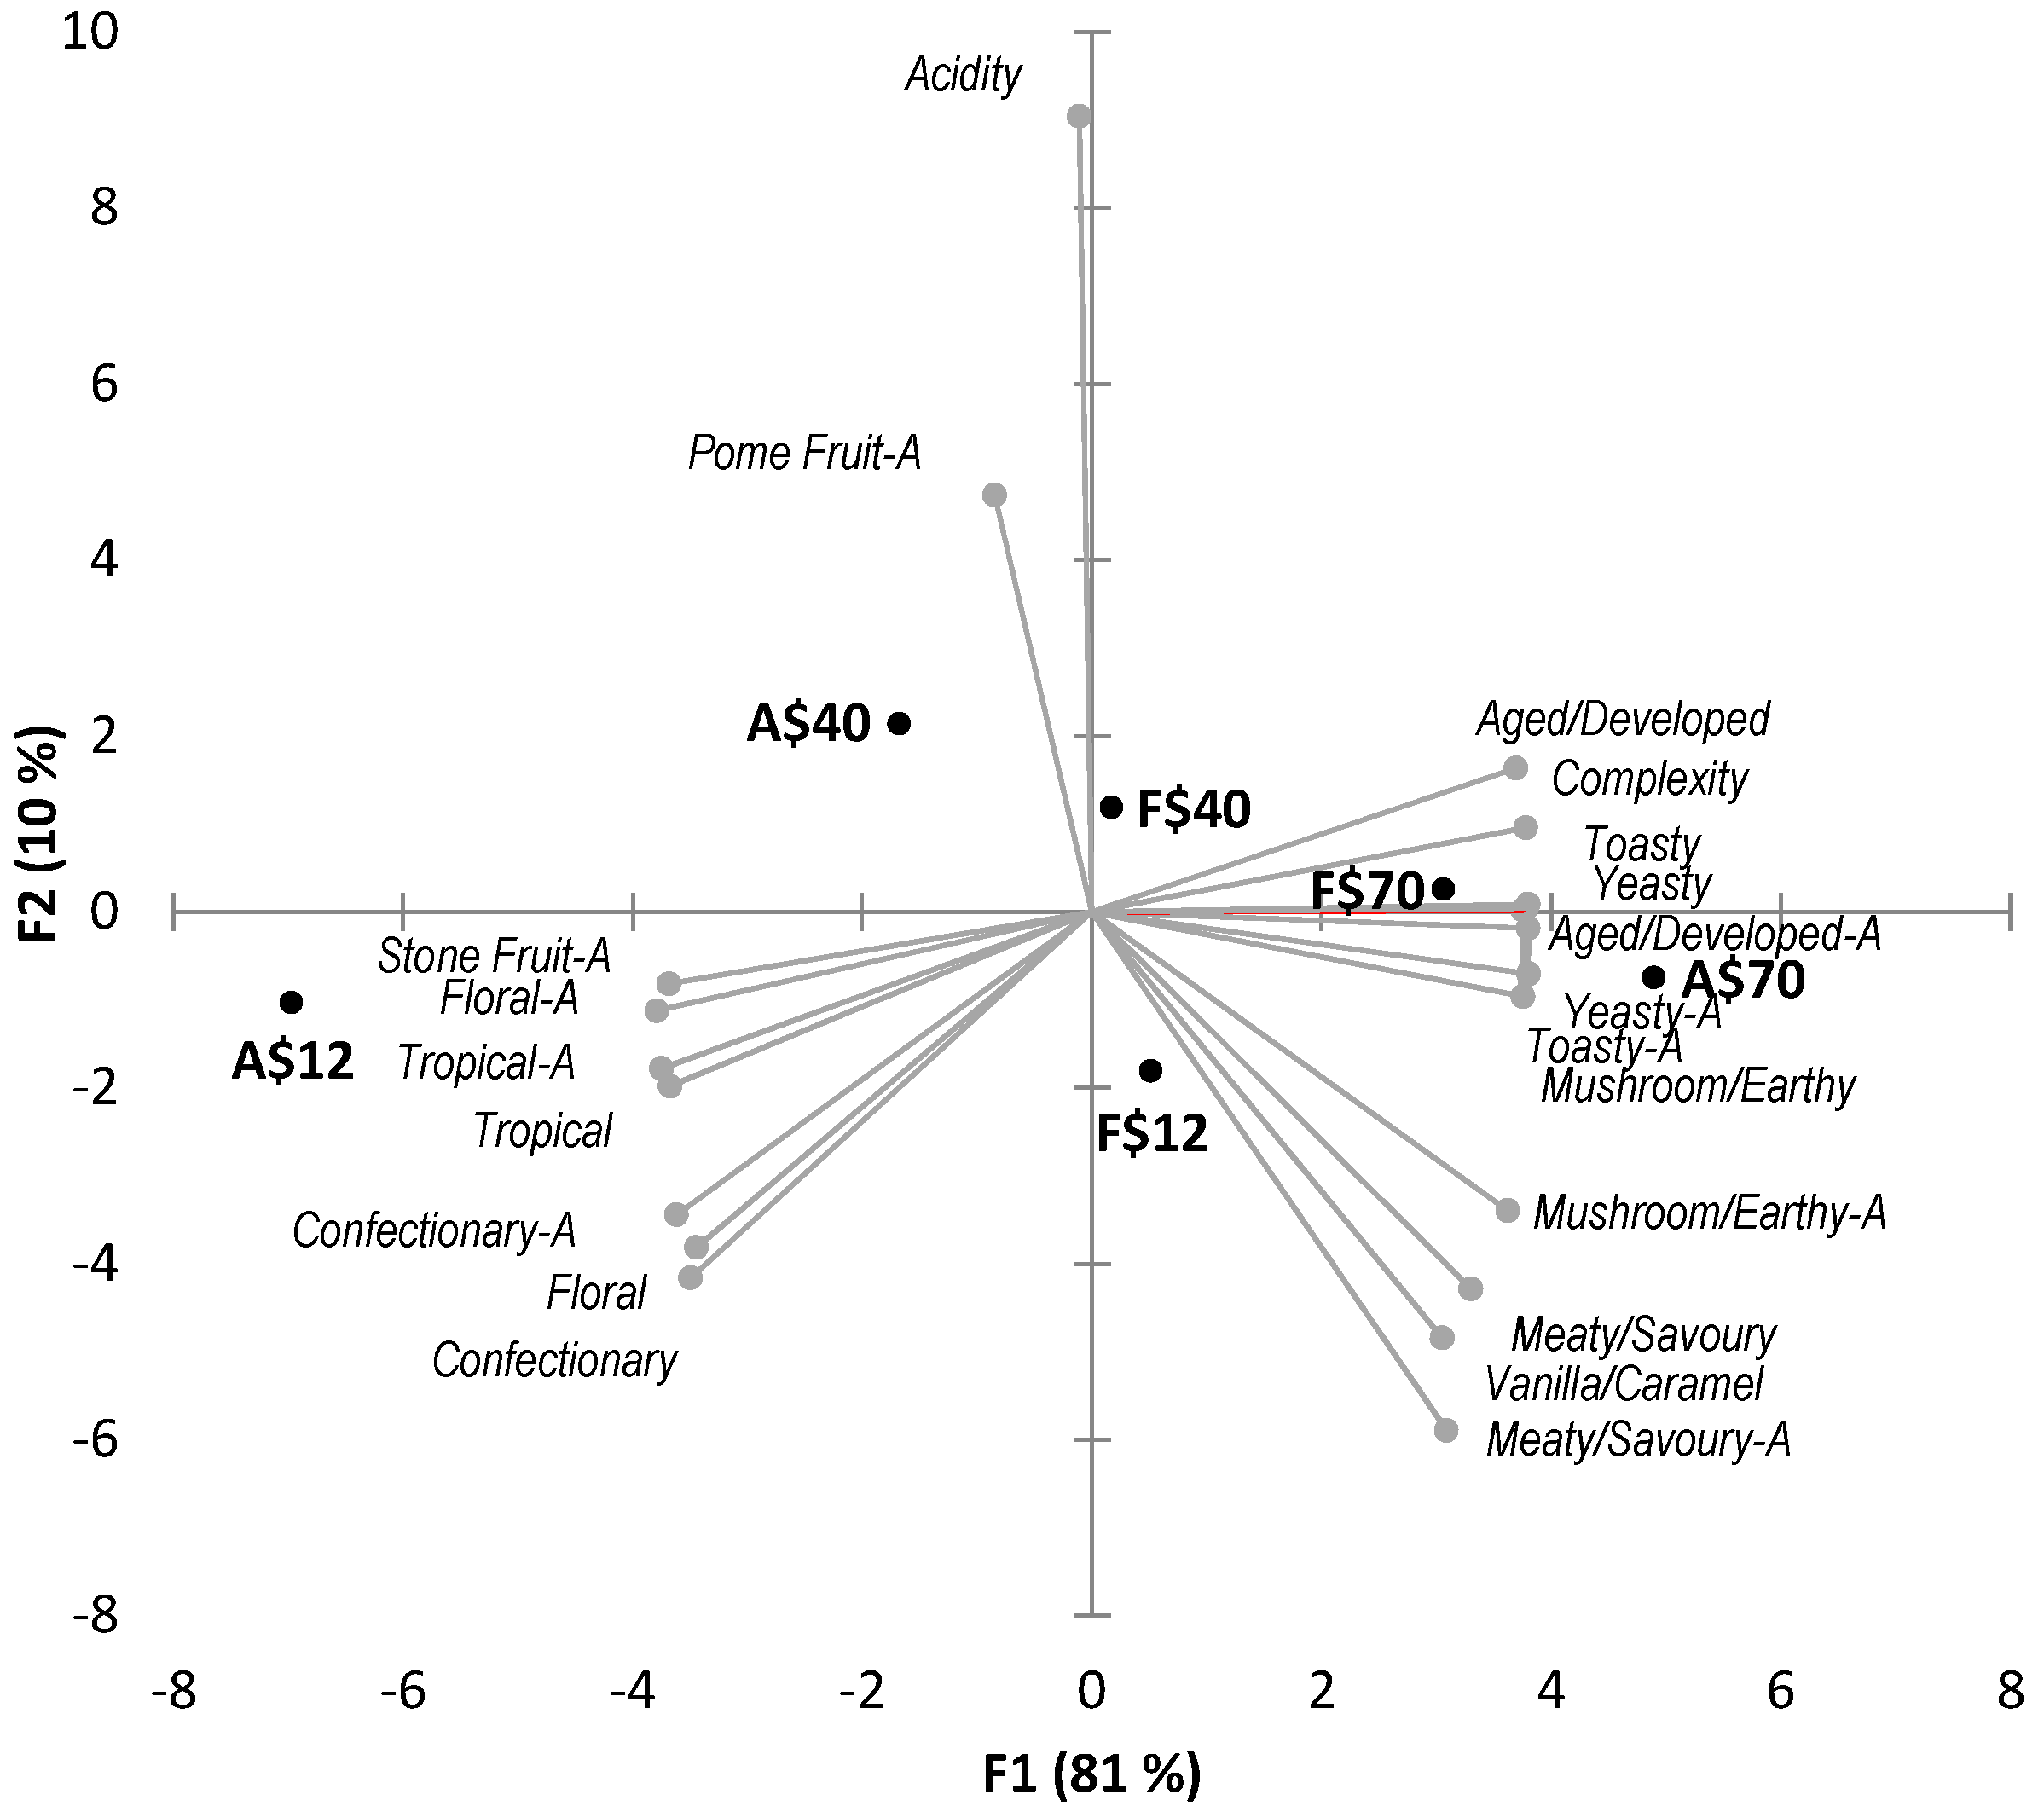
3.2.1. Sensory Profiles of Selected Sparkling Wines

DA was performed on the subset of selected wines, to characterize their individual sensory profiles (Table S1) and PCA subsequently performed on the mean intensity ratings obtained for each wine (Figure 4). As expected, the more expensive sparkling wines, F$70 and A$70, exhibited the most complexity; i.e., intense yeasty, toasty, and developed aromas and flavors, which can be attributed to the extended period of lees ageing employed in the production of these particular sparkling wines. In contrast, A$12 represented a fruit-driven style of sparkling wine and, therefore, did not exhibit any apparent complexity, while the remaining wines, F$12, F$40, and A$40, each displayed a combination of both fruit and yeast-derived sensory attributes.

3.2.2. Consumer Acceptance for Selected Sparkling Wines

Of the 95 wine consumers who participated in the consumer study, a significant proportion (i.e., 64%) were female (Table 3), which was, perhaps, not especially surprising given Champagne and sparkling wine are generally perceived to be a ‘female drink’ [34]. The age distribution was slightly skewed towards younger consumers, with 29.5% of participants aged <25 years and only 17.9% of participants aged ≥55. However, previous studies suggest younger consumers (i.e., Generation Y) consider Champagne and sparkling wine to be a vibrant, social drink that promotes celebration and sharing [34] and are usually less concerned with traditional images of the product [16]. The perceptions of younger consumers were also deemed of value given Generation Y will become an increasingly important wine consumer cohort in the future [34]. Similar proportions of consumers were observed within the different levels of education and household income (Table 3).
Significant differences were observed between liking scores returned for the selected sparkling wines (Table 4). Surprisingly, the $70 French Champagne (F$70) was the least liked wine, while the $12 Australian sparkling wine (A$12) was liked most (based on average liking scores). This likely reflects compositional differences and therefore sensory properties between wines; i.e., A$12 being a fruit-driven sparkling wine with higher pH, lower TA, and lower alcohol content, compared with F$70, a French Champagne with more perceptible complexity and acidity (Table 2, Figure 4). However, this might also reflect Australian wine consumers’ increased familiarity with Australian sparkling wine styles (relative to Champagne).
Previous research suggests Australian women are more likely to drink white wine and sparkling wine than men [35], which may reflect the gender based consumption behavior and/or wine style and taste preferences proposed by Bruwer and colleagues [36]. However, no statistically significant differences were observed in the hedonic liking of sparkling wines by female vs. male consumers (Table S2). Sensory preference differences have also been reported between generational cohorts [36], but again, in the current study, age did not significantly influence liking scores; the exception being that older consumers (those >35 years of age) liked the A$12 sparkling wine significantly more than younger consumers (those ≤35 years of age). Given the considerable disparity observed between individual consumer wine preferences (Table S2), cluster analysis based on individual hedonic scores was performed and enabled the identification of three distinct consumer segments (Table 3 and Table 4).
Cluster 1 comprised 27 consumers who were predominantly female, younger than 40 years, and with lower education (only 52% had tertiary qualifications) and household income (63% earned <$100,000 per annum). These consumers liked F$12 and A$12 the most and F$70 and A$70 the least, in agreement with previous findings that fruit aromas and flavors are important to female consumers and that, at a young age, female consumers report a clearer preference for sweeter wine styles [36]. Cluster 2 comprised 25 consumers, most of whom were older (40% were aged between 40 and 54 years and 24% were older than 55) and held tertiary qualifications (72%). Consumers in this cluster liked F$70 and A$70 the most, while F$40 was their least liked wine. The remaining 43 consumers belonged to Cluster 3 and comprised many of the younger consumers (30% were aged between 25 and 39 years and 30% were younger than 25). Hedonic ratings for this cluster ranged from 5.8 to 7.3, suggesting consumers liked all six sparkling wines with F$40 being the most liked wine. This may reflect younger consumers’ perception of Champagne and sparkling wine as a ‘social drink’, readily associated with celebration and sharing [35]. Cluster preferences are also likely to reflect consumers’ familiarity (or prior consumption) of different wine styles; i.e., it would be reasonable to expect older, more highly educated and/or more affluent consumers to have had more opportunities to consume French Champagne and/or premium Australian sparkling wines. Thus, these consumers are likely to have developed a greater appreciation for the complexity associated with sparkling wines such as F$70 and A$70. This might explain why the younger, less educated and less affluent consumers within Cluster 1 preferred the more fruit-driven F$12 and A$12 over F$70 and A$70. Interestingly, in the blind tastings conducted within this study, Australian wines were liked as much, if not more than French wines (Table 4). However, consumers were unable to determine sparkling wine provenance (country of origin) with a similar percentage of consumers designating each sparkling wine as French (22%–32%) or Australian (33%–53%) in origin (Table 5). These results are consistent with previous research in which consumers were unable to discriminate Champagnes in blind tastings, but when bottle prices or labels were revealed, rankings followed the hierarchy of the market [37,38,39]. Consumers were also less confident designating the provenance of the two Champagnes, F$40 and F$70, but with the exception of F$70, consumers gave higher liking scores to sparkling wines considered to be French in origin (Table 5), demonstrating the assertion that country of origin is perceived (rightly or wrongly) to be an indicator of wine quality [9].
Not surprisingly, consumers were also unable to discern wine price based on blind tastings (Table 4), with the average price of all wines estimated to be $21–$30 per 750 mL bottle. However, when the front labels of each wine were revealed, consumers assumed French wines were more expensive than Australian wines (Table 4), again demonstrating a clear country of origin effect, as well as the extent to which extrinsic attributes influence consumer perceptions of quality, as in previous studies [7,8,9,10,11,12,13]. Brand recognition likely influenced consumers also. Most consumers recognized F$70 (n = 48, 51%) and A$12 (n = 78, 82%) as familiar brands, which likely explains why price estimates for these wines (based on wine label) more closely reflected their retail prices, whereas the expected prices for F$12 and F$40 were over-estimated and A$70 was under-estimated. Charters and coworkers found the F$70 brand was recognized by consumers from Australia, New Zealand and the UK [34]. In contrast, there would be significantly less brand awareness for F$12 and F$40, which suggests consumers instead based price estimates on country of origin. This is consistent with suggestions that where consumers are familiar with a product, geographical origin reinforces perceptions of quality [40], especially for products with established cultural heritage [7].
Research findings demonstrate there is diversity amongst the sparkling wine consumer base and provide insight into the appeal of different sparkling wine styles to different segments of the target market. Results also highlight the relative importance of extrinsic vs. intrinsic cues in determining consumer preferences for, and quality perceptions of, different sparkling wines. Consumers, especially younger consumers, tend to focus on the symbolic aspects of sparkling wine consumption (i.e., occasion, celebration, and prestige) rather than on wine sensory attributes [16,34]. Therefore, in order to improve market share, Australian sparkling wine producers need to tailor marketing strategies to account for the motives driving consumer purchasing and consumption behavior; i.e., away from grape variety, which is less likely to influence purchase decisions for sparkling wine than for table wine, towards both regionality and occasion.

4. Conclusions

This study aimed to evaluate Australian wine consumer preferences for Australian sparkling wines vs. French Champagne and any compositional and/or sensory drivers for these preferences. PCA of MIR spectra obtained for 45 sparkling wines, including 23 French Champagnes, one French sparkling wine and 21 Australian sparkling wines, suggested (i) considerably less compositional variation amongst French Champagnes than amongst Australian sparkling wines, indicative of the strict appellation regulations that govern Champagne production and (ii) compositional similarities between some premium Australian sparkling wines and the French Champagnes. The broad range of hedonic ratings given to a subset of French and Australian sparkling wines (priced from $12 to $70) demonstrated the variation in individual consumer’s preferences for sparkling wines. Segmentation based on hedonic ratings provided insight into how different sparkling wine styles (e.g., fruit-driven vs. complex styles) appeal to different segments of the domestic sparkling wine market. The extent to which country of origin influenced consumer perceptions of price, but not liking, was also demonstrated.

Supplementary Materials

The following are available online at www.mdpi.com/2306-5710/2/3/19/s1, Table S1: Mean intensity ratings for sensory attributes of selected sparkling wines, Table S2: Consumer liking of selected sparkling wines by gender and age.

Acknowledgments

The authors gratefully acknowledge: The members of the Australian wine industry who donated sparkling wines; Tommaso Liccioli for assistance with residual sugar analysis; the University of Adelaide staff and students involved in DA; and the wine consumers who participated in focus groups. This research was funded by Wine Australia and N.V. and M.L. were recipients of Wine Australia scholarships (GWR Ph1309 and GWR H1203, respectively).

Author Contributions

J.C., R.R., K.P., D.C. and K.W. conceived and designed the experiments; J.C., N.V., S.O.M. and M.L. performed the experiments; J.C., N.V., R.R. and S.O.M. analyzed the data; and J.C. and K.W. wrote the paper, with N.V., R.R., S.O.M., M.L., K.P. and D.C. providing editing support.

Conflicts of Interest

The authors declare no competing financial interest.

References

  1. Alexandre, H.; Guilloux-Benatier, M. Yeast autolysis in sparkling wine—A review. Aust. J. Grape Wine Res. 2006, 12, 119–127. [Google Scholar]
  2. Wine Australia 2014: Domestic Sales of Australian Wine by Winestyle. Available online: http://www.wineaustralia.com/en/Winefacts%20Landing/Domestic%20Market%20Intelligence/ABS%20Domestic%20Sales/Domestic%20Sales%20of%20Australian%20Wine%20by%20Winestyle.aspx?ec_trk=followlist&ec_trk_data=ABS+Domestic+Sales (accessed on 27 November 2015).
  3. Winetitles: Wine Industry Statistics. Available online: http://winetitles.com.au/statistics/wineries_numbers.asp (accessed on 27 November 2015).
  4. Verdonk, N.R.; Culbert, J.A.; Wilkinson, K.L. Sparkling wine: All that sparkles: Consumer perceptions of sparkling wine. Wine Vitic. J. 2015, 30, 71–73. [Google Scholar]
  5. Charters, S. Drinking Sparkling Wine: An Exploratory Investigation. Int. J. Wine Market. 2005, 17, 54–68. [Google Scholar]
  6. Bruwer, J.; Li, E.; Reid, M. Segmentation of the Australian wine market using a wine-related lifestyle approach. J. Wine Res. 2002, 13, 217–242. [Google Scholar]
  7. Felzensztein, C.; Hibbert, S.; Vong, G. Is the country of origin the fifth element in the marketing mix of imported wine? J. Food Prod. Market. 2004, 10, 73–84. [Google Scholar]
  8. Spawton, T. Why winemakers should know who consumes their wine and devise their marketing accordingly. Aust. Grapegrow. Winemak. 1991, 334, 33–37. [Google Scholar]
  9. Balestrini, P.; Gamble, P. Country-of-origin effects on Chinese wine consumers. Br. Food J. 2006, 108, 396–412. [Google Scholar] [CrossRef]
  10. Johnson, T.E.; Bastian, S.E.P. A preliminary study of the relationship between Australian wine consumers’ wine expertise and their wine purchasing and consumption behaviour. Aust. J. Grape Wine Res. 2007, 13, 186–197. [Google Scholar]
  11. Crump, A.M.; Johnson, T.E.; Bastian, S.E.P.; Bruwer, J.; Wilkinson, K.L. Consumers’ knowledge of and attitudes towards the role of oak in winemaking. Int. J. Wine Res. 2014, 6, 21–30. [Google Scholar]
  12. Bilkey, W.J.; Nes, E. Country-of-origin effects on product evaluations. J. Int. Bus. Stud. 1982, 13, 89–99. [Google Scholar]
  13. Veale, R.; Quester, P. Do consumer expectations match experience? Predicting the influence of price and country of origin on perceptions of product quality. Int. Bus. Rev. 2009, 18, 134–144. [Google Scholar]
  14. Thode, S.; Maskulka, J. Place-based marketing strategies, brand equity and vineyard valuation. J. Prod. Brand Manag. 1998, 7, 379–399. [Google Scholar]
  15. Chaney, I.M. Promoting wine by country. Int. J. Wine Market. 2002, 14, 34–40. [Google Scholar]
  16. Charters, S. An ambivalent luxury: Images of Champagne in the Australian market. In Presented at Beccus Wine Conference: Fourth Interdisciplinary and International Wine Conference, Dijon, France, 7–9 July 2009.
  17. Brissonet, F.; Maujean, A. Identification of some foam-active compounds in Champagne base wines. Am. J. Enol. Vitic. 1991, 42, 97–102. [Google Scholar]
  18. De La Presa-Owens, C.; Schlich, P.; Davies, H.D.; Noble, A.C. Effect of Méthode Champenoise process on aroma flavour of four V. vinifera varieties. Am. J. Enol. Vitic. 1998, 49, 289–294. [Google Scholar]
  19. Vannier, A.; Bruna, O.X.; Feinberg, M.H. Application of sensory analysis to champagne wine characterisation and discrimination. Food Qual. Preference 1999, 10, 101–107. [Google Scholar]
  20. Chamkha, M.; Cathala, B.; Cheynier, V.; Douillard, R. Phenolic composition of Champagnes from Chardonnay and Pinot noir vintages. J. Agric. Food Chem. 2003, 51, 3179–3184. [Google Scholar] [CrossRef] [PubMed]
  21. Coelho, E.; Coimbra, M.A.; Nogueira, J.M.F.; Rocha, S.M. Quantification approach for assessment of sparkling wine volatiles from different soils, ripening stages, and varieties by stir bar sorptive extraction with liquid desorption. Anal. Chim. Acta 2009, 635, 214–221. [Google Scholar]
  22. Gallardo-Chacón, J.J.; Vichi, S.; López-Tamames, E.; Buxaderas, S. Changes in the sorption of diverse volatiles by Saccharomyces cerevisiae lees during sparkling wine aging. J. Agric. Food Chem. 2010, 58, 12426–12430. [Google Scholar]
  23. Torrens, J.; Riu-Aumatell, M.; Vichi, S.; Lopez-Tamames, E.; Buxaderas, S. Assessment of volatile and sensory profiles between base and sparkling wines. J. Agric. Food Chem. 2010, 58, 2455–2461. [Google Scholar]
  24. Martínez-Lapuente, L.; Guadalupe, Z.; Ayestarán, B.; Ortega-Heras, M.; Pérez-Magariño, S. Changes in polysaccharide composition during the sparkling winemaking and aging. J. Agric. Food Chem. 2013, 61, 12362–12373. [Google Scholar]
  25. Pérez-Magariño, S.; Martínez-Lapuente, L.; Bueno-Herrera, M.; Ortega-Heras, M.; Guadalupe, Z.; Ayestarán, B. Use of commercial dry yeast products rich in mannoproteins for white and rosé sparkling wine elaboration. J. Agric. Food Chem. 2015, 63, 5670–5681. [Google Scholar]
  26. Edelmann, A.; Diewok, J.; Schuster, K.C.; Lendl, B. Rapid method for the discrimination of red wine cultivars based on mid-infrared spectroscopy of phenolic wine extracts. J. Agric. Food Chem. 2001, 49, 1139–1145. [Google Scholar]
  27. Bevin, C.J.; Dambergs, R.G.; Fergusson, A.J.; Cozzolino, D. Varietal discrimination of Australian wines by means of mid-infrared spectroscopy and multivariate analysis. Anal. Chim. Acta 2008, 621, 19–23. [Google Scholar]
  28. Liu, L.; Cozzolino, D.; Cynkar, W.U.; Gishen, M.; Colby, C.B. Geographic classification of Spanish and Australian Tempranillo red wines by visible and near-infrared spectroscopy combined with multivariate analysis. J. Agric. Food Chem. 2006, 54, 6754–6759. [Google Scholar]
  29. Cozzolino, D.; Cynkar, W.U.; Shah, N.; Smith, P.A. Can spectroscopy geographically classify Sauvignon Blanc wines from Australia and New Zealand? Food Chem. 2011, 126, 673–678. [Google Scholar]
  30. Riovanto, R.; Cynkar, W.U.; Berzaghi, P.; Cozzolino, D. Discrimination between Shiraz wines from different Australian regions: The role of spectroscopy and chemometrics. J. Agric. Food Chem. 2011, 59, 10356–10360. [Google Scholar]
  31. Culbert, J.; Cozzolino, D.; Ristic, R.; Wilkinson, K. Classification of sparkling wine style and quality by MIR spectroscopy. Molecules 2015, 20, 8341–8356. [Google Scholar]
  32. Iland, P.G.; Bruer, N.; Edwards, G.; Weeks, S.; Wilkes, E. Chemical Analysis of Grapes and Wine: Techniques and Concepts; Patrick Iland Wine Promotions: Adelaide, Australia, 2004. [Google Scholar]
  33. Iland, P.; Gago, P. Australian Wine: From the Vine to the Glass; Patrick Iland Wine Promotions: Adelaide, Australia, 1997. [Google Scholar]
  34. Charters, S.; Velikova, N.; Ritchie, C.; Fountain, J.; Thach, L.; Dodd, T.H.; Fish, N.; Herbst, F.; Terblanche, N. Generation Y and sparkling wines: A cross-cultural perspective. Int. J. Wine Bus. Res. 2011, 23, 161–175. [Google Scholar]
  35. Hoffman, C.A. When consumers buy wine, what factors decide the final purchase? Aust. N. Z. Wine Ind. J. 2004, 19, 82–91. [Google Scholar]
  36. Bruwer, J.; Saliba, A.; Miller, B. Consumer behaviour and sensory preference differences: Implications for wine product marketing. J. Consum. Mark. 2011, 28, 5–18. [Google Scholar] [CrossRef]
  37. Lange, C.; Martin, C.; Chabanet, C.; Combris, P.; Issanchou, S. Impact of the information provided to consumers on their willingness to pay for Champagne: Comparison with hedonic scores. Food Qual. Preference 2002, 13, 597–608. [Google Scholar]
  38. Combris, P.; Lange, C.; Issanchou, S. Assessing the effect of information on the reservation price for Champagne: What are consumers actually paying for? J. Wine Econ. 2006, 1, 75–88. [Google Scholar] [CrossRef]
  39. Vignes, A.; Gergaud, O. Twilight of the idols in the market for Champagne: Dissonance or consonance in consumer preferences? J. Wine Res. 2007, 18, 147–162. [Google Scholar]
  40. Cordell, V.V. Effects of consumer preferences for foreign sourced products. J. Int. Bus. Stud. 1992, 23, 251–296. [Google Scholar] [CrossRef]
Figure 1. Mean ATR-MIR spectra (4000–400 cm−1) obtained from (degassed) French and Australian sparkling wine samples (n = 45).
Beverages 02 00019 g001
Figure 2. PCA plot generated from the MIR fingerprints (1500–900 cm−1) of sparkling wines.
Beverages 02 00019 g002
Figure 3. Loadings for the first two PCs from the fingerprint region derived from MIR spectra of sparkling wines.
Beverages 02 00019 g003
Figure 4. PCA plot generated from the sensory profiles of selected sparkling wines; A = aroma descriptor.
Beverages 02 00019 g004
Table 1. Attributes and reference standards used in descriptive analysis of sparkling wines.
Aroma AttributeDescriptorsReference Standard a
Citrus bLemon, grapefruit, lime, orange, mandarinGrapefruit 4.5 g + lemon 3.0 g + lime 2.0 g + orange 3.0 g
Stone fruit bApricot, nectarine, peach, white peachDried peach and apricot mixture 8.3 g + fresh nectarine 4.2 g + fresh peach 3.8 g + fresh apricot 3.0 g
Tropical fruitPineapple, melon, lychee, banana, passionfruitRock melon 5.8 g (pulp + seeds) + lychee 2.3 g + lychee juice 1 mL + pineapple 5.6 g + pineapple juice 1 mL + passionfruit 3.0 g
Pome fruit bApple, pearApple 6.0 g + pear 6.0 g
FloralRose, perfume, blossom, honeysuckleRose water ½ tablespoon + two jasmine flower petals + two rose flower petals + rose flower stamen 0.3 g
ConfectionTurkish delight, bubble gum, musk, sherbet, strawberries and creamLollies 3.5 g (half each of yellow, green and red ‘snakes’, cut into small pieces) + Turkish delight (¼ of a Cadbury’s square)
Savoury/meatySavoury, meaty, vegemite, soyCooked bacon pieces 2.0 g + a quarter of one smoked almond
Mushroom/earthyMushroom, earthyMushroom 2.0 g + earth 0.2 g
HoneyHoneyHoney 1.35 g
YeastyDoughDried yeast 0.1 g
ToastyBiscuit, bread, brioche, buttery, popcornToasted bread 1.5 g + a quarter of a milk coffee biscuit
Vanilla/caramelVanilla, caramel, coconut, spice/cloveCoconut (fine desiccated) 0.4 g + vanillin 0.05 g
Aged/developedNutty, kerosene, developed, Muscat/port, acetaldehyde20 mL of aged sparkling white wine with a notable kerosene character
a Standards prepared in 20 mL of Chardonnay wine (except for the aged/developed standard); b All components were used, i.e., pulp and peel.
Table 2. pH, titratable acidity, residual sugar, alcohol, and total phenolics content of sparkling wines.
pHTA (g/L)Residual Sugar (g/L)Alcohol (% abv)Total Phenolics (au)
FrenchAll (n = 24)Range3.0–3.46.3–9.72.2–13.410.8–12.91.2–5.6
Mean3.17.610.212.43.0
F$12 3.46.313.410.84.3
F$40 3.17.511.312.41.5
F$70 3.08.011.412.33.5
AustralianAll (n = 21)Range3.0–3.46.1–9.60.5–13.111.2–13.00.3–4.9
Mean3.27.99.012.32.3
A$12 3.36.111.611.43.0
A$40 3.38.98.212.72.6
A$70 3.27.710.712.72.7
abv, alcohol by volume; au, absorbance units.
Table 3. Demographics for sparkling wine consumers (as total sample and hedonic clusters). Values expressed as percentages.
Total Sample (n = 95)Cluster 1 (n = 27, 28.4%)Cluster 2 (n = 25, 26.3%)Cluster 3 (n = 43, 45.3%)
GenderFemale64.274.168.055.8
Male35.825.932.044.2
Age<2529.540.716.030.2
25 to 3928.433.320.030.2
40 to 5424.23.740.027.9
≥5517.922.224.011.6
EducationHigh school or trade35.848.128.032.6
Bachelor’s degree33.737.028.034.9
Postgraduate degree30.514.844.032.6
Household income≤$50,00034.025.928.033.2
$50,001–$100,00030.937.032.025.6
$100,001–$150,00019.129.620.011.6
≥$150,00115.97.420.018.6
Table 4. Consumer liking and expected price of selected sparkling wines.
SampleHedonic Ratings aExpected Price ($/750 mL Bottle)
Total Sample (n = 95)Cluster 1 (n = 27)Cluster 2 (n = 25)Cluster 3 (n = 43)pBased on TastingBased on Front Label
F$125.6 ± 0.2 ab6.0 a4.2 b6.1 a<0.001$21–$30$61–$70
F$405.8 ± 0.2 ab5.03.87.3ns$21–$30$51–$60
F$705.3 ± 0.2 b2.9 b6.7 a5.9 a<0.001$21–$30$61–$70
A$126.3 ± 0.2 a5.8 b5.6 b6.8 a0.05$21–$30$21–$30
A$405.7 ± 0.2 ab5.95.35.8ns$21–$30$41–$50
A$705.8 ± 0.2 ab4.1 b5.9 a6.5 a0.01$21–$30$51–$60
a Hedonic ratings determined using 9-point scales, where 1 = dislike extremely and 9 = like extremely. Mean values for the total sample (n = 95) and for clusters followed by different letters within a column or within rows respectively are significantly different (p = 0.05).
Table 5. Consumer designation of sparkling wine provenance.
French OriginAustralian OriginUnknown Origin
No. of ConsumersHedonic Ratings aNo. of ConsumersHedonic Ratings aNo. of ConsumersHedonic Ratings a
F$1226 (27%)6.7 ± 0.449 (52%)5.0 ± 0.320 (21%)5.6 ± 0.6
F$4031 (32%)6.8 ± 0.432 (34%)5.5 ± 0.332 (34%)5.0 ± 0.4
F$7021 (22%)4.9 ± 0.536 (38%)5.8 ± 0.438 (40%)4.9 ± 0.4
A$1223 (24%)7.4 ± 0.347 (50%)5.8 ± 0.325 (26%)6.0 ± 0.3
A$4026 (27%)7.4 ± 0.346 (49%)5.8 ± 0.223 (24%)5.7 ± 0.4
A$7027 (28%)6.0 ± 0.450 (53%)5.6 ± 0.318 (19%)6.0 ± 0.5
a Hedonic ratings (±standard error) determined using 9-point scales, where 1 = dislike extremely and 9 = like extremely.

