Article

Bottled vs. Canned Beer: Do They Really Taste Different?

1
Barney’s Beer, Edinburgh EH9 1PL, UK
2
BI Norwegian Business School, Nydalsveien 37, Oslo 0484, Norway
3
Crossmodal Research Laboratory, Department of Experimental Psychology, University of Oxford, South Parks Road, Oxford OX1 3UD, UK
*
Author to whom correspondence should be addressed.
Beverages 2016, 2(4), 25; https://doi.org/10.3390/beverages2040025
Submission received: 9 August 2016 / Revised: 15 September 2016 / Accepted: 17 September 2016 / Published: 22 September 2016
(This article belongs to the Special Issue Consumer behavior and beverage choice)

Abstract

:
People often say that beer tastes better from a bottle than from a can. However, one can ask how reliable this perceived difference is across consumers. And, if reliable, one can further ask whether it is a purely psychological phenomenon (associated with the influence of packaging on taste perception), or whether instead it reflects some more mundane physico-chemical interaction between the packaging material (or packing procedure/process) and the contents. Two experiments were conducted in order to address these questions. In the main experiment, 151 participants at the 2016 Edinburgh Science Festival were served a special ‘craft beer’ in a plastic cup. The beer was either poured from a bottle or can (a between-participants experimental design was used). The participants were encouraged to pick up the packaging in order to inspect the label before tasting the beer. The participants rated the perceived taste, quality, and freshness of the beer, as well as their likelihood of purchase, and estimated the price. All of the beer came from the same batch (specifically a Session IPA from Barney’s Brewery in Edinburgh). None of the participants were familiar with this particular craft brew. Nevertheless, those who evaluated the beer from the bottle rated it as tasting better than those who rated the beer served from the can. Having demonstrated such a perceptual difference (in terms of taste), we then went on to investigate whether people would prefer one packaging format over the other when the beer from bottle and can was served blind to a new group of participants (i.e., when the participants did not know the packaging material). The participants in this control study (n = 29) were asked which beer they preferred. Alternatively, they could state that the two samples tasted the same. No sign of a consistent preference was obtained under such blind tasting conditions. Explanations for the psychological impact of the packaging format, in terms of differences in packaging weight (between tin and glass), and/or prior associations of quality with specific packaging materials/formats (what some have chosen to call ‘image molds’), are discussed.

1. Introduction

In casual conversation, people often say that beer from a bottle tastes better than from a can (e.g., Dredge, 2014 [1]). But how is such a difference to be explained? One possibility is that the packaging conveys some sort of taint on the contents (e.g., as was famously the case for tinned tomatoes; see Rosenbaum, 1979 [2]). Alternatively, however, one might hypothesize some difference (e.g., in oxygen) introduced by bottling/canning (see also Wietstock, Glattfelder, Garbe, and Methner, 2016 [3]). More interestingly, though, is the possibility that the packaging may exert some sort of psychological impact over people’s perception of the product itself (see Hine, 1995 [4]; Spence, 2016 [5]; Spence and Piqueras-Fiszman, 2012 [6]; Velasco et al., 2016 [7], for reviews of the psychological influence of packaging on product perception). Notably though, most of the research on the factors that influence beer perception and preference has been focused on the sensory and hedonic properties of the beer itself. In contrast, far less research has been conducted in terms of the influence of extrinsic factors associated with the beer such as its presentation format or label (e.g., Aquilani et al., 2015 [8]; Carvalho et al., 2016 [9]). Nevertheless, it is known that the consumer acceptance of, preference for, and perceived flavour of food and drink products are influenced by their packaging (Piqueras-Fiszman and Spence, 2015 [10]; Sester et al., 2013 [11]; Silva et al., 2017 [12]).
In particular, a product’s packaging has been shown to influence the consumers’ emotional reactions towards, and semantic associations with, a beer (Sester et al., 2013 [11]). The term ‘image mold’ was first introduced by Louis Cheskin to describe the fact that certain arbitrary packaging formats/shapes come to be associated with specific brands/product categories (Cheskin, 1957 [13]; see Spence, 2016 [5], for a review). One of the classic examples here is the Wishbone Salad dressing bottle. The wide, round shape of this shouldered bottle has come to define the packaging shape for the category since its introduction (see Velasco et al., 2016 [7], for a review). The classic Coca-Cola bottle constitutes another iconic image mold (see Gates et al., 2007 [14]; Prince, 1994 [15]; Velasco et al., 2016 [7]), as does the Kikkoman dispenser bottle, and even the Campari Soda bottle developed by the Italian Futurist Fortunato DePero back in 1932 (and still on the shelves today). In terms of the beer category, one can think of the distinctively-shaped steel Sapporo beer can as potentially representing such an image mold, or perhaps the distinctive Brahma beer bottle (see Spence and Piqueras-Fiszman, 2012 [6], for a review). Hence, when a product is presented in packaging that has an identifiable image mold, it can sometimes act as a cue to the brand of product. Hence, it may well be the brand awareness that is doing the work in terms of modulating people’s perception of the taste/quality of the contents as much as the physical attributes of the packaging itself. The suggestion here is that presenting a product in such a distinctive packaging format, will cue the consumer to the likely product attributes, as much as revealing the brand name of a beer has been shown to do (e.g., Allison and Uhl, 1964 [16]; Anonymous, 1962 [17]).
In terms of the psychological sensory impact of packaging on product perception, there could be a number of plausible explanations. On the one hand, one might consider any differences in the visual appearance, sound, or feel of the packaging. There is, after all, an emerging literature showing that very often our feelings about the packaging appear to be transferred to our perception of the contents of that packaging (e.g., Krishna and Morrin, 2008 [18]). This is known as ‘sensation transference’ (see Spence and Piqueras-Fiszman, 2012 [6], for a review).
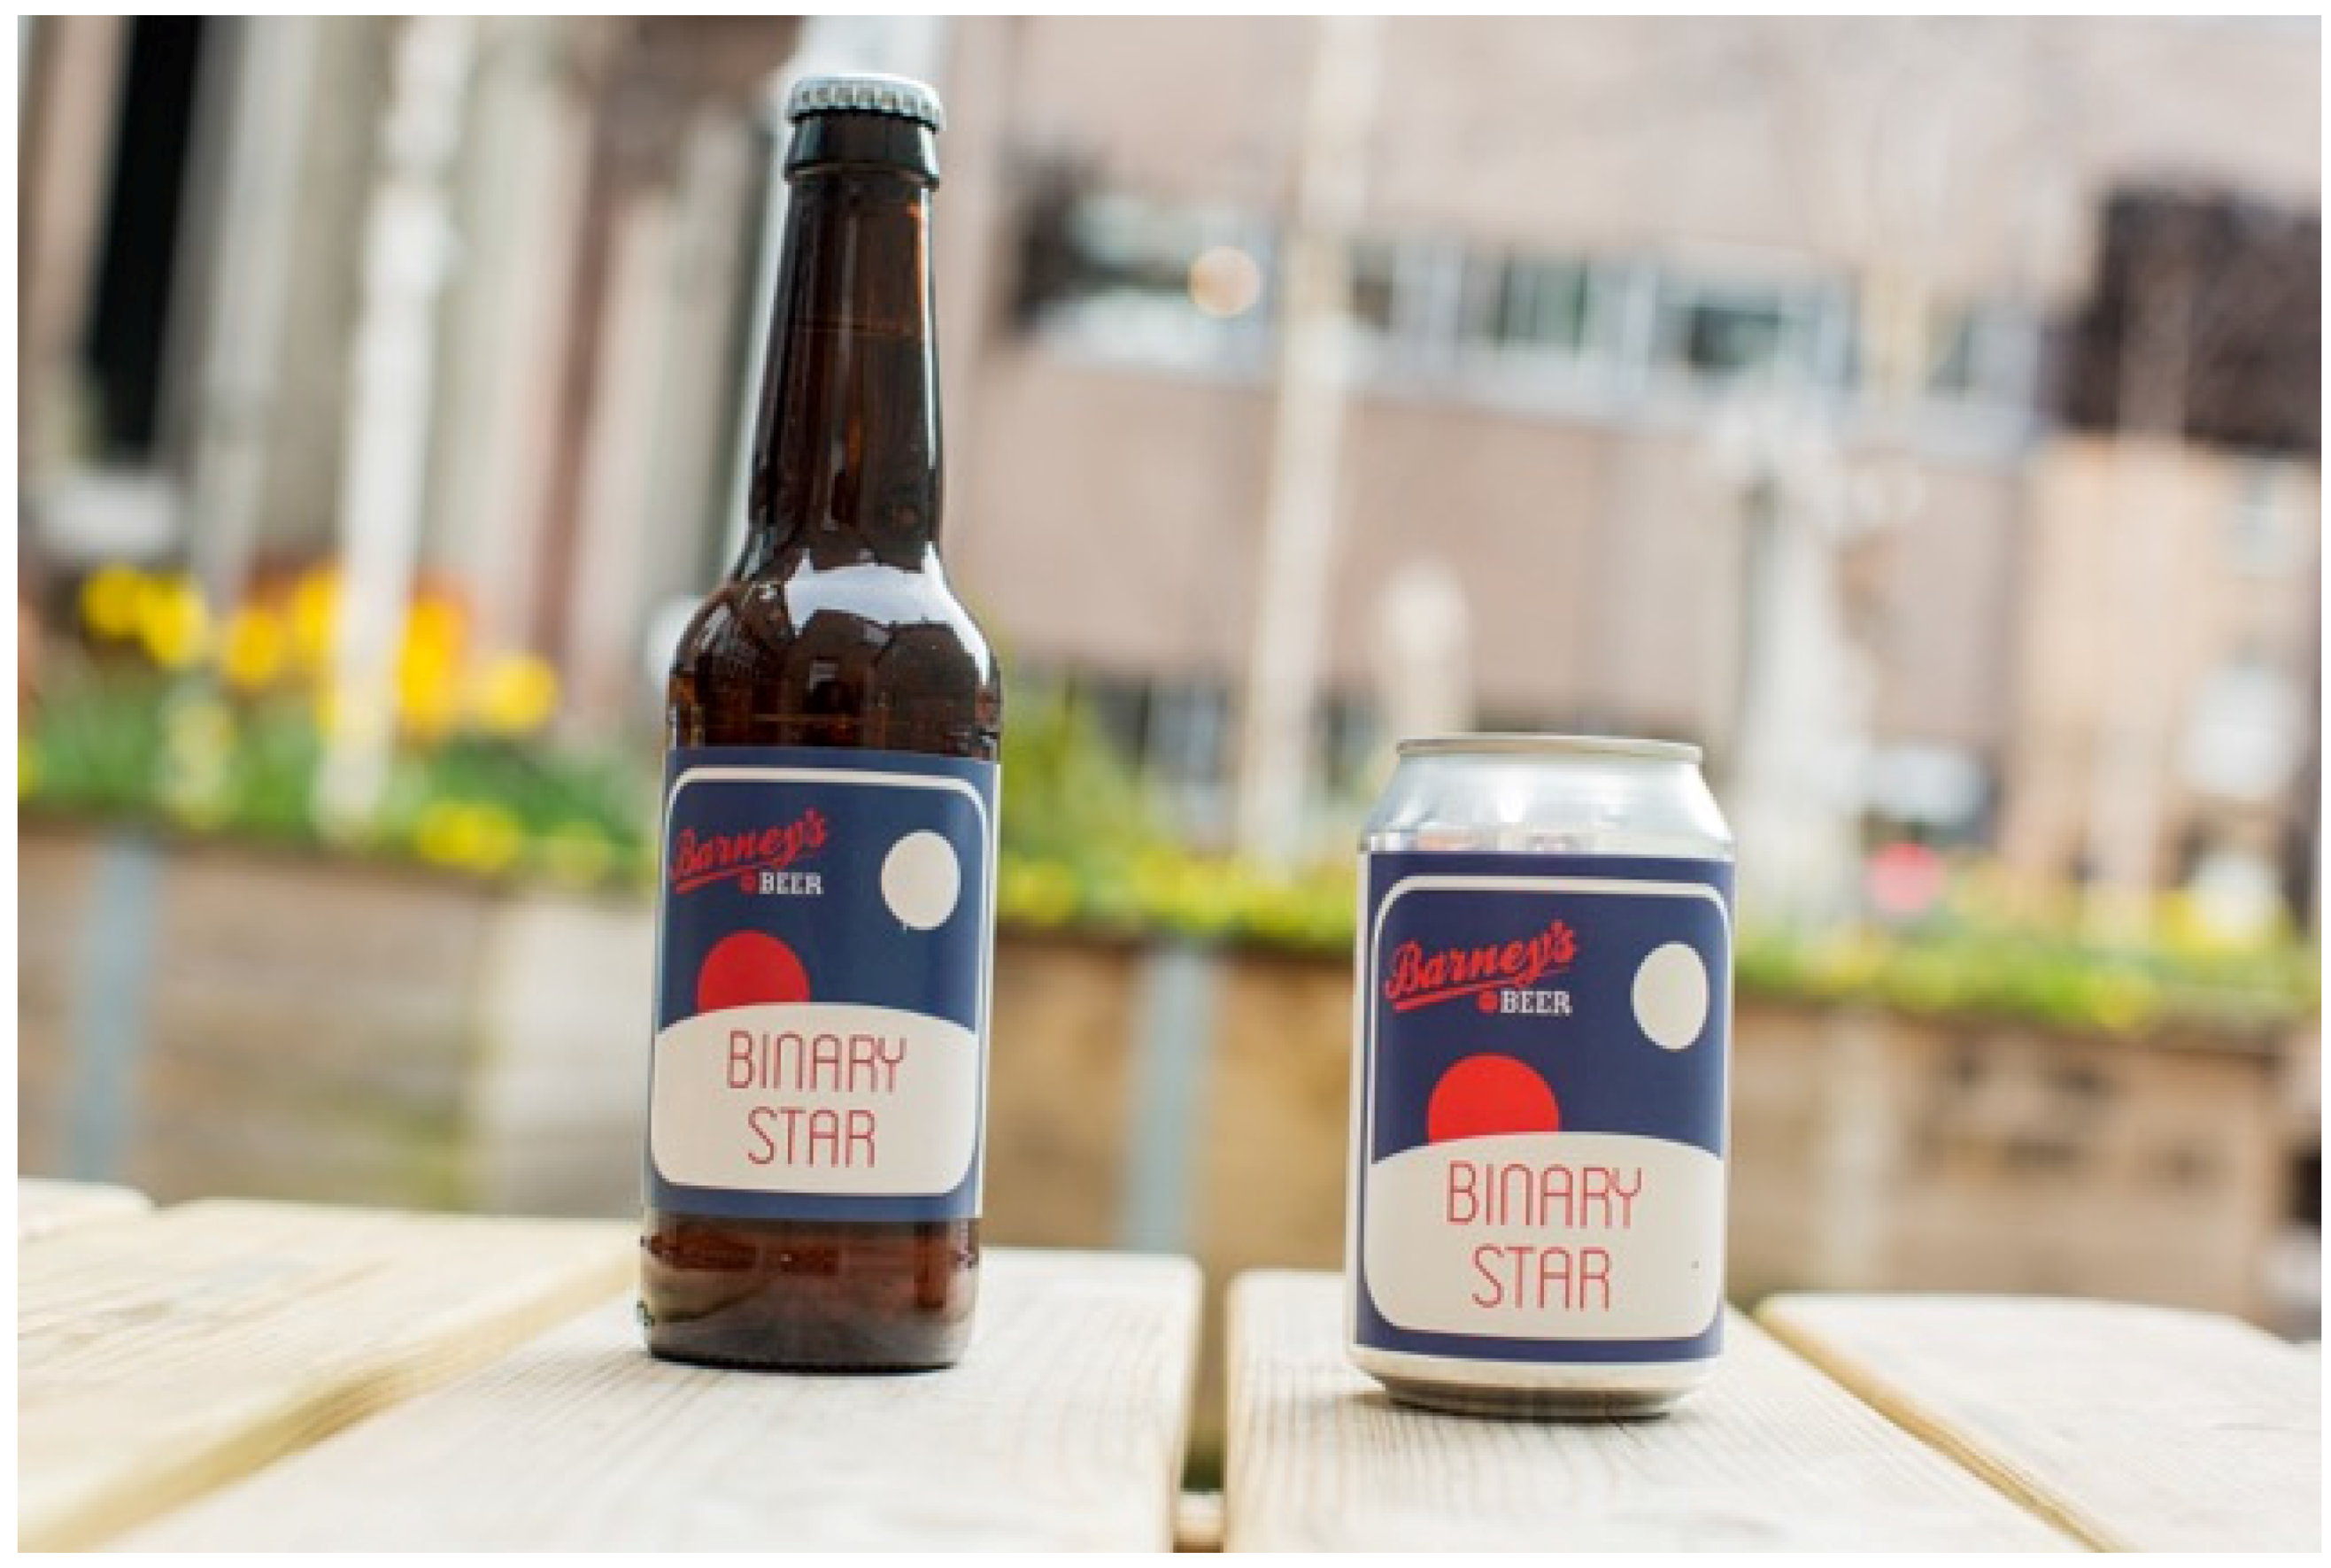
In the present study, we first conducted a preliminary online questionnaire in order to assess people’s preferences for different packaging formats. Next, a between-participants experiment was conducted at the 2016 Edinburgh Science Festival in order to determine what impact, if any, the type of receptacle (i.e., the packaging) had on the perceived taste of beer. Finally, we collected data in a small follow-up control study to check that when tasted blind, people showed no preference for a specific packaging format. In the main part of the study (the second stage), one group of participants was given a plastic cup of beer to taste that they saw being poured from a bottle. Another group of participants also rated beer from a plastic cup, but in this case they saw the beer being poured from a can instead (see Figure 1). Importantly, the beer was from the same batch (donated by Barney’s Beer in Edinburgh, a small micro-brewery; see http://barneysbeer.co.uk/) so that all that varied was the receptacle in which the drink was served and consumed. That said, the participants were encouraged to pick up the bottle or can in order to inspect the label before rating the beer.

2. Methods

2.1. Preliminary Study

Sixty-two participants (30 females, mean age = 29.40 years, SD = 9.32) took part in the preliminary study on Prolific Academic (http://prolific.ac/) in exchange for £0.33. The study consisted of a short questionnaire in which the participants were asked some demographic questions (age, gender), and two main questions. The first question inquired about their beer drinking frequency (“How often do you drink beer?”), and the participants responded using a 6-point scale (never, once a year, once a month, once a week, every few days, every day). The second question concerned their preferred beer format. In particular participants were given three options, namely, “Bottle”, “Can”, “It all tastes the same”, to respond to the question “A beer tastes better from?”.

2.2. Main Experiment

2.2.1. Participants

A total of 151 participants (80 females, mean age = 31.83, SD = 8.70, age range 20–68, information based on 144 people who provided their age) took part in the study. The study followed a between-participants experimental design. Sixty-nine of the participants were served a bottled beer (35 females, mean age = 33.27, SD = 10.12, ranging from 20 to 68 years), while a further 82 were served beer from a can (45 females, mean age = 30.61, SD = 7.13, ranging from 20 to 57 years).

2.2.2. Apparatus and Materials

Two different presentations of the same beer were used in the experiment. The bottled and canned beers had a weight of 560 g and 365 g, respectively, and both forms of packaging contained 330 mL of beer.

2.2.3. Procedure

Most of the testing was conducted at the opening night of the Edinburgh Science Festival on the 24 March 2016 (http://www.sciencefestival.co.uk/). Specifically, the respondents were invited to participate in the test and given a sample of beer in a plastic cup. They were shown the bottle or can and were invited to pick up a full bottle or can and to read the label prior to rating the beer that they had been given to taste. Bottle tasting was conducted for roughly an hour, followed by can tasting for the next hour, and so on throughout the rest of the evening. The beer was pre-chilled in the cold room at the brewery prior to the tasting session at 10 °C. Both bottles and cans were then placed in a small ice-bath to keep them cool at the event. Each participant was given a pencil-and-paper questionnaire to complete. This included questions concerning the participant’s demographic details as well as their evaluation about the beer (e.g., their perceived taste, quality, freshness, price, and likelihood of re-purchase, see Appendix A). A few additional samples (bottle only) were gathered at an event the following evening using exactly the same methodology.

3. Results

3.1. Preliminary Study

The results of the preliminary study largely support the anecdotal reports suggesting that people think that a beer tastes better from a bottle (see Table 1). Specifically, 61.29% believed that a beer tastes better from a bottle, 27.42% that a beer tastes the same from a bottle or a can, and 11.29% that it tastes better from a can. Although the sample size of this preliminary study is small and only three options were given to choose from for the main question, it is nevertheless intriguing that participants with different beer drinking habits seem to agree that a beer tastes better in a bottle format. In addition, in 2014, a similar survey was posted online (see [1]) on The Telegraph newspaper website, in which people were asked “Do you prefer the taste of beer out of...” and were given three options to respond: “a can”, “a bottle”, “a can or a bottle—it makes no difference” (Dredge, 2014 [1]). The results of such survey clearly support the results of our preliminary test in that out of 4151 people who responded until 4 September 2016, 583 (14.04%) answer “a can”, 902 (21.73%) “a can or a bottle—it makes no difference”, and 2666 (64.23%) “a bottle”.

3.2. Main Experiment

The data from eight participants who reported that they took part in a similar experiment before, were excluded from the analyses. In addition, data from six additional participants who failed to respond to all the questions associated with the beer samples were also excluded from the analyses. The analyses (for more information about the statistical analyses used in the present research, see Field (2009) [19]) were conducted in the remaining 137 participants (66 females, mean age = 31.96, SD = 8.80, age range 20–68 years, see also Table 2, for a summary of the demographic variables as a function of group). No significant differences were observed in terms of how often the participants in the two groups drank beer (Mann-Whitney U = 2200.50, p = 0.534, Effect Size (r) = 0.053). On average, the participants reported drinking beer about once a month (M = 5.89, SD = 1.60).
Kolmogorov-Smirnov tests revealed that none of the variables were normally distributed (ps ≤ 0.001). For that reason, Mann-Whitney tests were performed on the taste, quality, freshness, likely, and price ratings. The results are summarized in Table 3.
The results provide evidence to support the idea that participants rated the beer as tasting significantly better when consumed from the bottle than from the can. There was a borderline-significant effect on perceived quality ratings as well. Once again, people’s perception of the quality of the drink was slightly higher for the beer served from the bottle than from the can (see Figure 2).
One possible concern here is whether some taint or physico-chemical difference might have been introduced as a function of the packaging materials used. In the past, it is certainly true that tin cans gave a detectable taint to certain food and beverage products (e.g., tinned tomatoes; see Rosenbaum, 1979 [2]; see also Wietstock et al., 2016 [3]). Alternatively, it could be hypothesized that there might be better oxygen-control in the case of bottling vs. canning, or vice versa. Although we thought these possibilities unlikely in the present case, we nevertheless deemed it prudent to conduct a blind tasting control study in which 29 participants were served two glasses of beer blind (one from bottle the other from can) and had to indicate whether they preferred one of the samples or both equal (see Appendix B for the questionnaire used). The blind taste test was conducted at the SciMart event in Edinburgh on 3 April 2016. In this case, the participants were not told anything about the beers that they were tasting. The demographic of the participants and testing procedure was similar to that reported in the main experiment.
Crucially, the results revealed no differences between the bottled or canned beer when served blind—specifically 13 said that they preferred the canned beer, 12 preferred the bottled beer and 4 said the two samples tasted the same. Hence, in this case at least, the impact of packaging format on the preference for the beer would appear to be entirely psychological in nature. In the future, it would be interesting to replicate this study with a larger sample, and perhaps varying people’s familiarity with the product being evaluated.

4. Discussion

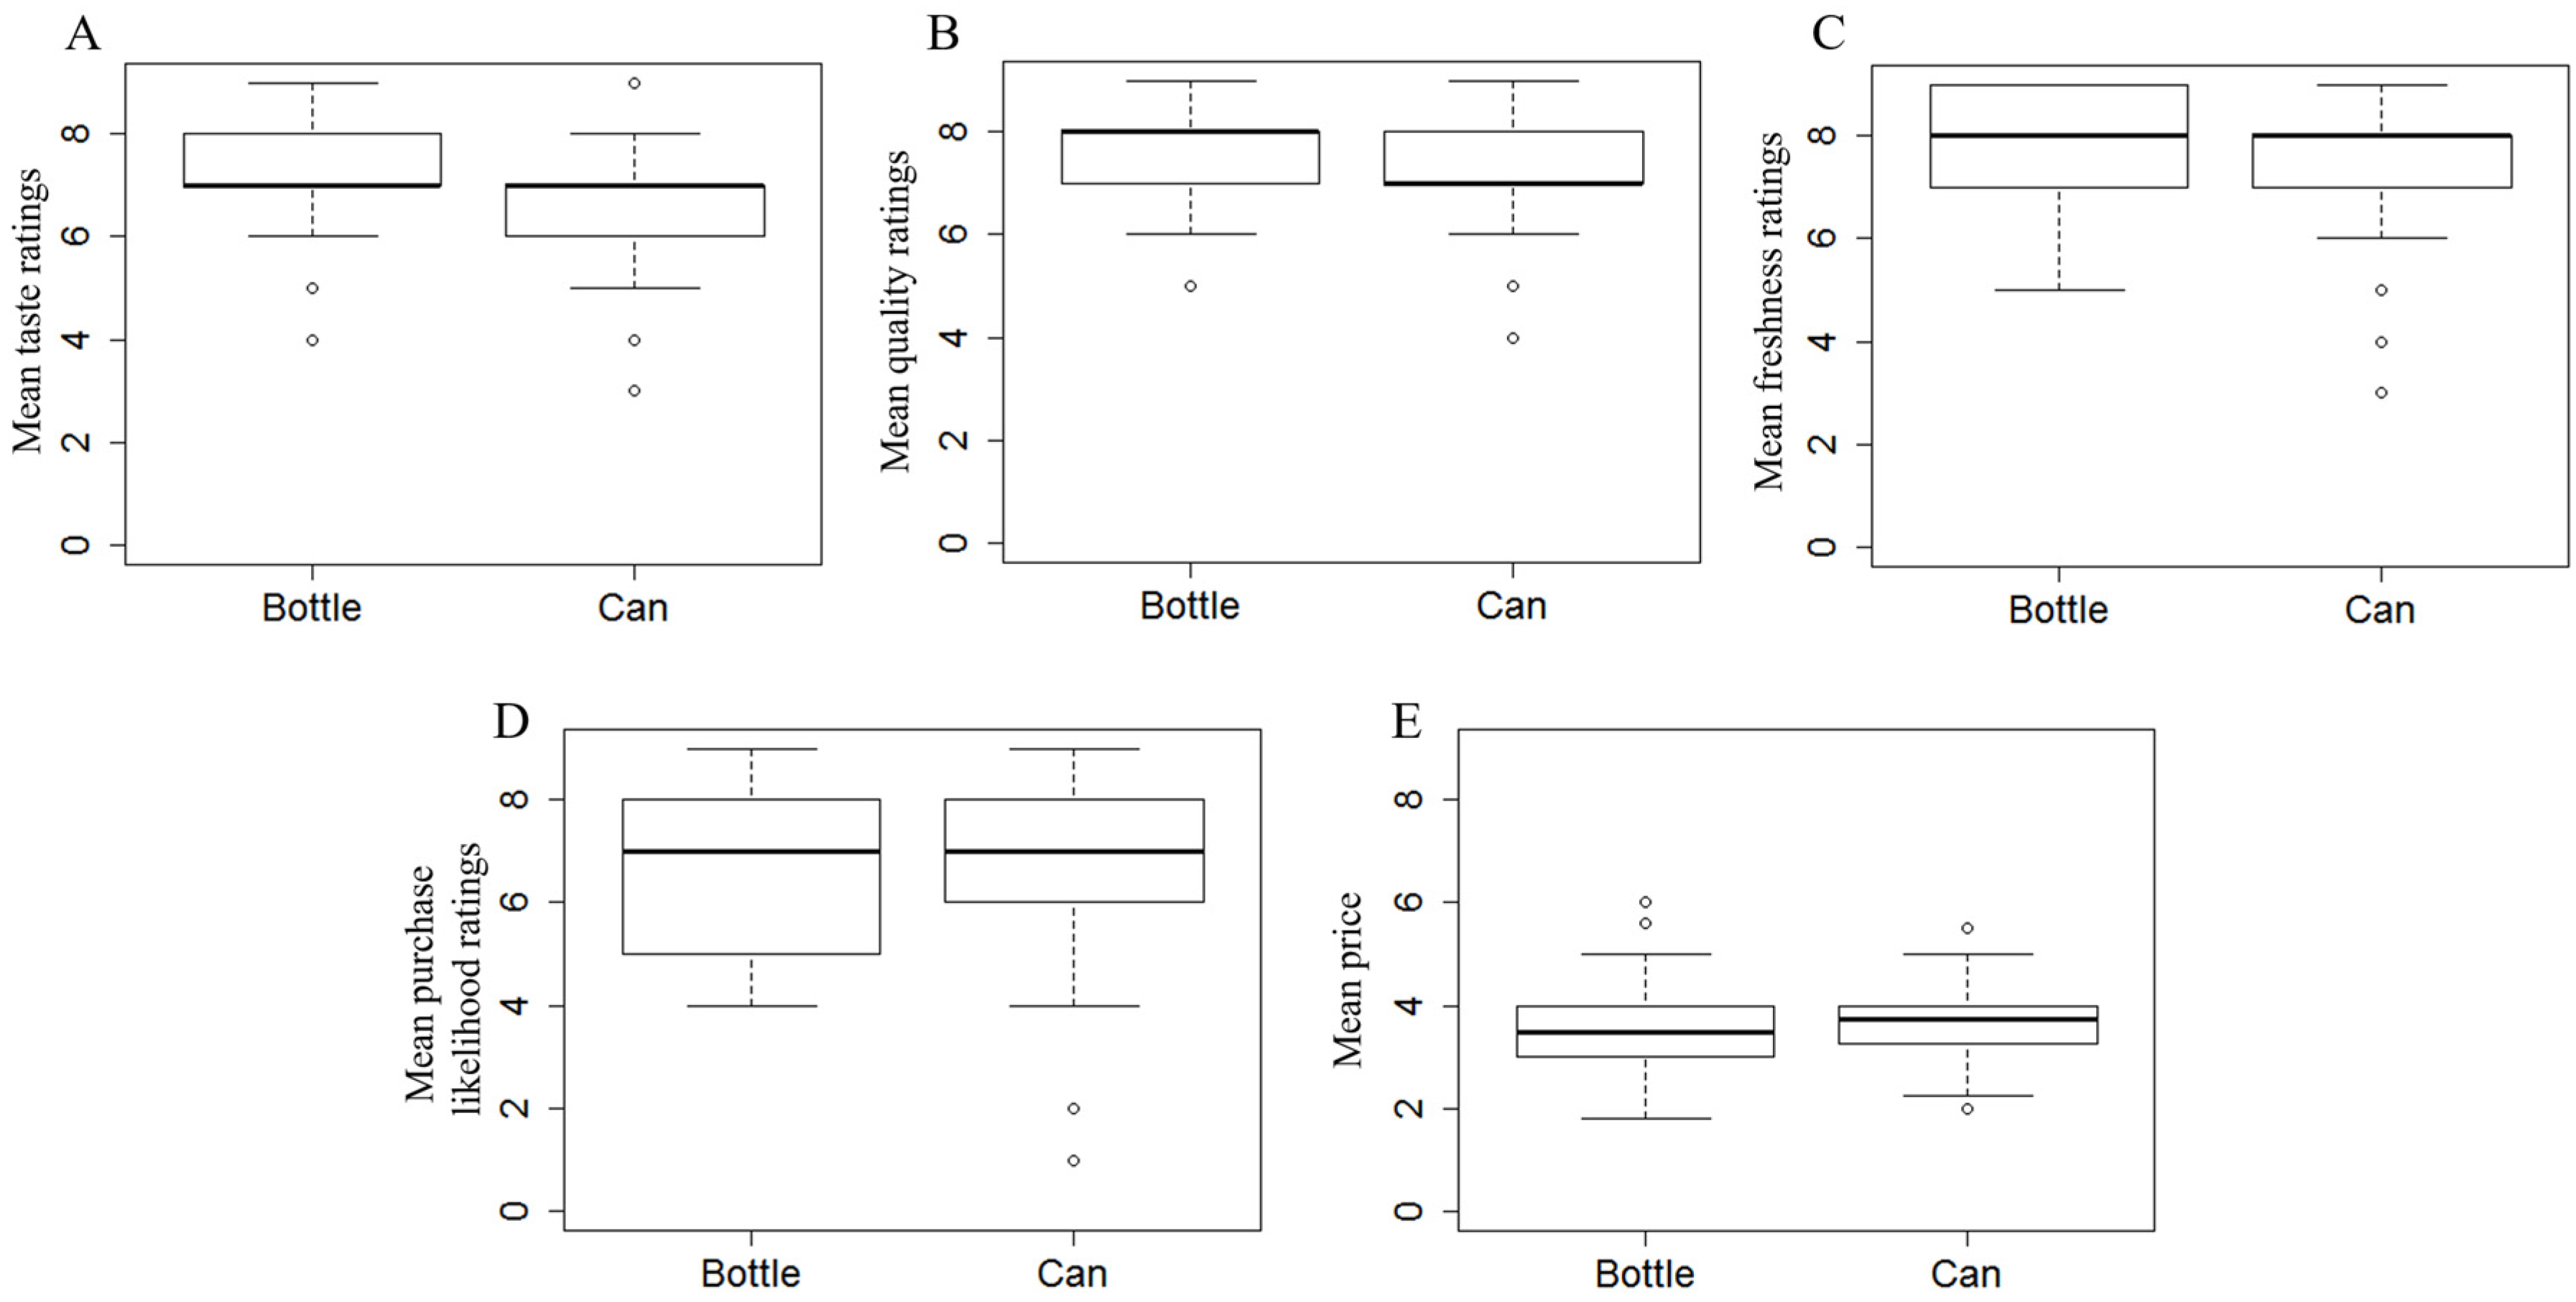
The results of the present study support the folk notion that beer tastes better from a bottle than from a can (see Spence, 2016 [5]; Spence and Piqueras-Fiszman, 2012 [6], for reviews). The packaging in which the beer was served in the present study was shown to exert a significant influence over the perceived taste of the beer, even though the beer itself was tasted from the same plastic cup in all cases. One can only imagine how much more pronounced the effects of packaging on taste may have been had participants tasted the beer direct from the packaging (i.e., bottle vs. can). Be aware though, that this kind of design would likely also introduce additional variability in terms of aroma perception given the differing opening formats of bottles versus cans (see Spence, 2016 [21]). Intriguingly, a consistent trend for the bottled beer to be preferred were also demonstrated on perceived quality (though they just failed to reach statistical significance with the convenience sample collected here, thus, potentially deserving follow-up in future research). Here, it is important to consider whether differences in packaging material (e.g., glass vs. tin, therefore potentially their texture) or weight were doing the work in terms of driving the perceived differences in taste, or rather if it was the ‘image mold’ that was critical (Hine, 1995 [4]; Spence, 2016 [5]). It is, of course, possible that both factors may have contributed to the effects seen here.
Consumers may well have different associations with bottled vs. canned beer (see also Aquilani et al., 2015 [8]). In fact, one explanation for the significant difference obtained in the present study relates to the fact that the volume manufacturers moved from bottles to cans as the principal beer packaging format during the 1980s and 1990s. This change in packaging format coincided with an increase in ‘off-trade’ sales at the expense of ‘on-trade’, not to mention the rise of the supermarkets as the biggest channel for sales. Relevant here, cans were used by volume brewers and multiple grocers as a source of discounting, and the value of beer in this format declined in real terms over this period. It can be hypothesized then that buyers increasingly came to associate cans as a value pack format. Consequently, when ‘craft beer’ emerged as a category it was predominantly packaged in bottles (a more commercially accessible format for low volume production) and had a premium price and publicity. Thus bottles, which had all but disappeared during the preceding two decades returned with a premium or quality association in the beer category. That said, things look to be changing once again, with cans now being presented as the fresher, more convenient, packaging format by craft brewers (led by those working out of the US; see Kleban and Nickerson, 2011 [22], for a review of the U.S. craft brewing industry). That said, it would appear to be hard to get this message through to the consumer, except in exceptional cases. The Sapporo can and perhaps also the Heineken can with its asymmetrical coating of tactile paint were particularly innovative in the beer category (see Anonymous, 2011 [23]; Spence and Piqueras-Fiszman, 2012 [6]).
While it has long been asserted, at least anecdotally, that the packaging material (or image mold) exerts a significant impact on what consumers have to say about the taste of the contents (Hine, 1995 [4]), rigorous empirical data in support of such a notion have, until now, been lacking. That said, the last few years have seen growing interest in the impact of the receptacles in which the consumer drinks on their perception of the contents (see Spence and Wan, 2015 [24], 2016 [25], for reviews). Indeed, as just mentioned, the results of the present study are especially interesting in the context of the recent drive toward cans being used as the preferred packaging material for North American craft beers these days. Note, however, that given that consumption patterns change across groups of consumers, one may well expected a variation across different groups. For example, Aquilani et al., 2015 [8] reported that those consumers who have tasted craft beer (who also drink beer frequently and would drink beer alone) tend to prefer this kind of beer over bottled beer.
Alternatively, as mentioned in the introduction, the influence of the product packaging over taste perception could be something to do with the feel of the packaging in the hand. There are undoubtedly salient perceptual differences in compressability/firmness, temperature (or rather thermal diffusivity; see Bergmann Tiest and Kappers, 2009 [26]), and texture (all of which have been shown to influence taste ratings, e.g., see Biggs et al., 2016 [27]; Krishna and Morrin, 2008 [18]; Piqueras-Fiszman and Spence, 2012 [28]). Perhaps the most noticeable difference though between bottle and can is in terms of their weight. The filled bottle used in the present study weighed in at 560 grams, whereas the can weighed in at 365 grams (there was 330 mL of beer in each packaging format). A growing body of empirical research now shows that adding weight to product packaging can result in an enhancement in people’s perception of the product (e.g., see Gatti et al., 2014 [29]; Kampfer et al., 2016 [30]; Piqueras-Fiszman and Spence, 2012 [31]; Spence and Piqueras-Fiszman, 2011 [32]).
It is also important to highlight the fact that although the labels for both the bottle and the can used in the present research were the same, there are a number of aesthetic variations between the visual impression of the two packages. For example, not only did the shape differ, but also the colour, and visual texture. Given that such sensory cues have also been shown to influence product perception and choice (e.g., Barnett and Spence, 2016 [33]; Hekkert, 2006 [34]; Tu, Yang, and Ma, 2015 [35]; Tu and Yang, 2016 [36]), future research may be well advised to try to disentangle the contribution of each element of the packaging to the experience of the product within, in order to increase the generalizability of the results reported here.
The one other element to consider here is whether the bottle and can are perceived visually to have the same weight. There might, for instance, be illusions of volume differences, despite the fact that both containers actually contained the same volume of liquid (cf. Attwood, Scott-Samuel, Stothart, and Munafò, 2012 [37]; Wansink and van Ittersum, 2003 [38], 2005 [39]). Finally, it is perhaps also worth considering the sound associated with opening and pouring from bottles and cans (see Spence and Wang, 2015 [40], for a review). Once again, this can provide useful information to help the trained consumer distinguish between different beer brands (e.g., see Stummerer and Hablesreiter, 2010 [41], p. 105, for one particularly impressive example).

5. Conclusions

Taken together, then, the results of the present study demonstrate that the packaging in which a beer is served can influence the perceived taste of the product. Our results also provide support for those companies wanting to promote glass over other packaging materials (e.g., see the Vidrio es vida campaign by Peldar, highlighting the sonic benefits of glass bottles over other beverage packaging materials; see [42].) Ultimately though, the decision about which packaging material to use always reflects a trade-off between the cost of different materials/formats, the cost of transportation to market, as well as questions of sustainability and recyclability (Bland, 2008 [43]; Brilhuis-Meijer and Saxena, 2015 [44]), not to mention the impact (psychological or otherwise) of packaging material on perceived taste and quality judgments. In premium categories, such as fine wine, many producers clearly feel it worthwhile to make their glass bottles significantly heavier in order to convey the perception of quality (see Piqueras-Fiszman and Spence, 2012 [28]). Premium beer producers might be well advised to do the same. That said, there have been reports in the North American craft beer market suggesting that people’s perception of canned beer has been on the rise in recent years (see also Elzinga et al., 2015 [45]). Ultimately, of course, one needs to remain cognizant of the fact that the packaging is but one ‘p’ in the marketing mix (see Murray and O’Neill, 2012 [46]; Nickels and Jolson, 1976 [47]). In terms of the managerial implications, the beneficial psychological impact of bottled beer will need to be balanced against the fact that canned beer is roughly 30% cheaper per litre (this figure based on a crude value/volume measure across all brands/skus/promotions/stores, etc.; Nielsen Scantrack, UK, personal communication to AB, 13 September 2016 [48]). Determining the optimal solution for a craft beer producer will likely need consideration on a case-by-case basis.

Author Contributions

A.B. designed the experiment and collected the data. C.V. analysed the data and helped write the paper. C.S. helped with the design of study and took charge of the write-up.

Conflicts of Interest

Andrew Barnett runs Barney’s Beer.

Appendix A. Questionnaire 1: Beer Taste Test

Thank you for taking part in our taste test! Firstly, please answer a few questions about yourself.
Age:□ Male □ Female
Today’s date:The time:
Have you ever drunk Barney’s Beer before?□ Yes □ No
Have you participated in this taste test already?□ Yes □ No
On average, how often do you drink beer?
Several times a day(Nearly) every dayA few times a weekOnce a weekA few times a monthOnce a monthEvery few monthsOnce a yearLess oftenNever
Now, please tell us what you thought of the beer.
On a scale of 1 to 9, how would you rate the taste of the beer?
123456789
Very poor Average Very good
And how would you rate the quality of the beer?
123456789
Very low Average Very high
And how would you rate the freshness of the beer?
123456789
Very low Average Very high
How likely would you be to buy the beer in future?
123456789
Very unlikely Neither likely nor unlikely Very likely
Imagine you are in the pub. A friend is going to the bar and you ask him/her to buy you a Barney’s Beer, but you don’t know how much it costs. You name a price and tell your friend to buy the beer if it costs this much or less, but not if it costs any more as it would be too expensive for this particular beer—and you will pay your friend back. What price do you name as the maximum you would be willing to pay?
£_____________
Finally, please briefly give your thoughts on the beer:
__________________________________________________________________________________________________________________________________________

Appendix B. Questionnaire 2: Beer Taste Test

Thank you for taking part in our taste test! Firstly, please answer a few questions about yourself.
Age:□ Male □ Female
Today’s date:The time:
Have you ever drunk Barney’s Beer before?□ Yes □ No
Have you participated in this taste test already?□ Yes □ No
On average, how often do you drink beer?
Several times a day(Nearly) every dayA few times a weekOnce a weekA few times a monthOnce a monthEvery few monthsOnce a yearLess oftenNever
Now, we are going to give you two beer samples to try.
Could you tell use tell us which you prefer, or if you like them equally?
Beverages 02 00025 i002
Tick which beer you prefer or...
‘I like both beers equally’ Beverages 02 00025 i001

References

  1. Dredge, M. Dose Beer Really Taste Better out of a Bottle? Available online: http://www.telegraph.co.uk/men/the-filter/11089605/Does-beer-really-taste-better-out-of-a-bottle.html (accessed on 20 September 2016).
  2. Rosenbaum, R. Today the strawberry, tomorrow…. In Culture, Curers and Contagion; Klein, N., Ed.; Chandler and Sharp: Novato, CA, USA, 1979; pp. 80–93. [Google Scholar]
  3. Wietstock, P.C.; Glattfelder, R.; Garbe, L.-A.; Methner, F.-J. Characterization of the migration of hop volatiles into different Crown cork liner polymers and can coatings. J. Agric. Food Chem. 2016, 64, 2737–2745. [Google Scholar] [CrossRef] [PubMed]
  4. Hine, T. The Total Package: The Secret History and Hidden Meanings of Boxes, Bottles, Cans, and Other Persuasive Containers; Little Brown: New York, NY, USA, 1995. [Google Scholar]
  5. Spence, C. Multisensory packaging design: Colour, shape, texture, sound, and smell. In Integrating the Packaging and Product Experience: A Route to Consumer Satisfaction; Chen, M., Burgess, P., Eds.; Elsevier: Oxford, UK, 2016; pp. 1–22. [Google Scholar]
  6. Spence, C.; Piqueras-Fiszman, B. The multisensory packaging of beverages. In Food Packaging: Procedures, Management and Trends; Kontominas, M.G., Ed.; Nova Publishers: Hauppauge, NY, USA, 2012; pp. 187–233. [Google Scholar]
  7. Velasco, C.; Woods, A.T.; Petit, O.; Cheok, A.D.; Spence, C. Crossmodal correspondences between taste and shape, and their implications for product packaging: A review. Food Qual. Preference 2016, 52, 17–26. [Google Scholar] [CrossRef]
  8. Aquilani, B.; Laureti, T.; Poponi, S.; Secondi, L. Beer choice and consumption determinants when craft beers are tasted: An exploratory study of consumer preferences. Food Qual. Preference 2015, 41, 214–224. [Google Scholar] [CrossRef]
  9. Carvalho, F.R.; Velasco, C.; van Ee, R.; Leboeuf, Y.; Spence, C. Music influences hedonic and taste ratings in beer. Front. Psychol. 2016, 7, 636. [Google Scholar] [CrossRef]
  10. Piqueras-Fiszman, B.; Spence, C. Sensory expectations based on product-extrinsic food cues: An interdisciplinary review of the empirical evidence and theoretical accounts. Food Qual. Preference 2015, 40, 165–179. [Google Scholar] [CrossRef]
  11. Sester, C.; Dacremont, C.; Deroy, O.; Valentin, D. Investigating consumers’ representations of beers through a free association task: A comparison between packaging and blind conditions. Food Qual. Preference 2013, 28, 475–483. [Google Scholar] [CrossRef]
  12. Silva, A.P.; Jager, G.; Voss, H.P.; van Zyl, H.; Hogg, T.; Pintado, M.; de Graaf, C. What’s in a name? The effect of congruent and incongruent product names on liking and emotions when consuming beer or non-alcoholic beer in a bar. Food Qual. Preference 2017, 55, 58–66. [Google Scholar] [CrossRef]
  13. Cheskin, L. How to Predict What People Will Buy; Liveright: New York, NY, USA, 1957. [Google Scholar]
  14. Gates, P.W.; Copeland, J.; Stevenson, R.J.; Dillon, P. The influence of product packaging on young people’s palatability ratings for RTDs and other alcoholic beverages. Alcohol Alcohol. 2007, 42, 138–142. [Google Scholar] [CrossRef] [PubMed]
  15. Prince, G.W. The contour: A packaging vision seen through Coke-bottle lenses. Beverage World 1994, 113, 1–6. [Google Scholar]
  16. Allison, R.I.; Uhl, K.P. Influence of beer brand identification on taste perception. J. Mark. Res. 1964, 1, 36–39. [Google Scholar] [CrossRef]
  17. Anonymous. Does the label “change” the taste? Print. Ink 1962, 278, 55–57. [Google Scholar]
  18. Krishna, A.; Morrin, M. Does touch affect taste? The perceptual transfer of product container haptic cues. J. Consum. Res. 2008, 34, 807–818. [Google Scholar] [CrossRef]
  19. Field, A.P. Discovering Statistics Using SPSS, 3rd ed.; Sage Publications: London, UK, 2009. [Google Scholar]
  20. Weissgerber, T.L.; Milic, N.M.; Winham, S.J.; Garovic, V.D. Beyond bar and line graphs: Time for a new data presentation paradigm. PLoS Biol. 2015, 13, e1002128. [Google Scholar] [CrossRef] [PubMed]
  21. Spence, C. Enhancing the experience through smell. J. Inst. Food Sci. Technol. 2016, 30, 32–35. [Google Scholar]
  22. Kleban, J.; Nickerson, I. The U.S. craft brew industry. Allied Acad. Int. Conf. 2011, 18, 33–38. [Google Scholar]
  23. Pittilla, M.J. Heineken Chills out with Innovative Packaging Designs. The Moodie Report. 2 June 2010. Available online: http://www.moodiedavittreport.com/heineken-chills-out-with-innovative-packaging-designs/ (accessed on 21 September 2016).
  24. Spence, C.; Wan, I. Beverage perception & consumption: The influence of the container on the perception of the contents. Food Qual. Preference 2015, 39, 131–140. [Google Scholar]
  25. Spence, C.; Wan, I. Assessing the influence of the drinking receptacle on the perception of the contents. In Multisensory Flavor Perception: From Fundamental Neuroscience through to the Marketplace; Piqueras-Fiszman, B., Spence, C., Eds.; Elsevier: Duxford, UK, 2016; pp. 269–296. [Google Scholar]
  26. Bergmann Tiest, W.M.; Kappers, A.M.L. Tactile perception of thermal diffusivity. Atten. Percept. Psychophys. 2009, 71, 481–489. [Google Scholar] [CrossRef] [PubMed]
  27. Biggs, L.; Juravle, G.; Spence, C. Haptic exploration of plateware alters the perceived texture and taste of food. Food Qual. Preference 2016, 50, 129–134. [Google Scholar] [CrossRef]
  28. Piqueras-Fiszman, B.; Spence, C. The weight of the bottle as a possible extrinsic cue with which to estimate the price (and quality) of the wine? Observed correlations. Food Qual. Preference 2012, 25, 41–45. [Google Scholar] [CrossRef]
  29. Gatti, E.; Spence, C.; Bordegoni, M. Investigating the influence of colour, weight, & fragrance intensity on the perception of liquid bath soap. Food Qual. Preference 2014, 31, 56–64. [Google Scholar]
  30. Kampfer, K.; Leischnig, A.; Ivens, B.S.; Spence, C. Touch-taste-transference: Assessing the effect of the weight of product packaging on flavor perception and taste evaluation. PLoS ONE 2016. submitted. [Google Scholar]
  31. Piqueras-Fiszman, B.; Spence, C. The weight of the container influences expected satiety, perceived density, and subsequent expected fullness. Appetite 2012, 58, 559–562. [Google Scholar] [CrossRef] [PubMed]
  32. Spence, C.; Piqueras-Fiszman, B. Multisensory design: Weight and multisensory product perception. In Proceedings of RightWeight2; Hollington, G., Ed.; Materials KTN: London, UK, 2011; pp. 8–18. [Google Scholar]
  33. Barnett, A.; Spence, C.; Oxford University, Oxford, UK. When Changing the Label (of a Bottled Beer) Modifies the Taste. Unpublished work. 2016. [Google Scholar]
  34. Hekkert, P. Design aesthetics: Principles of pleasure in design. Psychol. Sci. 2006, 48, 157–172. [Google Scholar]
  35. Tu, Y.; Yang, Z.; Ma, C. Touching tastes: The haptic perception transfer of liquid food packaging materials. Food Qual. Preference 2015, 39, 124–130. [Google Scholar] [CrossRef]
  36. Tu, Y.J.; Yang, Z. Package colour and taste experiences: The influence of package colour on liquid food taste experiences. J. Mark. Sci. 2016, in press. [Google Scholar]
  37. Attwood, A.S.; Scott-Samuel, N.E.; Stothart, G.; Munafò, M.R. Glass shape influences consumption rate for alcoholic beverages. PLoS ONE 2012, 7, e43007. [Google Scholar] [CrossRef] [PubMed]
  38. Wansink, B.; van Ittersum, K. Bottoms up! The influence of elongation on pouring and consumption. J. Consum. Res. 2003, 30, 455–463. [Google Scholar] [CrossRef]
  39. Wansink, B.; van Ittersum, K. Shape of glass and amount of alcohol poured: Comparative study of the effect of practice and concentration. Br. Med. J. 2005, 331, 1512–1514. [Google Scholar] [CrossRef] [PubMed]
  40. Spence, C.; Wang, Q.J. Sonic expectations: On the sounds of opening and pouring. Flavour 2015, 4, 35. [Google Scholar] [CrossRef]
  41. Stummerer, S.; Hablesreiter, M. Food Design XL; Springer: New York, NY, USA, 2010. [Google Scholar]
  42. OI PELDAR|Escoge Vidrio. Available online: https://www.youtube.com/watch?v=pQAcY8oee5Y (accessed on 20 September 2016).
  43. Bland, A. Fed up with Too Much Packaging? Just Leave It on the Counter. Independent. 31 May 2008. Available online: http://www.independent.co.uk/environment/green-living/fed-up-with-too-much-packaging-just-leave-it-on-the-counter-837682.html (accessed on 21 September 2016).
  44. Brilhuis-Meijer, E.; Saxena, P. The sustainable future of packaging: A biodegradable paper beer bottle. In Proceedings of the DTU Sustain Conference, Lyngby, Denmark, 17 December 2015.
  45. Elzinga, K.G.; Tremblay, C.H.; Tremblay, V.J. Craft beer in the United States: History, numbers, and geography. J. Wine Econ. 2015, 10, 242–274. [Google Scholar] [CrossRef]
  46. Murray, D.W.; O’Neill, M.A. Beer choice and consumption determinants when craft beers are tasted: An exploratory study of consumer preferences. Br. Food J. 2012, 114, 899–909. [Google Scholar] [CrossRef]
  47. Nickels, W.G.; Jolson, M.A. Packaging—The fifth “p“ in the marketing mix? Adv. Manag. J. 1976, 41, 13–21. [Google Scholar]
  48. Scantrack, N.; Nielsen, Oxford, UK. Personal communication, 2016.
Figure 1. The bottle and can of beer used in the present study.
Beverages 02 00025 g001
Figure 2. Boxplots for the different ratings as a function of group. Boxplots visualize the distribution of the data based on the minimum value, first quartile, median, third quartile, and maximum value. The points that are shown individually are those which fall in the lower or upper percentiles. Boxplots allow one to get a better picture of the distribution of the data (Weissgerber, Milic, Winham, and Garovic, 2015 [20]).
Beverages 02 00025 g002
Table 1. Results of the pre-test.
GenderBeer Drinking FrequencyA Beer Tastes Better from?
BottleCanIt All Tastes the Same
FemaleNever114
Once a year2-3
Once a month6-2
Once a week711
Every few days11-
Every day---
MaleNever2 3
Once a year4--
Once a month513
Once a week42-
Every few days511
Every day1--
Total frequency38717
Total percentage61.29%11.29%27.42%
Table 2. Descriptive statistics for the demographic variables of the participants in the groups drink the beer that had been poured from the bottles and cans, respectively.
Demographic VariablesBottleCan
AgeMean33.2330.84
SD10.147.31
GenderFemale3036
Male3536
Do you know Barney’s BeerYes3329
No3243
Drinking frequencyMean5.795.97
SD1.631.57
Table 3. Mann-Whitney tests. Significant terms highlighted in bold.
VariableBottleCanMann-Whitney UpEffect Size (r)
MeanSDMeanSD
Taste7.031.096.621.291886.500.0390.176
Quality7.381.137.101.131938.000.0670.157
Freshness7.621.227.491.292223.000.6000.045
Purchase likelihood6.721.556.631.922285.500.8110.020
Price3.700.853.710.652338.500.6580.038

