Article

Evaluation of Soybean–Navy Bean Emulsions Using Different Processing Technologies †

United States Department of Agriculture, Agricultural Research Service, National Center for Agricultural Utilization Research, Functional Foods Research, Peoria, IL 61604, USA
*
Author to whom correspondence should be addressed.
Mention of trade names or commercial products in this article is solely for the purpose of providing scientific information and does not imply recommendation or endorsement by the U.S. Department of Agriculture. USDA is an equal opportunity provider and employer.
Beverages 2017, 3(2), 23; https://doi.org/10.3390/beverages3020023
Submission received: 2 March 2017 / Revised: 19 May 2017 / Accepted: 22 May 2017 / Published: 25 May 2017
(This article belongs to the Special Issue Beverage Emulsions)

Abstract

:
In this study, an innovative emulsion made from soybean and navy bean blends of different proportionalities was developed. In addition, two processing methods were used: traditional cooking and jet-cooking. The physical attributes and storage stability were measured and compared. This study found that the high content of starch and fiber in navy bean flour contributes to the increase in viscosity of the emulsions, at both room and refrigeration temperatures, as the proportion of navy bean flour in the blends increased. The steam jet-cooked emulsions with higher soybean content has better shelf life stability, smaller particle size, higher fat, lower starch, and lower viscosity, whereas the traditional kettle cooking method is better in reducing anti-nutritional components. No significant difference was found between the two cooking methods in terms of nutritional contents in the emulsions, such as protein, crude fat, and total starch. The traditional kettle cooking, with its longer cooking time, seems to reduce more trypsin inhibitor in the emulsions than those prepared with the steam jet-cooking. This exploratory study is the first to report soybean–navy bean beverage prototypes having desirable nutritional value and the potential for functional beverage market.

1. Introduction

Recently, more health-conscious consumers are actively searching for plant-based protein-rich beverages for weight management, cancer prevention, and cardiovascular health. A variety of soy, rice, and tree nut milk products have been brought into the market to meet this need. However, beverages based on pulses are not common in the marketplace despite the fact that pulses, such as soybean, are healthful. This is mainly due to the difficulty of producing shelf stable pulse milk products. Pulses such as navy bean are recognized as an excellent source of minerals, including calcium, iron, phosphorus, potassium, zinc; dietary fiber (15.3%); and twice the amount of protein (22.3%) than cereals [1]. In addition, pulses are known to have a large amount of vitamins as well as low Glycemic Indexes. Pulses in the diet significantly reduce cholesterol levels [2]. In general, the benefits of pulse fiber are frequently associated with the broader consensus of literature concerning dietary fiber benefits. Dietary fiber can provide protection from such common serious health concerns as heart disease, diabetes, obesity, colon cancer, and diverticulitis [3]. Evidence also suggests that the bioactive compounds in pulses help reduce the risk of certain cancers, diabetes, and heart diseases [4]. Until recently, a majority of pulses in the United States have been consumed in the form of cooked whole beans. Recent interest in dry beans and peas has ushered in pulse-based snack foods (baked chips) and various food dips and spread (hummus) products in several niche markets. Currently, there is unprecedented consumer demand for protein enriched drinks that utilize various plant and tree nut protein sources. Although there are many recipes using pulse, such as soups and dips, none of beverages contain pulse were scientifically studied and reported. However, conventional processing of pulses into a stable emulsion that can be commercialized as pulse or bean milk is difficult without introducing artificial emulsifiers and other ingredients that some consumers may find to be undesirable. This is mainly due to pulses’ comparatively low protein and oil contents along with high starch contents relative to soybean and many popular tree nuts. In order to overcome the shortcoming of pulses in beverage production while maintaining a “clean label” claim, we are investigating the blending of navy bean and soybean flours as the basic starting feedstock for beverage production. In this study, we tested the feasibility of blending navy bean and soybean flours in different proportions to prepare milk substitutes; and report the physical properties and nutritional and anti-nutritional attributes of these emulsions that were prepared under different processing conditions through traditional kettle cooking and steam jet-cooking.

2. Materials and Methods

2.1. Preparation of Starting Material

Soybeans were purchased from the Laura Soybean Company (Corwith, IA, USA). Navy beans were obtained from Archer Daniels Midland (Chicago, IL, USA). All samples were hand sorted to remove any discolored or broken beans and any debris. Beans were rinsed and then soaked in deionized water for 18 h at 25 °C. After soaking, beans were drained, rinsed, and dried in a 50 °C forced air oven overnight. Beans were stored at −20 °C until further use.

2.2. Emulsion Formulation and Cooking Methods

Bean flour was freshly milled from the pre-soaked and dried starting materials. Beans were ground to a particle size of 0.12 mm and 0.5 mm or below for navy bean and soybean, respectively, using a Retsch ZM200 ultra centrifugal mill (Retsch, Haan, Germany) equipped with a 12 toothed rotor and the appropriate sieve at 10,000 RPM. The flours were then mixed to form blends with weight ratios of 100:0, 80:20, 60:40, 40:60, 20:80, or 0:100 soybean flour to navy bean flour. Portions of the raw flour blends were withheld for analyses.
The effectiveness of traditional boiling and steam jet-cooking methods were compared. For the traditional cooking method, flour blends were combined with water to form slurry with 5% solids by weight. The bean slurries were then cooked in a 97 °C shaking water bath for 30 min at a shaker speed of 40 RPM. Additionally, the samples were manually stirred during the cooking process to prevent sedimentation.
Jet-cooked materials were prepared by combining flour blends and water to form a slurry with 5% solids by weight slurry. Slurries were then introduced to the jet cooker operated under excess steam conditions with a hydroheater temperature of 140 °C, steam back pressure of 276 kPa, steam line pressure from the steam boiler of 448 kPa, and a sample pumping rate of 1 L/min [5]. Samples were collected in a tared Waring blender (Waring, Torrington, CT, USA) to determine the weight of cooked material collected. The average weight for all samples was 2000 g.
For both cooking methods, immediately after the sample had been cooked, it was transferred to a large beaker, tightly covered, and rapidly cooled in an ice bath until it reached 25 °C. Excess particulate material was removed by passing the cooked samples through a 100 mesh sieve lined with 100% cotton, 2 ply, 50 grade cheesecloth. Samples were strained until no more liquid could manually be removed and the particulate material was discarded. A small portion of strained sample was collected to determine solids percentage.
For the storage stability studies, viscosity, and particle size measurements, the strained sample was kept in liquid form. Sodium azide (0.04% by weight) was added to samples used for the storage portion of the study to inhibit bacterial growth. The remaining sample volume was freeze-dried and the solid materials were stored at −20 °C until further use.

2.3. Evaluation of Physical Properties

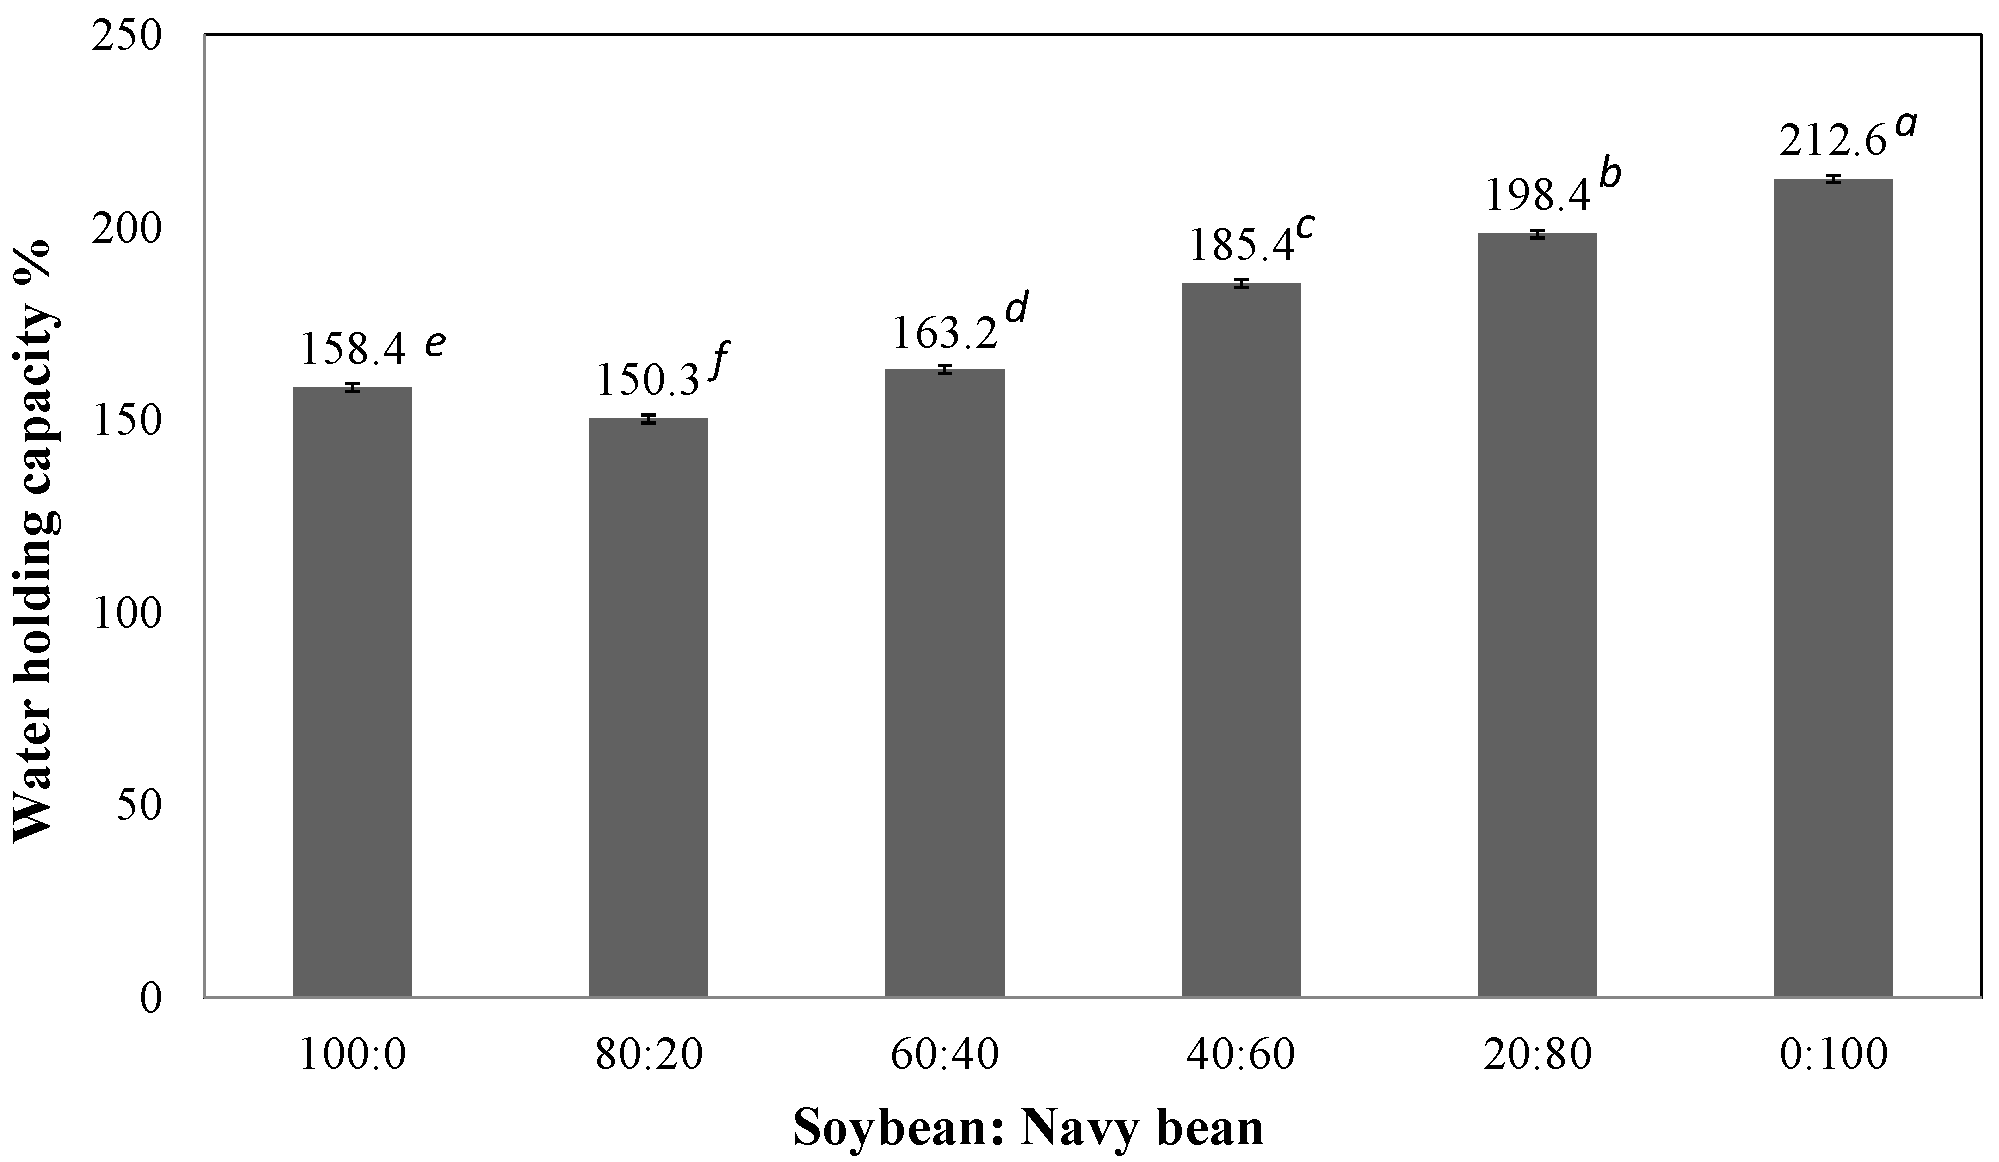
2.3.1. Water Holding Capacity

The water holding capacity (WHC) of raw soybean–navy bean blends was determined according to a previous procedure with minor modifications [6]. Each sample (2 g, dry weight) was mixed with 25 g of distilled water and vigorously mixed for 1 min to a homogenous suspension using a Vortex stirrer, held for 2 h, and centrifuged at 1590× g for 10 min. Each treatment was replicated twice. Water capacity was calculated by the difference between the weight of water added and decanted on dry basis (g of water absorbed/100 g of dry sample).

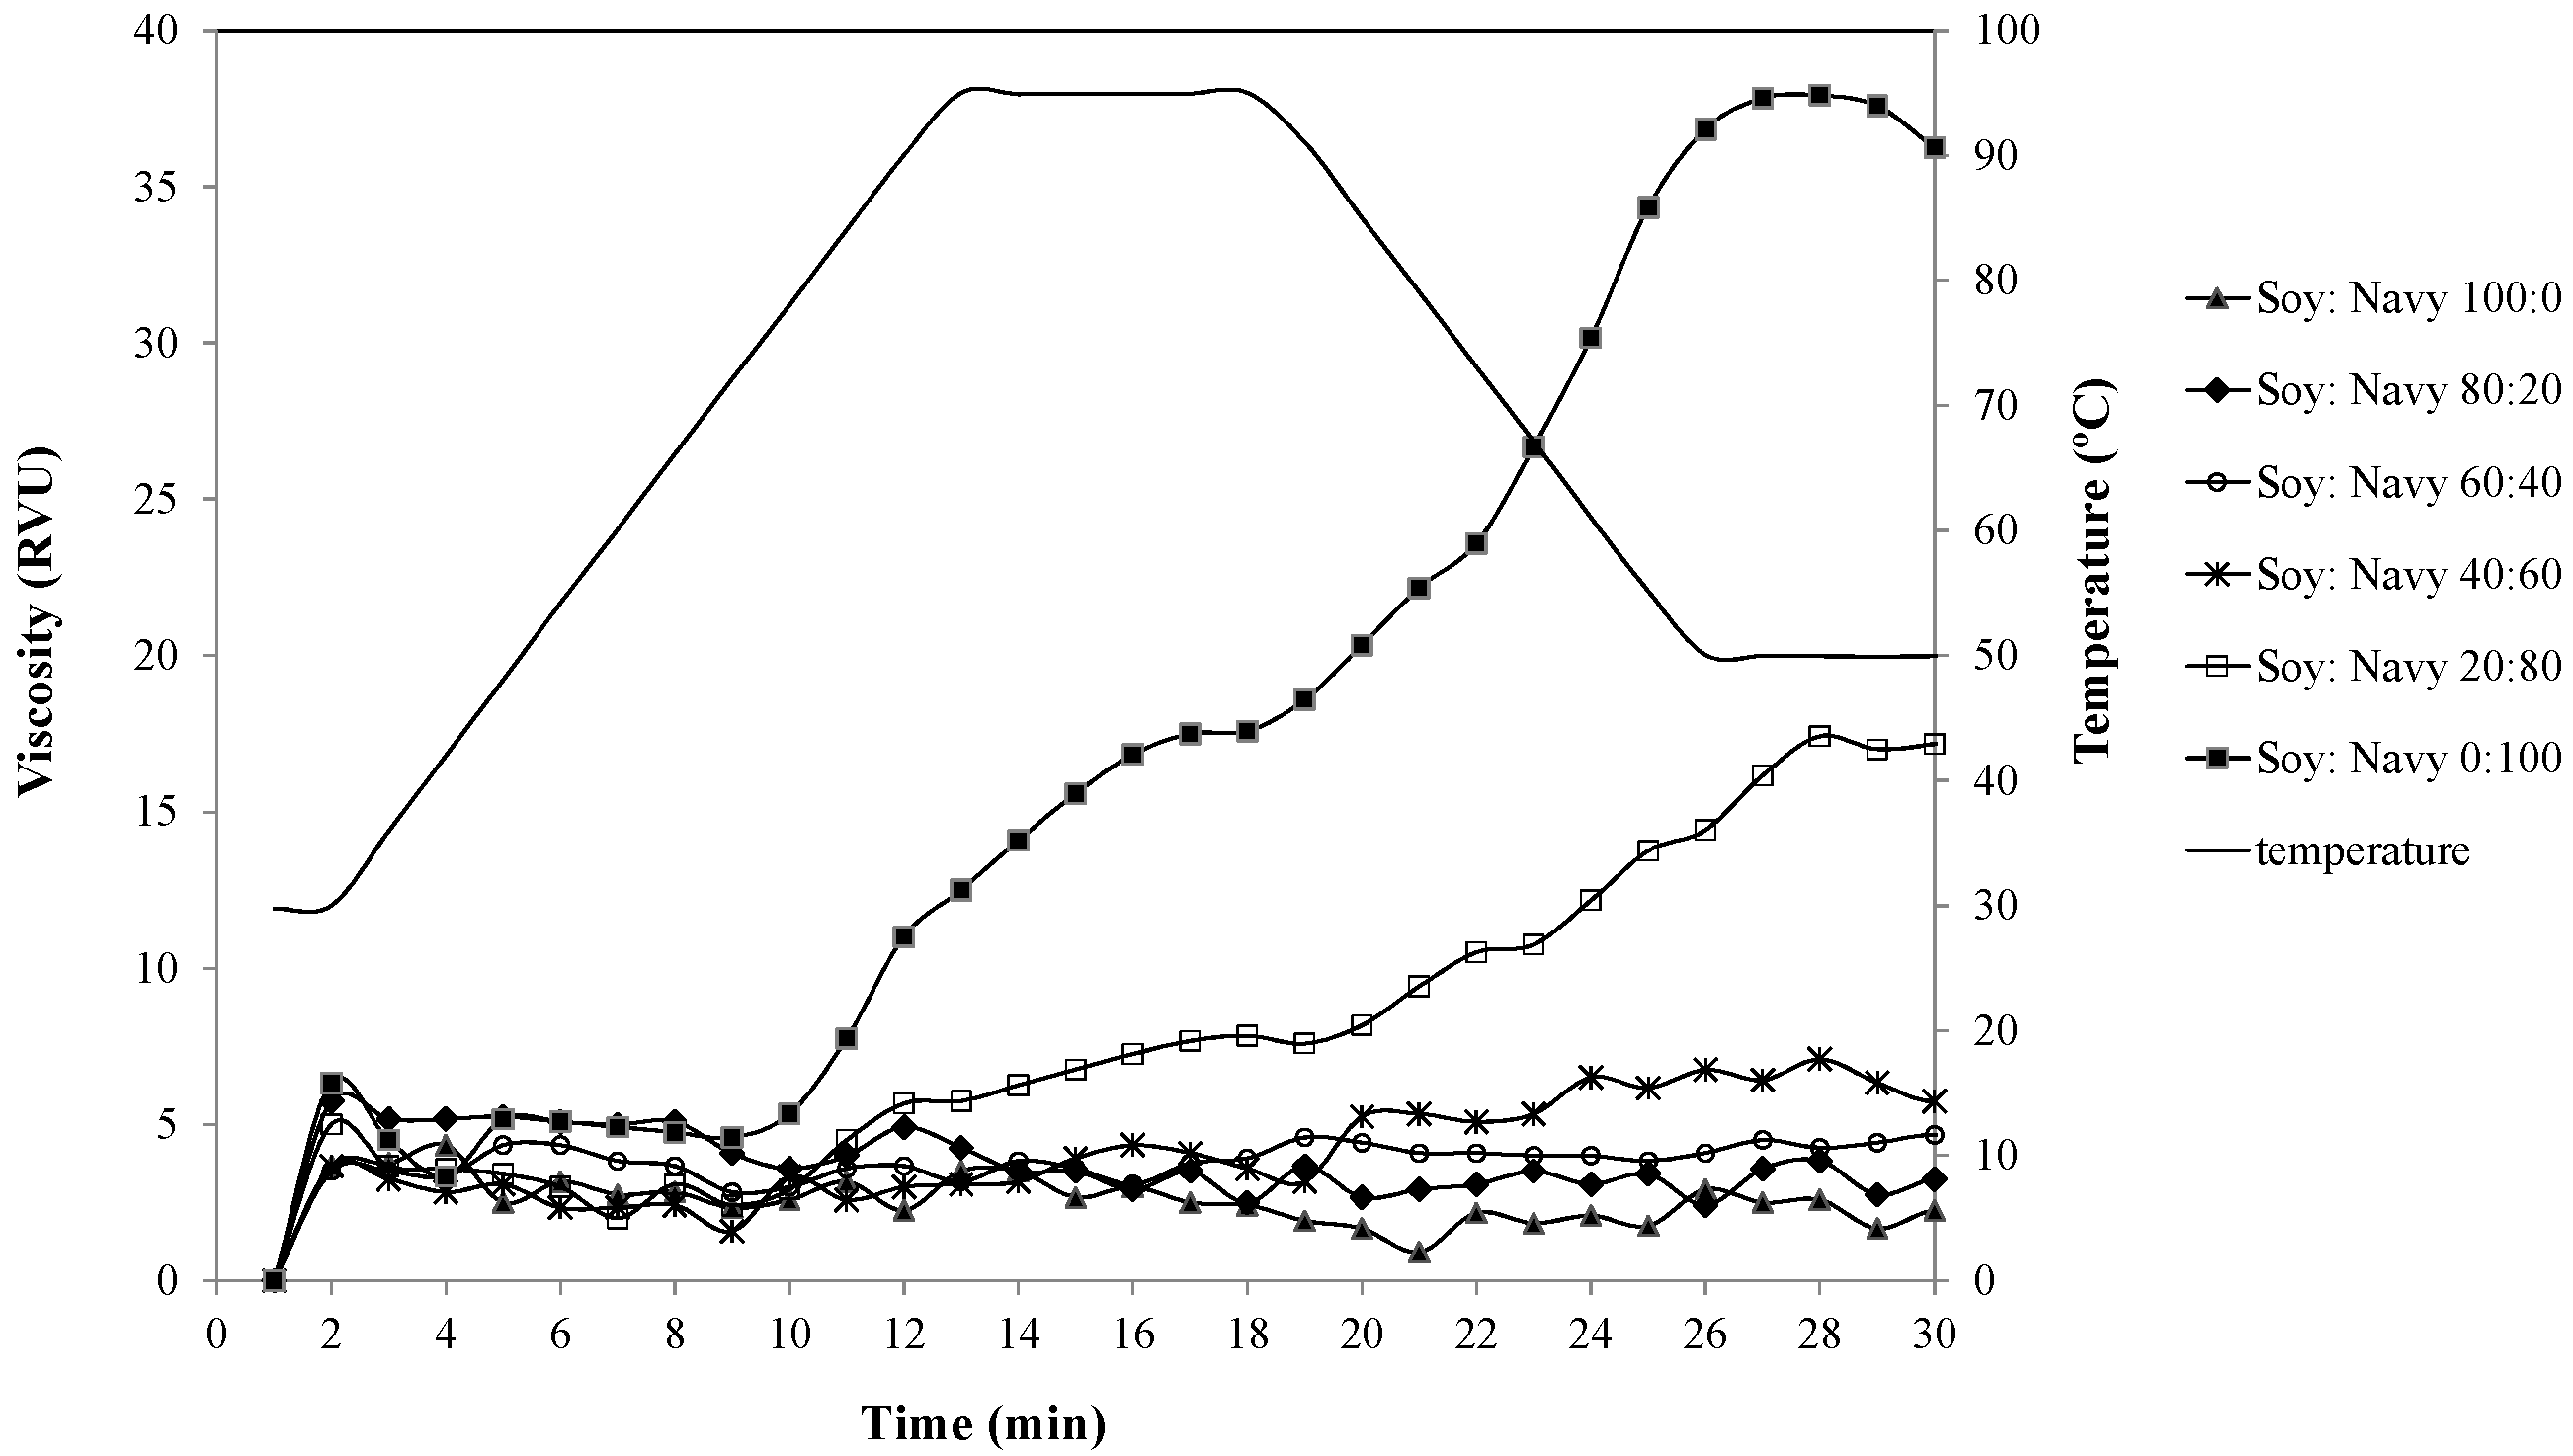
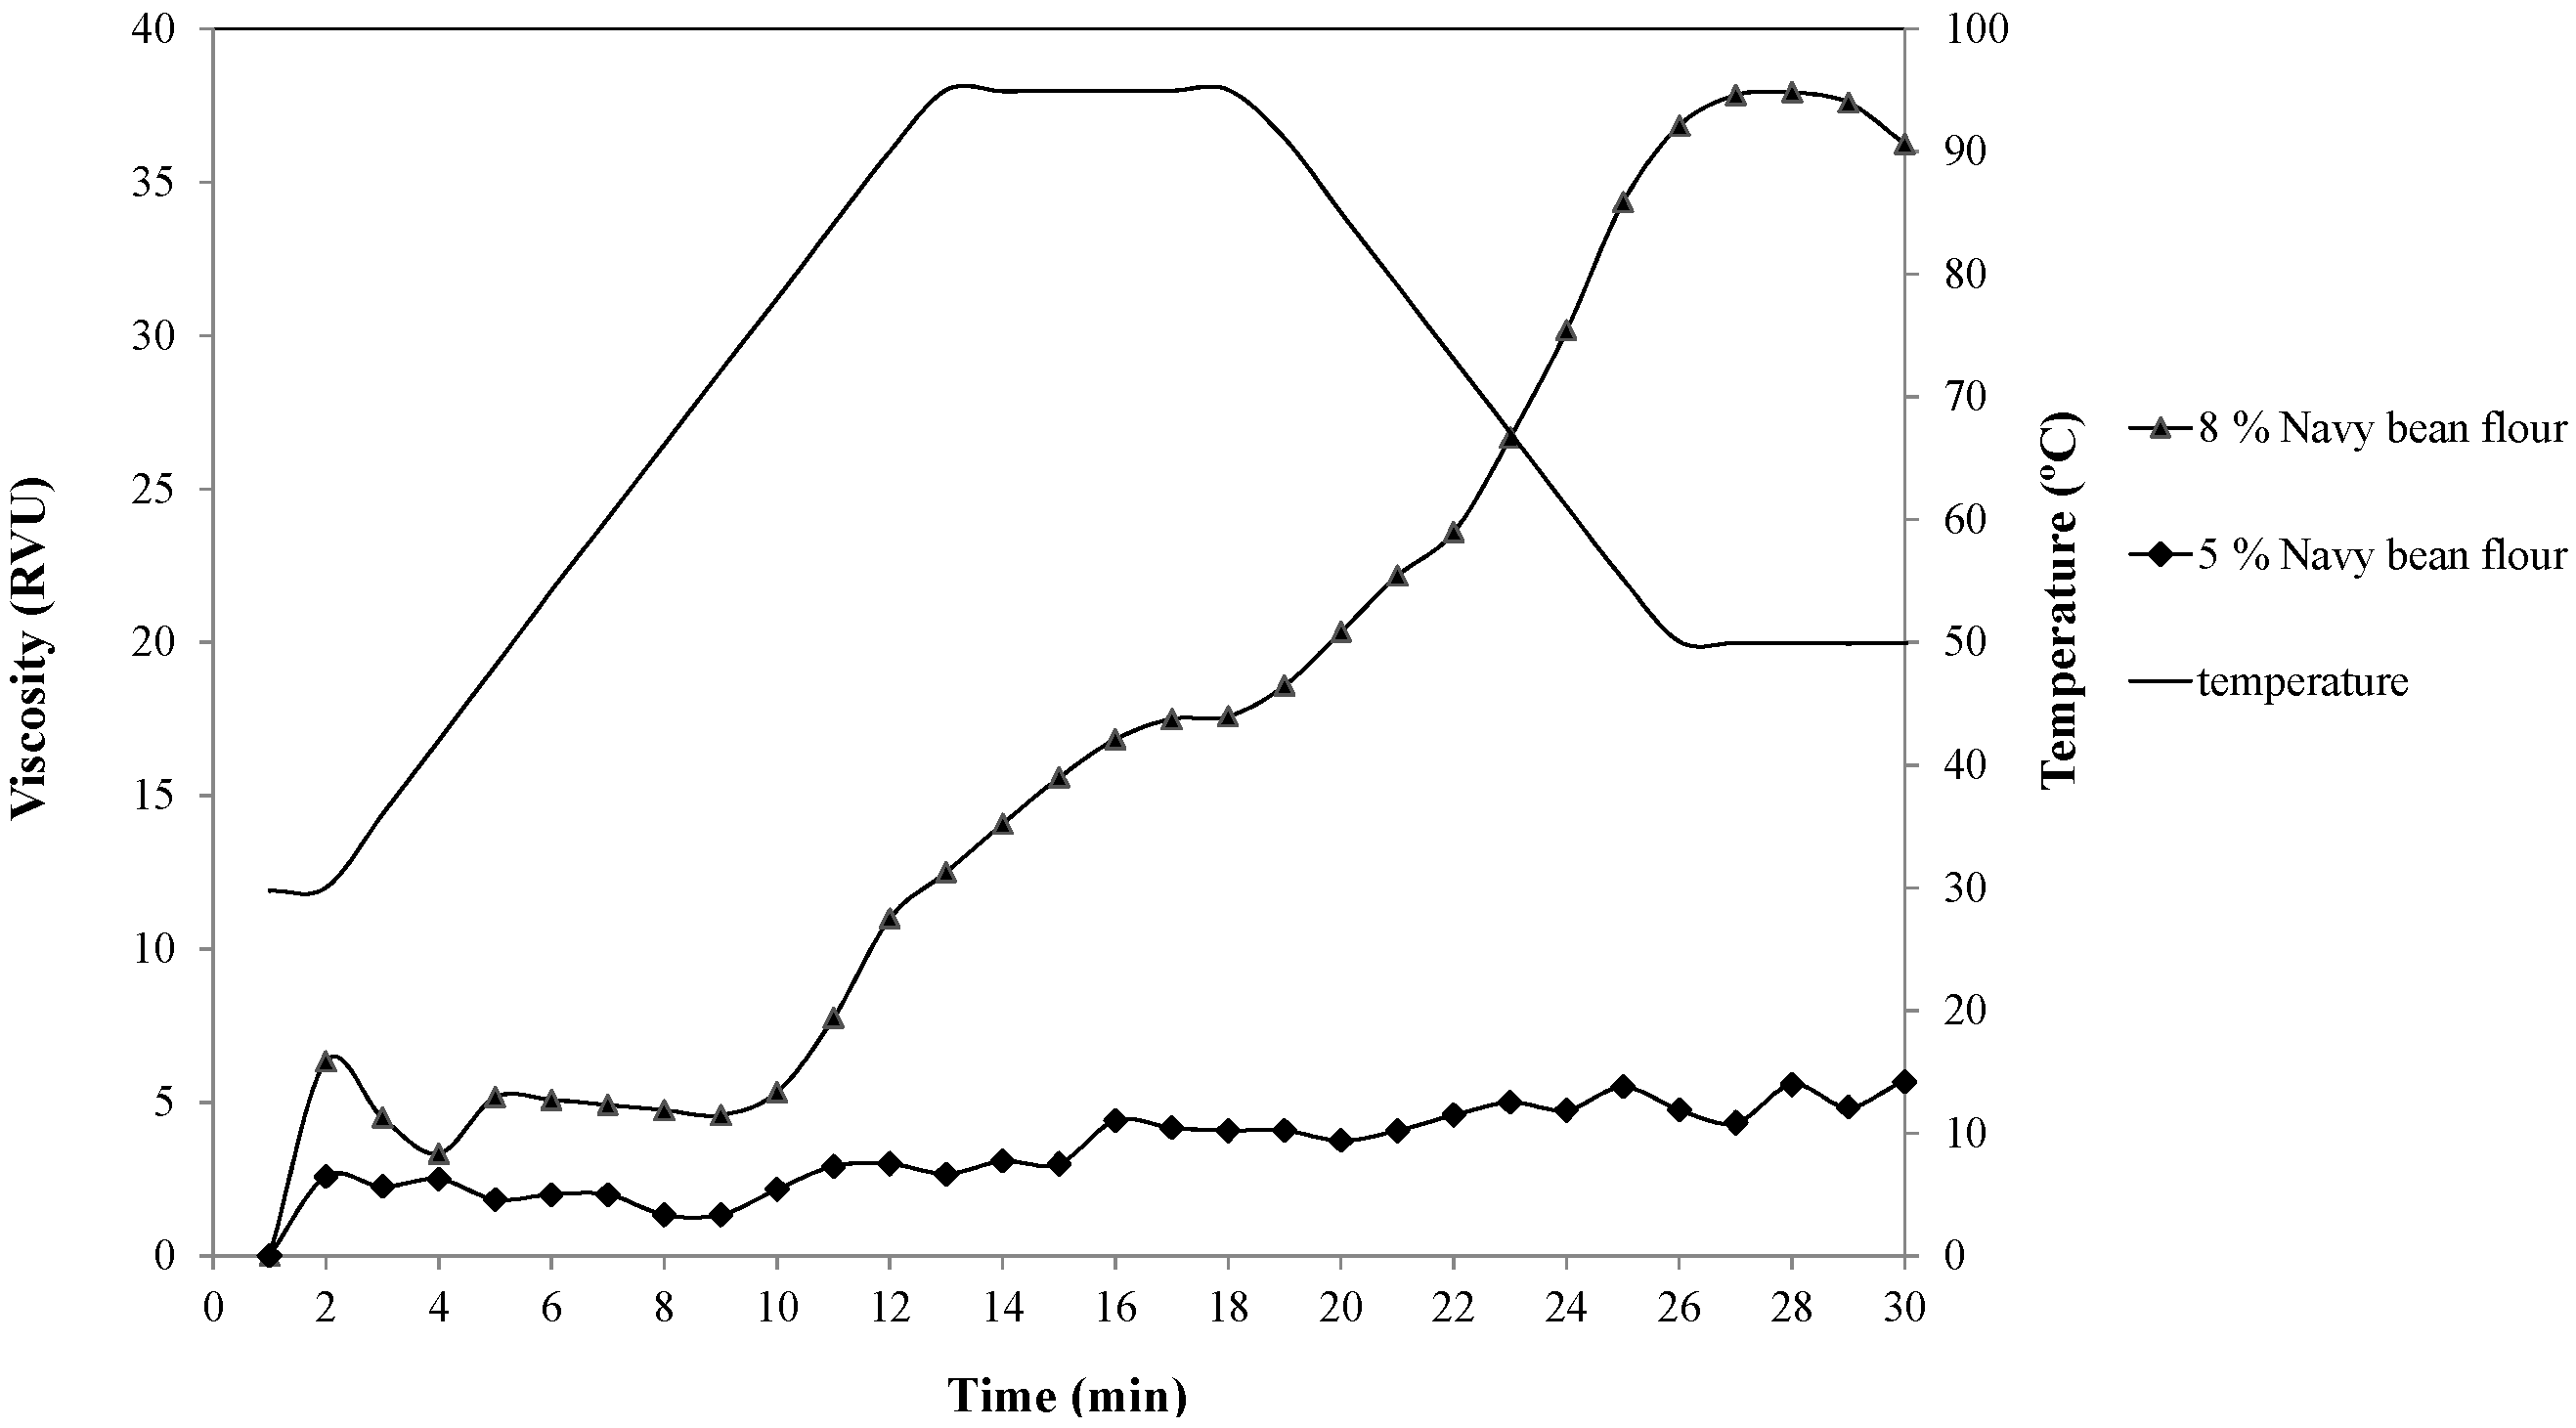
2.3.2. Pasting Property Measurement

The pasting properties of raw soybean-navy bean blends were evaluated using a Rapid Visco Analyzer (RVA-4, Perten Scientific, Springfield, IL, USA). Each sample (2.24 g d.b.) was made up to a total weight of 28 g with distilled water in a RVA canister (80 g kg−1 solids, w/w). The viscosity of the suspensions was monitored during the following heating and cooling stages. Suspensions were equilibrated at 50 °C for 1 min, heated to 95 °C at a rate of 6.0 °C/min, maintained at 95 °C for 5 min, and cooled to 50 °C at rate of 6.0 °C/min, and held at 50 °C for 2 min. For all test measurements, a constant paddle rotating speed (160 rpm) was maintained throughout the entire analysis except for 920 rpm in the first 10 s to disperse sample. Each sample was analyzed in duplicate. The results were expressed in Rapid Visco Analyser units (RVU, 1 RVU = 12 centipoises).

2.3.3. Percentage of Solids in Emulsion

Solids percentage for each sample was evaluated using a Mettler Toledo HR83 Halogen Moisture Analyzer (Mettler Toledo, Columbus, OH, USA). Between 1.5–2 g of sample were evenly distributed onto a pre-dried fiberglass pad and topped with another similar pad. Samples were then heated at 120 °C for 15 min, after which the final weight of the sample was recorded and converted to a percentage of solids in the sample.

2.3.4. Viscosity

Sample viscosity was measured using a Brookfield DV-E viscometer (Brookfield Engineering Laboratories, Inc, Middleboro, MA, USA). Viscosity data were collected the same day as the samples were prepared and equilibrated to either 25 °C or 4 °C. A low viscosity spindle (spindle # 61) was used for all samples (60 rpm, shear rate 13.2 s−1). The sample viscosity was recorded when the displayed viscosity remained constant for 5 s. Resulting viscosities at the aforementioned temperatures were reported in mPa∙s.

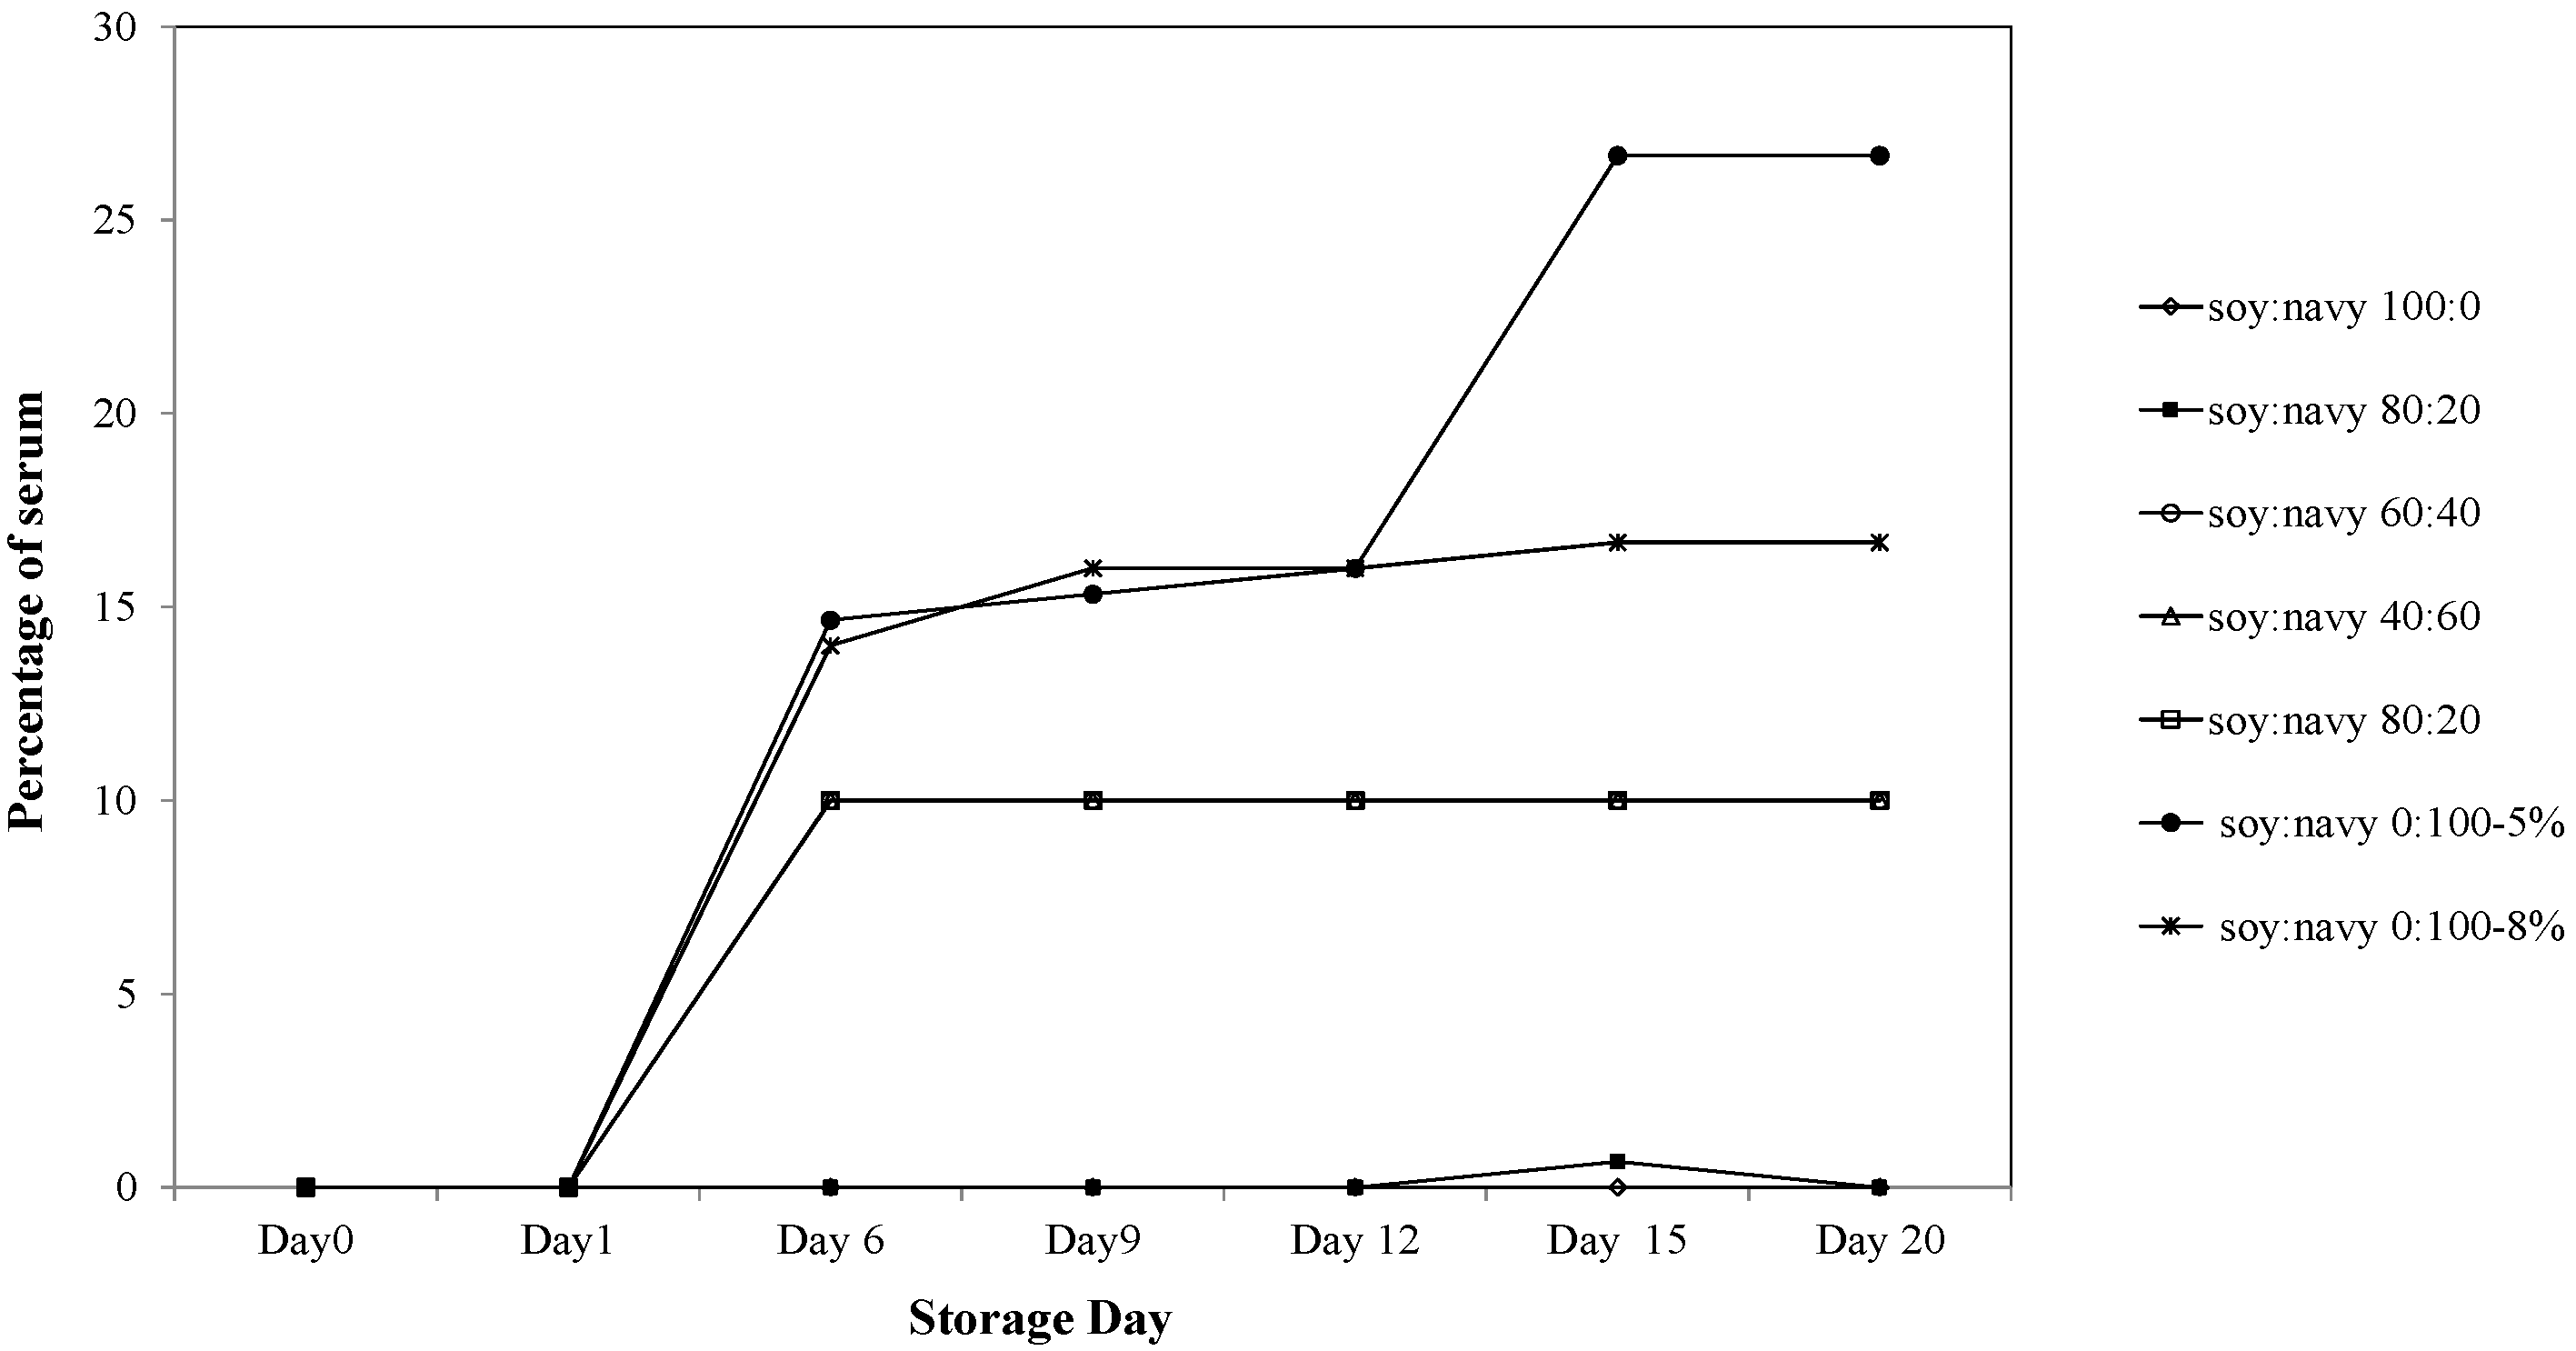
2.3.5. Storage Stability

After RVA test, 15 mL of RVA samples after test were poured into 15 mL polypropylene tubes, and stored in refrigerator at 4 °C. The separations were documented periodically for storage stability evaluation. Furthermore, 10 mL of each emulsion sample after cooking was dispensed into 15 mL polypropylene graduated centrifuge tubes. Samples were stored under an inert nitrogen atmosphere. The samples were then placed in the dark and stored at either 25 °C or 4 °C for the emulsion stability study (10 days at 25 °C or 21 days at 4 °C). Samples were periodically examined, and any separations were recorded.

2.3.6. Particle Size

Particle size distributions were measured using a Horiba LB-550 dynamic light scattering instrument (Horiba Scientific, Kyoto, Japan). The dispersant (water) refractive index was set at 1.333 and was temperature corrected for each sample via a temperature sensor that was placed in the sample during the measurement. Due to the variety of sample compositions, cooking methods, and storage temperatures used, the refractive index for each possible combination of variables was determined using an ATAGO Abbe Benchtop Refractometer (Thermo Fisher Scientific, Waltham, MA, USA). These refractive indices were then used with the corresponding sample to obtain its particle size distribution. Particle sizes were reported as both the volume averages and number averaged mean diameters.

2.4. Evaluation of Nutritional and Anti-nutritional Components

2.4.1. Total Starch

Total starch analysis was determined on freeze-dried samples in accordance with AACC Method 76-13.01 [7] using a total starch kit from Megazyme (Wicklow, Ireland). Results were reported on a dry solids basis.

2.4.2. Protein Analysis

Protein analysis was performed on freeze-dried samples using a Leco CHN 628 carbon/hydrogen/nitrogen analyzer (Leco, St. Joseph, MI, USA). Nitrogen values obtained from analysis were converted to protein values using a conversion factor of 6.25. Results were reported on a dry solids basis.

2.4.3. Fat Content

Oils from ground soybean and navy bean samples were extracted with a Foss 2050 Soxtec Automatic Fat Extractor (Foss North America, Eden Prairie, MN USA). Varying sample weights (0.51 to 1.54 g) were placed in two layers of 12.5 cm circular #4 Whatman filter paper in a cellulose thimble (80 × 33 mm). Each sample was extracted in an aluminum cup with 60 mL of hexane. Conditions of the extractor were: hotplate temperature = 155 °C; boiling step = 20 min; rinsing = 40 min; recovery = 10 min; and pre-drying = 2 min. Oils were transferred to a glass vial and the hexane was evaporated with nitrogen gas. The final weight of the oil was obtained in grams. Fat yields in percentages were calculated by dividing the extracted oil weight by the starting dry weight.

2.4.4. Dietary Fiber

Dietary fiber analysis was performed on the freeze-dried, defatted samples. The total dietary fiber, soluble fiber, and insoluble fiber values were obtained using the Megazyme total dietary fiber analysis kit (Megazyme International Ireland Ltd, Wicklow, Ireland). The procedure described in the Megazyme kit is based on a modified version of AACC total dietary fiber method 32-05.01 and AACC soluble/insoluble dietary method 32-21.01 [8,9]. Protein values for each dietary fiber sample were determined in triplicate with 2–4 mg of sample using a Perkin Elmer 2400 Series II CHNS/O Analyzer (Perkin Elmer, Waltham, MA, USA). Results were reported on a dry solids basis.

2.4.5. Soluble Sugars

Soluble sugar analysis was performed on freeze-dried, defatted samples. The initial soluble sugar extraction is based on a method described by Giannoccaro et al. (2006) [10]. Soluble sugars were extracted in triplicate by adding 1.5 mL of high purity water to 100 mg of sample and vigorously mixing for 12 min, after which the samples were centrifuged at 1300× g for 12 min. A 10-μL aliquot was taken from the supernatant and diluted with 990 μL high purity water in a glass vial and stored at 4 °C until analysis could be performed. Analyses were conducted using a Dionex ICS 5000 HPAEC-PAD system (Thermo Fisher Scientific, Sunnyvale, CA, USA) utilizing a Dionex CarboPac PA-10 (2 mm × 250 mm) column [11]. A flow rate of 0.250 mL /min, an isocratic mobile phase of 90 mM sodium hydroxide ran for 30 min [12], and an injection volume of 5 μL of sample was used. Analytes of interest (glucose, fructose, sucrose, raffinose, stachyose, and verbascose) were quantified using a four point standard curve.

2.4.6. Trypsin Inhibitor

Freeze dried samples were prepared for analysis by first defatting the sample. Due to the heat sensitive nature of trypsin inhibitor, samples were defatted using hexane at room temperature as described by Pareyt et al. (2008) [13]. Trypsin inhibitor analysis of the defatted sample was then carried out as described in the AACC Method 22-40 [14]. Final trypsin inhibitor values were reported as mg trypsin inhibitor/g of dry, defatted sample via a conversion described by Hammerstrand et al. (1981) [15].

2.4.7. Phytohemagglutinin (PHA) Activity

Freeze-dried starting material for the PHA assay was defatted in a similar fashion as the material for the trypsin inhibitor analysis due to the heat sensitivity of the PHA proteins. PHA was extracted from the samples by adding 1 mL of PBS (10 mM phosphate buffer solution, pH 7.2, containing 150 mM NaCl) to 0.05 g of defatted sample and stirring (150 rpm) at room temperature overnight using a magnetic stirrer. Samples were then centrifuged (10,000× g for 35 min) and the supernatant was collected. The remaining pellet was extracted again twice (0.5 mL PBS) by stirring (150 rpm) for 2 h at room temperature and centrifuging. The collected supernatants were combined for each sample and stored at 4 °C. PHA activity was measured using a competitive indirect enzyme-linked immunosorbent assay (ELISA) procedure [16]. Microtiter plates were coated overnight at 4 °C with 0.1 mL of porcine thyroglobulin (8 ng/μL in 50 mM carbonate-bicarbonate buffer, pH 9.8). Plates were washed twice with PBT (10 mM phosphate buffer, pH 7.2, containing 0.05% Tween 20) and once with PBS. Any remaining unreacted sites were then blocked by adding 0.1 mL PBS supplemented with 0.5% bovine serum albumin (BSA) and incubating for 1 h at 37 °C. Wells were then washed as described previously and loaded in triplicate with 0.1 mL of PHA working standards (a 2 mg/mL PHA standard stock solution diluted to 0.1, 0.2, 0.5, 0.8,1, and 1.5 ng/μL with PBS) and 0.1 mL sample extracts diluted 1:50 in PBS. After an incubation of 1 h at 37 °C, plates were washed as described above and were loaded with 0.1 mL rabbit anti-PHA IgG (Vector Labs, Burlingame, CA, USA) diluted 1:5000 in PBS containing 0.25% BSA and incubated for 1 h at 37 °C. Wells were washed and 0.1 mL alkaline phosphatase-conjugate monoclonal antirabbit IgG in PBS containing 0.25% BSA was added. Plates were incubated again for 1 h at 37 °C. Plates were then washed twice with PBT and twice with PBS and 0.1 mL of a color development solution (SIGMAFAST p-nitrophenyl phosphate) was added to each well. After 1 h incubation at 37 °C, 50 μL of 3 M sodium hydroxide was added to stop the reaction. Absorbance measurements were recorded at 405 nm using a Spectra Max M2 plate reader (Molecular Devices, Sunnyvale, CA, USA) and PHA values were reported in μg PHA/g dry, defatted starting material.

2.5. Statistical Analysis

The data were compared by Duncan’s Multiple Range Test at significance levels at p < 0.05. The statistical analysis of data was carried out using PROC GLM in SAS Version 9.2 (SAS Institute, Cary, NC, USA).

3. Results and Discussion

3.1. Nutritional and Anti-Nutritional Components after Cooking

3.1.1. Protein, Crude Fat, Total Starch, and Dietary Fiber of Emulsions Made by Different Processing Methods

The protein, total starch, crude fat, and total dietary fiber (soluble and insoluble fibers) of the emulsions prepared from soybean–navy bean flour blends are presented in Table 1. The protein content did not vary significantly for emulsion samples prepared by either traditional cooking or jet-cooking. This is in contrast to the findings of Johnson and coworkers that showed the supernatant obtained from jet-cooked soybean flour contained high percentages of protein [17]. The different amount of protein found in their study relative to this study may be due to the differences in jet-cooking procedures and in the isolation of the soymilk; in their case, the soymilk was the supernatant from a centrifuged cooked soybean slurry instead of filtering the slurry through a mesh by the procedure in this study. As expected, the protein and fat content increased almost linearly as the soybean flour fraction increased, while total starch increased almost linearly as the navy bean flour fraction increased. The crude fat and total starch contents in jet-cooked emulsions were slightly lower than those of emulsions cooked by traditional kettle cooking. This difference is likely due to the addition of condensed steam that is added to the jet-cooked samples that occurs during jet-cooking [18,19]. There is scant evidence to suggest that there is a noticeable difference in soluble fiber or total fiber of the emulsions treated with different cooking methods as shown in Table 1. As the soybean portion in the treated emulsions increases, the total fiber in the emulsions decreases slightly.

3.1.2. Soluble Sugars

The soluble sugar data are shown in Table 2. Raffinose and stachyose are two water soluble oligosaccharides that are very important to the development of soy-pulse food products as they are associated with flatulence and abdominal discomfort when people consume foods containing these types of oligosaccharides. In fact, other than beany flavor, flatulence is the most significant barrier to the greater consumption of pulses and, by extension, all legumes. Table 2 clearly shows that the cooking in general will slightly increase the concentrations of raffinose and stachyose. It is quite possible that heating and shear during the cooking breaks down the bonded carbohydrates, solubilized these oligosaccharides, and concentrated them in the supernatant phase. It is also noticeable that both concentrations of glucose and fructose in jet-cooked emulsions are lower than those of raw flour blends and emulsions made from traditional kettle cooking of soybean–navy bean blends.

3.1.3. Trypsin Inhibitor

Heating is known to denature trypsin inhibitors in soybean and other legumes to make the proteins more nutritionally available [20]; it is no surprise to see either traditional or steam jet-cooking reduce trypsin inhibitor activity. Table 3 shows that the amounts of trypsin inhibitors in emulsions of processed soybean-navy bean blends are reduced compared to the starting raw flour blends. Considering the fact that the emulsions obtained from the cooking only represent the fractions that were collected (mostly water soluble or stable colloidal dispersions), the reductions in trypsin inhibitors by both processing methods are more remarkable as most trypsin inhibitors are water soluble. The traditional kettle cooking did better in this regard probably because it had longer cooking time. It appears that other than 100% navy bean flour blend, the amount of navy bean in the blends had no noticeable impact on the trypsin inhibitors in the emulsions obtained by either of the cooking methods.

3.1.4. Phytohemagglutinin (PHA) Activity

PHA, which exists in many grains and legumes, is toxic because it negatively affects the enzymatic activities in the human intestines resulting in decreased nutrient digestion and absorption [21]. Raw or insufficiently cooked beans such as kidney beans are known to cause food poisoning with symptoms such as nausea, vomiting, diarrhea, and abdominal pain [22]. The extensive heat treatment and pre-cooking soaking are often required to inactivate the PHA. The data in Table 3 show the PHA values for emulsions made from different soybean-navy bean flour blends. As in the case of the data for trypsin inhibitors, the values for all emulsions are for those emulsions that were filtered through the 100 mesh filters and they may not be comparable with the blends of raw flours. There seems to be slightly lower PHA values for traditionally kettle cooked emulsions with low navy bean portions (40% or less). At the higher navy bean concentrations, the difference between two cooking methods is statistically insignificant.

3.2. Physical Properties

3.2.1. Water Holding Capacity

Water holding capacity is related to many properties of an emulsion, such as viscosities and stabilities. Navy bean flour (100%) had the highest water holding capacity (212.6 g/100 g) while soybean–navy bean 80:20 had the lowest water holding capacity (150.3 g/100 g) among all the blends (Figure 1). Water holding capacities increased with increasing amounts of navy bean flour in soybean–navy bean blends. Soybean contains much lower carbohydrate (30.16 g/100 g) and dietary fiber (9.3 g/100 g) than navy bean (60.75 g/100 g, 30.16 g/100 g) [1]. It suggests that WHC may be influenced by fiber content. The water may reside inside fiber pores or bound to cellulose fibrils through hydrogen bonding. The high WHC may be attributed to the loose fibril arrangement, more branched structure, the larger pore size, and the higher surface area per unit mass or the higher hydrophilic nature [23].

3.2.2. RVA Pasting Properties

Rapid Visco-Analyser pasting data disclosed the changes of sample viscosities during heating and cooling. It will provide useful information for processing. The pasting curves of all soybean and navy bean blends are displayed in Figure 2. In general, the viscosity of soybean–navy bean blends increased as the amount of navy bean flour in the blends increased. The viscosity for 100% soybean remained essentially unchanged during heating and shearing, exhibited a flat pasting curve, and had the lowest setback viscosity (~2 RVU) among samples examined. In contrast, the viscosity of 100% navy bean flour sample increased gradually (~1 RVU/min) during heating and shearing, and showed the highest final viscosity (~36 RVU) at 50 °C. This increased viscosity could be due to interaction of swollen starch granules and association of leached molecules during cooling to form a stable matrix with greater stability under heating and shearing. Overall, viscosities for all blends containing navy bean flour were found to be greater than that of soybean flour and can likely be attributed to the higher carbohydrate (60.75%) and fiber (15.3%) content of navy beans [1]. Higher peak viscosity observed during the heating phase was related to starch granule swelling and gelatinization as temperatures increased from 75 °C to 95 °C. The trend of final peaks from blends appeared to be related to their water holding capacities. In addition, the pasting curve for 5% navy bean flour was noticeably lower than 8% navy bean (Figure 3). It suggested that the beverage viscosity will increase as solids increases in production. The RVA data were useful since it could provide information for food processing. RVA and composition data showed navy bean flour improved viscosities as well as nutritional values.

3.2.3. Percentage Solids in Emulsions

As shown in Table 4, the navy bean milk emulsions, regardless of the preparation method, had slightly higher solids content than the corresponding soybean emulsions. As described by data in Table 4, the percentage of solids from blends decreased slightly as the content of soybean flour increased in the blends. Comparison of the solid contents for the various blends obtained by the two different preparation methods showed that these methods produced milk emulsions having comparable solid contents. It was observed that some sample dilution occurred in the steam jet-cooking process, as seen in the percentage solids data for samples containing 100%, 80%, and 60% soybean. This is due to the condensation of steam. It is also important, however, to address a processing advantage to the use of steam jet-cooking over traditional kettle cooking. The traditional kettle cooking method represents a batch process that in our study was accomplished over 30 min cooking times, whereas steam jet-cooking can be performed in a continuous manner in a fraction of the time needed by the traditional cooking method. It suggests excess steam jet-cooking may be an efficient and quick method to prepare these emulsions.

3.2.4. Emulsion Viscosity

The viscosities were measured at 4 °C (refrigeration temperature) and 25 °C (room temperature) and compiled in Table 5. The data clearly show that, as the navy bean flour component of the blend increases, the viscosity of the resulting emulsion of the blend also increases regardless of the processing method utilized. Since soybean flour contains only minor amount of starch, the observed viscosity increase is likely a result of the increasing amount of starch and fibers present in the blend as the proportion of navy bean flour increases within the blend. Byars and Singh have reported the pasting properties of navy bean starch showing the pasting temperature to occur at approximately 78 °C [24]. During either the traditional or steam jet-cooking procedures used to prepare the emulsions, the cooking temperature exceeded the pasting temperature of the navy bean starch granules and the resulting gelatinization released amylose and amylopectin polymers into the surrounding aqueous phase of the emulsion and resulted in the increased viscosity. As expected, the viscosities observed at the higher temperature (25 °C) are lower than those at 4 °C probably due to the lower molecular mobility. The steam jet-cooked emulsions prepared from the blends containing larger proportions of soybean flour (80% or higher) have similar viscosities with those emulsions cooked by the traditional kettle cooking method. The steam jet-cooked emulsions prepared from the blends containing lower proportions of soybean flour (less than 80%) generally have lower observed viscosities than those prepared by the traditional kettle cooking method at both 4 °C and 25 °C. This is possibly due to the fact that the traditional kettle cooked emulsions could contain protein aggregates that cause higher viscosity and higher sedimentation formed among soybean globulin proteins due to extensive heating times. Prolonged heating generally causes the proteins to unfold and expose the hydrophobic interior for hydrophobic interactions, thus causing flocculation of the proteins. Although the steam jet-cooking used in this study may also cause proteins to aggregate, it may occur to a lesser extent since the material is exposed to much shorter heating times as it passes through the jet cooker.
In addition, if we look at the storage study data in the next section, we will see the emulsions made by steam jet-cooking are far more stable with less sediment and serum.

3.2.5. Storage Stability

Total sedimentation and serum volume percentages of samples stored up to 21 days were used to measure emulsion stability. As shown in Table 6 and Table 7, the sedimentation volume percentage increased from 5–60% and 5–65%, at 4 °C and 25 °C, respectively, in the emulsions prepared by a traditional cooking process as the proportion of navy bean flour increased in the blend. Separation of a serum phase from the emulsions prepared from blends that contained less than 80% of navy bean flour was not observed at both 4 °C and 25 °C over the storage period (Table 8 and Table 9). However, for blends that contained >80% navy bean flour content, serum separation was visible after Day 10 and Day 7 at 4 °C and 25 °C, respectively. At Day 10, emulsions prepared from 80% and 100% navy bean flour that were stored at 4 °C showed a serum phase corresponding to approximately 5% and 9%, of the sample volume, respectively. By Day 21, percentage of serum had increased to 18% and 40%, respectively. Samples stored at 25 °C showed that the emulsions prepared using >80% navy bean flour also separated over time. By Day 7, the percentage of serum separated from the sample volume was 5% and 10% for the emulsions containing 80% and 100% navy bean flour, respectively, and was essentially unchanged by Day 10. The storage stability tests stopped at Day 10 at 25 °C as the emulsion stability of the samples had clearly deteriorated in terms of sedimentation and serum phase separation.
In remarkable contrast, the stabilities of the emulsions prepared by jet-cooking (Table 6, Table 7, Table 8 and Table 9) were significantly improved over the traditionally cooked samples at both storage temperatures (4 °C and 25 °C). For all blends examined, their corresponding emulsions showed less than 10% total phase separation (sedimentation + serum) over the storage period (21 days at 4 °C and 10 days at 25 °C) regardless of the storage temperature. These results showed that jet-cooking has a great advantage over traditional cooking in the preparation of these emulsions. Under the excess steam jet-cooking conditions utilized, the high temperature, pressures, and intense mechanical shear applied over very short time periods can solubilize various components of the flour to reduce molecular weights of the polymers and intimately mix the components in a manner that prevents their phase separation on prolonged standing [18,19]. Johnson et al. (1981) also noted that jet-cooking soybean flour slurries produced stable emulsions [17]. In addition to solubilizing the starch components in the flour, it is plausible that jet-cooking may effectively extract the soluble fibers in the flours, which in the case of soybean have emulsifying capabilities similar to those exhibited by strong amphiphilic polysaccharides like gum Arabic [25].
Storage stabilities were also confirmed by RVA pasting samples at 4 °C. The results are in agreement with the emulsions by traditional cooking and jet-cooking methods. After 20 days at 4 °C, about 10 and 15% of serum separations were observed for the blends with 80% and 100% navy bean flour, respectively (Figure 4). The emulsion containing 8% navy bean flour was found to have less serum than for 5% navy bean flour. It is implied that increasing solids in emulsion could increase emulsion stability. For jet cooked samples 100:0 stored at 4 °C, the value on Day 10 had sediment percentage of 5.5%, and the sediment percentage decreased to 2.5% at Day 14 and Day 21. The low value could be caused by compacting of sediment during the standing from Day 7 to Day 21.

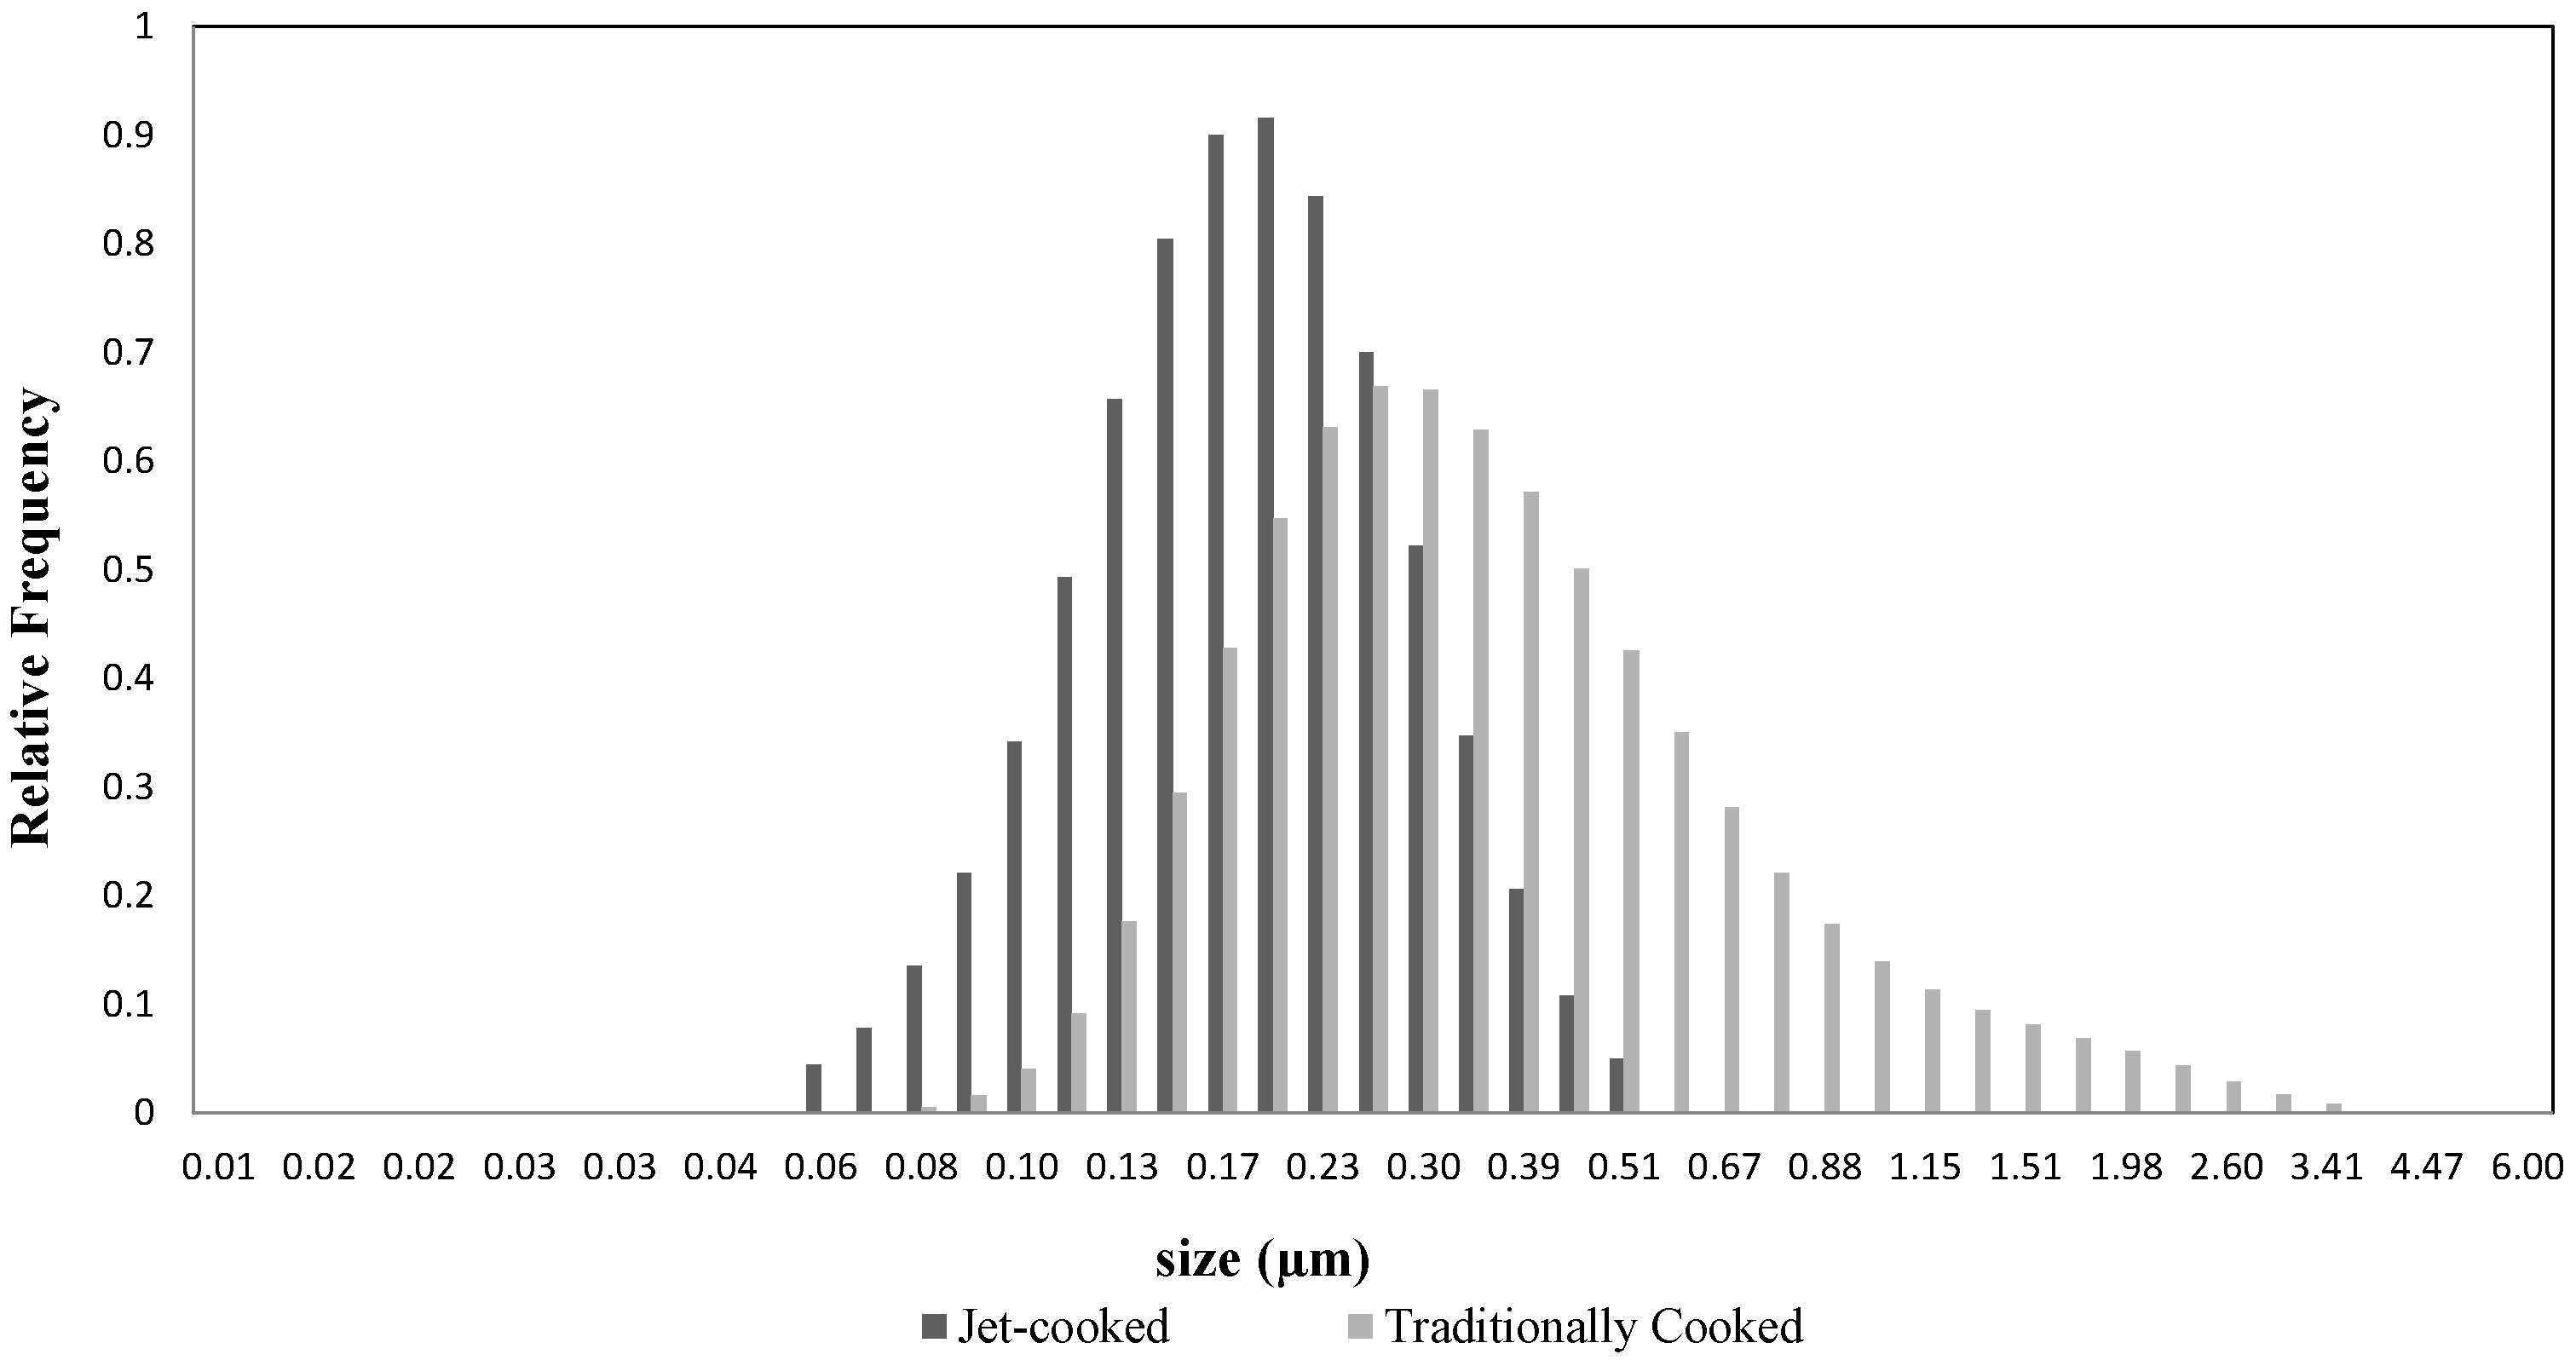
3.2.6. Particle Size

Particle size contributes to the visual appearance of alternative plant-based milk products, and can also affect shelf life stability of the soybean–navy bean flour emulsions. Average particle size distributions determined by volume and number were used to assess the stability of the soybean–navy bean flour emulsions. The average particle size by volume and number for traditional cooked and jet-cooked emulsions are shown in Table 10. The average sizes by volume for traditionally cooked emulsions ranged from 0.229 to 2.403 μm, whereas average size by volume for jet-cooked emulsions ranged from 0.180 to 2.281 μm. In general, the jet-cooked emulsions had smaller average size relative to the traditionally cooked emulsions regardless of the ratios of soybean and navy bean. This result suggests that jet-cooking can reduce the average particle size of the emulsions due to the higher temperature and hydrodynamic shear in addition to high pressure. The same trend was observed for averaged practical sizes by number (Table 10) with exception of the value from soybean–navy bean 40:60 measured by number. However, the average particle sizes by number had much smaller variances than the value by volume, indicating practical size by number may be a better way to describe practical size for beverage than by volume. The average particle size using jet-cooking measured by both volume and number were found to be smaller than the corresponding emulsions from traditional cooking, implying jet-cooking is an effective way to make beverages with greater stability. In Figure 5, the particle size distribution of soybean–navy bean (60:40) emulsion further proved that the particle size using jet-cooking were smaller than the corresponding emulsions from traditional cooking. This is in agreement with the results from the average size in Table 10. The shear force in jet-cooking contributed to the stability of emulsion by reducing the size of oil droplets and solid particles. The shorter heating time jet-cooking also contributed to the stable emulsion by reducing the protein denaturation and aggregations.
The emulsion systems are of high polydispersity, the standard deviation presented in some cases was of the same magnitude of the mean, and in the smallest of cases that represents 50% of the magnitude of the mean. It indicated the phenomena of instability for emulsions. Vegetable milks, such as tree nut based milks and rice milk, are colloidal systems formed by dispersed particles such as oil droplets, and solid particles from raw materials, proteins and starch granules. This makes it difficult to obtain a stable emulsion. Homogenization or other high-shear treatments of emulsions is used to stabilize the emulsion through size reduction of fat globules [26]. In general, the extent of heating, the heating time and pH are major factors that determine the molecular size or physical characteristics of the extracted fibers in a previous report [27]. The high temperature during the milk processing contributed to large average particle size and high shear force produce smaller average particle size. The low temperature combined with homogenization produces more stable almond and hazelnut milks [26].

4. Conclusions

As anticipated, the higher protein and oil content of soybean help stabilize the emulsions made from blends containing navy bean flour as identified by sedimentation and serum data. Jet-cooking, with its high shear, may increase emulsion stability. Emulsions of these blends were found to be more stable upon storage at room temperature than those stored at the refrigeration temperature. The trend in stability was also seen from the number and volume averaged particle size data. The high content of starch and fiber in navy bean flour likely contributes to the increase in viscosity of the emulsions, at both room and refrigeration temperatures, as the proportion of navy bean flour in the blends increased.
Unfortunately, cooking increased the amount of oligosaccharides such as raffinose and stachyose that are responsible for flatulence in the consumption of beans. No significant difference was found between the two cooking methods in terms of nutritional contents in the emulsions such as protein, crude fat, and total starch. The traditional kettle cooking, with its longer cooking time, seems to reduce more trypsin inhibitor in the emulsions than those prepared with the steam jet-cooking. The PHA values are lower in traditional kettle cooked emulsions made from the blends with less than 80% navy bean flour than those steam jet-cooked emulsions with comparable navy bean proportions. Masking the beany flavor of these emulsions by flavoring, such as chocolate, cinnamon, or fruits will be examined in future studies. The soybean–navy bean 100:0 emulsion is similar to soybean milk. This study demonstrated that soybean–navy bean emulsion contained less fat, more dietary fiber, and better viscoelastic properties compared with soybean milk, the major vegetal sources for milk beverages. This exploratory study is the first to report soybean–navy bean beverage prototypes having desirable nutritional value and the potential for functional beverage market.

Acknowledgments

The authors would like to express their appreciation to Michael Bowman, Richard Henz, Wilma Rinsch, and Jeanette Little of USDA ARS in Peoria, Illinois for their excellent technical work in several sample analyses and Steven Lyle for assistance in operating the steam jet-cooker.

Author Contributions

Sean Liu conceived and designed the experiments, conducted some literature search and review, and wrote the entire draft manuscript and its final revision; Mukti Singh helped design the experiment, conducted partial data analysis, and made suggestions that led to revision; Ashley Wayman performed experiments, analyzed part of the data, and did literature search; James Kenar performed several analyses, and revised part of the manuscript; and Diejun Chen performed parts of the experiments, data analysis, generated graphs and tables, and revised the manuscript.

Conflicts of Interest

No competing financial interests exist.

References

  1. USDA National Nutrient Database for Standard Reference. Available online: http://ndb.nal.usda.gov/ndb/search/list (accessed on 15 November 2015).
  2. Ha, V.; Sievenpiper, J.L.; de Souza, R.J.; Jayalath, V.H.; Mirrahimi, A.; Agarwal, A.; Chiavaroli, L.; Blanco Mejia, S.; Sacks, F.M.; Di Buono, M.; et al. Effect of dietary pulse intake on established therapeutic lipid targets for cardiovascular risk reduction: A systematic review and meta-analysis of randomized controlled trials. Can. Med. Assoc. J. 2014, 186, E252–E262. [Google Scholar] [CrossRef] [PubMed]
  3. McPherson, R. Dietary fiber—A perspective. In Dietary Fiber in Human Nutrition. CRC Handbook, 2nd ed.; Spiller, G.A., Ed.; CRC Press: Boca Raton, FL, USA, 1992; pp. 7–11. [Google Scholar]
  4. CGIAR. Improving Nutrition and Health. Available online: http://grainlegumes.cgiar.org/why-grain-legumes-matter/improving-nutrition-and-health/ (accessed on 15 September 2016).
  5. Fanta, G.F.; Felker, F.C.; Byars, J.A.; Kenar, J.A.; Shogren, R.L. Starch-soybean oil composites with high oil:starch ratios prepared by steam jet cooking. Starch/Stärke 2009, 61, 590–600. [Google Scholar] [CrossRef]
  6. Ade-Omowaye, B.I.O.; Taiwo, K.A.; Eshtiaghi, N.M.; Angersbach, A.; Knorr, D. Comparative Evaluation of the Effects of Pulsed Electric Field and Freezing on Cell Membrane Permeabilisation and Mass Transfer during Dehydration of Red Bell Peppers. Innov. Food Sci. Emerg. Technol. 2003, 4, 177–188. [Google Scholar] [CrossRef]
  7. AACC International. Total Starch. Approved Methods of Analysis, 11th ed.; Method 76–13.01.; AACC International: St. Paul, MN, USA, 1999. [Google Scholar]
  8. AACC International. Total Dietary Fiber. Approved Methods of Analysis, 11th ed.; Method 32–05.01.; AACC International: St. Paul, MN, USA, 1999. [Google Scholar]
  9. AACC International. Insoluble and Soluble Dietary Fiber in Oat Products—Enzymatic-Gravimetric Method. Approved Methods of Analysis, 11th ed.; Method 32–21.01.; AACC International: St. Paul, MN, USA, 1999. [Google Scholar]
  10. Giannoccaro, E.; Wang, Y.J.; Chen, P. Effects of solvent, temperature, time, solvent-to-sample ratio, sample size, and defatting on the extraction of soluble sugars in soybean. J. Food Sci. 2006, 71, C59–C64. [Google Scholar] [CrossRef]
  11. Giannoccaro, E.; Wang, Y.J.; Chen, P. Comparison of two HPLC systems and an enzymatic method for quantification of soybean sugars. Food Chem. 2008, 106, 324–330. [Google Scholar] [CrossRef]
  12. Hou, A.; Chen, P.; Shi, A.; Zhang, B.; Wang, Y.-J. Sugar Variation in Soybean Seed Assessed with a Rapid Extraction and Quantification Method. Int. J. Agron. 2009, 1, 1–8. [Google Scholar] [CrossRef]
  13. Pareyt, B.; Wilderjans, E.; Goesaert, H.; Brijs, K.; Delcour, J. The role of gluten in a sugar-snap cookie system: A model approach based on gluten-starch blends. J. Cereal Sci. 2008, 48, 863–869. [Google Scholar] [CrossRef]
  14. AACC International. Measurement of Trypsin Inhibitor Activity of Soy Products-Spectrophotometric Method. Approved Methods of Analysis, 11th ed.; Method 22–40; AACC International: St. Paul, MN, USA, 1999. [Google Scholar]
  15. Hammerstrand, G.E.; Black, L.T.; Glover, J.D. Trypsin inhibitors in soy products: Modification of the standard analytical procedure. Cereal Chem. 1981, 58, 42–45. [Google Scholar]
  16. Boniglia, C.; Fedele, E.; Sanzini, E. Measurement by ELISA of active lectin in dietary supplements containing kidney bean protein. J. Food Sci. 2003, 68, 1283–1286. [Google Scholar] [CrossRef]
  17. Johnson, L.A.; Deyoe, C.W.; Hoover, W.J. Yield and quantity of soymilk processed by steam-infusion cooking. J. Food Sci. 1981, 46, 239–248. [Google Scholar] [CrossRef]
  18. Fanta, G.F.; Christianson, D.D. Starch-hydrocolloid composites prepared by steam jet cooking. Food Hydrocoll. 1996, 10, 173–178. [Google Scholar] [CrossRef]
  19. Fanta, G.F.; Felker, F.C.; Eskins, K.; Baker, F.L. Aqueous starch-oil dispersions prepared by steam jet cooking. Starch films at the oil-water interface. Carbohydr. Polym. 1999, 39, 25–35. [Google Scholar] [CrossRef]
  20. Anderson, R.L.; Wolf, J.W. Compositional changes in trypsin inhibitors, phytic acid, saponins, and isoflavones related to soybean processing. J. Nutr. 1995, 125, 581S–587S. [Google Scholar] [PubMed]
  21. Coffey, D.G.; Uebersax, M.A.; Hosfield, G.L.; Brunner, J.R. Evaluation of the hemaggultinating activity of low-temperature cooked kidney beans. J. Food Sci. 1985, 50, 78–81 and 87. [Google Scholar] [CrossRef]
  22. Noah, N.D.; Bender, A.E.; Reaidi, G.B.; Gilbert, R.J. Food poisoning from raw red kidney beans. Bri. Med. J. 1980, 6234, 236–237. [Google Scholar]
  23. Qiu, S.; Yadav, M.P.; Yin, L. Characterization and functionalities study of hemicellulose and cellulose components isolated from sorghum bran, bagasse and biomass. Food Chem. 2017, 230, 225–233. [Google Scholar] [CrossRef] [PubMed]
  24. Byars, J.A.; Singh, M. Rheological and textural properties of pulse starch gels. Starch-Starke 2016, 68, 778–784. [Google Scholar] [CrossRef]
  25. Nakamura, A.; Takahashi, T.; Yoshida, R.; Maeda, H.; Corredig, M. Emulsifying properties of soybean soluble polysaccharide. Food Hydrocoll. 2004, 18, 795–803. [Google Scholar] [CrossRef]
  26. Bernat, N.; Cháfer, M.; Rodríguez-García, J.; Chiralt, A.; González-Martínez, C. Effect of high pressure homogenisation and heat treatment on physical properties and stability of almond and hazelnut milks. LWT Food Sci. Technol. 2015, 62, 488–496. [Google Scholar] [CrossRef]
  27. Nakauma, M.; Funami, T.; Noda, S.; Ishihara, S.; Al-Assaf, S.; Nishinari, K. Comparison of sugar beet pectin, soybean soluble polysaccharide, and gum Arabic as food emulsifiers. 1. Effect of concentration, pH, and salts on the emulsifying properties. Food Hydrocoll. 2008, 22, 1254–1267. [Google Scholar] [CrossRef]
Figure 1. Water holding capacities of starting soybean and navy bean blends with different ratios. Means with the same letter superscript are not significantly different (p < 0.05).
Beverages 03 00023 g001
Figure 2. Rapid Visco-Analyser pasting curve of starting soybean–navy bean blends with different ratios.
Beverages 03 00023 g002
Figure 3. Rapid Visco-Analyser pasting curve of navy bean with 5% and 8% solids.
Beverages 03 00023 g003
Figure 4. Storage stability of pasting samples by Rapid Visco-Analyser at 4 °C measured by percentage of serum.
Beverages 03 00023 g004
Figure 5. Particle size distribution of soybean-navy bean (60:40) emulsion.
Beverages 03 00023 g005
Table 1. Nutritional data for traditionally cooked and jet-cooked soybean–navy bean emulsions.
Percentage (by Weight) of Soybean in EmulsionPercentage (by Weight) of Navy Bean in EmulsionProteinTotal StarchCrude FatSoluble FiberInsoluble Fiber
Traditionally Cooked
100052.34 a0.22 g17.24 a4.71 a10.94 d,e
802047.72 c4.92 f14.48 b4.96 a10.85 d,e
604039.59 f11.18 e11.51 d2.97 a12.23 c,d
406032.20 h17.13 d7.52 g4.00 a19.10 a
208027.44 i29.15 b4.68 h4.94 a16.11 b
010022.84 j36.11 a1.89 j3.74 a16.75 b
Jet-Cooked
100050.37 b0.20 g13.81 c3.19 a11.78 c,d
802043.93 d10.10 e8.81 e2.29 a9.97 e,f
604040.50 e14.45 d7.63 f2.63 a9.09 f
406034.35 g17.09 d3.43 i4.48 a13.18 c
208027.85 i22.25 c1.75 k4.23 a16.58 b
010023.14 j21.52 c0.20 l5.23 a18.53 a
All values are listed as percent (or g/100 g sample) on a dry weight basis. Means with the same letter superscript are not significantly different in the same column (p < 0.05).
Table 2. Soluble sugar analysis of traditionally cooked and jet-cooked soybean–navy bean emulsions and their raw flour precursors.
Percentage (by Weight) of Soybean in EmulsionPercentage (by Weight) of Navy Bean in EmulsionGlucoseFructoseSucroseRaffinoseStachyoseVerbascose
Raw Flour
10000.27 e,f,g0.12 a103.00 c,d21.13 c,d,e41.62 c,d3.12 g
80200.28 e,f,g0.08 c88.21 e,f17.45 e,f,g35.03 e,f,g10.95 f,g
60400.31 d,e,f0.04 e,f,g78.00 f,g14.81 g,h,i30.47 f,g,h,i24.04 e,f
40600.35 c,d0.03 f,g,h73.07 g14.16 g,h,i,j29.44 g,h,i,j37.92 d
20800.32 c,d,e0.02 g,h58.17 h11.37 i,j,k24.25 i,j,k,l41.37 d
01000.17 h,i0.02 g,h41.14 i8.83 k18.75 l4.18 g
Traditionally Cooked
10000.22 g,h0.10 b120.83 a,b26.62 a,b48.81 a,b5.56 g
80200.38 b,c0.07 c,d127.61 a30.21 a53.05 a67.90 c
60400.50 a0.04 e,f107.46 c,d24.62 b,c44.41 b,c113.78 a
40600.42 b0.05 d,e98.15 d,e24.73 b,c42.68 b,c,d125.24 a
20800.49 a0.05 e,f76.00 f,g17.91 e,f,g33.23 f,g99.31 b
01000.24 f,g0.03 f,g,h51.73 h,i11.07 i,j,k23.48 j,k,l4.66 g
Jet-Cooked
10000.03 k0.01 h111.51 b,c26.05 b46.15 b,c3.64 g
80200.07 j,k0.02 h98.99 d,e22.54 b,c,d40.64 c,d,e16.40 e,f,g
60400.08 j,k0.01 h87.78 e,f19.78 d,e,f36.71 d,e,f16.13 e,f,g
40600.11 i,j0.02 g,h74.10 g16.56 f,g,h32.32 f,g,h27.69 d,e
20800.14 i,j0.02 g,h58.37 h12.82 h,i,j,k26.15 h,i,j,k28.73 d,e
01000.14 i,j0.02 g,h45.49 i10.35 j,k21.62 k,l1.95 g
Soluble sugar values are reported as μg soluble sugars per mg of defatted sample. Values are also on a dry weight basis. Means with the same letter superscript are not significantly different in the same column (p < 0.05).
Table 3. Trypsin inhibitor and PHA analysis of traditionally cooked and jet-cooked soybean-navy bean emulsions and their raw flour precursors.
Percentage (by Weight) of Soybean in EmulsionPercentage (by Weight) of Navy Bean in EmulsionTrypsin Inhibitor (mg TI/g Sample)Phytohemagglutinin (μg PHA/g Sample)
Raw Flour
100019.23 a87.73 g,h
802019.00 a281.72 b,c,d
604017.08 b226.75 d,e
406012.89 c,d,e346.31 a,b
208014.44 c289.07 b,c,d
010012.03 d,e,f254.74 c,d,e
Traditionally Cooked
10008.23 i0.00 i
80209.69 g,h,i36.72 h,i
60409.28 h,i37.96 h,i
406010.03 f,g,h,i138.43 f,g
208010.46 f,g,h349.22 a,b
010013.28 c,d382.83 a
Jet-Cooked
100010.68 f,g,h29.18 h,i
802011.43 d,e,f,g182.18 e,f
604011.63 d,e,f,g326.69 a,b,c
406011.14 e,f,g,h144.26 f,g
208011.48 d,e,f,g250.71 c,d,e
01009.62 g,h,i389.13 a
Values are reported on a dry weight basis. Means with the same letter superscript are not significantly different in the same column (p < 0.05).
Table 4. Percentage of solids for traditionally cooked and jet-cooked emulsions containing various blends of soybean and navy bean flours.
Percentage (by Weight) of Soybean in EmulsionPercentage (by Weight) of Navy Bean in EmulsionPercentage Solids
Traditionally Cooked
10003.6 ± 0.24 e,f
80203.5 ± 0.18 e,f,g
60403.8 ± 0.15 c,d,e
40603.6 ± 0.05 e,f
20804.0 ± 0.14 a,b,c
01004.1 ± 0.04 a,b
Jet-Cooked
10003.2 ± 0.08 g,h
80203.2 ± 0.20 h
60403.3 ± 0.02 f,g,h
40603.7 ± 0.01 d,e
20804.0 ± 0.10 b,c,d
01004.3 ± 0.01 a
Solids percentage was determined after cooking and removal of excess particulate matter. Means with the same letter superscript are not significantly different (p < 0.05).
Table 5. Viscosity of traditionally cooked and jet-cooked soybean–navy bean emulsions at 25 °C and 4 °C.
Percentage (by Weight) of Soybean in EmulsionPercentage (by Weight) of Navy Bean in EmulsionViscosity (mPa s) at 25 °CViscosity (mPa s) at 4 °C
Traditionally Cooked
10003.9 f5.7 g
80204.8 e,f6.2 g
604015.0 c15.2 e,d
406015.6 c16.9 c,d
208019.4 b17.8 c,d
010035.0 a48.3 a
Jet-Cooked
10004.5 f7.1 f,g
80206.1 e,f7.4 f,g
60407.7 e9.9 f
406010.6 d13.4 e
208015.8 c20.1 c
010034.8 a 44.2 b
Accuracy of viscosity measurements using a Brookfield viscometer was reported as 1 mPa∙s with a low viscosity spindle (#61) at 60 rpm (shear rate 13.2 s−1). Means with the same letter superscript are not significantly different in the same column (p < 0.05).
Table 6. Storage stability of soybean: navy bean emulsions at 4 °C measured by percentage of sediment.
Soybean:Navy BeanDay 1Day 7Day 10Day 14Day 21
Traditionally Cooked
100:05.0 ± 0.05.0 ± 0.04.8 ± 0.04.8 ± 0.04.8 ± 0.0
80:2010.0 ± 0.010.0 ± 0.010.0 ± 0.010.0 ± 0.010.0 ± 0.0
60:4010.0 ± 0.016.3 ± 1.715.5 ± 1.716.7 ±.0.019.0 ± 0.0
40:6021.4 ± 3.423.8 ± 0.023.8 ± 0.023.8 ± 0.028.6 ± 0.0
20:8028.6 ± 0.033.3 ± 0.035.0 ± 0.035.0 ± 0.035.0 ± 0.0
0:10052.4 ± 0.061.9 ± 0.059.5 ± 3.761.9 ± 0.060.0 ± 0.0
Jet-Cooked
100:002.5 ± 0.05.5 ± 0.02.5 ± 0.02.5 ± 0.0
80:2005.0 ± 0.05.0 ± 0.03.8 ± 1.85.0 ± 0.0
60:4005.3 ± 0.05.0 ± 0.005.0 ± 0.0
40:6000005.0 ± 0.0
20:800002.5 ± 3.50
0:100001.3 ± 1.800
Table 7. Storage stability of soybean: navy bean emulsions at 25 °C measured by percentage of sediment.
Soybean:Navy BeanDay 1Day 3Day 7Day 10
Traditionally Cooked
100:05.0 ± 0.05.0 ± 0.05.0 ±0.05.0 ± 0.0
80:2010.0 ± 0.010.0 ± 0.010.0 ± 0.010.0 ± 0.0
60:4020.0 ± 0.014.3 ± 0.016.7 ± 0.015.5 ± 1.7
40:6026.2 ± 3.425.0 ± 1.726.2 ± 3.426.2 ± 3.4
20:8030.0 ± 0.030.0 ± 0.030.0 ± 0.030.0 ± 0.0
0:10060.0 ± 0.057.1 ± 0.057.5 ± 3.565.0 ± 7.1
Jet-Cooked
100:0003.8 ± 1.82.5 ± 0.0
80:20005.0 ± 0.05.0 ±0.0
60:40006.3 ± 1.85.0 ± 0.0
40:600010.0 ± 0.010.0 ± 0.0
20:800000
0:1000000
Table 8. Storage stability of soybean: navy bean emulsions at 4 °C measured by percentage of serum.
Soybean:Navy BeanDay 1Day 7Day 10Day 14Day 21
Traditionally Cooked
100:000000
80:2000000
60:4000000
40:6000000
20:80005.0 ± 0.010.0 ± 0.017.5 ± 3.5
0:100009.5 ± 0.09.5 ± 0.040.0 ± 0.0
Jet-Cooked
100:000000
80:2000000
60:4000000
40:6000000
20:8005.0 ± 0.07.3 ± 0.07.5 ± 3.510.0 ± 0.0
0:10002.5 ± 0.05.0 ± 0.07.7 ± 3.67.9 ± 0.0
Table 9. Storage stability of soybean: navy bean emulsions at 25 °C measured by percentage of serum.
Soybean:Navy BeanDay 1Day 3 Day 7Day 10
Traditionally Cooked
100:00000
80:200000
60:400001.25 ± 1.7
40:600000
20:80005.0 ± 0.07.5 ± 3.5
0:1000010.0 ± 0.010.0 ± 0.0
Jet-Cooked
100:00000
80:200000
60:400000
40:600000
20:80005.0 ± 0.05.0 ± 0.0
0:1000005.0 ± 0.0
Table 10. The averaged particle size of soybean–navy bean emulsions by volume or number.
Soybean:Navy BeanTraditional CookedJet-Cooked
Particle Size (μm)Particle Size (μm)
by volume
100:00.229 ± 0.14 c0.180 ± 0.10 b
80:200.269 ± 0.18 c0.196 ± 0.08 b
60:400.366 ± 0.33 c0.197 ± 0.09 b
40:600.395 ± 0.37 c0.218 ± 0.07 b
20:800.638 ± 0.62 b,c0.271 ± 0.14 b
0:1002.403 ± 1.02 a2.281 ± 1.21 a
by number
100:00.118 ± 0.05 c0.094 ± 0.04 b
80:200.133 ± 0.06 c0.118 ± 0.05 b
60:400.148 ± 0.06 c0.112 ± 0.05 b
40:600.136 ± 0.06 c0.145 ± 0.06 b
20:800.183 ± 0.08 c0.145 ± 0.06 b
0:1001.277 ± 0.61 c0.304 ± 0.17 b
Means with the same letter superscript are not significantly different in the same column (p < 0.05).

