A Comparative Study of Dry and Wet Milling of Barley Malt and Its Influence on Granulometry and Wort Composition


Laboratory of Fermentation Technology, Federal Institute of Education, Science and Technology of Rio de Janeiro, Rio de Janeiro 20270-021, Brazil
*
Author to whom correspondence should be addressed.
Beverages 2018, 4(3), 51; https://doi.org/10.3390/beverages4030051
Submission received: 5 June 2018
/
Revised: 17 July 2018
/
Accepted: 19 July 2018
/
Published: 20 July 2018
(This article belongs to the Special Issue Brewing and Craft Beer)
Abstract
:Beer is a fermented drink produced from a wort comprised of barley malt, hops, and water in combination with activity from the yeast strains of the genus Saccharomyces. The beverage is consumed around the world and has a global market controlled by several multinational companies. However, in recent years, it has been possible to note an increase in the number of microbreweries and homebrewers, necessitating additional research both to develop and increase competitiveness of this market sector as well as to improve product quality and promote the reduction of production costs. The process of milling barley malt is often not considered relevant to these goals; however, this operation is influential with regard to, for example, mashing yield, the concentration of polyphenols in beer, and the quality of wort clarification. Therefore, this work evaluates the wet (10%, 20%, 30%, 40%, and 50% moisture content) and dry barley malt milling process as well as analyzes particle size distribution and the mean diameter of particles. The milled grains were submitted to a mashing process to evaluate how particle size contributes to the conversion of starch to sugars and the availability of polyphenols on sweet wort. The results indicate the best milling conditions to obtain a good mashing yield while preserving as much malt husk as possible to facilitate wort clarification.
1. Introduction
Beer is produced by the alcoholic fermentation of wort, which is prepared with barley malt and water, hop addition, and yeast action (Saccharomyces genus) [1,2]. The process can be divided into the following steps: malting, milling, mashing, boiling, cooling, fermentation, filtration, carbonation, microbiological stabilization, and packaging.
Milling has an important role in the process both in the professional beverage industry and in homebrew production because, in this step, the barley husk breaks down, exposing the starchy endosperm and the content of the embryo (predominantly enzymatic) [3,4]. If the grains are not properly milled, this will influence the rest of the brewing process, notably the wort composition. The presence of intact grains or large fragments result in non-exposure of internal grain fractions, promoting low conversion of starch to fermentable sugars and, consequently, low final yields of the mashing stage [5]. On the other hand, excessive milling promotes the extraction and solubilization of compounds whose presence causes the increase of undesirable characteristics to wort and beer, e.g., sensory properties such as an excessive bitterness or viscosity. Undesirable compounds include phenolic compounds, which, if present in large quantities, cause problems such as excessive bitterness, color changes, and excessive formation of trub [6,7]. Approximately 70–80% of the total polyphenol content of beer comes from the malt husk; its transfer to the wort is influenced by cereal milling [8]. The preservation of grain husk integrity also plays an important role in the formation of the filter cake in the clarification stage of sweet wort [5]. The more intact the husks, the easier and more efficient the clarification step will be.
The milling step can be conducted in either dry or wet form [9]. Dry milling increases grain comminution, which increases the yield of the brewer wort production; however, dry milling can make wort clarification more difficult [4]. Wet milling occurs in the presence of excess water (up to 45%) and promotes greater grain elasticity. Generally, wet milling is used to obtain advantages such as reduction of energy expenditures, elimination of dust (particulate material), transport facilitation, and the reduction of damage to mills (increased durability) [4,10]. However, wet milling can lead to problems, such as greater adhesion of starchy semolina on husk fraction, decreasing the yield. In the case of malt milling, another advantage of wet operation is that the moisture makes the husk more resistant and flexible, which reduces the probability of breakage [2,11,12].
Dry milling is most frequently used by the brewing industry; however, wet milling has recently become another popular method. Currently, wet milling is used industrially for corn and wheat, but it could also be successfully applied to other cereals, such as sorghum, barley, oats, or rice [13]. Wet milling is very common in Africa and Asia but not, for example, in the United States [14] or Brazil. When using non-malted barley as an adjunct to the brewing process, wet milling is the most indicated due to the toughness of this grain [15].
In this context, the objective of this work was to compare the milling process of malt grains with different moisture content to evaluate parameters such as final grain size, availability of starch for conversion to fermentable sugars, and overall content of phenolic compounds. Accordingly, it will be possible to stipulate the best conditions for the milling of barley grains to optimize the brewing process with regard to the mashing yield and the quality of the sweet wort.
2. Materials and Methods
2.1. Materials
Pilsen malt (Agrária®, Paraná, Brazil) was used because it is the base malt for most beer formulations. The malt grain, provided in dry form by the producer (<5%), was obtained in 5 kg sacks and kept dry and sealed throughout the development of the work. The malt specifications were as follows: extract of fine milling (81.5%), diastatic power (292 WK), and protein (11%).
The water used for grain humidification and mashing was potable water from the state’s supply system (CEDAE, Rio de Janeiro, Brazil). It was filtered on activated charcoal to remove the free chlorine ions, which result from its chemical treatment.
2.2. Humidification Limit
The water saturation limit was defined to establish the highest moisture percentage used in grain milling. Water was added to a small amount of malt grains (50 g) and the water saturation limit was stipulated as the concentration in which the water was no longer absorbed by the grain and remained at the Becher bottom. This analysis was strictly visual, and the procedure was executed in ambient conditions (25 °C) with constant manual homogenization.
2.3. Milling and Granulometric Analysis
After determining the maximum water absorbed by the grains (Item 2.2), six samples with 50 g of barley malt were prepared in quadruplicate. One sample was kept dry (sample A) and the others were humidified in consideration of the results of the previous analysis, resulting in five samples with the following relation of water/grain: 10%, 20%, 30%, 40%, and 50% (samples B, C, D, E, and F, respectively).
The dry and wet samples were milled in duplicate in cereal disc mill (Guzzo®, Rio Grande do Sul, Brazil), adjusted to 1.0 mm disk spacing. The wet samples were collected and dried in oven at 40 °C until constant mass to avoid contamination and to allow particle size analysis. A mechanical agitator and sequential sieves (SOLOTEST®, Rio de Janeiro, Brazil), with meshes of 2.00 (sieve 1), 1.84 (2), 1.54 (3), 1.20 (4), 0.86 (5), 0.51 (6), and 0.30 mm (7) were used to perform the granulometric analysis [16] of the grains after milling. Previously, the initial quantities were weighed and the masses retained on each sieve were determined as well as the fraction inferior to 0.30 mm, which allowed for a calculation of their respective fractions and to determine the granulometric profile. The mean diameter was calculated from the Sauter mean diameter equation (Equation (1)).
where:
- dp = Sauter mean diameter
- Xi = mass fraction in sieve i
- dpi = particle diameter in sieve i
These results were expressed in bar graphs with particle size distribution profiles and the mean diameter was present with respective deviation. In addition, a linear correlation graph between mean diameter and moisture content for milling was obtained.
2.4. Extraction of Soluble Material and Mashing Milled Grains
Milled grains from each of the six different moisture conditions (dry, 10%, 20%, 30%, 40%, and 50% moisture) were submitted to water-soluble material analysis by simple extraction. For this analysis, the milled grain was washed with excess water (400 mL) at ambient conditions (25 °C) and underwent simple homogenization for 30 min. These samples are called “soluble fraction”.
The remaining milled samples of each moisture condition (dry, 10%, 20%, 30%, 40%, and 50% moisture) was reserved for the mashing procedure, following compilation data from the brewing process literature: addition of water (2:1, water to malt ratio) and conduction of the following mash profile curve: 35 °C/10 min (solubilization step), 45 °C/15 min (proteolytic step), 55 °C/15 min (proteolytic step), 66 °C/40 min (β-amylase step), 72 °C/5 min (α-amylase step), and 78 °C/5 min (inactivation step) [1,3,17,18]. These samples were called “sweet wort”.
2.5. Analytical Determinations
Subsequently, all “soluble fraction” and “sweet wort” samples obtained in the previous Item (Item 2.3) were centrifuged at 3500 RPM for 3 min under controlled temperature (4 °C) (FANEM®, model 280R, Rio de Janeiro, Brazil). Soluble fractions and sweet worts produced were analyzed by determination of °Plato (by refractometry) [16,19], total reduction of sugar content (by DNS method) [20] and total phenolic compounds content (by Follin–Ciocalteu method) [20], as described below. The chemical analyzes were performed in triplicate and the standard deviation calculated.
For the DNS method, diluted samples were submitted to reaction with DNS reagent (100 °C/10 min) and the resulting product had its absorbance read at 540 nm (BioChrom®, model Libra S-21, Cambridge, UK). The reduced sugar concentration was calculated using a glucose standard curve. For the Follin–Ciocalteu method, diluted samples were reacted with Follin reagent (0.2 N), and Na2CO3 4% (50 °C/20 min) and the resulting product had its absorbance read at 740 nm (BioChrom®, model Libra S-21, Cambridge, UK). The total phenolic compounds content was calculated in gallic acid equivalents using a standard curve.
The variation of the parameters before and after mashing was calculated by simple subtracting of the obtained values and was named Δ (delta).
3. Results and Discussion
3.1. Humidification Limit
With humidification and constant homogenization of the grains in ambient conditions, it was possible to observe water deposit in Becher bottom, i.e., water not absorbed by the grains, from 60% moisture sample (60:100 g, water to grain). Therefore, it was decided to perform the study of malt milling with a dry fraction and fractions at 10%, 20%, 30%, 40%, and 50% moisture.
3.2. Granulometric Analysis
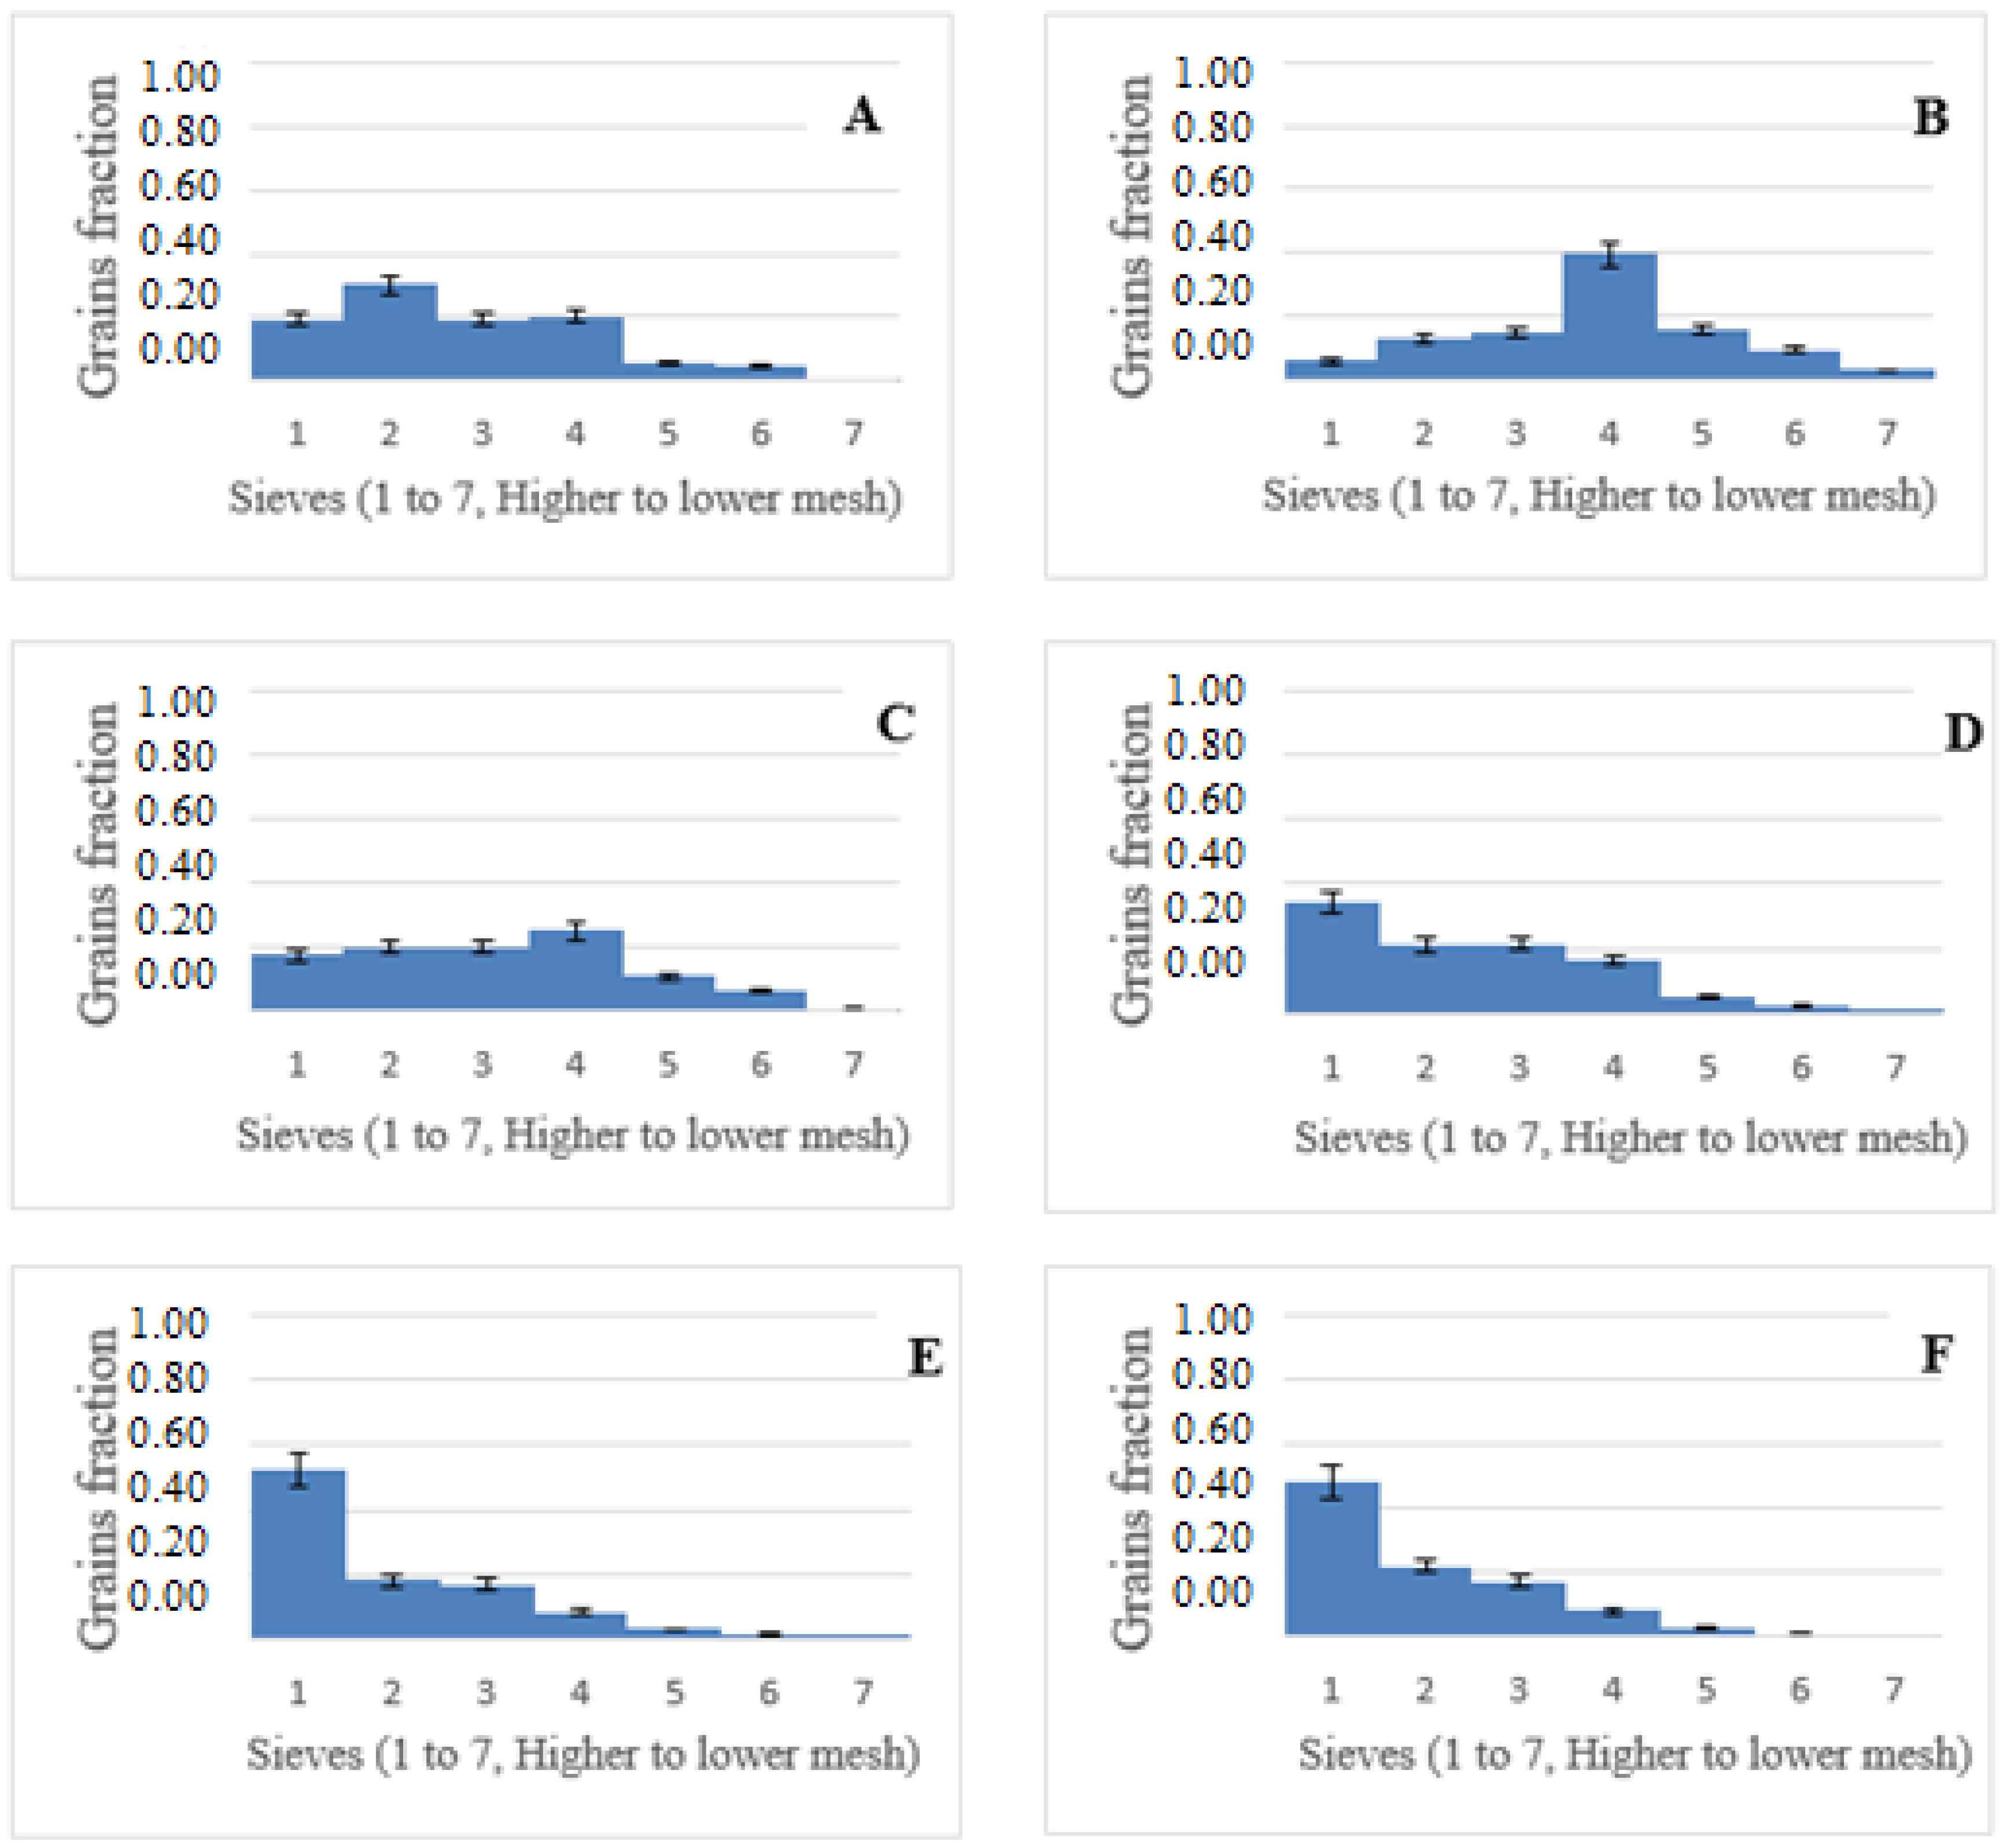
The granulometric distribution profiles of each milling condition, dry, 10%, 20%, 30%, 40%, and 50% moisture (samples A to F, respectively) can be seen in Figure 1 and the mean diameter values calculated by Equation (1) are shown in Table
In the dry grain distribution profile (Figure 1A), it was observed that the largest grain fraction (about 30% of the total) remained in the second largest mesh sieve, and the smaller granulometry fractions, sieves 5, 6, and 7, had less than 10% of the total grains. However, the distribution of the grains with 10% moisture (Figure 1B) presented a different granulometric profile from the dry grains (Figure 1A), with a larger fraction (about 40% of the total) in the fourth sieve. It also presented a considerable increase in the mass of particles in the smaller sieves, which determined a reduction in its mean granulometry, as observed by the calculation of the mean diameter (Table 1).
For the samples in the moisture range between 20% and 40% (Figure 1C–F), an increase tendency of accumulated grains in larger sieves was observed. Consequently, the mean diameter of the grains also increased (Table 1). The grain sample with 20% moisture (Figure 1C) showed this tendency, but the largest grain fraction was accumulated in sieve 4, similar to the 10% moisture sample (Figure 1B). For the 30% and 40% moisture (Figure 1D,E), respectively, the largest grain fraction was accumulated in sieve 1.
When the grains with 50% moisture were milled (Figure 1F), the tendency for an increase in grain size was interrupted, and the mean diameter was the same as in the previous sample, with 40% moisture (Table 1). This fact corroborates the hypothesis of water saturation by the grains observed in the previous analysis.
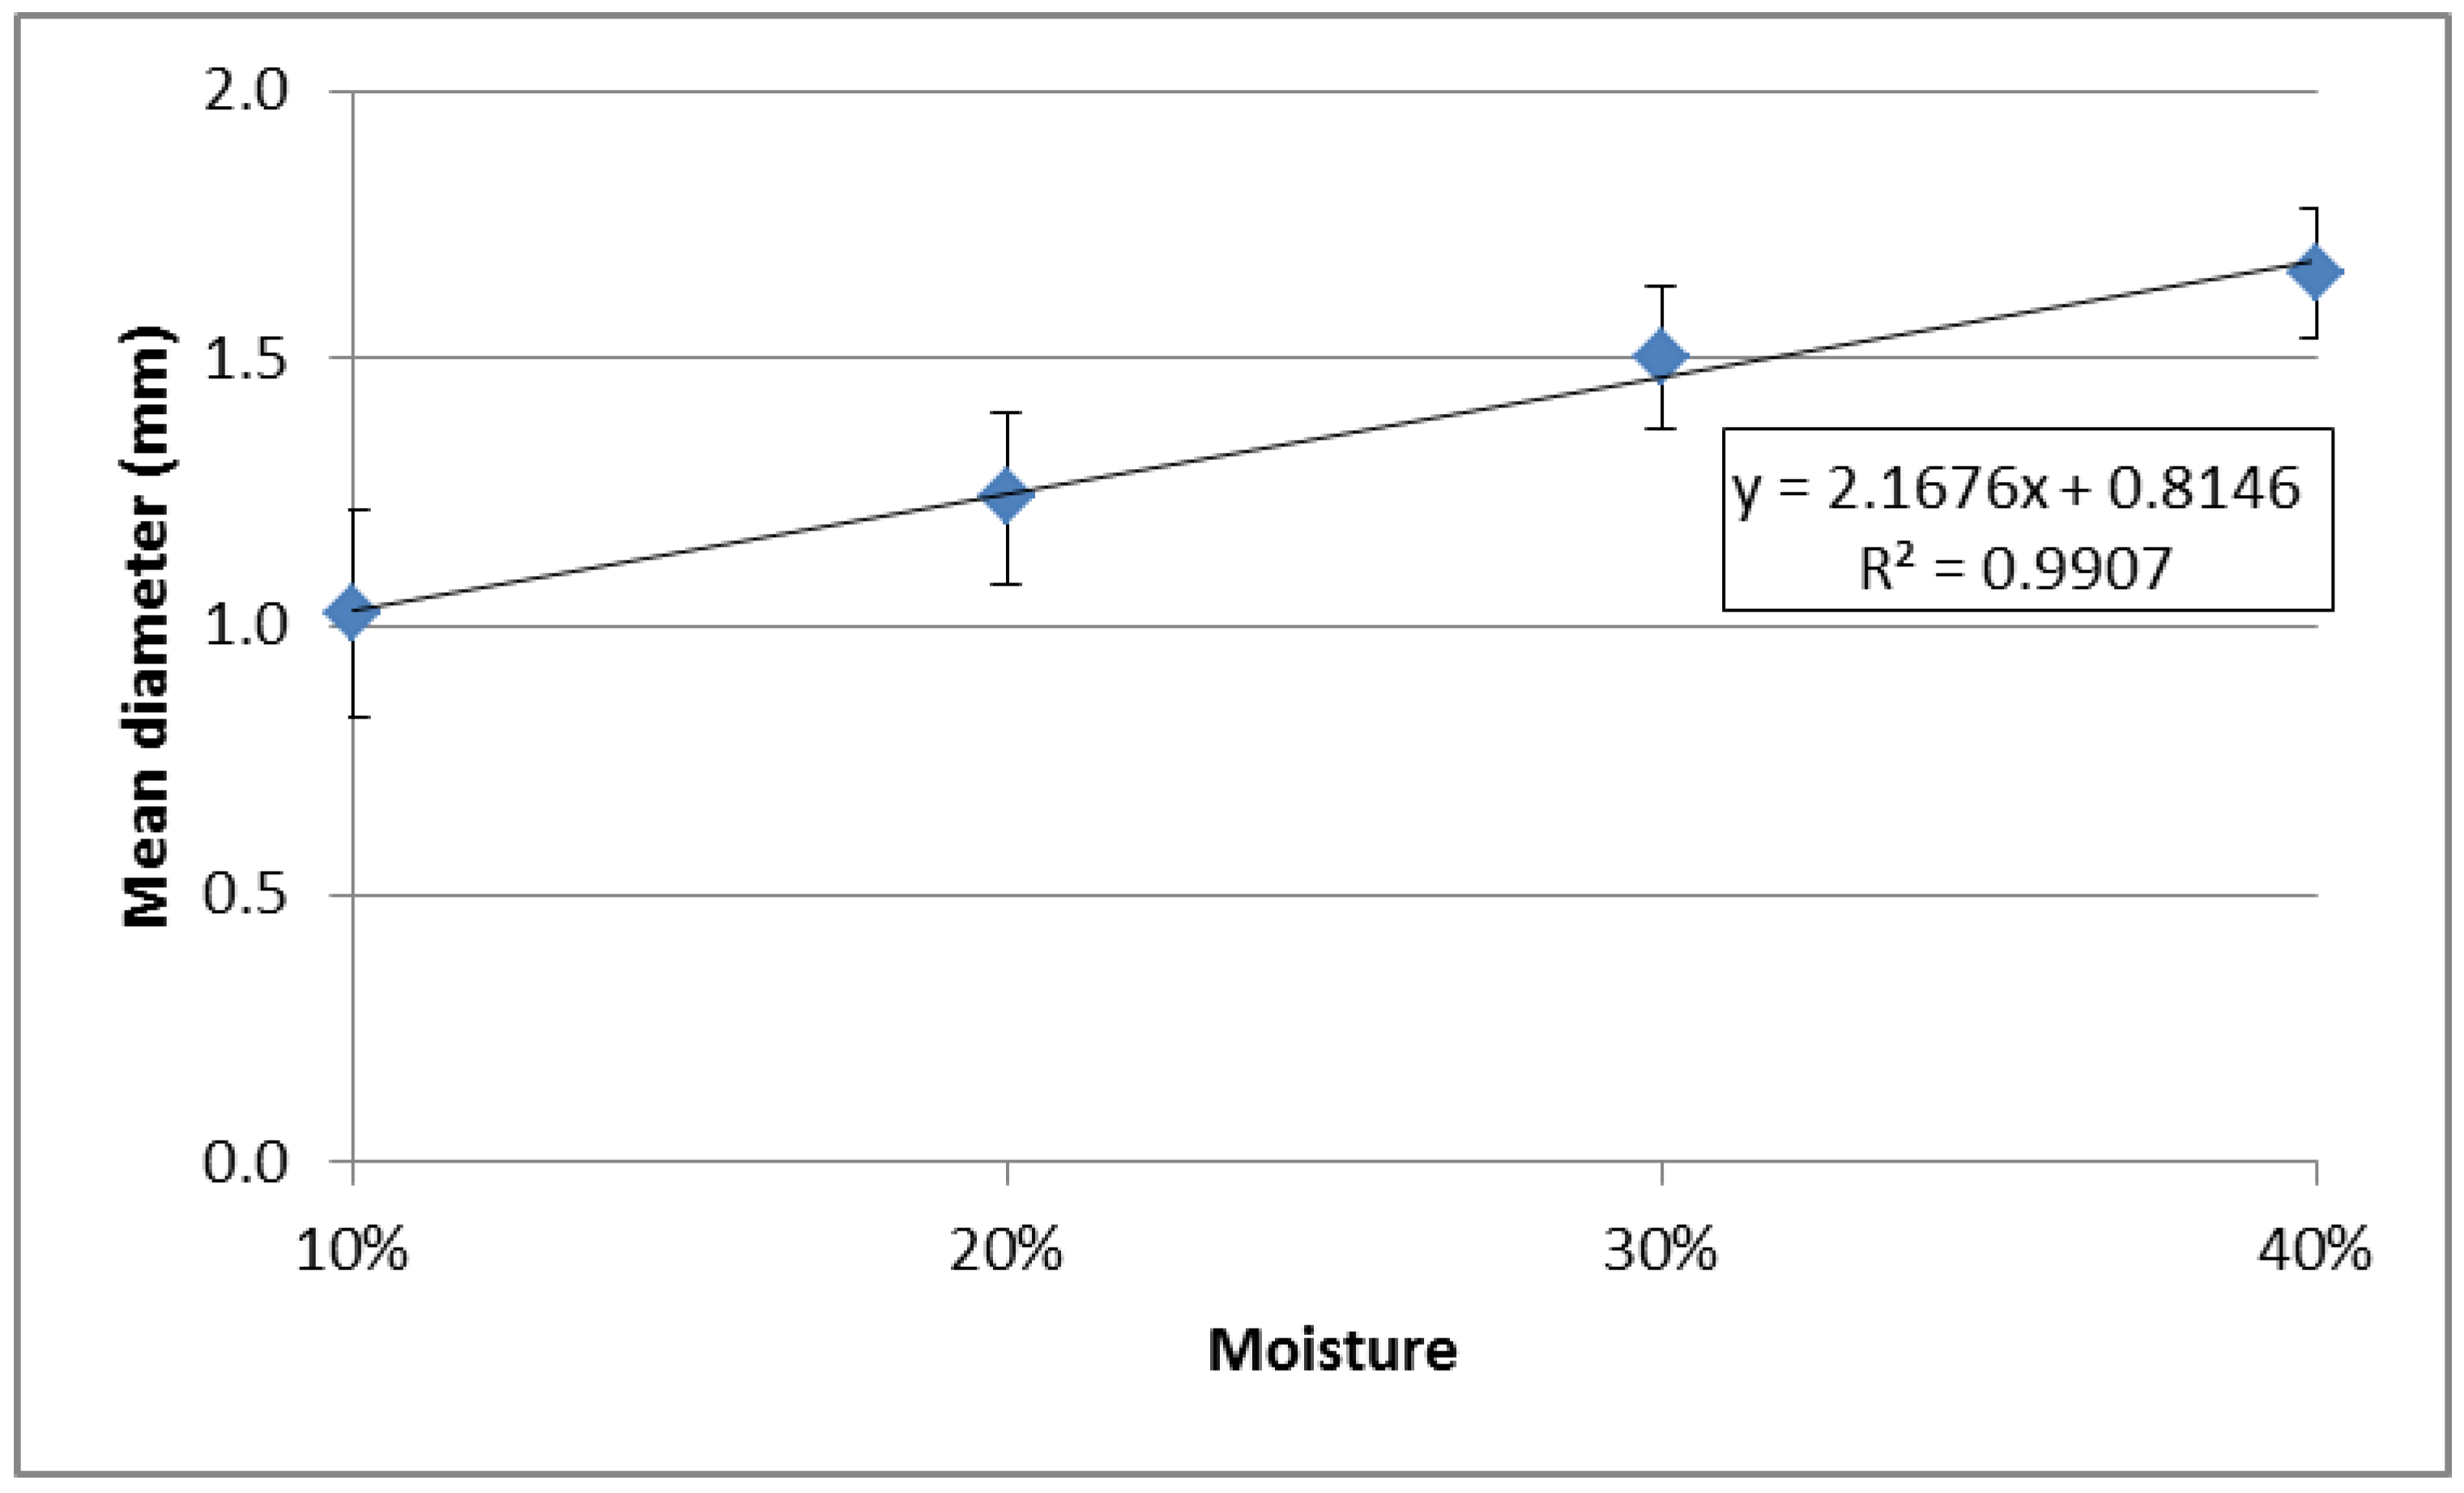
From the calculated mean diameters, the relationship between the mean diameter and the moisture content of the grains was estimated by simple linear regression of the points, excluding the dry and the 50% moisture samples. The results can be seen in Figure 2.
Figure 2 shows a good linear regression (R² = 0.9907) for the tendency for an increase in mean grain diameter with increasing moisture content between 10% and 40% moisture. The dry sample also had a superior diameter to the samples with 10% and 20% moisture and inferior to the others. The reduction of the granulometry in the 10% moisture sample when compared to dry sample may be attributed to the water content. This amount of water may not have been not able to promote humidification of the whole grain and was only absorbed by the husk. To elucidate what occurs between the dry grain and its humidification in 10% moisture, it is necessary to consult other studies to verify the humidification at other points in this interval. To analyze these two results, it would be interesting to continue the study using fractions of moisture equal to 5%, 15%, and 25%.
In studies by Reinold [5] and Venturini Filho and Nojimoto [12], an increase in the granulometry of the barley malt husk with the adoption of wet milling is described; however, the behavior of the internal fraction of the barley grains is not mentioned. In the literature, the humidification ranges in which an improvement in working conditions occurs are also not determined.
In general, lower values for mean diameter results in an increase in the contact surface of the grains and, consequently, promotes a higher extraction of its components, such as starch (in the case of internal grain fractions) or phenolic compounds (in the case of husk fractions). However, it cannot be disregarded that larger mean diameters, especially for homebrewers, promotes less wort turbidity and, consequently, easier and more efficient clarification.
3.3. Analytical Determinations
The results obtained for both water-soluble wort (before mashing) and sweet wort (after mashing) for refractive indices (°Plato), total reducing sugars, and total phenolic compounds are presented in Table 2. The variation, which refers to the difference of the determinations before and after mashing (mashing yield), was calculated by simple subtraction and is shown in Table 3.
Table 2 shows that the soluble extract (°Plato) presents a very close initial value for the samples milled with 10%, 20%, 30%, and 40% moisture content, whereas, for the dry sample, this value was significantly decreased, indicating the effect of the wet milling on the exposure of the soluble fractions of the grains. For the produced worts, the highest values of the extract were observed for the samples milled with 10%, 20%, and 30% moisture content.
The results in Table 2 show that the samples with 30% and 40% moisture presents a slightly higher concentration of reducing sugars in the soluble extract than the samples with 10% and 20% moisture. Although not expected because of the higher grain size, this result is close to the expectation related to the determination of °Plato, for which the results of the soluble extract samples with 10%, 20%, 30%, and 40% moisture were very close. After mashing, the highest values of total reducing sugars were observed for the samples milled with 10% and 20% moisture, as these being the smallest particle size, and were according to expected result. The high total values of reducing sugars are very favorable to the process because they guarantee more substrate for the yeast activity and, in turn, allow for the addition of more water in the process, which can maintain an ideal concentration of sugars, leading to a higher overall production of beer with the same initial malt mass. Again, these results indicate that the humidification of the malt provided greater exposure of the grain fractions, allowing the enzyme to be more efficient with the hydrolysis of macromolecules and the liberation of fermentable sugars in the wort.
The results of Table 3 indicate that the higher starch conversion (mashing yield), which can be directly related to the presence of sugars and to soluble solids concentration, is calculated for the samples of 10% and 20% moisture content, which were the samples of smaller particle size. As such, larger deltas of conversion for reducing sugar content of these samples were also calculated. This result was expected because the high contact surface leaves the starchy fraction more available for conversion to sugars via enzyme action. This result indicates that wet milling, using up to 30% moisture, increased the extraction of soluble solids of the grains during mashing.
Szwajgier [21] evaluated the milling (in roller mills) and mashing on an industrial scale of dry and wet malts (12–15%) and observed that there was no difference in the final concentration of sugars (glucose and maltose). However, it was verified that the extraction of these compounds from the grain occurred more rapidly, which may have resulted in a reduction of the mashing duration. Haros and Suarez [22] evaluated corn milling and observed a greater chemical recovery of the starch in wet grains.
Unlike other parameters, in phenols analysis, it is not generally interesting to compare the results with granulometry, given that the contribution of phenols coming from the malt is exclusively from husks, as observed in Broderick et al. [23]. Therefore, a higher concentration of phenols was expected in the samples in which the husks were more comminuted, with no relation to the conservation status of the starchy fraction. Unlike total reducing sugars, the concentration of phenols during mashing is not increased by enzymatic conversion. The increase in the concentration on the stage occurs purely by extraction due to the prolonged contact of the husks with the water and elevation of the temperature.
The ‘delta’ of extraction exposed in Table 3 suggests that the greatest variation for phenols with mashing occurred in the 10% and 20% moisture samples. The highest result in variations of the sample of 50% moisture as well as in the other parameters analyzed in the present study; again, this result was not expected, as it was necessary to study the behavior of barley malt grains against samples with higher humidification than their moisture saturation. Szwajgier [21] observed that, for total phenolic compounds content, there was a prevention of its extraction from malt husk due to the humidification of the grains.
In conclusion, faster sugar conversion during mashing occurs with wet milling, as confirmed by Szwajgier [21]. Concurrently, greater chemical recovery of the starch occurs for wet barley malts, as confirmed by Haros and Suarez [22] with regard to corn grains milling. To optimize the mashing conditions with an increase in starch conversion to reducing sugars, wet malt milling with 10 or 20% moisture is recommended.
Author Contributions
The experiments were carried out by F.P.d.M. and were supervised by T.R.d.S.M.
Funding
This research received no external funding.
Conflicts of Interest
The authors declare no conflict of interest.
References
- Briggs, D.E.; Boulton, C.A.; Brookes, P.A.; Stevens, R. Brewing Science and Practice; Woodhead Publishing: Cambridge, UK; CRC Press LLC: Boca Raton, FL, USA, 2004; p. 881. ISBN 0-8493-2547-1. [Google Scholar]
- Lewis, M.J.; Young, T.W. Brewing, 2nd ed.; Aspen Publishers Inc.: New York, NY, USA, 2001; p. 398. ISBN 978-0306472749. [Google Scholar]
- Kunze, W. Technology Brewing and Malting, 2nd ed.; VLB: Berlin, Germany, 1999; p. 726. ISBN 978-3-921690-77-2. [Google Scholar]
- Mallet, J. Malt: A Practical Guide from Field to Brewhouse; Brewers Publications: Boulder, CO, USA, 2014; p. 300. ISBN 193846916X. [Google Scholar]
- Reinold, M.R. Manual Prático de Cervejaria, 1st ed.; Aden: São Paulo, Brasil, 1997; p. 149. ISBN 85-86395-01-3. [Google Scholar]
- Siebert, KJ. Haze Formation in Beverages. LWT-Food Sci. Technol. 2006, 39, 987–994. [Google Scholar] [CrossRef]
- Markovi, R.S.; Grujic, O.S.; Pejin, J.D. Conventional and alternative principles for stabilization of protein and polyphenol fractions in beer. Acta Period. Technol. 2003, 34, 3–12. [Google Scholar] [CrossRef]
- Siqueira, P.B.; Bolini, H.M.A.; Macedo, G.A. O processo de fabricação de cerveja e seus efeitos na presença de polifenóis. Alim. Nutr. Araraquara 2008, 19, 491–498. [Google Scholar]
- Venturi, W.G. Cerveja. Tecnologia de Bebidas, 1st ed.; Edgard Blücher: São Paulo, Brazil, 2005; p. 412. ISBN 9788521204930. [Google Scholar]
- Cassola, M.S.; Moraes, S.L.; Albertin, E. Desgaste na mineração: O caso dos corpos moedores. Rev. Esc. Minas 2006, 59, 173–178. [Google Scholar] [CrossRef]
- Hough, J.S. Biotecnología de la Cerveza y de la Malta; Editora Acribia: Zaragoza, Espana, 1990; p. 208. ISBN 9788420006819. [Google Scholar]
- Venturini-Filho, W.G.; Nojimoto, T. Aproveitamento da água de umidificação de malte da moagem úmida como matéria prima na fabricação de cerveja. Food Sci. Technol. 1999, 19, 174–178. [Google Scholar] [CrossRef]
- Wronkowska, M. Wet-milling of cereals. J. Food Process. Preserv. 2016, 40, 572–580. [Google Scholar] [CrossRef]
- Goldammer, T. The Brewer’s Handbook, a Complete Book to Brewing Beer; Apex Publishers: Herndon, VA, USA, 2008; p. 496, ISBN (13) 978-0-9675212-3-3. [Google Scholar]
- Bogdan, P.; Kordialik-Bogacka, E. Alternatives to malt in brewing. Trends Food Sci. Technol. 2017, 65, 1–9. [Google Scholar] [CrossRef]
- American Society of Brewing Chemists (ASBC). Methods of Analysis; ASBC: St. Paul, MN, USA, 1976. [Google Scholar]
- BARNES, Z.C. Brewing Process Control. In Handbook of Brewing; Priest, F.G., Stewart, G.G., Eds.; CRC Press and Taylor & Francis Group: Boca Raton, FL, USA, 2006; pp. 447–486. [Google Scholar]
- Bamforth, C.W. Beer: Tap into the Art and Science of Brewing, 2nd ed.; Oxford University Press: Oxford, UK, 2003; p. 233. ISBN 978-0195305425. [Google Scholar]
- European Brewery Convention (EBC). Analytica-EBC, 7th ed.; Fachverlag Hans Carl: Nuremberg, Germany, 2008. [Google Scholar]
- AOAC International. AOAC Official Methods of Analysis; AOAC International: Rockville, MD, USA, 1990. [Google Scholar]
- Szwajgier, D. Dry and Wet Milling of Malt. A Preliminary Study Comparing Fermentable Sugar, Total Protein, Total Phenolics and the Ferulic Acid Content in Non-Hopped Worts. J. Inst. Brew. 2011, 117, 569–577. [Google Scholar] [CrossRef] [Green Version]
- Haros, M.; Suarez, C. Effect of drying, initial moisture and variety in corn wet milling. J. Food Eng. 1997, 34, 473–481. [Google Scholar] [CrossRef]
- Broderick, H.M.; Canales, A.M.; Coors, J.H. El Cervecero en la Practica: Un Manual para la Industria Cervecera, 2nd ed.; Associacón de Maestros Cerveceros de las Américas: Provincia Panama, Panama, 1949; p. 230. ISBN 9780971825505. [Google Scholar]
Figure 1.
Granulometric distribution profiles of milled grain: dry (A); 10% moisture (B); 20% moisture (C); 30% moisture (D); 40% moisture (E); and 50% moisture (F).
Figure 1.
Granulometric distribution profiles of milled grain: dry (A); 10% moisture (B); 20% moisture (C); 30% moisture (D); 40% moisture (E); and 50% moisture (F).

Figure 2.
Correlation graph of moisture content (%) for milling with mean grain diameter.


Table 1.
Sauter mean diameter (mm) and deviation for each moisture (%) milling condition.
| Sample | Moisture | Mean Diameter (mm) * |
|---|---|---|
| A | 0% (dry) | 1.35 ± 0.15 |
| B | 10% | 1.02 ± 0.20 |
| C | 20% | 1.24 ± 0.16 |
| D | 30% | 1.50 ± 0.13 |
| E | 40% | 1.66 ± 0.12 |
| F | 50% | 1.66 ± 0.13 |
* Calculated by Equation (1).
Table 2.
Analytical determinations of samples for malted grains with different moisture contents (%) for milling before (soluble fraction) and after mashing (sweet wort).
Table 2.
Analytical determinations of samples for malted grains with different moisture contents (%) for milling before (soluble fraction) and after mashing (sweet wort).
| Sample (% Moisture) | °Plato | TRS ¹ (g·L −1) | TPC ² (mg·L −1) | |||
|---|---|---|---|---|---|---|
| Soluble Fraction | Sweet Wort | Soluble Fraction | Sweet Wort | Soluble Fraction | Sweet Wort | |
| A (dry) | 1.0 | 9.5 | 10.16 ± 0.06 | 89.44 ± 0.00 | 70.62 ± 2.44 | 148.99 ± 1.63 |
| B (10%) | 3.1 | 13.9 | 26.21 ± 1.29 | 175.84 ± 5.86 | 131.84 ± 13.08 | 228.47 ± 0.06 |
| C (20%) | 2.8 | 13.7 | 25.67 ± 0.06 | 168.23 ± 3.52 | 107.42 ± 4.13 | 215.91 ± 10.29 |
| D (30%) | 2.9 | 12.0 | 28.14 ± 0.12 | 146.78 ± 0.59 | 117.36 ± 4.77 | 186.74 ± 1.98 |
| E (40%) | 3.1 | 9.1 | 27.00 ± 1.93 | 115.10 ± 0.00 | 119.69 ± 13.95 | 185.97 ± 10.12 |
| F (50%) | 1.9 | 10.9 | 17.71 ± 0.47 | 103.37 ± 4.40 | 107.75 ± 0.48 | 188.95 ± 2.87 |
¹ TRS = Total Reducing Sugars; ² TPC = Total Phenolic Compounds.
Table 3.
Variation (Δ) between parameters before (soluble fraction) and after mashing (sweet wort) calculated by simple subtraction.
Table 3.
Variation (Δ) between parameters before (soluble fraction) and after mashing (sweet wort) calculated by simple subtraction.
| Sample (% Moisture) | Δ°Plato | ΔTRS ¹ (g·L −1) | ΔTPC ² (mg·L −1) |
|---|---|---|---|
| Dry | 8.5 | 79.28 ± 0.05 | 78.37 ± 0.66 |
| 10 | 10.8 | 149.63 ± 3.68 | 96.63 ± 10.63 |
| 20 | 10.9 | 142.56 ± 2.81 | 108.49 ± 5.03 |
| 30 | 9.1 | 118.64 ± 0.31 | 69.38 ± 2.23 |
| 40 | 6.0 | 88.1 ± 1.58 | 66.28 ± 3.12 |
| 50 | 9.0 | 97.57 ± 3.21 | 81.20 ± 1.95 |
¹ TRS = Total Reducing Sugars; 2 TPC = Total Phenolic Compounds.
© 2018 by the authors. Licensee MDPI, Basel, Switzerland. This article is an open access article distributed under the terms and conditions of the Creative Commons Attribution (CC BY) license (http://creativecommons.org/licenses/by/4.0/).
Share and Cite
MDPI and ACS Style
Pereira de Moura, F.; Rocha dos Santos Mathias, T. A Comparative Study of Dry and Wet Milling of Barley Malt and Its Influence on Granulometry and Wort Composition. Beverages 2018, 4, 51. https://doi.org/10.3390/beverages4030051
AMA Style
Pereira de Moura F, Rocha dos Santos Mathias T. A Comparative Study of Dry and Wet Milling of Barley Malt and Its Influence on Granulometry and Wort Composition. Beverages. 2018; 4(3):51. https://doi.org/10.3390/beverages4030051
Chicago/Turabian StylePereira de Moura, Felipe, and Thiago Rocha dos Santos Mathias. 2018. "A Comparative Study of Dry and Wet Milling of Barley Malt and Its Influence on Granulometry and Wort Composition" Beverages 4, no. 3: 51. https://doi.org/10.3390/beverages4030051
Note that from the first issue of 2016, this journal uses article numbers instead of page numbers. See further details here.