Analysis of Application of Cluster Descriptions in Space of Characteristic Image Features †


1
Department of Informatics and Computer Technologies, Simon Kuznets Kharkiv National University of Economics, Nauky ave. 9-A, 61166 Kharkiv, Ukraine
2
Department of Informatics, Kharkiv National University of Radio Electronics, Nauky ave. 14, 61166 Kharkiv, Ukraine
*
Author to whom correspondence should be addressed.
†
This paper is an extended version of conference paper: Gorokhovatskyi, V.; Putyatin, Y.; Gorokhovatskyi, O.; Peredrii, O. Quantization of the Space of Structural Image Features as a Way to Increase Recognition Performance. In Proceedings of The Second IEEE International Conference on DataStream Mining & Processing (DSMP-2018), Lviv, Ukraine, 21–25 August 2018; pp. 464–467.
Data 2018, 3(4), 52; https://doi.org/10.3390/data3040052
Submission received: 2 October 2018
/
Revised: 10 November 2018
/
Accepted: 12 November 2018
/
Published: 14 November 2018
(This article belongs to the Special Issue Data Stream Mining and Processing)
Abstract
:In this paper, we propose an investigation of the properties of structural image recognition methods in the cluster space of characteristic features. Recognition, which is based on key point descriptors like SIFT (Scale-invariant Feature Transform), SURF (Speeded Up Robust Features), ORB (Oriented FAST and Rotated BRIEF), etc., often relating to the search for corresponding descriptor values between an input image and all etalon images, which require many operations and time. Recognition of the previously quantized (clustered) sets of descriptor features is described. Clustering is performed across the complete set of etalon image descriptors and followed by screening, which allows for representation of each etalon image in vector form as a distribution of clusters. Due to such representations, the number of computation and comparison procedures, which are the core of the recognition process, might be reduced tens of times. Respectively, the preprocessing stage takes additional time for clustering. The implementation of the proposed approach was tested on the Leeds Butterfly dataset. The dependence of cluster amount on recognition performance and processing time was investigated. It was proven that recognition may be performed up to nine times faster with only a moderate decrease in quality recognition compared to searching for correspondences between all existing descriptors in etalon images and input one without quantization.
1. Introduction
Structural image recognition methods, where visual objects on images are described as sets of characteristic features (CF), are widely used due to the high efficiency associated with the practical ability to perform recognition in the complex conditions related to geometric transformations, background influences or even the partial absence of features [1,2,3,4]. The user of the computer vision system independently determines which specific part of the available description is acceptable for making a decision about the class of an object. Successful implementation of structural methods dealing with problems of face recognition, animal recognition and recognition of a number of different icon-type images, such as coats of arms, paintings, logos and brands, are known [4,5,6,7].
Feature detection methods and the space to make the decision are the main factors that determine the effectiveness of recognition. The use of etalon information as a recognition core defines the quality of learning (tuning) of the system for the specific initial data and their adaptation. Embedding of the learning step not only allows for improved recognition performance by adaptation of the parameters, but it also ensures versatility and function in relation to arbitrary image datasets [5,8].
A way to increase the effectiveness of the structural recognition methods in terms of speed and, in fact, without reducing the probabilistic characteristics, is by the use of vector quantization in the space of structural dataset features [3,4,6]. Quantization implements an approximation in the space of key point feature descriptors by splitting them into subsets of equivalent elements. Due to the quantized representation and the creation of set-vector mapping, the features’ space is transformed and, as a result, the relevance of the object descriptions can be interpreted as distance or vector similarity [3].
Applying quantization in the CF space of images allows subsets of similar elements associated with a set of cluster centers to be obtained and used to recognize the image of an arbitrary visual object globally [9]. Such models can be classified as structural and statistical at the same time. Formation of the object’s CF by, for example, SURF (Speeded Up Robust Features), SIFT (Scale-invariant Feature Transform) and ORB (Oriented FAST and Rotated BRIEF) detectors allows to reach invariance to permissible geometric transformations [2,10,11].
Vector quantization and learning are often interpreted by researchers as a whole. However, in our opinion, vector quantization itself is more objective, in terms of investigation object independence, and learning, on specific features of an object, is more aimed at the meaningful management of the adaptation process.
The “bag of features” [12,13] method is a “bag of words” analog, which is used in computer vision applications to build strong descriptions of an image. This approach usually includes key point feature detection (typically SIFT), quantization (clustering) of these features (typically with k-means) and distribution of key point features in the space of cluster centers in the form of a histogram (we refer to this procedure as “screening”). Recognition is usually performed by searching for a minimum distance between histograms.
A lot of different modifications are proposed for the abovementioned common method, including classification with support vector machines [13] and smart additional processing of key point descriptions [13].
The TOP-SURF image descriptor [14] was introduced as a method to combine key point features with visual word representation. Many features (over 33 million) were clustered in order to form up to 500,000 clusters (the lowest amount was 10,000). The sequence of such clusters is called a “visual word dictionary”. Separate weight was assigned to each word to take into account its frequency. The recognition stage included the mapping of each key point feature of an input image to the closest visual word forming the weighted histogram of words. Only top N words were left as a final image descriptor; then, the distance between such descriptors could be computed to compare the images. Having such huge visual word dictionaries makes possible the recognition of arbitrary datasets.
Different uses of clustering results were proposed in Reference [15] for the application of face recognition. SURF features were transferred to other feature spaces using principal component analysis. K-means clustering formed clusters for the calculation of local and global similarities between key point features in all sub-cluster pairs for each pair of images.
Another example of a face recognition system was presented in Reference [16], where k-means clustering of SIFT features was used to improve accuracy. Calculation time was also reduced by comparison of cluster centroids instead of mapping the features directly.
Agglomerative clustering was investigated in Reference [17] as a counter tool to the most popular k-means clustering method. Other benefits of its uses relate to the efficiency of searching for large amounts of features and better recognition quality (SIFT descriptors are used).
The stability and quality of k-means clustering of SURF descriptors were investigated and compared with mean shift clustering in Reference [18]. It was shown that k-means splits key points better, thus it was more suitable. Hough transformation as a clustering tool was proposed in Reference [19].
Despite the successful implementation and confirmation of significant performance improvements due to the quantized representation of features for recognition, as in the investigations mentioned above, the effectiveness of applying this approach to datasets with an essential inner-class variance like Leeds Butterfly dataset [20] is unclear. We find this dataset very challenging for structural recognition methods though it contains only ten classes.
Some researchers, mentioned above, validate the use of methods involving huge datasets with plenty of classes and features in order to build an extensive universal bag of features dictionary. Other papers contain validation of datasets with rather small inner-class variance. Our contribution was an investigation of method properties for such datasets, in which each representative of the class was taken in different conditions (like illumination, light, etc.). We did not use quantization of CF to build a huge bag of features dictionary in order to process a wide variety of images. On the contrary, the idea was to keep the cluster amount to a minimal.
The goal of the work was to analyze and investigate the quantization effectiveness of the structural recognition of images based on image descriptions in the form of sets of CF for a dataset with many rather different etalons per class. The objectives of the investigation were the analysis of k-means clustering of SURF features with a subsequent screening, the evaluation of the recognition accuracy and analysis of the dependency between preprocessing and recognition time on different system options.
2. Quantizing Sets of Image Descriptors
Generally, we performed a discrete approximation of continuous input data from the set of vectors , using a predefined set of encoding vectors , , [6,21,22]. Concurrent approximation of vector meant a search for the value of closest to its vector (usually in terms of Euclid metrics) in the space of encoding vectors:
Equation (1) is known as concurrent Kohonen learning [21]. The idea of quantization is that the formation of set , on the basis of training set accordingly, will optimize certain criteria.
All input vectors should be normalized in order to reach an equivalent influence and training stability: , . If the set of CF is formed by SURF descriptors this condition is fulfilled automatically, so no additional processing is required.
Vector quantization can be formulated as a global optimization problem for the functional that reflects the quality of the cluster system, while the total distances between the elements within the clusters are minimized and the distances between the cluster centers are maximized.
Batch processing during quantization is implemented in the form of a computational scheme, which is used in a situation where the complete set is available at the beginning of learning and all are considered to be equivalent. The k-means algorithm for batch processing arranges cluster centers (centroids) so that the average values of the lists of elements within the clusters differ as much as possible. K-means approximates the density distribution function of input samples by the criterion of the minimum sum of squared deviations from cluster centers [22]
where is a power of the cluster.
The iterative k-means algorithm converges to a local minimum of error, . The minimization of Equation (2) promotes the quantization process to fit the training data in the best way.
With regard to the structural recognition problem based on formed CF clusters, the error solved for in Equation (2) cannot be considered a key indicator, since the criterion for the probability of correct recognition of objects (accuracy) is still the fundamental factor [1]; however, Equation (2) reflects the quality of the data representation in a concentrated form so the learning process achieves the lowest possible value.
Numerous modifications of k-means method are known, e.g., the k-median method—where the median value, , is selected instead of the average in each cluster in order to remove anomaly values. The median is defined as an element of a set whose total distance to the remaining elements is minimal [21]. Fuzzy classifier means [22] are applicable in cases when it is necessary to analyze overlapping clusters where the values of the membership function for each of the clusters are calculated.
In the case of online-learning, when CF is processed one by one, the center, , of the cluster, which was the winner in Equation (1), was corrected in the following way:
where the learning step is , is the size of the training set (total quantity of CF for the whole dataset) and is set up by the researcher and specifies learning speed assuming and . A huge variety of learning strategies and methods, based on Equation (3), have been developed, including the modeling of the dynamics of network topology [6,22].
3. Properties of Structural Image Description Learning
The descriptor features were calculated with the use of some detectors applied to the image brightness function and with vector size (usually 32, 64 or 128). Structural descriptions of arbitrary images were the finite set ,, where is a subset of the real -dimensional vectors with a norm of [2]. In cases when CF descriptors were normalized, they could be used in the learning procedures directly.
During the preprocessing stage, set of dataset image features, including all patterns (—is an etalon, —is the amount of classes), were split on finite amounts of clusters, , in a way that , clusters were defined with the center . Clustering maps set of CF of the whole dataset into itself, , each CF belonged to just one cluster. Case is possible as a result of clustering. After clustering was completed, we performed the “screening” of each etalon pattern and, as a result, the description of etalon took form:
where , is the amount of elements of etalon that belong to and cluster is a set of integers. From the mathematical point of view, screening represents the voting of each etalon feature for one of the cluster centroids, which seems more robust in comparison to the centroids.
The special practical case was a quantization with the number of clusters equal to the number of classes to recognize (). At the learning stage, the “centers” of the attribute descriptions of the class were formed for each etalon and we could directly perform the recognition of a visual object in real time, even without going to the clusters; this was because the condition was already established. Here, the quantization worked as a tool for extracting the most significant distinguishing features of the etalons.
Recognition of the visual object represented by the description for could be reduced to counting the number of voices of elements in accordance with the competitive rule of optimal closeness in the cluster system
As a result of Equation (5), , we obtained an integer vector of the class voices whose maximum component determined the class, for description and for object:
At the same time, the use of the two methods described earlier [3,4] was possible. The first was based on the construction of an integral vector representation for the object , and the second was based on the summation of the vectors of the specific weights of elements classified, according to the rule of Equation (5), to the nearest of the clusters.
The essence of learning for the system of structural recognition reduced to such problems as the construction of a cluster system for a set of attributes in the image database, rational enough from the recognition efficiency point of view, and the estimation of optimal threshold parameters for the classification of objects.
The possibility of applying a more efficient batch mode (the complete set was available) could be claimed as a feature of learning in the CF space, as well as the potential of using training with the teacher, since the membership of the CF of etalons from dataset was known, and each of the etalons forms its own class. Other features of recognition included the requirement to filter out improper characteristic features (e.g., noise), as well as the equalization (normalization) of the number of features in the descriptions of etalon images.
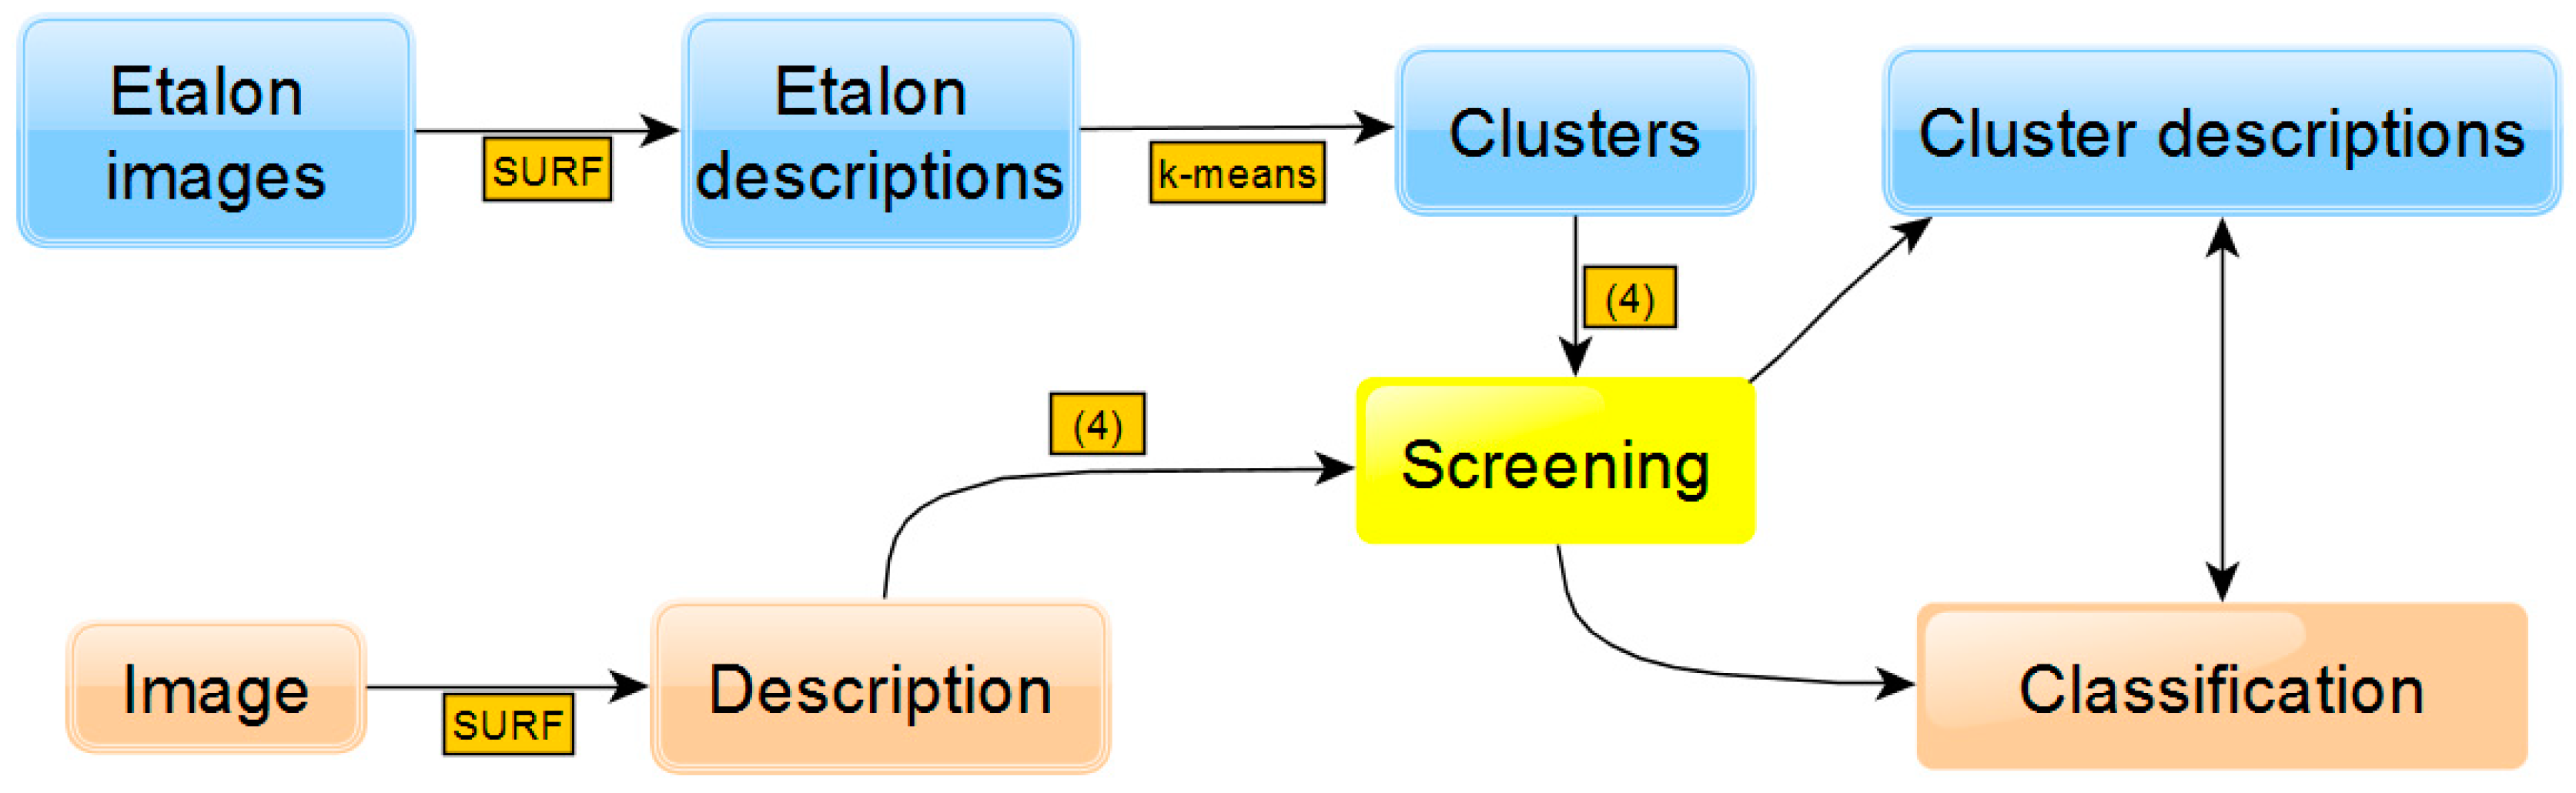
The general scheme of the approach is shown in Figure 1. The upper part contains the stages of preliminary etalon image preprocessing, which include the formation of a set of descriptors (based on SURF), clustering (based on k-means) and screening, Equation (4), which forms the descriptions of clusters. In the lower part of Figure 1, the stages of input image recognition are presented: formation of descriptors, screening with Equation (4) through etalon clusters and classification based on the comparison (minimization of distance) of cluster descriptions with input one.
4. Experiment Section
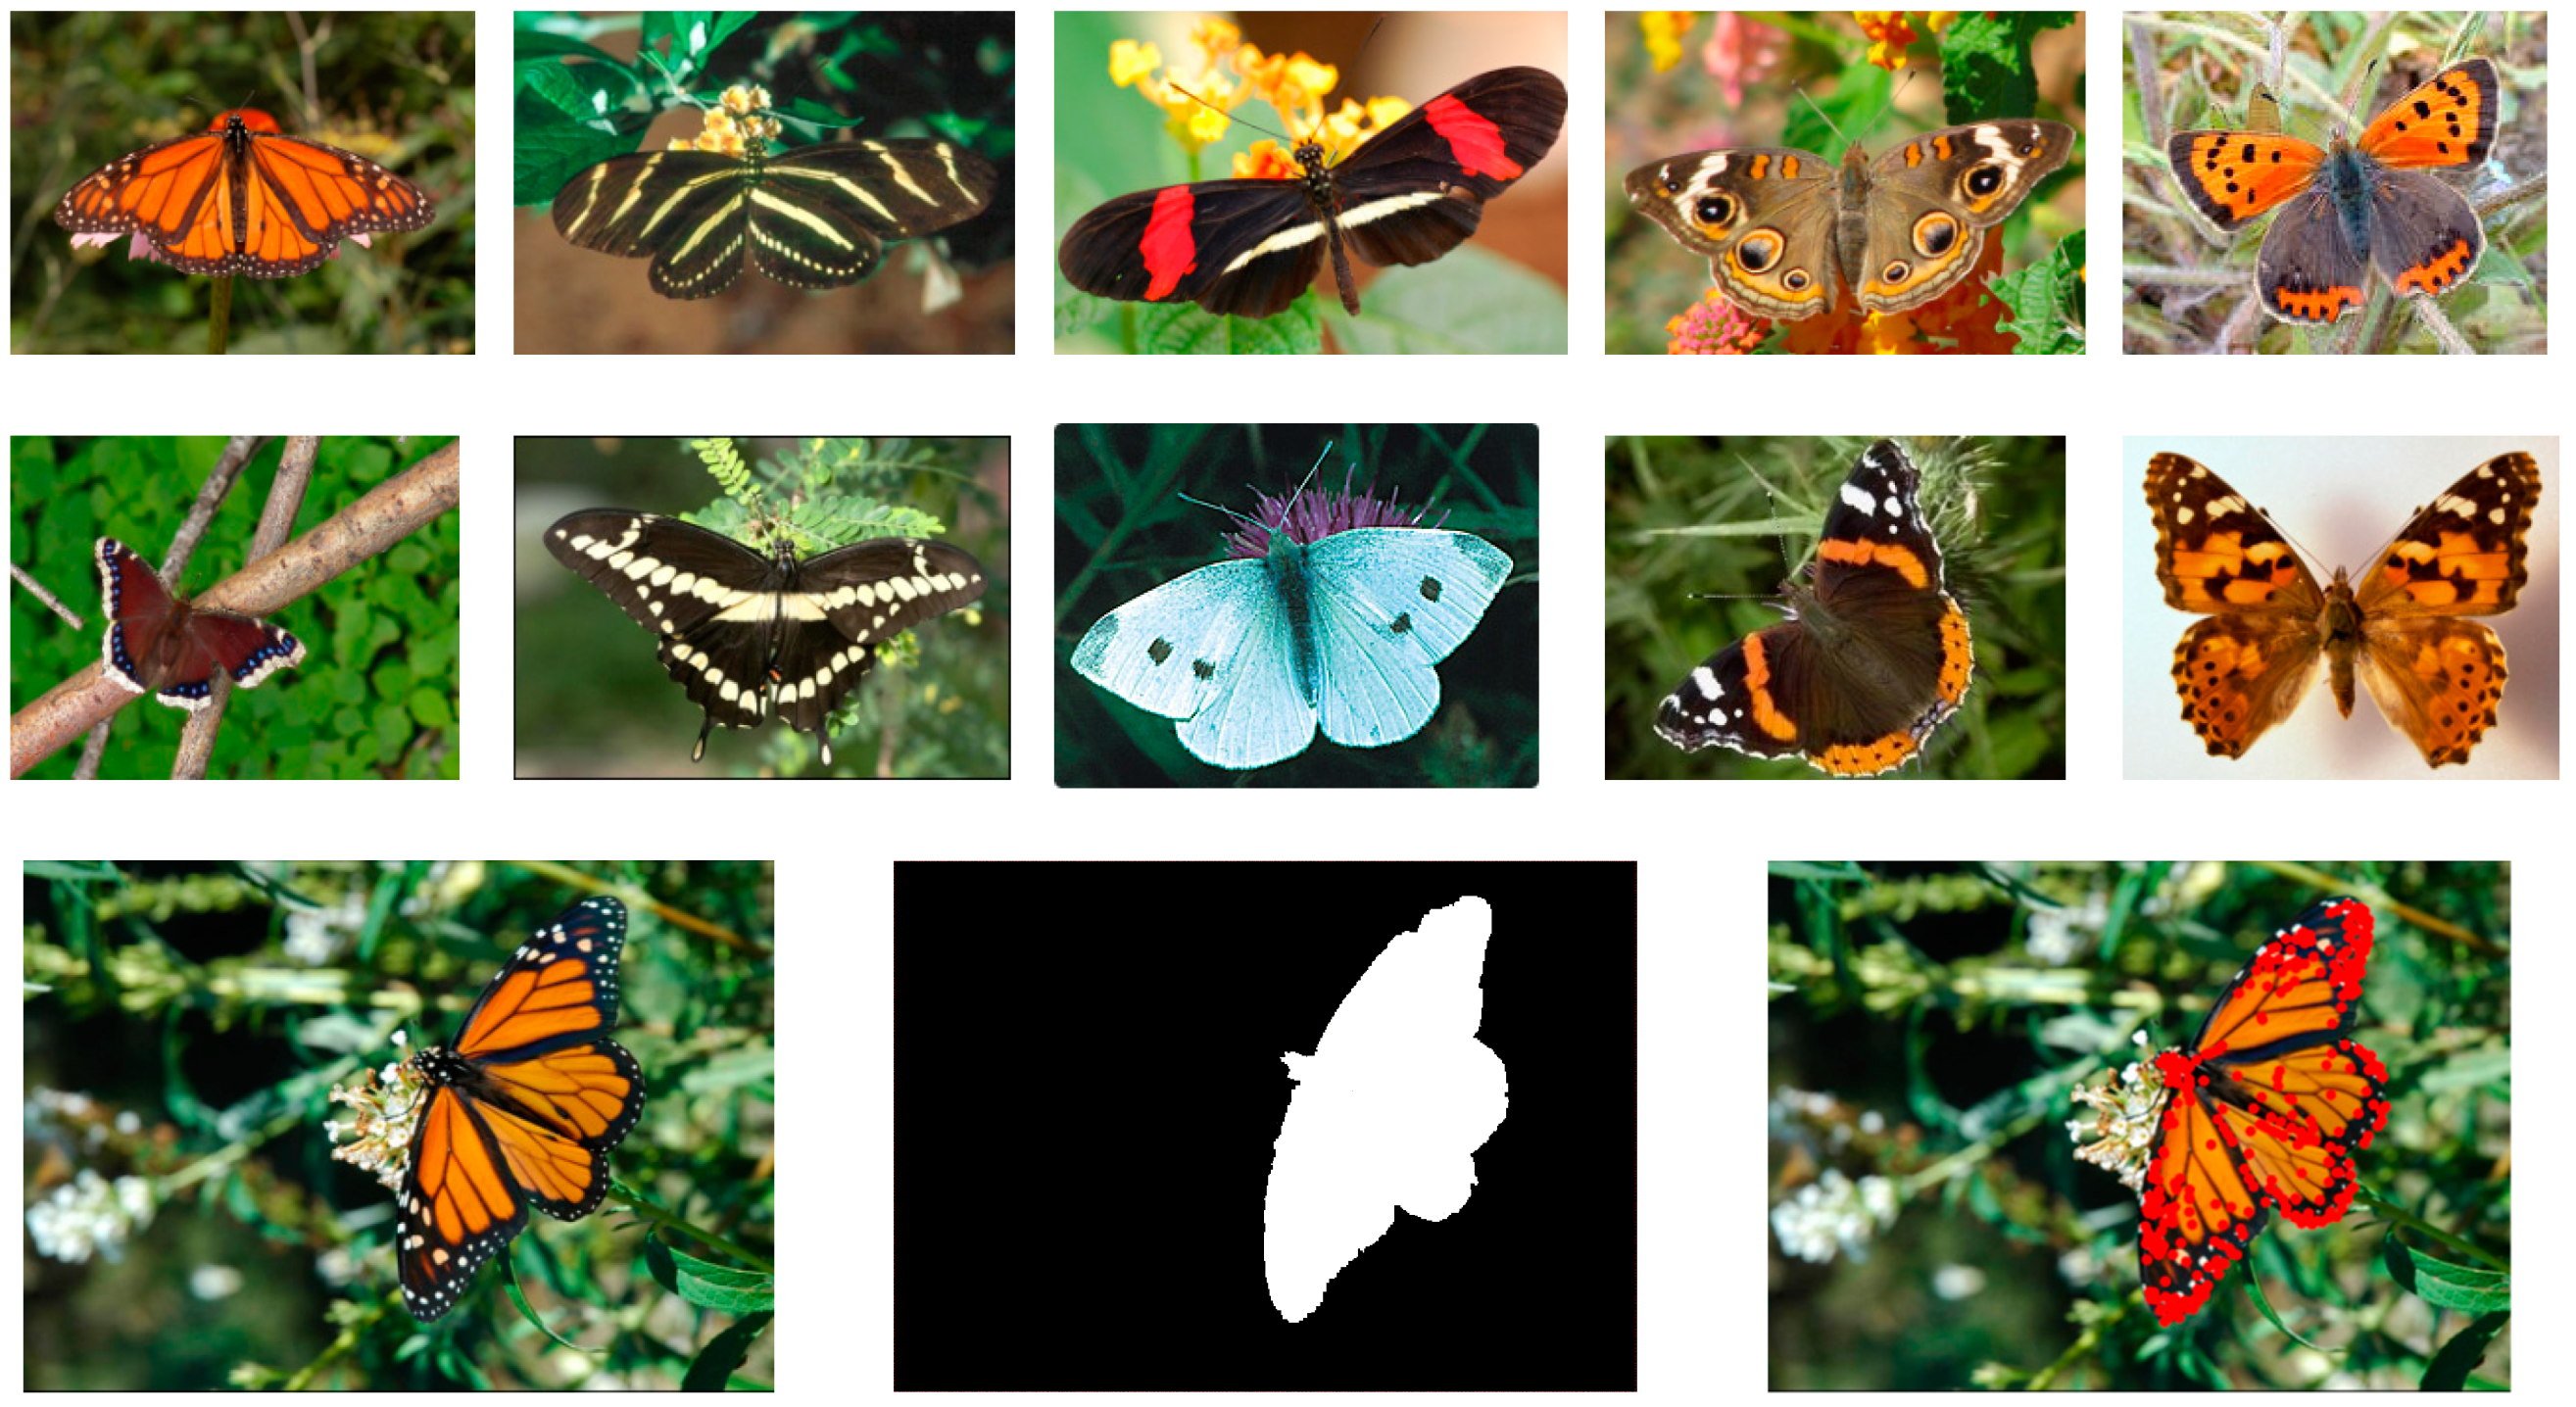
Modeling and experimental investigations were performed on Leeds Butterfly [20,21] dataset, which contains 832 images of 10 butterfly species (55–100 images of representatives of each class), text descriptions of classes (not used in modeling) and a binary mask for each image that displayed the localization of the points of the foreground butterfly object. All the sizes of the initial images were preserved. Figure 2 shows an example of one image for each of the 10 classes, an image of one of the etalons and the form of its binary mask; the coordinates of SURF key points are shown as red dots on the last image.
Two-fold cross-validation was used during modeling, in which the existing set of images was randomly divided into training and test subsets of the nearly same size. When training was complete and verified on the test subset, the substitution was performed—the training subset became the test subset and vice versa. The results of these two experiments were aggregated (averaged) and repeated for different random partitions. Thus, each image during the experiment was involved in either the learning or the validation process.
The implementation stages included -means clustering on a set of etalon CF with an experimentally determined effective number of clusters, , and screening of each pattern according to Equation (4) with subsequent normalization of (using division by ). The screening based on Equation (4), formation of vector and its normalization were also performed for each input image, after which a class from the closest (in terms of minimum distance) etalon description vector was determined. The Euclidean distance was chosen as the metric.
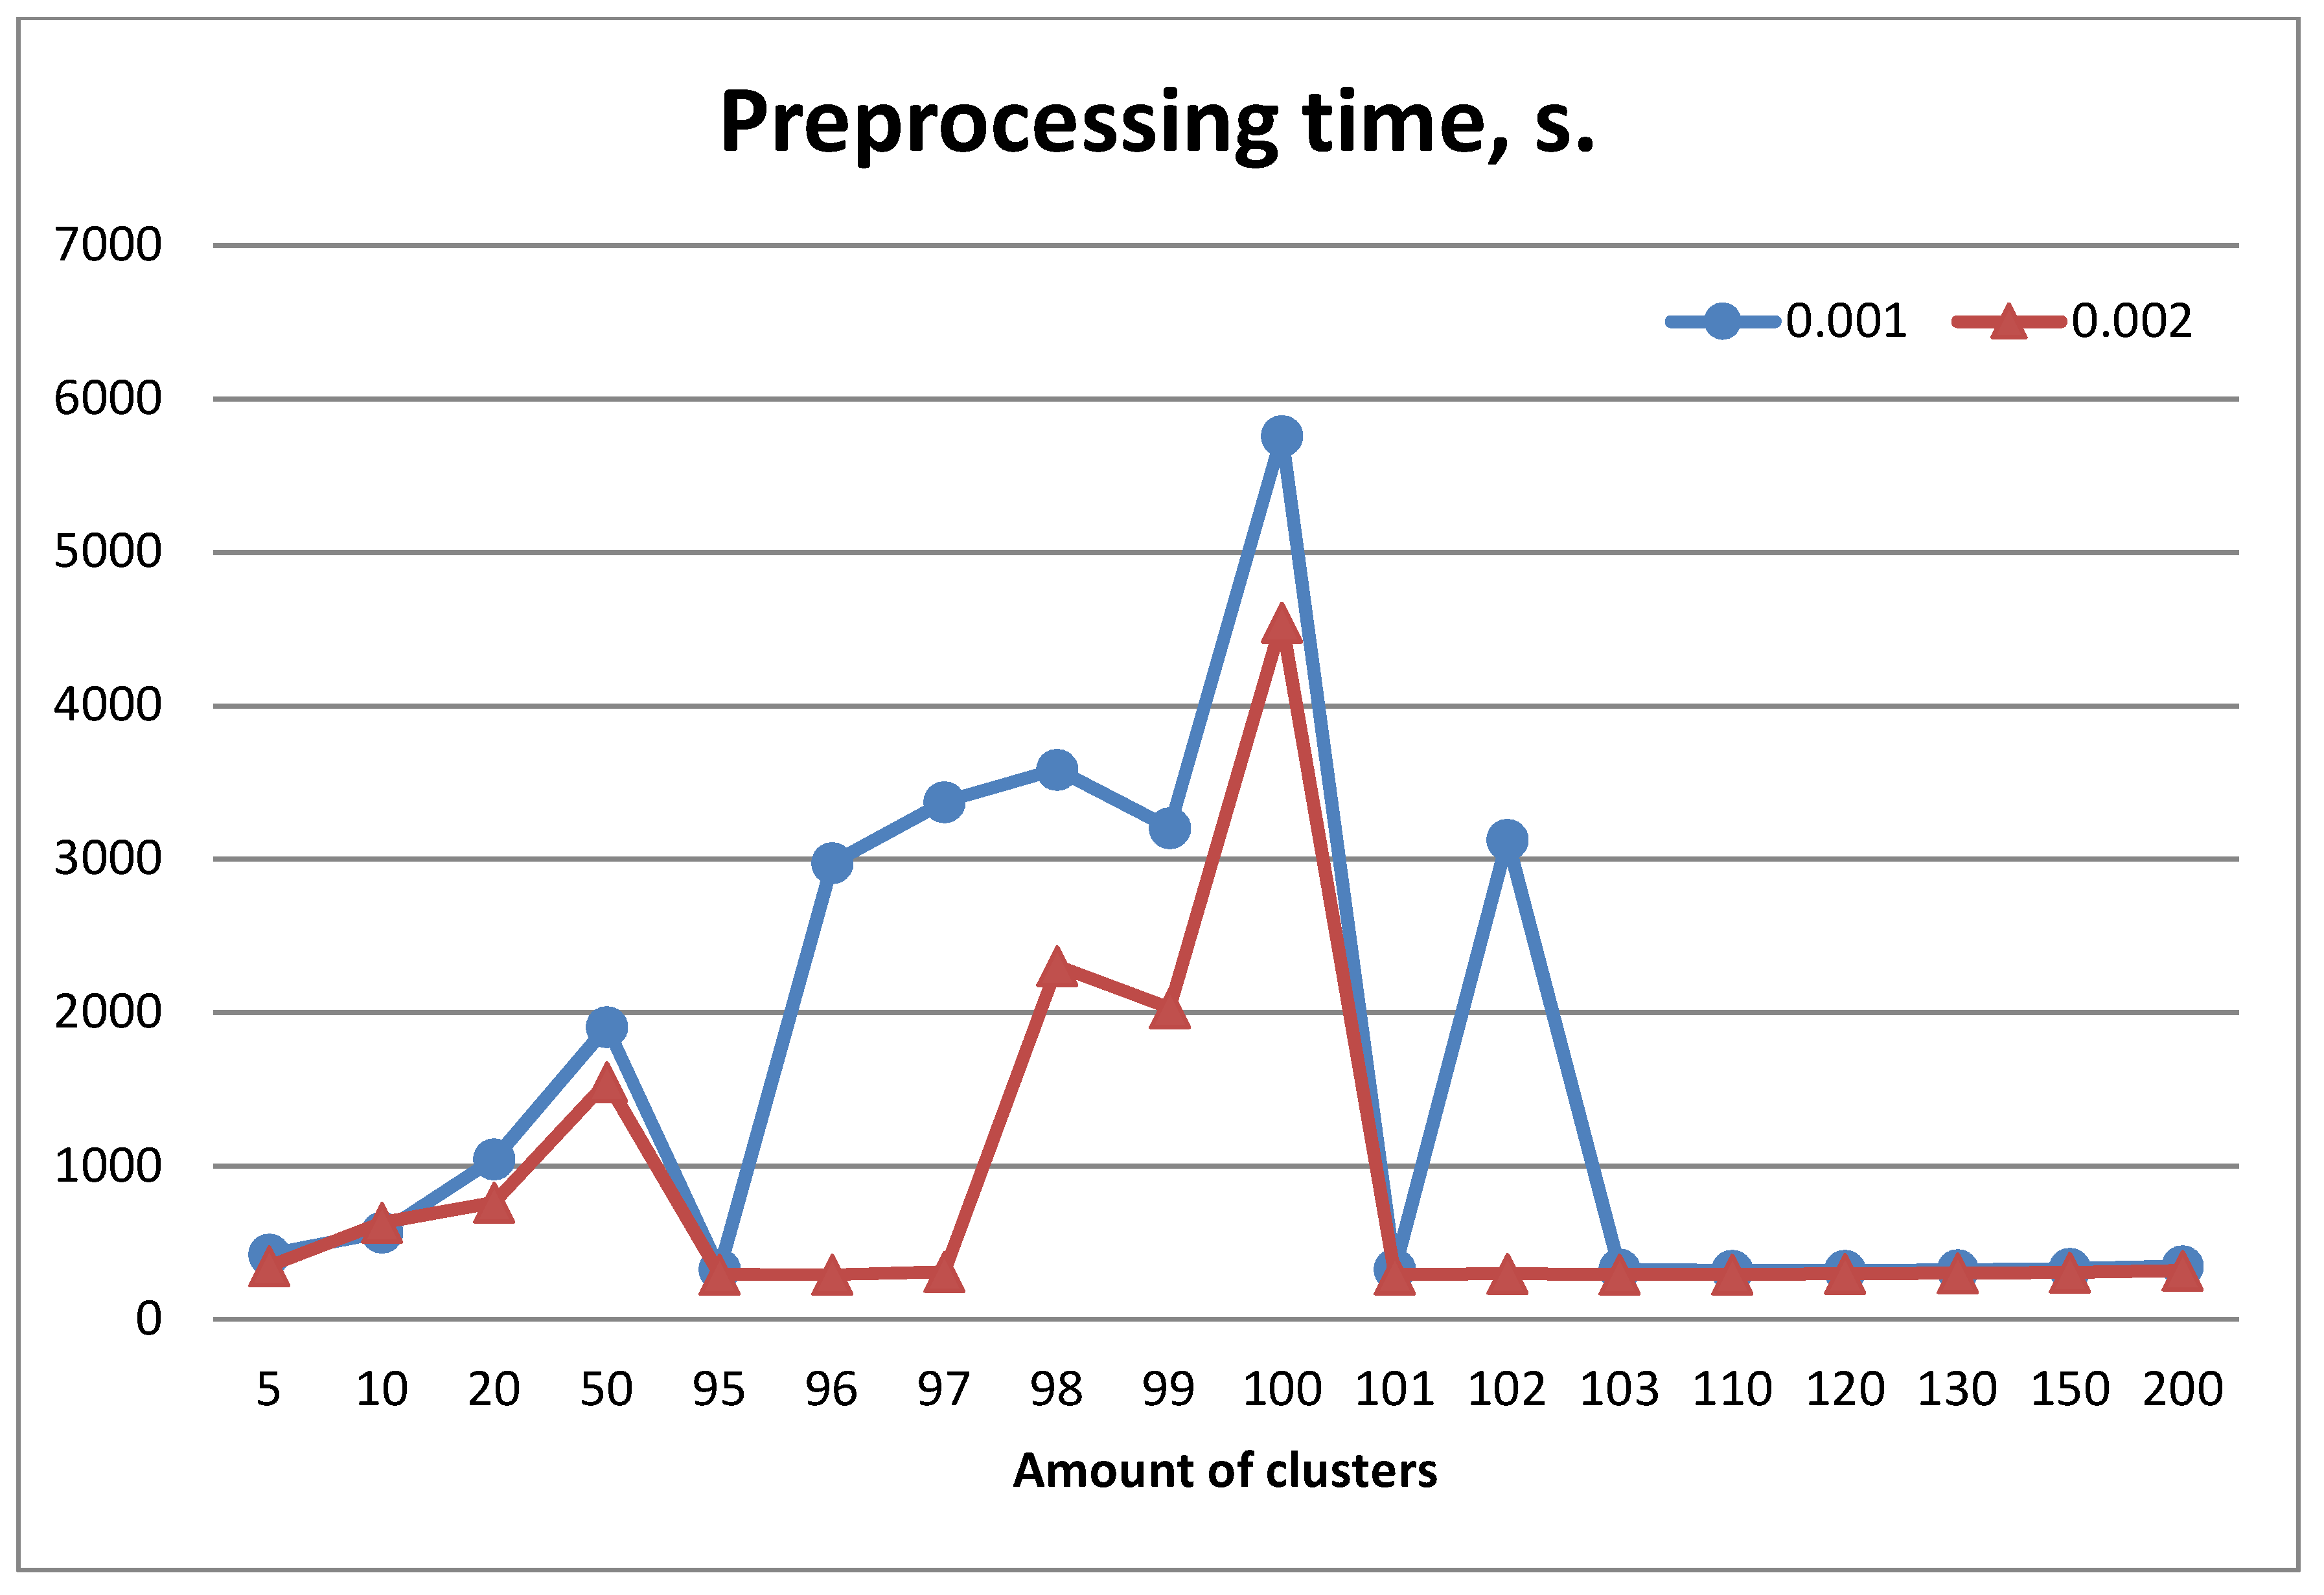
Figure 3 shows the dependence of the average preprocessing time (including the clustering time) on the number of clusters on a random partition of the entire image set. Modeling was performed using two different thresholds, and , which regulate the required minimal level of response of SURF descriptors. The average number of descriptors per image on the thresholds and was 233 and 164 respectively. Clustering was performed quickly. The total amount of features was about 77,000 for and 55,000 for respectively.
One can see that some clustering cases (e.g., k = 100) required much more time compared to other cases.
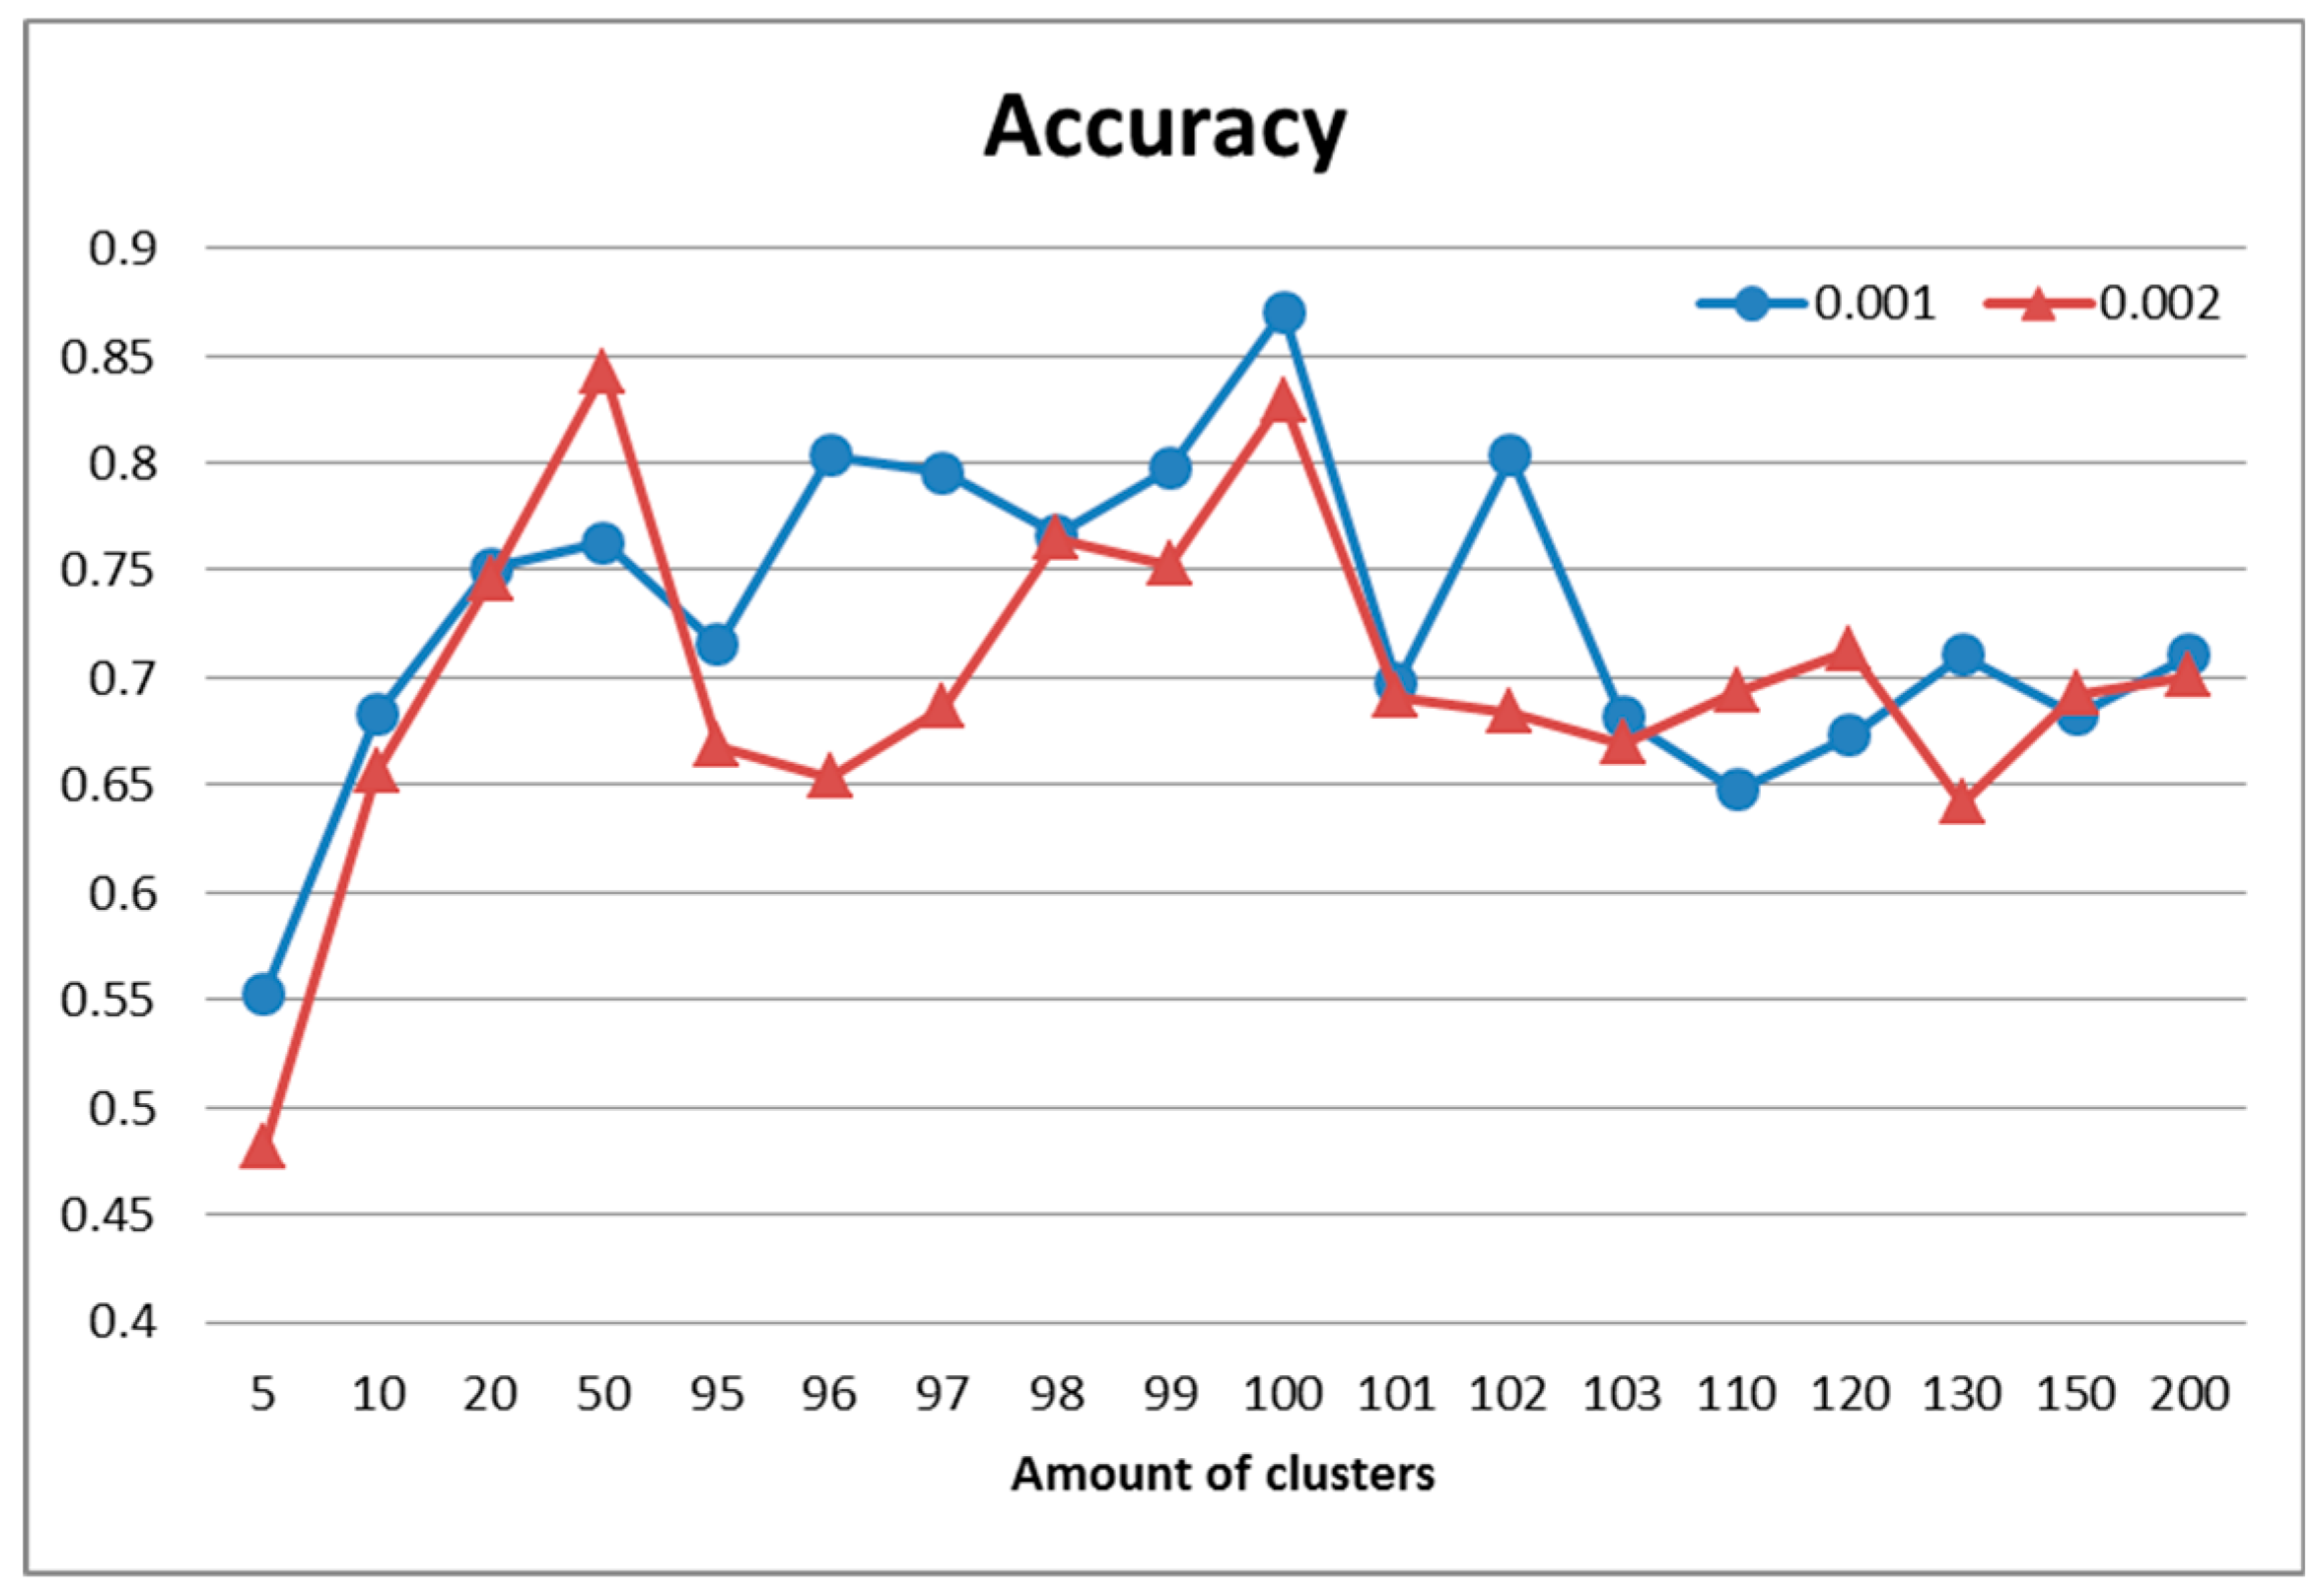
The best result in terms of recognition accuracy (Figure 4) for this partition was 87% and was obtained using 100 clusters and a larger number of descriptors (). Moreover, the maximum values in Figure 3 correspond to the ones in Figure 4, which means that the quality of clustering directly defined recognition accuracy. Additionally, the recognition quality after clustering with a different amount of clusters (e.g., k = 10 and k = 100) may be nearly the same (in this case 65%).
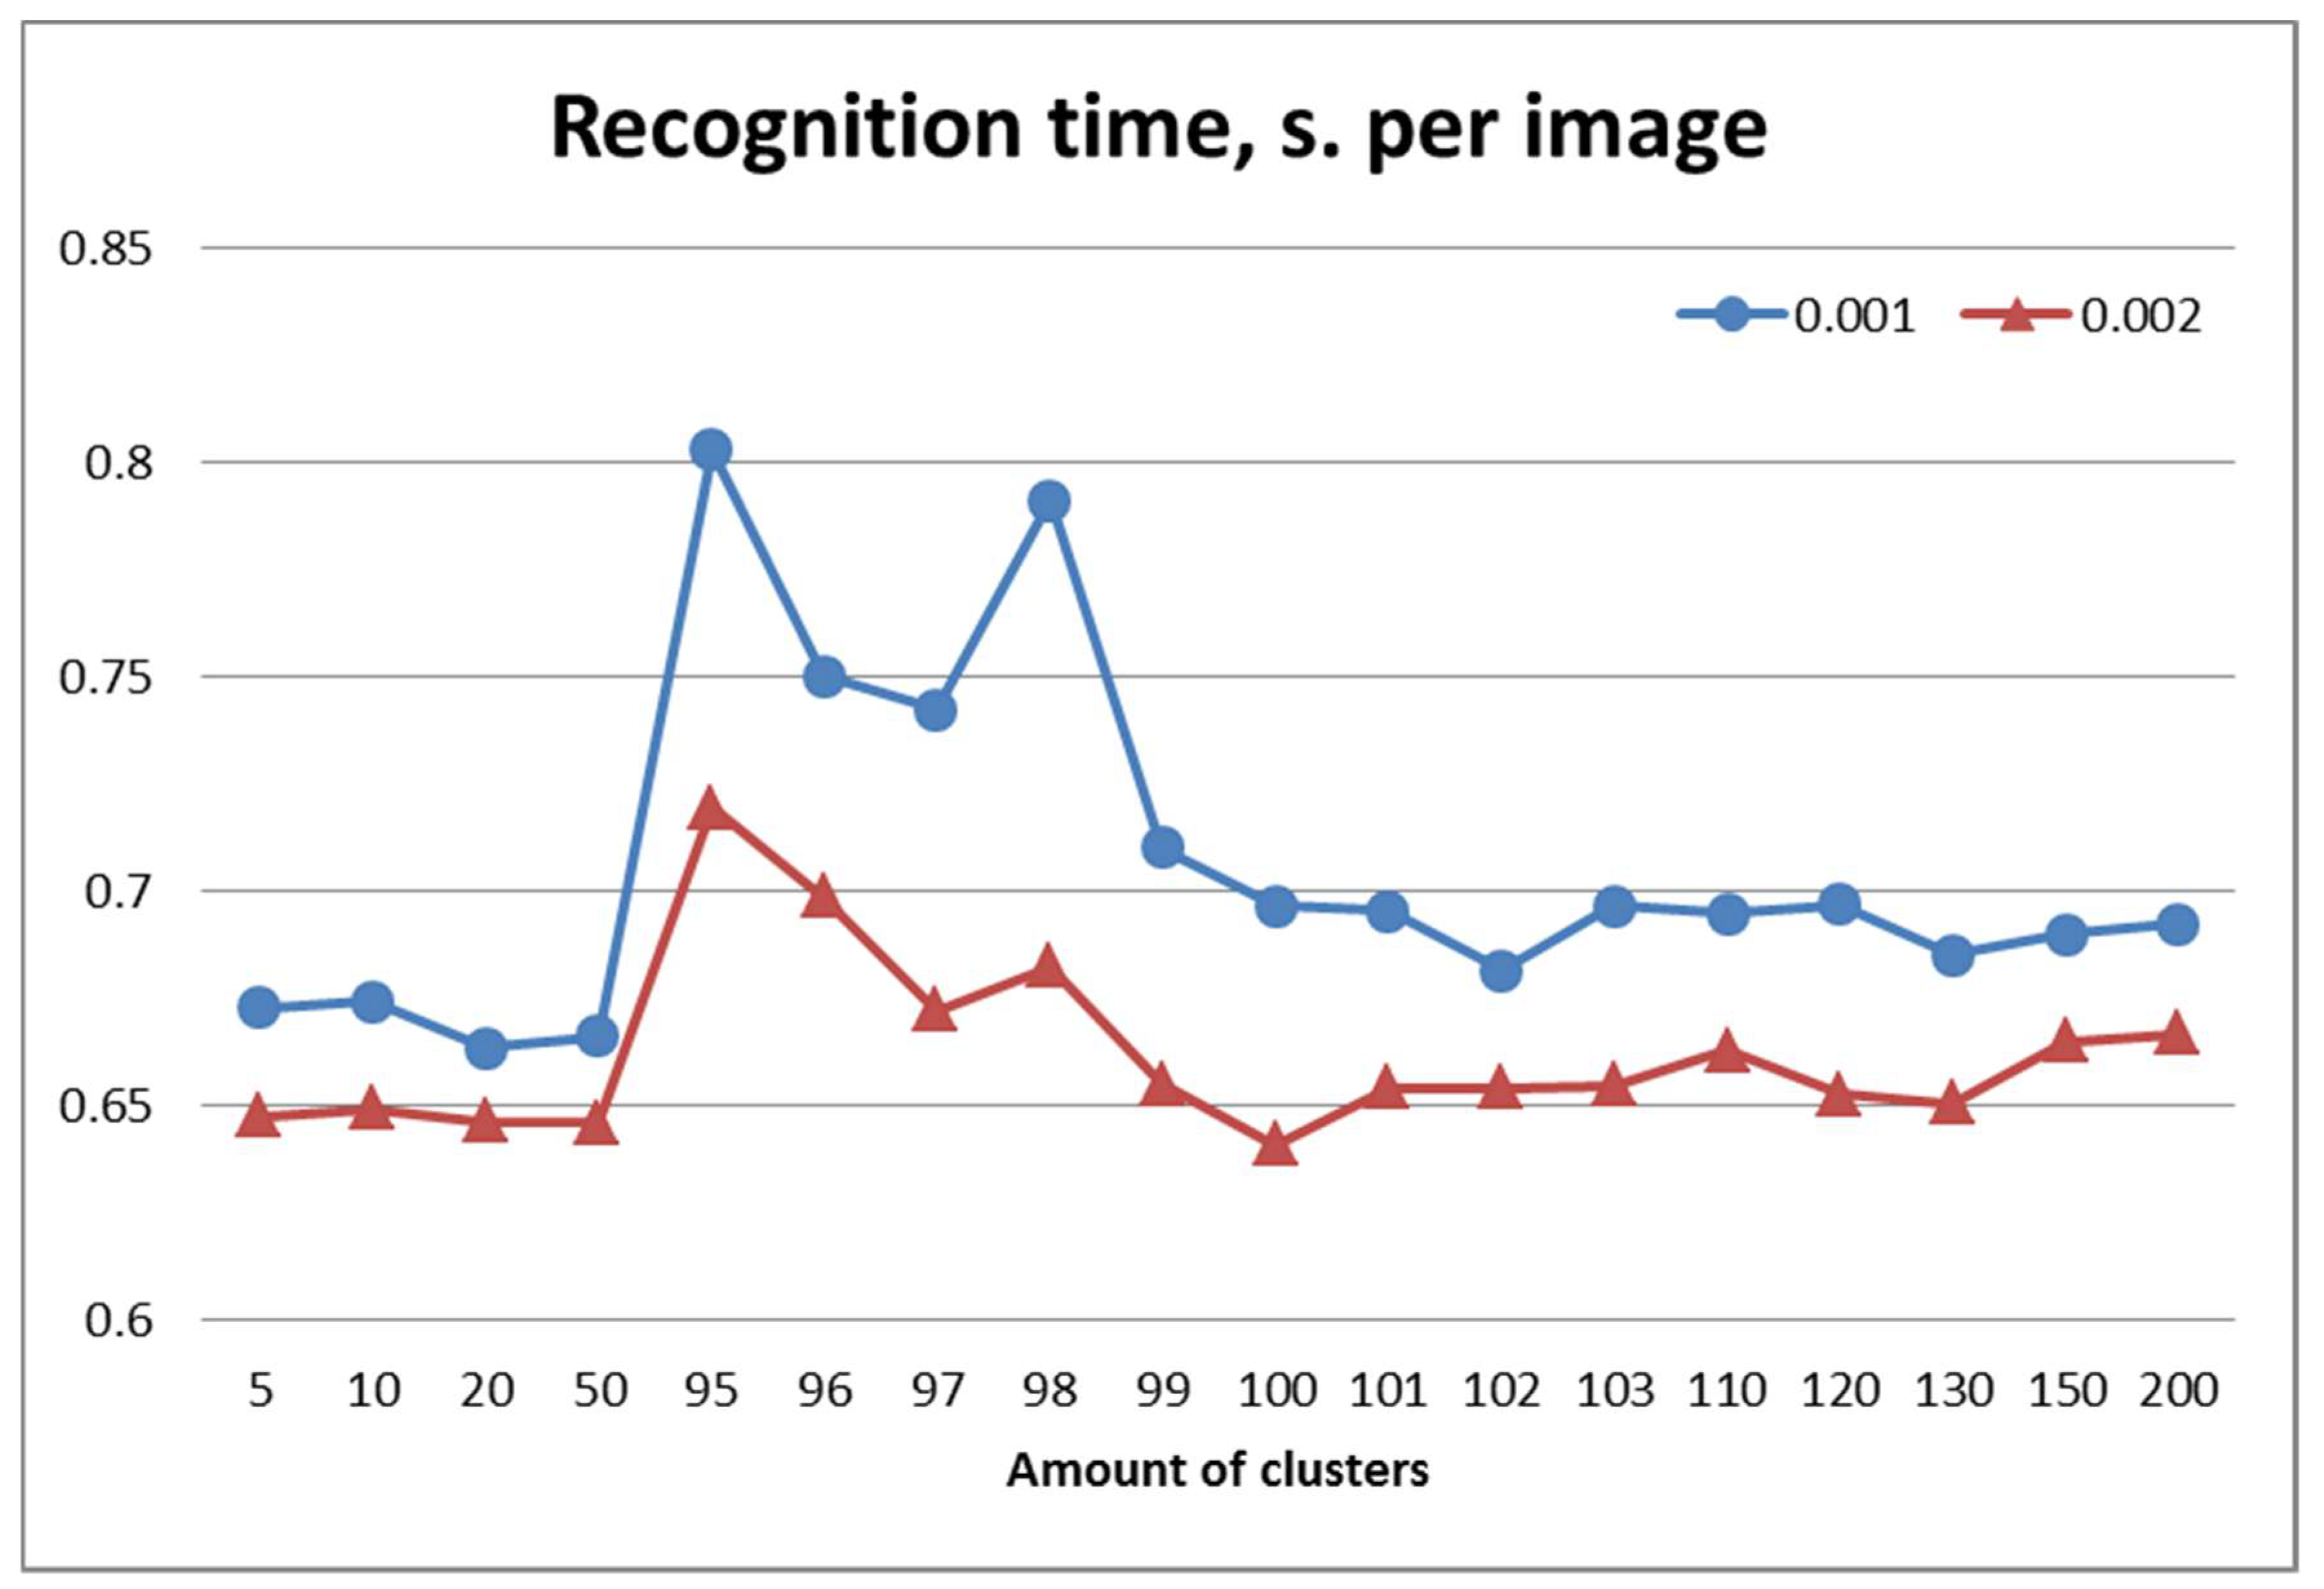
The data presented in Figure 5 show the time of full processing (including detection of characteristic points) of the image when it is recognized. It is worthwhile to note, that neither the number of descriptors nor the number of clusters significantly affected recognition time.
Let us compare the recognition properties with the ones obtained by applying the traditional method. It was implemented with the voting of each CF in the image being recognized for one of the etalon classes. This required comparison of each CF in an input image with all existing CF in etalons. A decision about etalon class was made according to the maximum number of accumulated votes. This method in our modeling was characterized by sufficiently high accuracy, an acceptable speed in the formation of the set of CF and a relatively slow recognition process, due to the number of comparisons. The preprocessing stage, in this case, only involved searching for descriptors and was executed about 20 times faster than the slowest clustering case, shown in Figure 3. The recognition accuracy was about 95% in both experiments with different threshold values for and .
Note, however, that the number of etalon CF significantly affected the recognition speed. Making decision about class of input image using threshold and traditional method is approximately six times slower compared to the described approach. Recognition with threshold is nine times slower.
Five-fold processing of the whole set of images was performed in order to make our results comparable to other published results on the Leeds Butterfly dataset. The average accuracy for a full comparison of key point descriptors is 97.19%, the average recognition time is 9.58 s per image and the average preprocessing time is 453 s. The method, based on descriptor quantization with k = 100 clusters and shows the following results: an average accuracy of 87.77%, an average recognition time of 0.68 s per image and an average preprocessing time of 15,387 s. As one can see, a fast preprocessing stage with slow recognition was swapped with a much slower (34 times) preprocessing stage with faster (14 times) recognition.
Previously published results are presented in Table 1. It is possible to achieve positive, but not state of the art, results using the clustering options we found empirically (k = 100, ).
The key factor on which recognition efficiency depends in the abovementioned approach is the distribution of descriptors over the cluster system, as well as the distribution of cluster elements within each etalon. This composition depends on the clustering method and the learning technology. On the one hand, uniform distribution across clusters provides an equivalent representation of points in the course of decision making. On the other hand, the diversity of the distribution structure, due to the predominance of the composition of some clusters over others, contributes to the improvement of the quality of distinguishing objects from their descriptions.
Concerning the comparison between the effectiveness of the use of SURF and ORB detectors, according to the results of the experiments, we note that the ORB, as a rule, released about twice as many CF, however, their dimensions were smaller (32, versus 64 for SURF). Many SURF detectors “cover” the image of the object in more detail, displaying the features of its shape, while the ORB signs are grouped tightly and often focus on the boundaries of the object. The experiments showed that the implementation of the ORB detector using OpenCV [26] and C ++ is about 10–20 times faster compared to SURF and is about 0.006 s for one image. The choice of detector is entirely determined by the requirements for the application.
5. Conclusions
Quantization of the key point feature space by clustering allowed us to reduce the dimension of the recognition problem and provide an adaptation of the recognition method to the applied dataset. The proposed constructional approach of the structural image recognition methods based on the structural description clustering and the transition to space of vectors based on cluster center has the prospect of being used because of higher speed and maintenance of a sufficient level of correct recognition. The suggested method allowed us to recognize images much faster than the traditional approach while increasing the time of one-time preprocessing and slightly reducing recognition accuracy. Performance increased when the amount of CF and etalons grew.
The difficulties of the approach relate to the necessity of searching for an effective number of clusters and implementing high-quality clustering, which was confirmed by the experiments detailed above.
Further development of the described approach can be achieved with the construction of a cluster system and the implementation of training procedures within each etalon image. This should provide a better account of their unique properties and improve the degree of separation between visual objects being processed. Prospective research in this area may also be related to the possibility of making a decision based not on the single minimum value of distance, but on the basis of the closest similar classes voting.
Another topic of research for image datasets with multiple etalons of a single class is that of the investigation and extraction of the most significant properties by analyzing the set of representatives of a particular class. A single image of the class can be constructed based on the whole set of such representatives. After analysis of the Leeds Butterfly database, we saw that the amount of images per class varied, between 55 and 100, which blurred information in the feature space. Moreover, it increased the intersection of areas of image descriptions from different classes. In situations where the etalon was represented by a single image, the recognition accuracy for the matching of all key point features and the proposed method was nearly the same [4,6].
Author Contributions
Conceptualization, V.G.; methodology, O.G. and O.P.; software, O.G.; validation, O.G., V.G. and O.P.; formal analysis, V.G.; investigation, O.G., V.G. and O.P.; resources, O.G.; data curation, O.G. and O.P.; writing and original draft preparation, O.G., V.G. and O.P.; writing, review and editing, O.G., V.G. and O.P.; visualization, O.G.; supervision, V.G.; project administration, O.G. and V.G.
Funding
This research received no external funding.
Conflicts of Interest
The authors declare no conflicts of interest.
References
- Gorokhovatsky, V. Structural Analysis and Intellectual Data Processing in Computer Vision; SMIT: Kharkiv, Ukraine, 2014. [Google Scholar]
- Bay, H.; Tuytelaars, T.; Van Gool, L. Surf: Speeded up Robust Features. In Proceedings of the European Conference of Computer Vision, Graz, Austria, 7–13 May 2006; pp. 404–417. [Google Scholar] [CrossRef]
- Gorokhovatsky, V. Efficient Estimation of Visual Object Relevance during Recognition through their Vector Descriptions. Telecommun. Radio Eng. 2016, 75, 1271–1283. [Google Scholar] [CrossRef]
- Gorokhovatskyi, V.; Putyatin, Y.; Gorokhovatskyi, O.; Peredrii, O. Quantization of the Space of Structural Image Features as a Way to Increase Recognition Performance. In Proceedings of the Second IEEE International Conference on DataStream Mining & Processing (DSMP-2018), Lviv, Ukraine, 21–25 August 2018; pp. 464–467. [Google Scholar] [CrossRef]
- Szeliski, R. Computer Vision: Algorithms and Applications; Springer: London, UK, 2010. [Google Scholar]
- Gorokhovatskyi, V. Image classification methods in the space of descriptions in the form of a set of the key point descriptors. Telecommun. Radio Eng. 2018, 77, 787–797. [Google Scholar] [CrossRef]
- Gorokhovatskyi, O.; Peredrii, O. Shallow Convolutional Neural Networks for Pattern Recognition Problems. In Proceedings of the Second IEEE International Conference on DataStream Mining & Processing (DSMP-2018), Lviv, Ukraine, 21–25 August 2018; pp. 459–463. [Google Scholar] [CrossRef]
- Amit, Y. 2D Object Detection and Recognition: Models, Algorithms and Networks; The MIT Press: Cambridge, MA, USA, 2002. [Google Scholar]
- Sonka, M.; Hlavac, V.; Boyle, R. Image Processing, Analysis and Machine Vision; Thomson: Toronto, ON, Canada, 2008. [Google Scholar]
- Rublee, E.; Rabaud, V.; Konolige, K.; Bradski, G. ORB: An Efficient Alternative to SIFT or SURF. Available online: http://www.willowgarage.com/sites/default/files/orb_final.pdf (accessed on 29 September 2018).
- Karami, E.; Prasad, S.; Shehata, M. Image Matching Using SIFT, SURF, BRIEF and ORB: Performance Comparison for Distorted Images. Available online: https://arxiv.org/ftp/arxiv/papers/1710/1710.02726.pdf (accessed on 29 September 2018).
- Lazebnik, S.; Schmid, C.; Ponce, J. Beyond Bags of Features: Spatial Pyramid Matching for Recognizing Natural Scene Categories. In Proceedings of the IEEE Computer Society Conference on Computer Vision and Pattern Recognition (CVPR’06), New York, USA, 17–22 June 2006; pp. 2169–2178. [Google Scholar] [CrossRef]
- Mahmud, H.; Hasan, M.K.; Abdullah-Al-Tariq; Mottalib, M.A. Hand Gesture Recognition Using SIFT Features on Depth Image. In Proceedings of the Ninth International Conference on Advances in Computer-Human Interactions (IARIA-2016), Venice, Italy, 24–26 April 2016; pp. 359–365. [Google Scholar]
- Thomee, B.; Bakker, E.M.; Lew, M.S. TOP-SURF: A Visual Words Toolkit. In Proceedings of the 18th International Conference on Multimedea, Firenze, Italy, 25–29 October 2010; pp. 1473–1476. [Google Scholar] [CrossRef]
- Lin, S.D.; Liu, B.-F.; Lin, J.-H. Combining speeded-up robust features with principal component analysis in face recognition system. Int. J. Innov. Comput. Inf. Control 2012, 8, 8545–8556. [Google Scholar]
- Zong, Z. Efficient Human Face Recognition Method under Subtle SIFT Features Using Optimized K-means. Int. J. Signal Process. Image Process. Pattern Recognit. 2017, 10, 195–204. [Google Scholar] [CrossRef]
- Leibe, B.; Mikolajczyk, K.; Schiele, B. Efficient clustering and matching for object class recognition. In Proceedings of the British Machine Vision Conference (BMVC-2006), Edinburgh, UK, 4–7 September 2006; pp. 81.1–81.10. [Google Scholar] [CrossRef]
- Grycuk, R. Novel Visual Object Descriptor Using SURF and Clustering Algorithms. J. Appl. Math. Comput. Mech. 2016, 15, 37–46. [Google Scholar] [CrossRef]
- Seib, V.; Kusenbach, M.; Thierfelder, S. Dietrich Paulus Object Recognition Using Hough-transform Clustering of SURF Features. In Proceedings of the Scientific Cooperations International Workshops on Electrical and Computer Engineering Subfields, Istanbul, Turkey, 22–23 August 2014; Available online: http://conf-scoop.org/IWIP-2014/4.V.Seib_IWIP.pdf (accessed on 26 October 2018).
- Wang, J.; Markert, K.; Everingham, M. Learning Models for Object Recognition from Natural Language Descriptions. In Proceedings of the British Machine Vision Conference (BMVC-2009), London, UK, 7–10 September 2009; pp. 1–11. [Google Scholar]
- Kohonen, T. Self-Organizing Maps; Springer: Berlin, Germany, 2001. [Google Scholar]
- Osovski, S. Sieci Neuronovane do Przetwarzania Informacji; Oficyna Wydawnicza Politechniki Warszawskiej: Warsaw, Poland, 2000. [Google Scholar]
- Mottos, A.B.; Feris, R.S. Fusing Well-crafted Feature Descriptors for Efficient Fine-grained Classification. In Proceedings of the IEEE International Conference on Image Processing (ICIP), Paris, France, 27–30 October 2014. [Google Scholar]
- Li, Z.; Gavves, E.; Mensink, T.; Snoek, C.G.M. Attributes make sense on segmented objects. In Proceedings of the European Conference on Computer Vision, Zurich, Switzerland, 6–12 September 2014; pp. 350–365. [Google Scholar] [CrossRef]
- Sharma, G.; Schiele, B. Scalable Nonlinear Embeddings for Semantic Category-based Image Retrieval. In Proceedings of the IEEE International Conference on Computer Vision (ICCV), Santiago, Chile, 7–13 December 2015. [Google Scholar]
- OpenCV Library. Available online: http://opencv.org (accessed on 29 September 2018).
Figure 1.
Recognition based on a system of clusters scheme.

Figure 2.
Examples of images from the dataset [20], a mask for arbitrary image and coordinates of the detected SURF characteristic features (red dots).
Figure 2.
Examples of images from the dataset [20], a mask for arbitrary image and coordinates of the detected SURF characteristic features (red dots).

Figure 3.
Dependence of preprocessing time on the quantity of clusters.

Figure 4.
Dependence of recognition accuracy on the quantity of clusters.

Figure 5.
Dependence of recognition performance on the quantity of clusters.


© 2018 by the authors. Licensee MDPI, Basel, Switzerland. This article is an open access article distributed under the terms and conditions of the Creative Commons Attribution (CC BY) license (http://creativecommons.org/licenses/by/4.0/).
Share and Cite
MDPI and ACS Style
Gorokhovatskyi, O.; Gorokhovatskyi, V.; Peredrii, O. Analysis of Application of Cluster Descriptions in Space of Characteristic Image Features. Data 2018, 3, 52. https://doi.org/10.3390/data3040052
AMA Style
Gorokhovatskyi O, Gorokhovatskyi V, Peredrii O. Analysis of Application of Cluster Descriptions in Space of Characteristic Image Features. Data. 2018; 3(4):52. https://doi.org/10.3390/data3040052
Chicago/Turabian StyleGorokhovatskyi, Oleksii, Volodymyr Gorokhovatskyi, and Olena Peredrii. 2018. "Analysis of Application of Cluster Descriptions in Space of Characteristic Image Features" Data 3, no. 4: 52. https://doi.org/10.3390/data3040052