An Evaluation of the Information Technology of Gene Expression Profiles Processing Stability for Different Levels of Noise Components †

Abstract
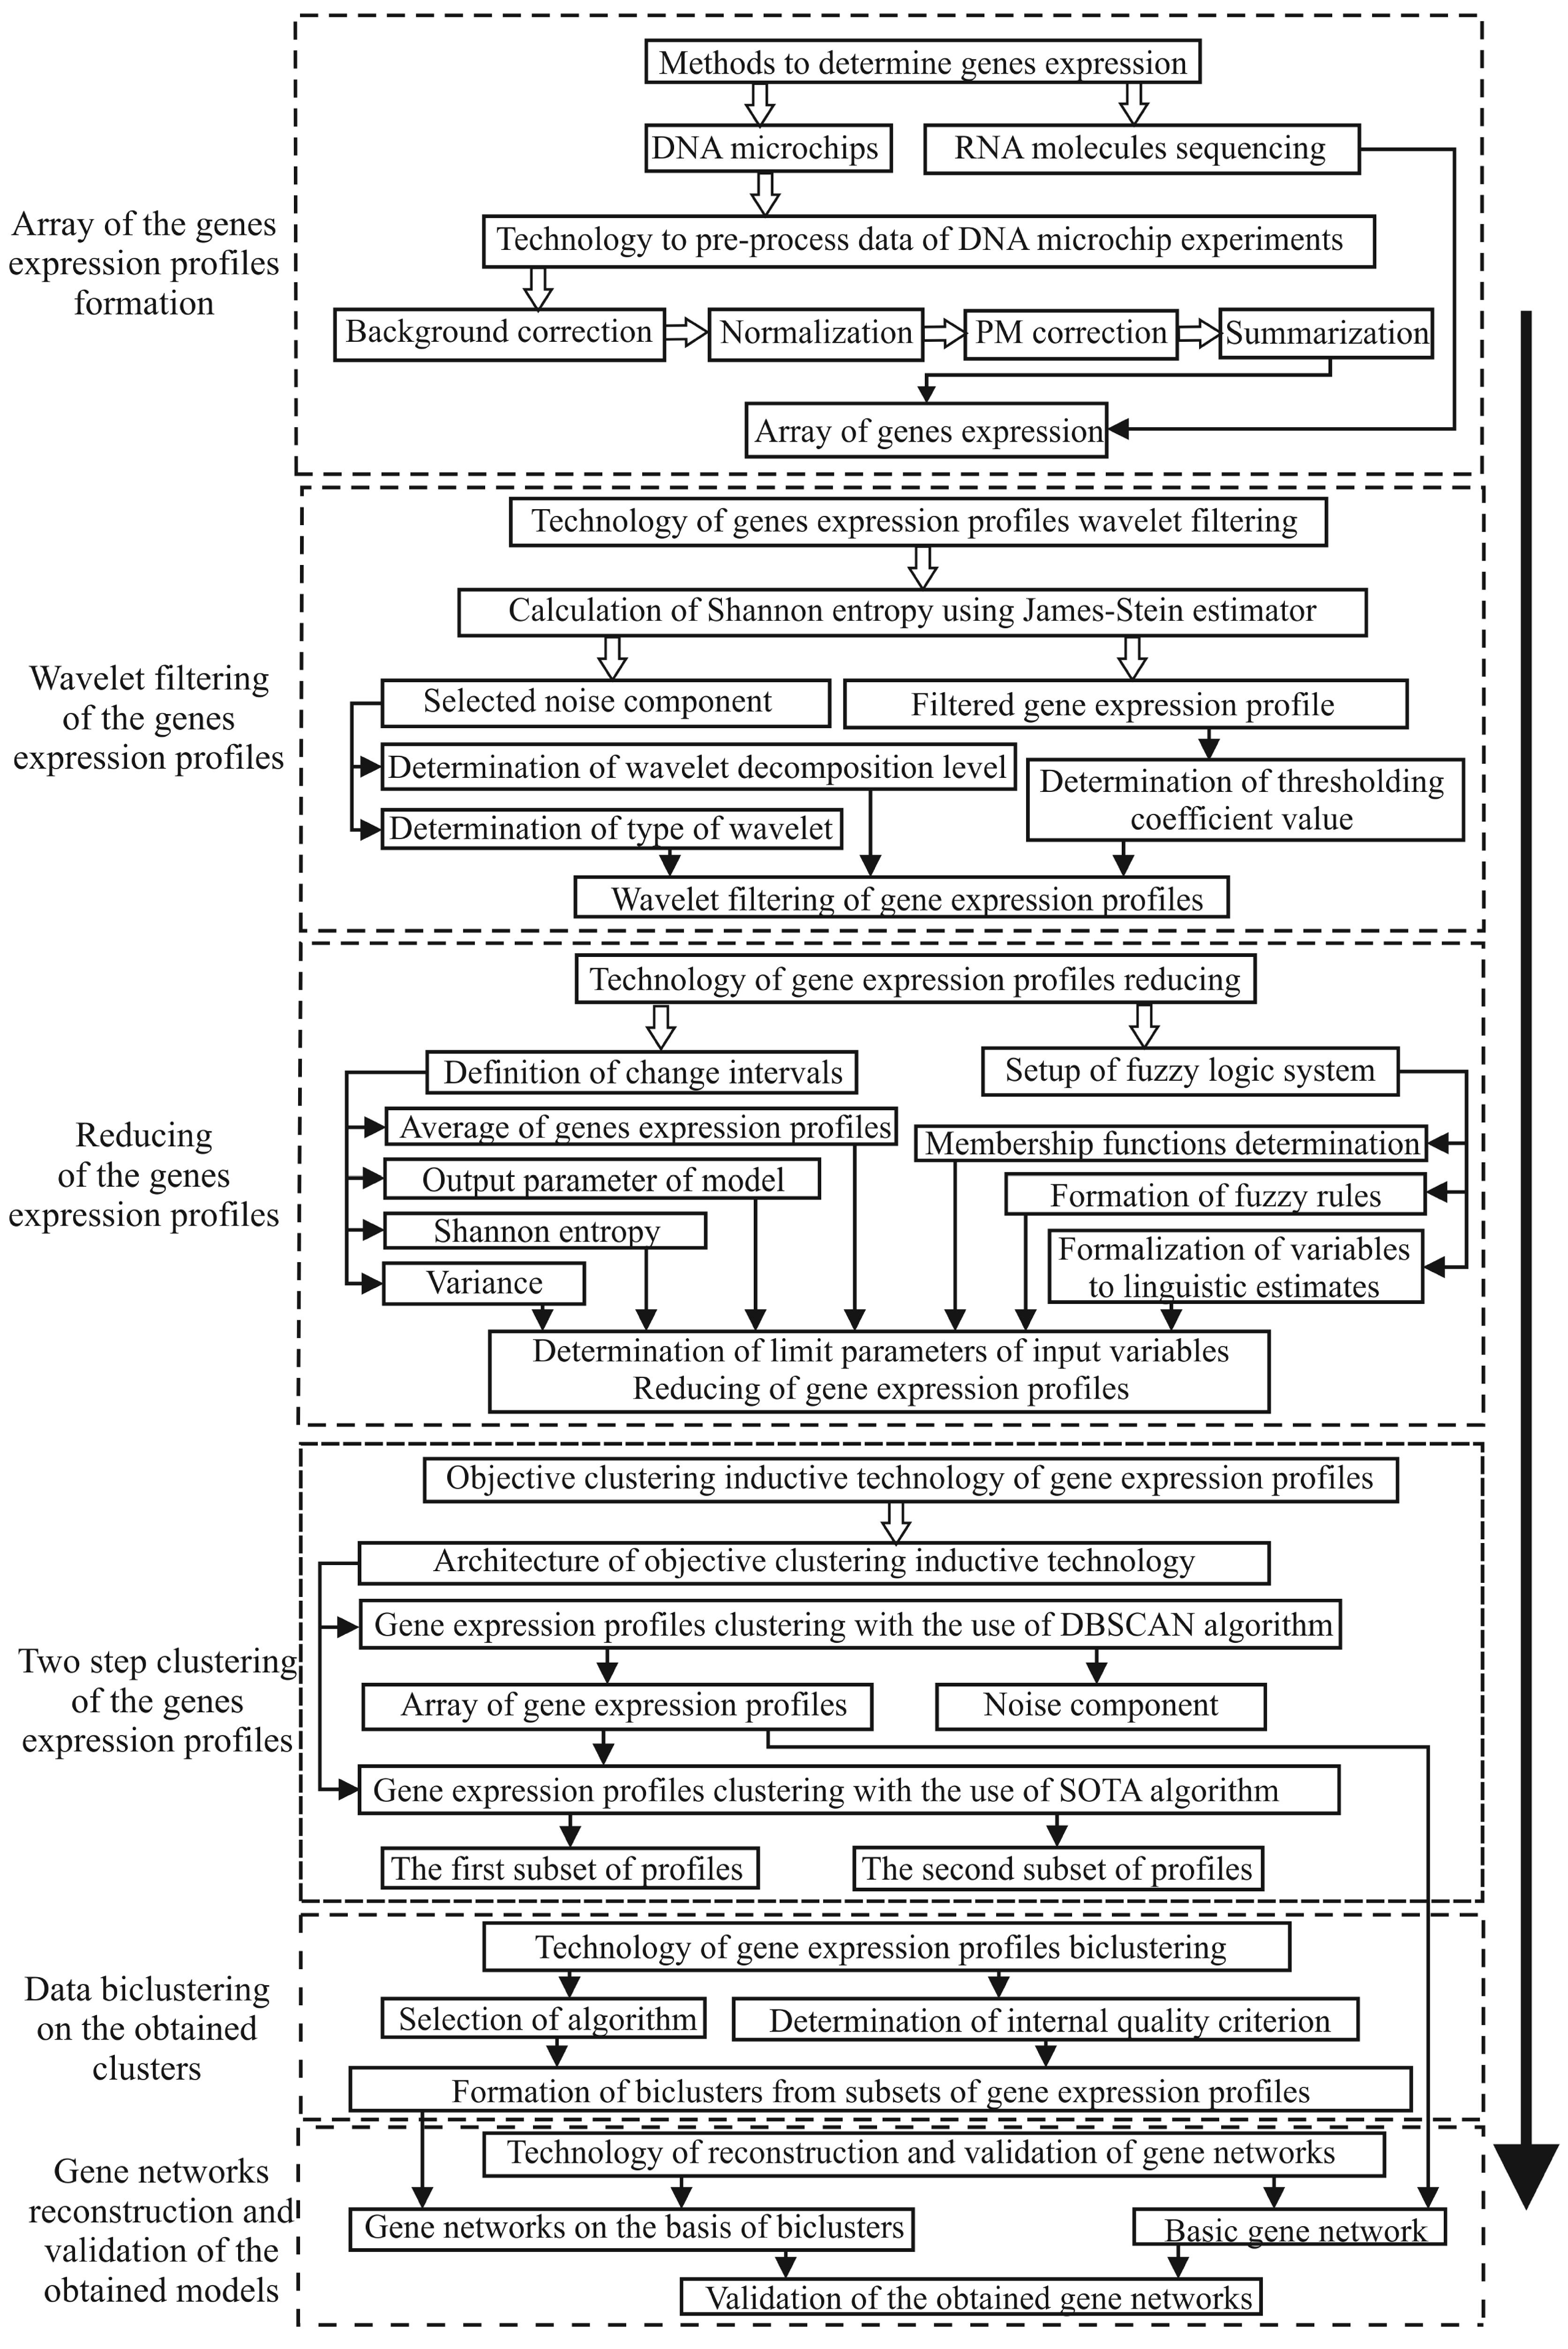
:1. Introduction
2. Materials and Methods
2.1. The Evaluation of the Stability of the Objective Clustering Inductive Model Based on the SOTA Algorithm to the Level of the Noise Component
- Generation of random values vector. The length of this vector is equal to the length of the studied gene expression profiles and its amplitude corresponds to the minimum value of the studied data gene expression (“white noise”).
- Setup of the vector of coefficients to change the amplitude of the noise component. In the case of the studied gene expression profiles the values of coefficients were changed within the range from 0.2 to 4 with step 0.2. These parameters were determined empirically during the simulation process.
- Formation of gene expression profiles with the noise by adding of the appropriate noise components to the studied gene expression profiles.
- Division of the obtained data into two equal power subsets by the use of the algorithm presented in [21].
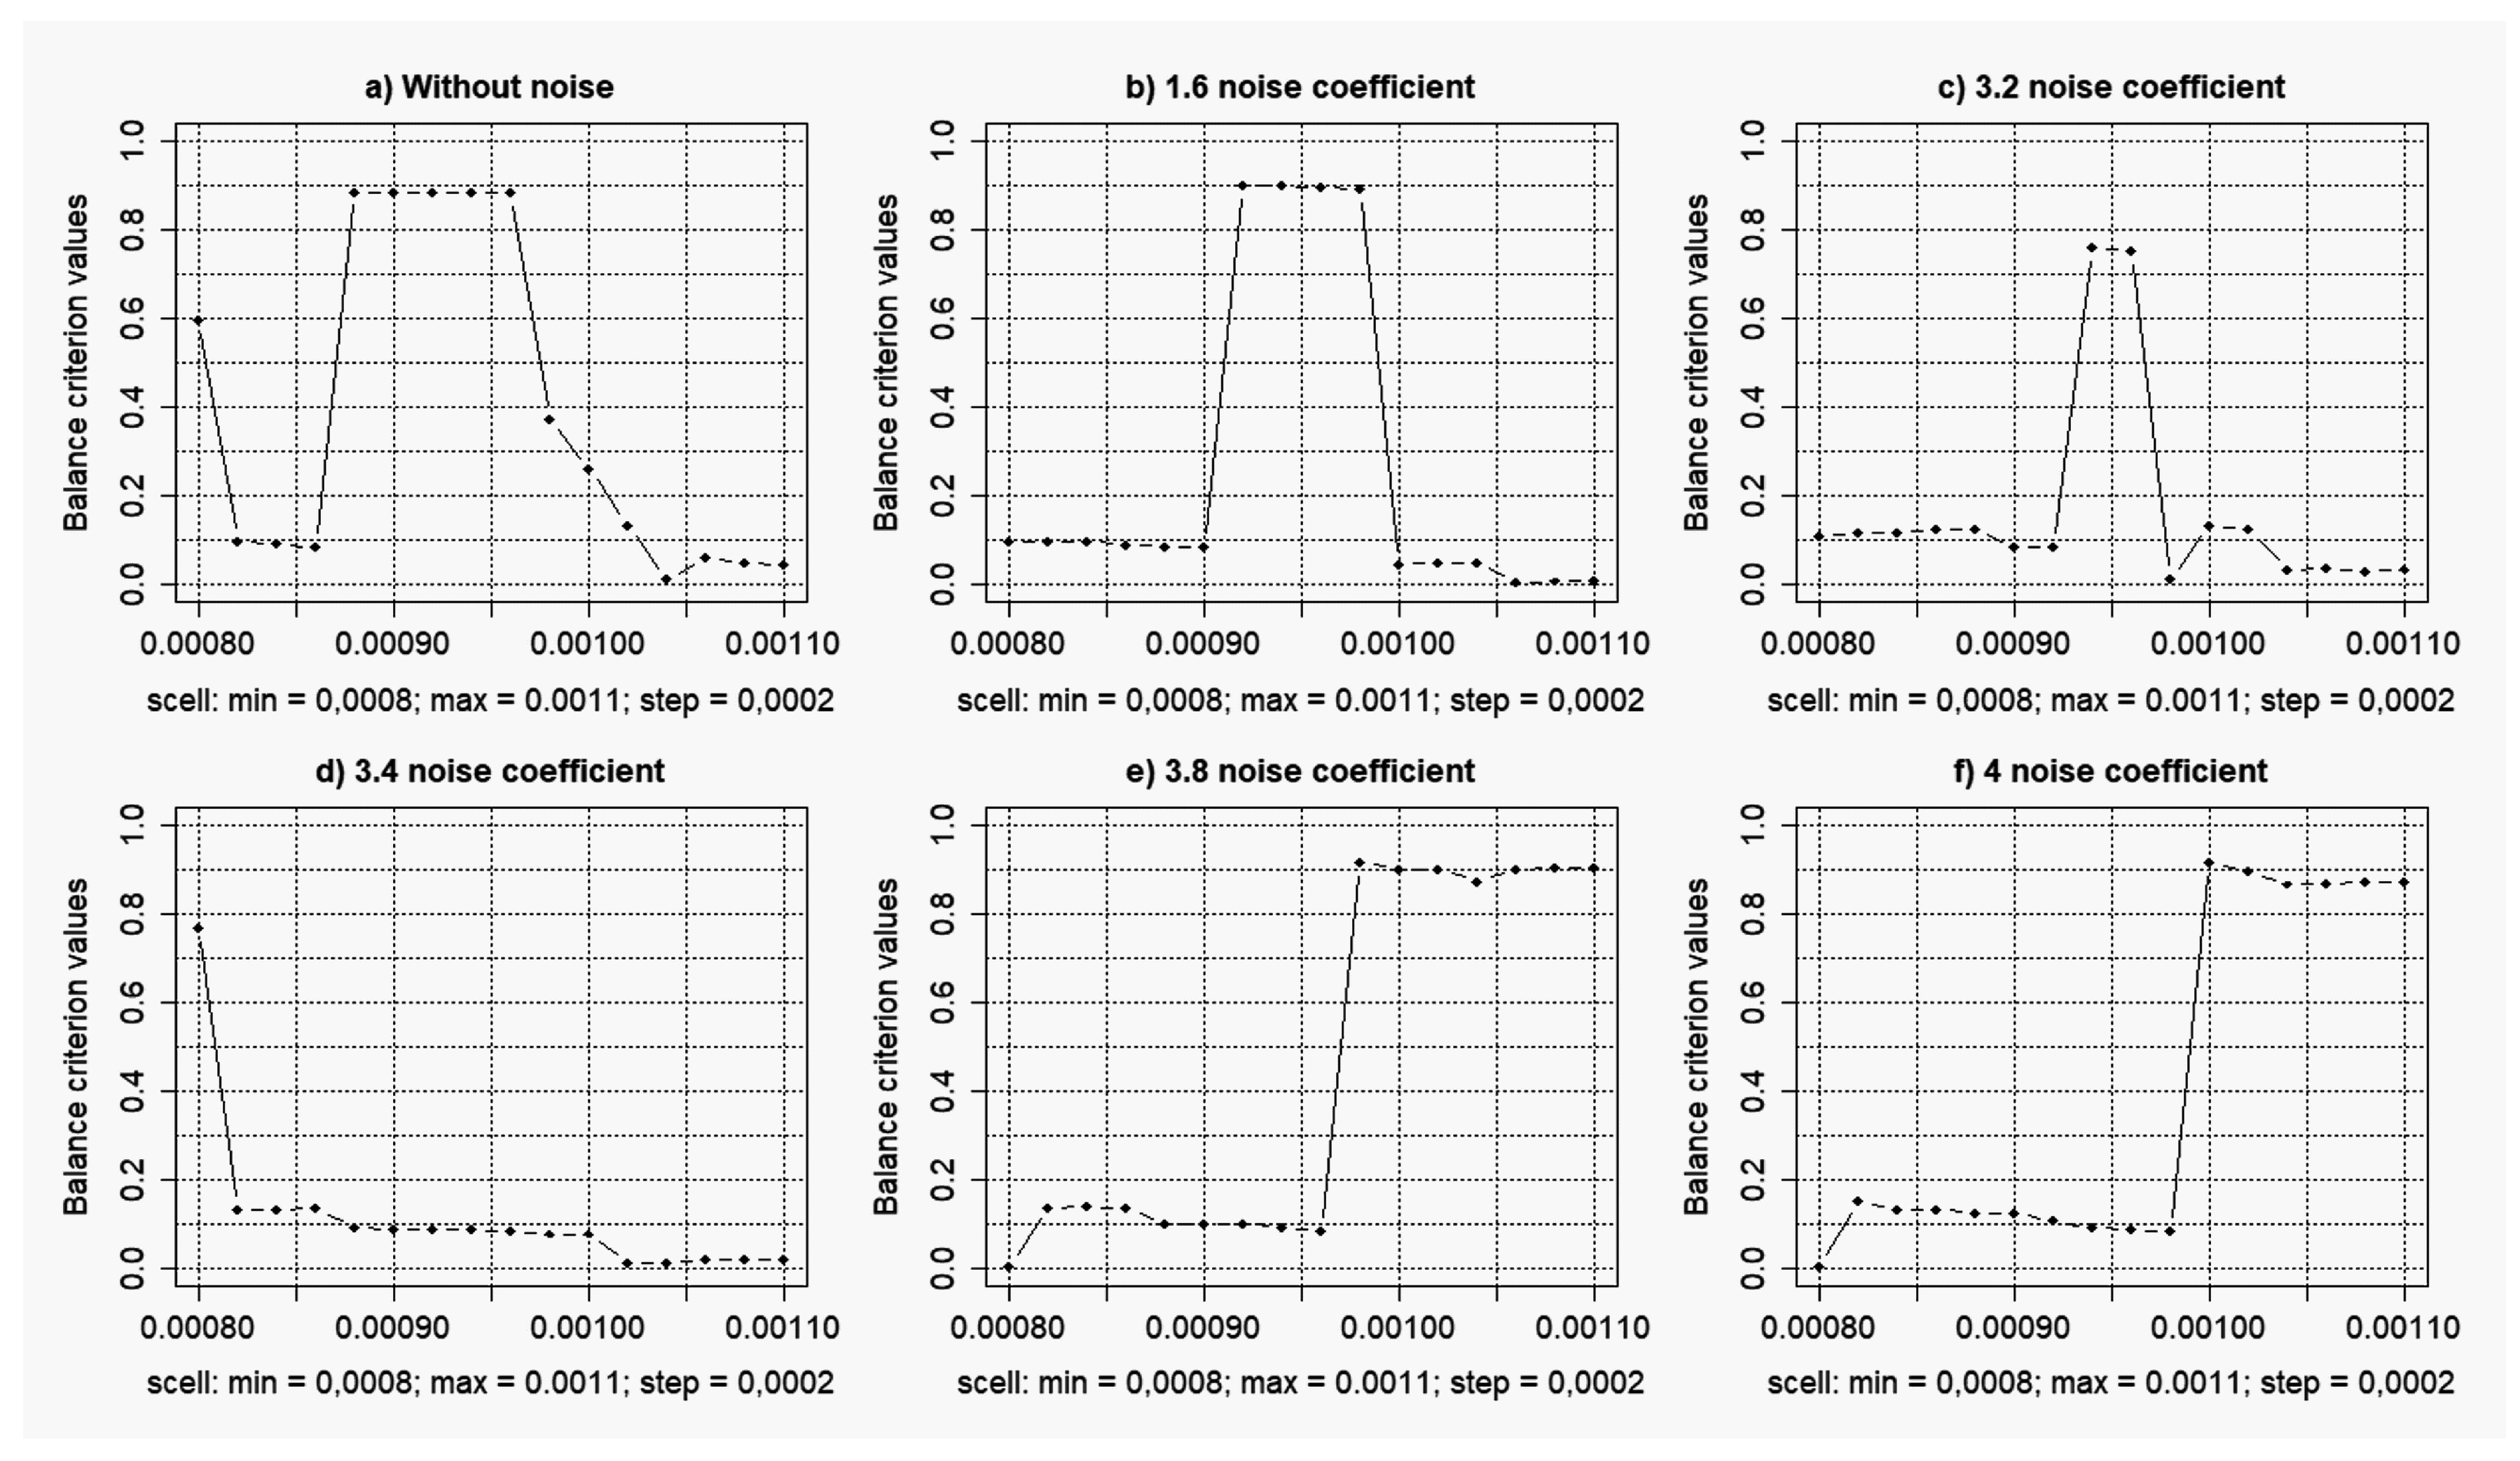
- Gene expression profiles clustering with the use of the method described in detail in [21] using SOTA clustering algorithm. The value of the sister cell weigh coefficient () was changed within the small range from to with the step . This range was determined empirically during the previous simulation process. The value of the variation coefficient was taken as zero.
- Calculation of the complex balance criterion (general Harrington desirability index) for each value of the sister cell weigh coefficient. Creation of the plots of complex balance criterion versus the weigh coefficient value for both the data without noise and the data with different levels of noise component. Determination of the SOTA clustering algorithm optimal parameters, which correspond to the maximum value of the complex balance criterion. Data clustering with the use of SOTA algorithm with its optimal parameters.
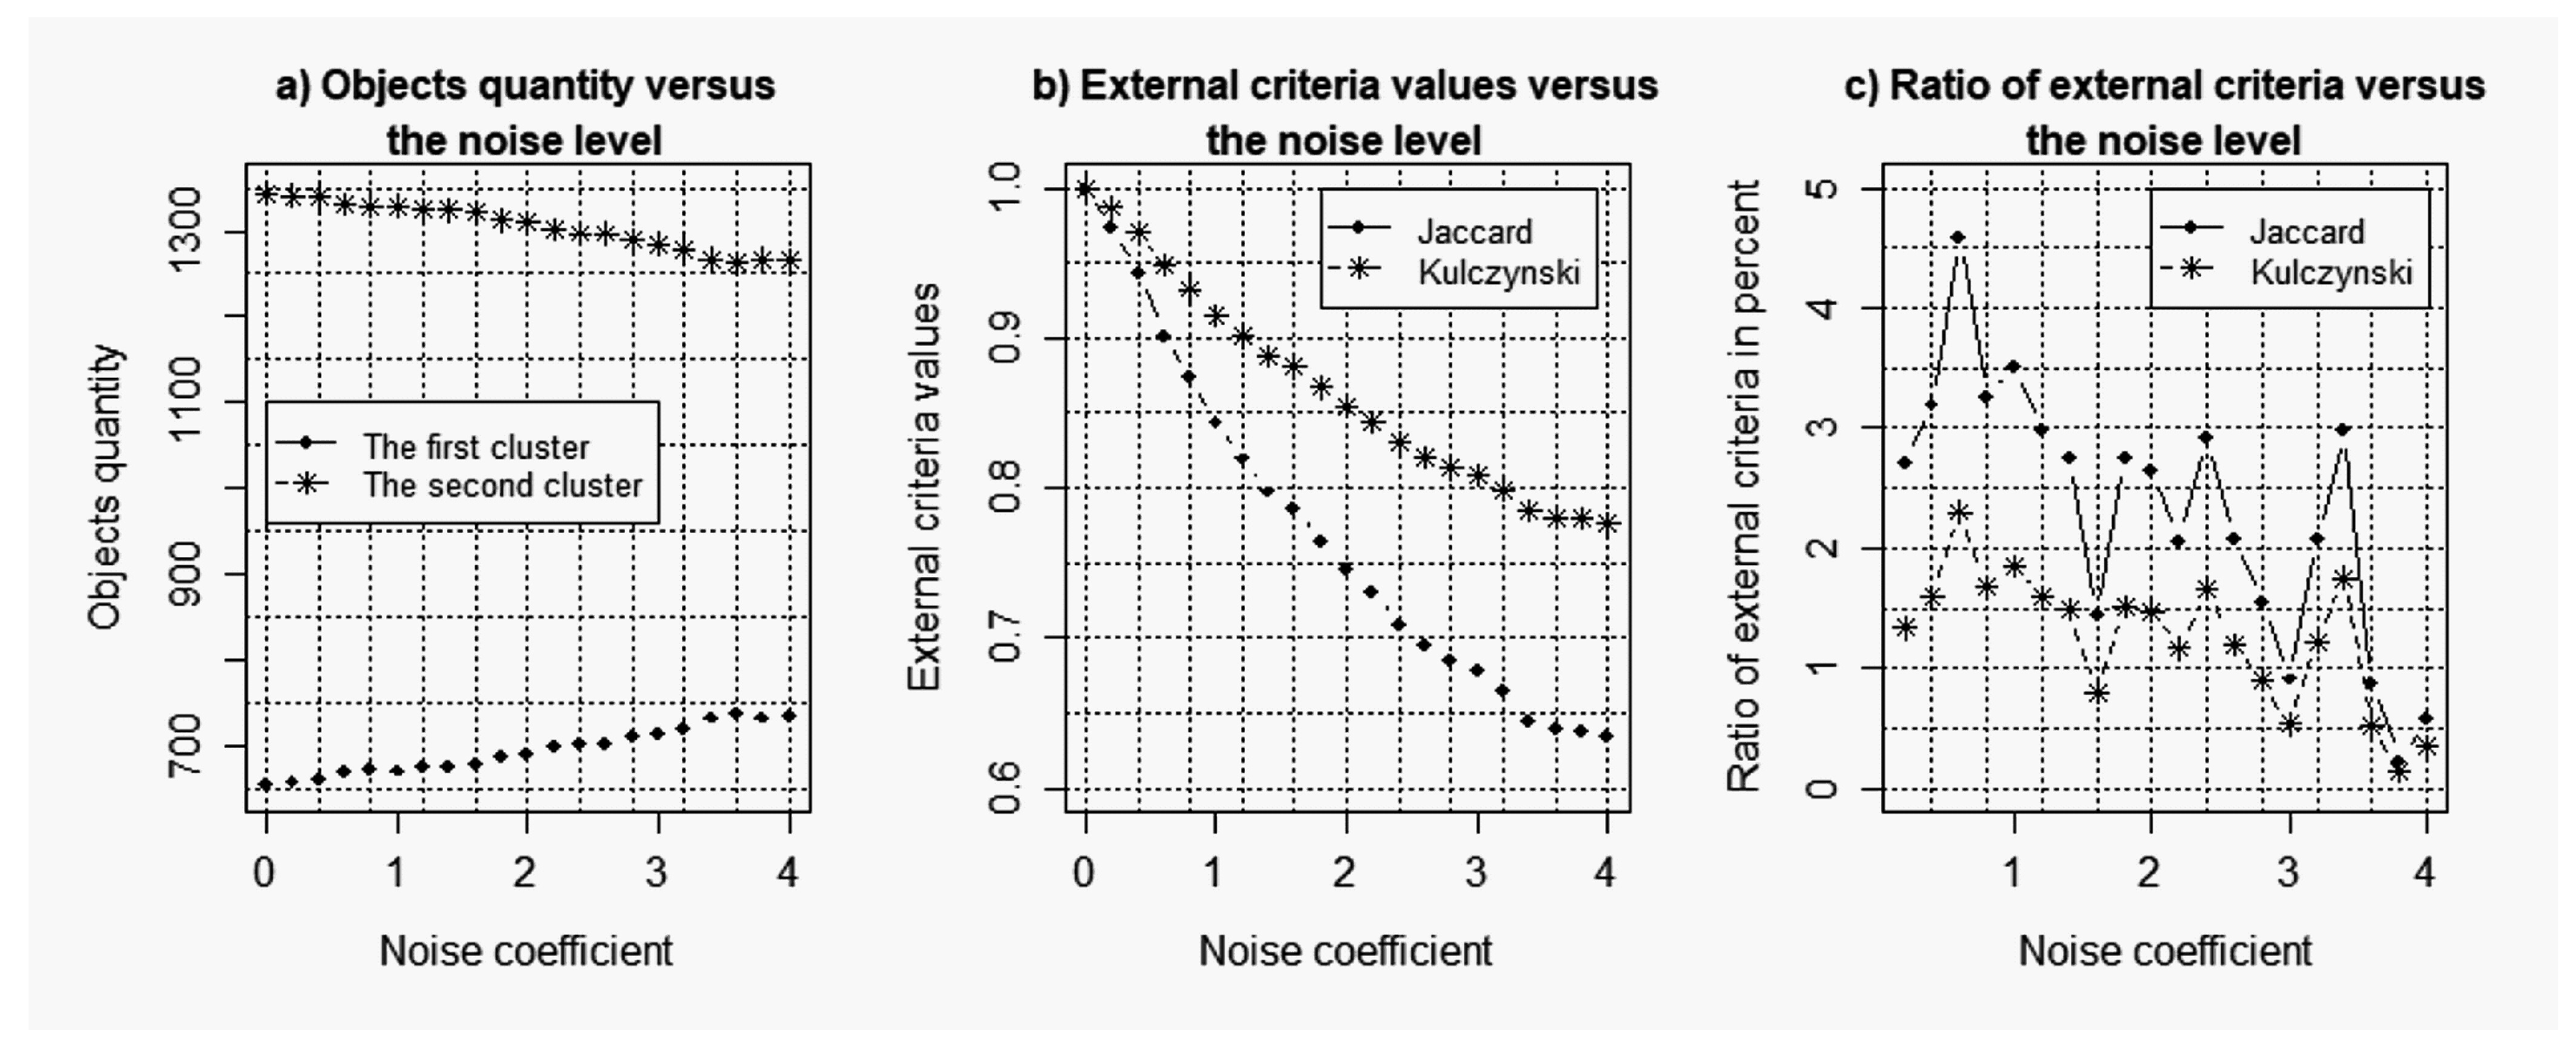
- Calculation of the external clustering quality criteria, which allows us to compare the clustering results for both the data without noise and the data with noise component. The following criteria were used as the external clustering quality criteria in this case:
- Jaccard index:
- Kulczynski index:
where a is the number of objects distributed in the same clusters in different clustering; b is the number of objects in the clusters of the first clustering, which did not coincide with the appropriate objects in the clusters of the second clustering; c is the number of objects in the clusters of the second clustering, which did not coincide with the appropriate objects in the clusters of the first clustering. - Analysis of the obtained results.
2.2. Evaluation of the Stability of the Model of Gene Regulatory Networks Reconstruction to the Level of the Noise Component
3. Results and Discussion
3.1. Results of the Simulation Concerning the Use of the Objective Clustering Inductive Technology Based on the SOTA Clustering Algorithm
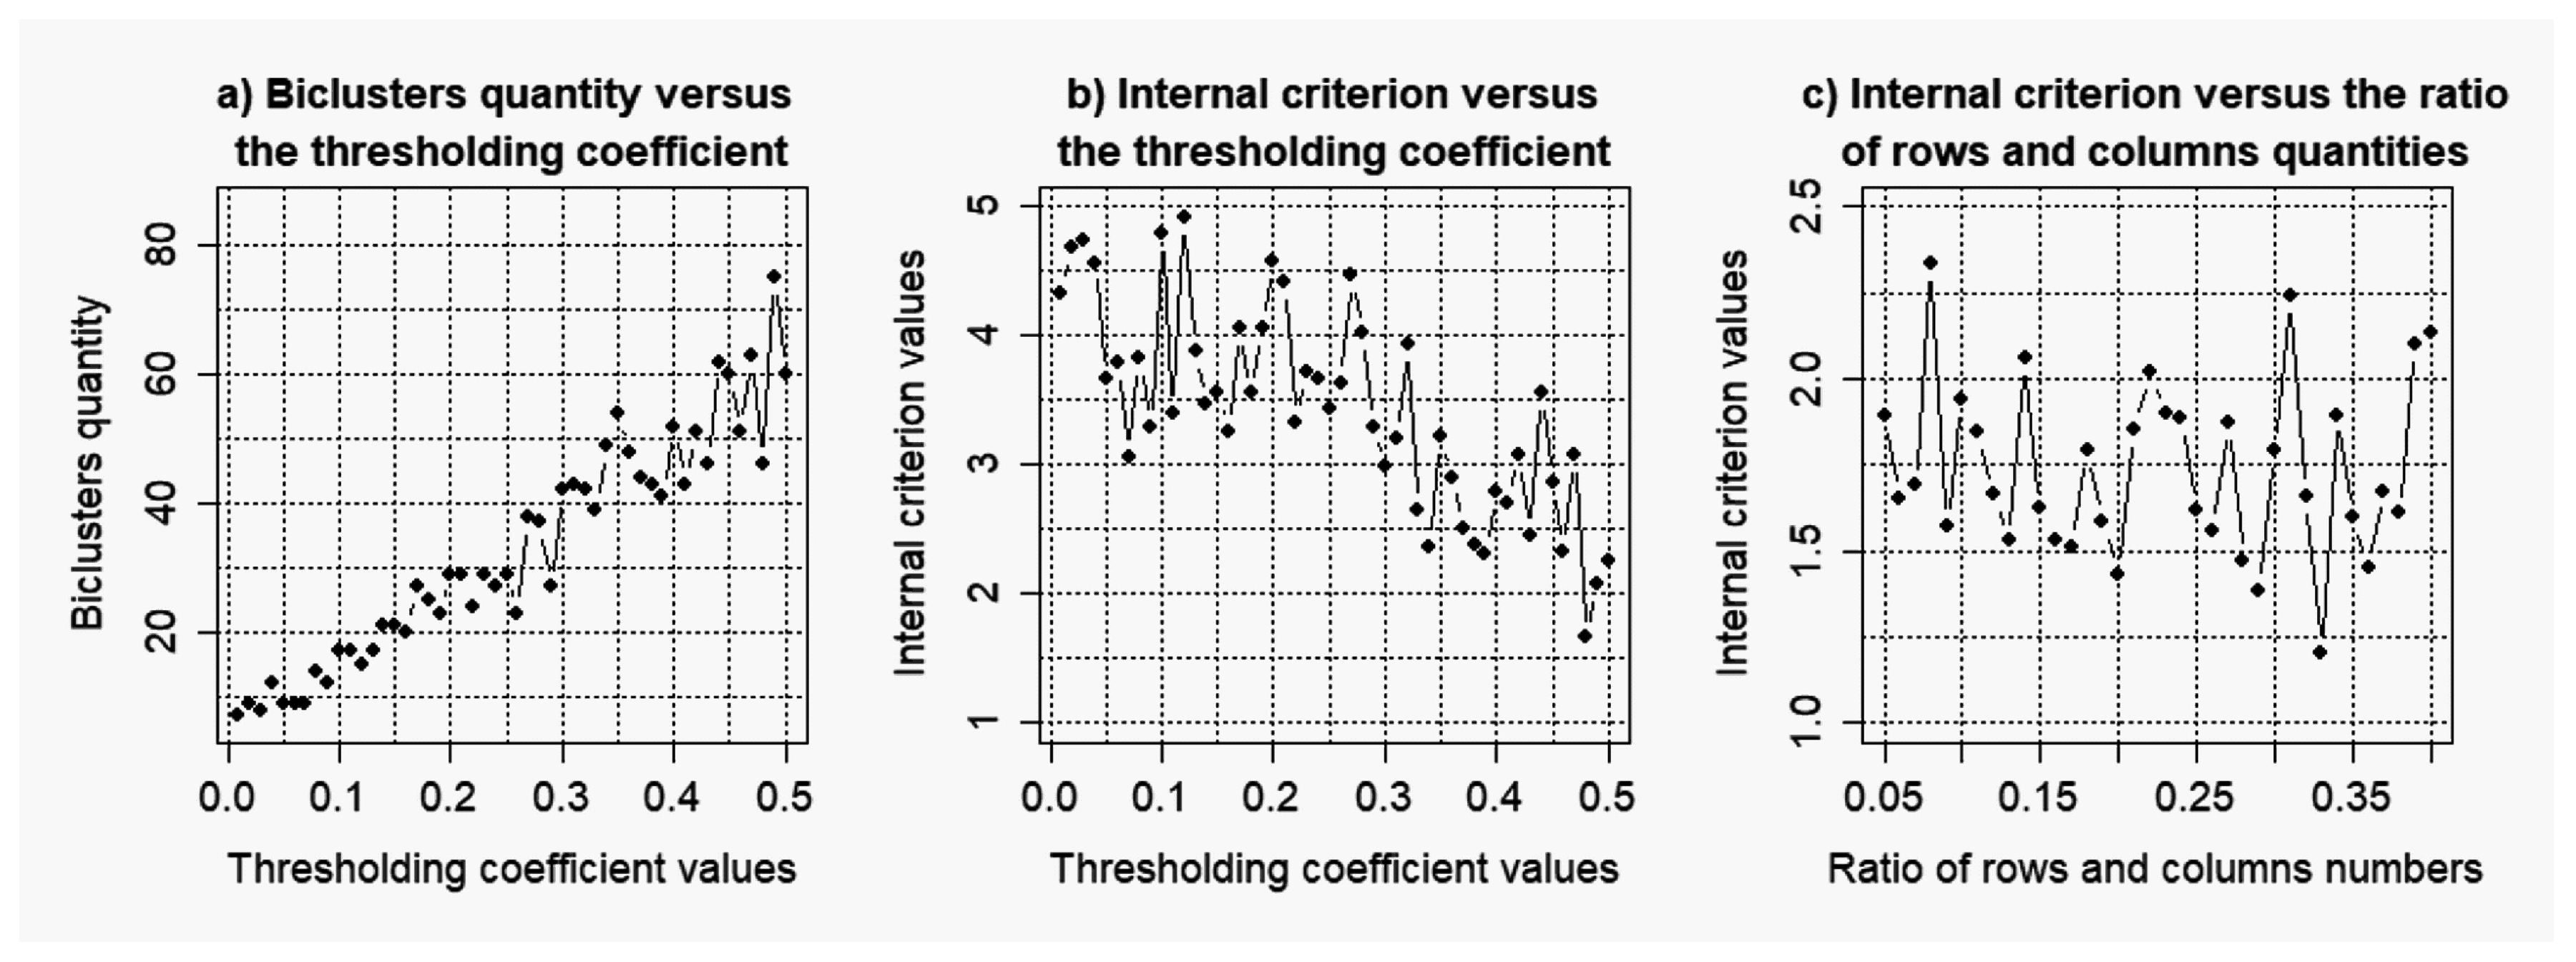
3.2. Results of the Simulations Concerning the Influence of the Level of noise components to the Quality of the Reconstructed Gene Networks
- k = 0.025: = 0.33; = 0.29;
- k = 0.05: = 0.35; = 0.11;
- k = 0.075: = 0.26; = 0.07;
- k = 0.1: = 0.48; = 0.33;
4. Conclusions
Funding
Conflicts of Interest
Abbreviations
| SOTA | Self-Organizing Tree Algorithm |
| DBSCAN | Density-Based Spatial Clustering of Applications with Noise |
| DNA | Deoxyribonucleic Acid |
| RNA | Ribonucleic Acid |
| PM | Pirfect Match |
References
- Zak, D.E.; Vadigepalli, R.; Gonye, E.G.; Doyle, F.J.; Schwaber, J.S.; Ogunnaike, B.A. Unconventional systems analysis problem in molecular biology: A case study in gene regulatory network Modeling. Comput. Chem. Eng. 2005, 2, 547–563. [Google Scholar] [CrossRef]
- Davidson, E.; Levin, M. Gene regulatory networks for development. Proc. Natl. Acad. Sci. USA 2005, 102, 4936–4942. [Google Scholar] [CrossRef] [PubMed]
- Liang, S.; Fuhrman, S.; Somogyi, R. REVEAL, A General Reverse Engineering Algorithm for Inference of Genetic Network Architectures; Pacific Symposium on Biocomputing, World Scientific Publishing Co.: Singapore, 1998; Volume 3, pp. 18–29. [Google Scholar]
- Liu, Z.-P. Quantifying Gene Regulatory Relationships with Association Measures: A Comparative Study. Front. Genet. 2017, 8, 1–12. [Google Scholar] [CrossRef] [PubMed]
- Liu, Z.-P. Reverse Engineering of Genome-wide Gene Regulatory Networks from Gene Expression Data. Curr. Genom. 2015, 16, 3–22. [Google Scholar] [CrossRef] [PubMed]
- Liu, Z.-P.; Wu, C.; Miao, H.; Wu, H. RegNetwork: An integrated database of transcriptional and post-transcriptional regulatory networks in human and mouse. Database 2015, 2015, bav095. [Google Scholar] [CrossRef] [PubMed]
- Zhang, X.; Zhou, Z.; Jiao, Y.; Niu, Y.; Wang, Y. A visual cryptography scheme-based DNA microarrays. Int. J. Perform. Eng. 2018, 14, 334–340. [Google Scholar] [CrossRef]
- Shukla, S.; Agarwal, A.K.; Lakhmani, A. MICROCHIPS: A leading innovation in medicine. In Proceedings of the 3rd International Conference on Computing for Sustainable Global Development, New Delhi, India, 16–18 March 2016; pp. 205–210. [Google Scholar] [CrossRef]
- Wu, X.; Yang, B.; Udo-Inyang, I.; Ji, S.; Ozog, D.; Zhou, L.; Mi, Q.-S. Research Techniques Made Simple: Single-Cell RNA Sequencing and its Applications in Dermatology. J. Investig. Dermatol. 2018, 138, 1004–1009. [Google Scholar] [CrossRef] [PubMed]
- Wang, L.Y.; Guo, J.; Cao, W.; Zhang, M.; He, J.; Li, Z. Integrated sequencing of exome and mRNA of large-sized single cells. Sci. Rep. 2018. [Google Scholar] [CrossRef] [PubMed]
- Puchala, D.; Szczepaniak, B.; Yatsymirskyy, M. Effective Realizations of Biorthogonal Wavelet Transforms of Lengths 2K + 1/2K − 1 with Lattice Structures on GPU and CPU. In Proceedings of the 16th International Conference on Intelligent Data Engineering and Automated Learning (IDEAL), Wroclaw, Poland, 14–16 October 2015; pp. 130–137. [Google Scholar] [CrossRef]
- Lipinski, P.; Yatsymirskyy, M. Efficient ID and 2D daubechies wavelet transforms with application to signal processing. In Proceedings of the 8th International Conference on Adaptive and Natural Computing Algorithms (ICANNGA), Warsaw, Poland, 11–14 April 2007. [Google Scholar] [CrossRef]
- Pontes, B.; Giráldez, R.; Aguilar-Ruiz, J.S. Biclustering on expression data: A review. J. Biomed. Inform. 2015, 57, 163–178. [Google Scholar] [CrossRef] [PubMed]
- Chi, E.C.; Allen, G.I.; Baraniuk, R.G. Convex Biclustering. Biometrics 2017, 73, 10–20. [Google Scholar] [CrossRef] [PubMed]
- Rocha, O.; Mendes, R. JBiclustGE: Java API with unified biclustering algorithms for gene expression data analysis. Knowl.-Based Syst. 2018, 155, 83–87. [Google Scholar] [CrossRef]
- Puleo, G.J.; Milenkovic, O. Correlation Clustering and Biclustering with Locally Bounded Errors. In Proceedings of the 33rd International Conference on Machine Learning, New York, NY, USA, 19–24 June 2018; pp. 4105–4119. [Google Scholar]
- Babichev, S.; Lytvynenko, V.; Korobchynskyi, M.; Skvor, J.; Voronenko, M. Information Technology of Gene Expression Profiles Processing for Purpose of Gene Regulatory Networks Reconstruction. In Proceedings of the 2018 IEEE Second International Conference on Data Stream Mining and Processing, Lviv, Ukraine, 21–25 August 2018; pp. 336–342. [Google Scholar]
- Ester, M.; Kriegel, H.; Sander, J.; Xu, X. A density-based algorithm for discovering clusters in large spatial datasets with noise. In Proceedings of the Second International Conference on Knowledge Discovery and Data Mining, Portland, OR, USA, 2–4 August 1996; pp. 226–231. [Google Scholar]
- Dorazo, J.; Corazo, J. Phylogenetic reconstruction using an unsupervised growing neural network that adopts the topology of a phylogenetic tree. J. Mol. Evol. 1997, 44, 226–259. [Google Scholar]
- Fritzke, B. Growing cell structures a self-organizing network for unsupervised and supervised learning. Neural Netw. 1994, 7, 1441–1460. [Google Scholar] [CrossRef]
- Babichev, S.; Lytvynenko, V.; Korobchynskyi, M.; Taif, M.A. Objective Clustering Inductive Technology of Gene Expression Sequences Features. Commun. Comput. Inf. Sci. 2017, 716, 359–372. [Google Scholar] [CrossRef]
- Babichev, S.; Lytvynenko, V.; Osypenko, V. Implementation of the Objective Clustering Inductive Technology Based on DBSCAN Clustering Algorithm. In Proceedings of the 2017 12th International Scientific and Technical Conference on Computer Sciences and Information Technologies (CSIT), Lviv, Ukraine, 5–8 September 2017; pp. 479–484. [Google Scholar]
- Babichev, S.; Taif, M.A.; Lytvynenko, V.; Osypenko, V. Criterial Analysis of Gene Expression Sequences to Create the Objective Clustering Inductive Technology. In Proceedings of the 2017 37th IEEE International Conference on Electronics and Nanotechnology (ELNANO), Kyiv, Ukraine, 18–20 April 2017; pp. 244–248. [Google Scholar]
- Babichev, S.; Taif, M.A.; Lytvynenko, V. Estimation of the inductive model of objects clustering stability based on the k-means algorithm for different levels of data noise. Radio Electron. Comput. Sci. Control 2016, 4, 54–60. [Google Scholar] [CrossRef]
- Setlak, G.; Bodyanskiy, Y.; Pliss, I.; Vynokurova, O.; Peleshko, D.; Kobylin, I. Adaptive Fuzzy Clustering of Multivariate Short Time Series with Unevenly Distributed Observations Based on Matrix Neuro-Fuzzy Self-organizing Network. Adv. Intell. Syst. Comput. 2018, 643, 308–315. [Google Scholar] [CrossRef]
- Hausser, J.; Strimmer, K. Entropy inference and the james-stein estimator with application to nonlinear gene association networks. J. Mach. Learn. Res. 2009, 10, 1469–1484. [Google Scholar]
- Babichev, S.; Lytvynenko, V.; Osypenko, V.; Korobchynskyi, M.; Voronenko, M. Comparison Analysis of Biclustering Algorithms With the Use of Artificial Data and Gene Expression Profiles. In Proceedings of the 2018 38th IEEE International Conference on Electronics and Nanotechnology (ELNANO), Kyiv, Ukraine, 24–26 April 2018; pp. 292–297. [Google Scholar]
- Kaiser, S. Biclustering: Methods, Software and Application. Ph.D. Thesis, Faculty of Mathematics, Computer Science and Statistics, Loyola Marymount University, Los Angeles, CA, USA, 2011. [Google Scholar]
- Shannon, P.; Markiel, A.; Ozier, O.; Baliga, N.S.; Wang, J.T.; Ramage, D.; Amin, N.; Schwikowski, B.; Ideker, T. Cytoscape: A software environment for integrated models of biomolecular interaction networks. Genome Res. 2003, 13, 2498–2504. [Google Scholar] [CrossRef] [PubMed]
- Harrington, J. The desirability function. Ind. Qual. Control 1965, 21, 494–498. [Google Scholar]
- Beer, D.G.; Kardia, S.L.; Huang, C.C.; Giordano, T.J.; Levin, A.M.; Misek, D.E.; Lin, L.; Chen, G.; Gharib, T.G.; Thomas, D.G.; et al. Gene-expression profiles predict survival of patients with lung adenocarcinoma. Nat. Med. 2002, 8, 816–824. [Google Scholar] [CrossRef] [PubMed]
- Bhattacherjee, V.; Mukhopadhyay, P.; Singh, S.; Johnson, C.; Philipose, J.T.; Warner, C.P.; Greene, R.M.; Pisano, M.M. Neural crest and mesoderm lineagedependent gene expression in orofacial development. Differentiation 2007, 75, 463–477. [Google Scholar] [CrossRef] [PubMed]
- Babichev, S.; Korobchynskyi, M.; Lahodynskyi, O.; Korchomnyi, O.; Basanets, V.; Borynskyi, V. Development of technology of gene network reconstruction and validation based on gene expression profiles. East.-Eur. J. Enterp. Technol. 2018, 1, 19–32. [Google Scholar] [CrossRef]


| Noise Coef. | Full Data | BC2 | BC8 | BC12 | BC15 | BC16 | BC18 | BC20 | BC23 | BC25 | BC27 |
| 0.025 | 0.52 | 0.43 | 0.4 | 0.52 | 0.4 | 0.7 | 0.7 | 0.7 | 0.5 | 0.5 | 0.52 |
| Noise Coef. | Full Data | BC7 | BC8 | BC11 | BC12 | BC14 | BC15 | BC17 | BC25 | BC26 | BC28 |
| 0.05 | 0.51 | 0.42 | 0.71 | 0.43 | 0.41 | 0.44 | 0.41 | 0.4 | 0.69 | 0.48 | 0.43 |
| Noise Coef. | Full Data | BC2 | BC4 | BC7 | BC10 | BC12 | BC14 | BC15 | BC19 | BC28 | BC33 |
| 0.075 | 0.52 | 0.48 | 0.41 | 0.4 | 0.43 | 0.4 | 0.52 | 0.42 | 0.45 | 0.51 | 0.54 |
| Noise Coef. | Full Data | BC8 | BC10 | BC11 | BC12 | BC14 | BC20 | BC23 | BC33 | BC38 | BC40 |
| 0.1 | 0.5 | 0.58 | 0.56 | 0.69 | 0.44 | 0.41 | 0.51 | 0.7 | 0.72 | 0.47 | 0.49 |
© 2018 by the author. Licensee MDPI, Basel, Switzerland. This article is an open access article distributed under the terms and conditions of the Creative Commons Attribution (CC BY) license (http://creativecommons.org/licenses/by/4.0/).
Share and Cite
Babichev, S. An Evaluation of the Information Technology of Gene Expression Profiles Processing Stability for Different Levels of Noise Components. Data 2018, 3, 48. https://doi.org/10.3390/data3040048
Babichev S. An Evaluation of the Information Technology of Gene Expression Profiles Processing Stability for Different Levels of Noise Components. Data. 2018; 3(4):48. https://doi.org/10.3390/data3040048
Chicago/Turabian StyleBabichev, Sergii. 2018. "An Evaluation of the Information Technology of Gene Expression Profiles Processing Stability for Different Levels of Noise Components" Data 3, no. 4: 48. https://doi.org/10.3390/data3040048
APA StyleBabichev, S. (2018). An Evaluation of the Information Technology of Gene Expression Profiles Processing Stability for Different Levels of Noise Components. Data, 3(4), 48. https://doi.org/10.3390/data3040048