Next Issue
Volume 5, March
Previous Issue
Volume 4, September


Data, Volume 4, Issue 4 (December 2019) – 20 articles

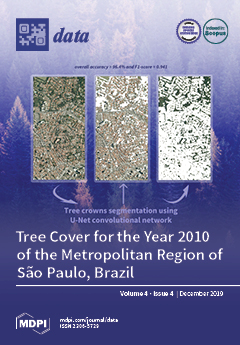
Cover Story (view full-size image): Mapping urban trees with images at a very high spatial resolution (<1 m) is a particularly relevant recent challenge due to the need to assess the ecosystem services they provide. Here, we present the tree cover map at 1 m spatial resolution of the Metropolitan Region of São Paulo, Brazil, the fourth largest urban agglomeration in the world. This dataset, based on aerial photographs taken in 2010, was produced using a deep learning method for image segmentation called U-net. The tree cover map showed an overall accuracy of 96.4% and an F1-score of 0.941. This dataset is a valuable input for the estimation of urban forest ecosystem services, and more broadly for urban studies or urban ecological modeling of the São Paulo Metropolitan Region. View this paper
  • Issues are regarded as officially published after their release is announced to the table of contents alert mailing list.
  • You may sign up for e-mail alerts to receive table of contents of newly released issues.
  • PDF is the official format for papers published in both, html and pdf forms. To view the papers in pdf format, click on the "PDF Full-text" link, and use the free Adobe Reader to open them.
Order results
Result details
Section
Select all
Export citation of selected articles as:
20 pages, 1508 KiB  
Data Descriptor
Modeling Regulatory Threshold Levels for Pesticides in Surface Waters from Effect Databases
by Lara L. Petschick, Sascha Bub, Jakob Wolfram, Sebastian Stehle and Ralf Schulz
Data 2019, 4(4), 150; https://doi.org/10.3390/data4040150 - 14 Dec 2019
Cited by 4 | Viewed by 3872
Abstract
Regulatory threshold levels (RTL) represent robust benchmarks for assessing risks of pesticides, e.g., in surface waters. However, comprehensive scientific risk evaluations comparing RTL to measured environmental concentrations (MEC) of pesticides in surface waters were yet restricted to a low number of pesticides, as [...] Read more.
Regulatory threshold levels (RTL) represent robust benchmarks for assessing risks of pesticides, e.g., in surface waters. However, comprehensive scientific risk evaluations comparing RTL to measured environmental concentrations (MEC) of pesticides in surface waters were yet restricted to a low number of pesticides, as RTL are only available after extensive review of regulatory documents. Thus, the aim of the present study was to model RTL equivalents (RTLe) for aquatic organisms from publicly accessible ecotoxicological effect databases. We developed a model that applies validity criteria in accordance with official US EPA review guidelines and validated the model against a set of manually retrieved RTL (n = 49). Model application yielded 1283 RTLe (n = 676 for pesticides, plus 607 additional RTLe for other use types). In a case study, the usability of RTLe was demonstrated for a set of 27 insecticides by comparing RTLe and RTL exceedance rates for 3001 MEC from US surface waters. The provided dataset enables thorough risk assessments of surface water exposure data for a comprehensive number of substances. Especially regions without established pesticide regulations may benefit from this dataset by using it as a baseline information for pesticide risk assessment and for the identification of priority substances or potential high-risk regions. Full article
Show Figures

Figure 1

23 pages, 5480 KiB  
Article
The Eminence of Co-Expressed Ties in Schizophrenia Network Communities
by Amulyashree Sridhar, Sharvani GS, AH Manjunatha Reddy, Biplab Bhattacharjee and Kalyan Nagaraj
Data 2019, 4(4), 149; https://doi.org/10.3390/data4040149 - 29 Nov 2019
Viewed by 3101
Abstract
Exploring gene networks is crucial for identifying significant biological interactions occurring in a disease condition. These interactions can be acknowledged by modeling the tie structure of networks. Such tie orientations are often detected within embedded community structures. However, most of the prevailing community [...] Read more.
Exploring gene networks is crucial for identifying significant biological interactions occurring in a disease condition. These interactions can be acknowledged by modeling the tie structure of networks. Such tie orientations are often detected within embedded community structures. However, most of the prevailing community detection modules are intended to capture information from nodes and its attributes, usually ignoring the ties. In this study, a modularity maximization algorithm is proposed based on nonlinear representation of local tangent space alignment (LTSA). Initially, the tangent coordinates are computed locally to identify k-nearest neighbors across the genes. These local neighbors are further optimized by generating a nonlinear network embedding function for detecting gene communities based on eigenvector decomposition. Experimental results suggest that this algorithm detects gene modules with a better modularity index of 0.9256, compared to other traditional community detection algorithms. Furthermore, co-expressed genes across these communities are identified by discovering the characteristic tie structures. These detected ties are known to have substantial biological influence in the progression of schizophrenia, thereby signifying the influence of tie patterns in biological networks. This technique can be extended logically on other diseases networks for detecting substantial gene “hotspots”. Full article
(This article belongs to the Special Issue Data-Driven Healthcare Tasks: Tools, Frameworks, and Techniques)
Show Figures

Figure 1

11 pages, 2468 KiB  
Article
Transformation of Schema from Relational Database (RDB) to NoSQL Databases
by Obaid Alotaibi and Eric Pardede
Data 2019, 4(4), 148; https://doi.org/10.3390/data4040148 - 27 Nov 2019
Cited by 17 | Viewed by 9009
Abstract
Relational database has been the de-facto database choice in most IT applications. In the last decade there has been increasing demand for applications that have to deal with massive and un-normalized data. To satisfy the demand, there is a big shift to use [...] Read more.
Relational database has been the de-facto database choice in most IT applications. In the last decade there has been increasing demand for applications that have to deal with massive and un-normalized data. To satisfy the demand, there is a big shift to use more relaxed databases in the form of NoSQL databases. Alongside with this shift, there is a need to have a structured methodology to transform existing data in relational database (RDB) to NoSQL database. The transformation from RDB to NoSQL database has become more challenging because there is no current standard on NoSQL database. The aim of this paper is to propose transformation rules of RDB Schema to various NoSQL database schema, namely document-based, column-based and graph-based databases. The rules are applied based on the type of relationships that can appear in data within a database. As a proof of concept, we apply the rules into a case study using three NoSQL databases, namely MongoDB, Cassandra, and Neo4j. A set of queries is run in these databases to demonstrate the correctness of the transformation results. In addition, the completeness of our transformation rules are compared against existing work. Full article
Show Figures

Figure 1

6 pages, 202 KiB  
Editorial
Earth Observation Open Science: Enhancing Reproducible Science Using Data Cubes
by Gregory Giuliani, Gilberto Camara, Brian Killough and Stuart Minchin
Data 2019, 4(4), 147; https://doi.org/10.3390/data4040147 - 25 Nov 2019
Cited by 50 | Viewed by 6328
Abstract
Earth Observation Data Cubes (EODC) have emerged as a promising solution to efficiently and effectively handle Big Earth Observation (EO) Data generated by satellites and made freely and openly available from different data repositories. The aim of this Special Issue, “Earth Observation Data [...] Read more.
Earth Observation Data Cubes (EODC) have emerged as a promising solution to efficiently and effectively handle Big Earth Observation (EO) Data generated by satellites and made freely and openly available from different data repositories. The aim of this Special Issue, “Earth Observation Data Cube”, in Data, is to present the latest advances in EODC development and implementation, including innovative approaches for the exploitation of satellite EO data using multi-dimensional (e.g., spatial, temporal, spectral) approaches. This Special Issue contains 14 articles covering a wide range of topics such as Synthetic Aperture Radar (SAR), Analysis Ready Data (ARD), interoperability, thematic applications (e.g., land cover, snow cover mapping), capacity development, semantics, processing techniques, as well as national implementations and best practices. These papers made significant contributions to the advancement of a more Open and Reproducible Earth Observation Science, reducing the gap between users’ expectations for decision-ready products and current Big Data analytical capabilities, and ultimately unlocking the information power of EO data by transforming them into actionable knowledge. Full article
(This article belongs to the Special Issue Earth Observation Data Cubes)
10 pages, 6497 KiB  
Data Descriptor
Experimental Data of a Floating Cylinder in a Wave Tank: Comparison Solid and Water Ballast
by Roman Gabl, Thomas Davey, Edd Nixon, Jeffrey Steynor and David M. Ingram
Data 2019, 4(4), 146; https://doi.org/10.3390/data4040146 - 21 Nov 2019
Cited by 6 | Viewed by 2732
Abstract
The experimental set-up allows for the comparison of two different ballast options of a floating cylinder in a wave tank. Four different internal water drafts are tested as well as an equivalent solid ballast option. The model is excited by regular waves, which [...] Read more.
The experimental set-up allows for the comparison of two different ballast options of a floating cylinder in a wave tank. Four different internal water drafts are tested as well as an equivalent solid ballast option. The model is excited by regular waves, which are characterised with five wave gauges in front of the floating cylinder and two behind. Additionally, the time series of the six-degree freedom response of the floating structure is made available. Regular waves with an initial amplitude of 0.05 m and frequencies over the range 0.3 to 1.1 Hz are investigated. This results in a wide range of different responses of the floating structure as well as very big rotations of up to 20 degrees. This dataset allows for identification of the influence caused by the sloshing of the interior water volume and can be used to validate numerical models of fluid–structure–fluid interaction. Full article
Show Figures

Figure 1

8 pages, 8710 KiB  
Data Descriptor
Tree Cover for the Year 2010 of the Metropolitan Region of São Paulo, Brazil
by Fabien H. Wagner and Mayumi C.M. Hirye
Data 2019, 4(4), 145; https://doi.org/10.3390/data4040145 - 14 Nov 2019
Cited by 8 | Viewed by 3896
Abstract
Mapping urban trees with images at a very high spatial resolution (≤1 m) is a particularly relevant recent challenge due to the need to assess the ecosystem services they provide. However, due to the effort needed to produce these maps from tree censuses [...] Read more.
Mapping urban trees with images at a very high spatial resolution (≤1 m) is a particularly relevant recent challenge due to the need to assess the ecosystem services they provide. However, due to the effort needed to produce these maps from tree censuses or with remote sensing data, few cities in the world have a complete tree cover map. Here, we present the tree cover data at 1-m spatial resolution of the Metropolitan Region of São Paulo, Brazil, the fourth largest urban agglomeration in the world. This dataset, based on 71 orthorectified RGB aerial photographs taken in 2010 at 1-m spatial resolution, was produced using a deep learning method for image segmentation called U-net. The model was trained with 1286 images of size 64 × 64 pixels at 1-m spatial resolution, containing one or more trees or only background, and their labelled masks. The validation was based on 322 images of the same size not used in the training and their labelled masks. The map produced by the U-net algorithm showed an excellent level of accuracy, with an overall accuracy of 96.4% and an F1-score of 0.941 (precision = 0.945 and recall = 0.937). This dataset is a valuable input for the estimation of urban forest ecosystem services, and more broadly for urban studies or urban ecological modelling of the São Paulo Metropolitan Region. Full article
Show Figures

Figure 1

17 pages, 8527 KiB  
Article
National Open Data Cubes and Their Contribution to Country-Level Development Policies and Practices
by Trevor Dhu, Gregory Giuliani, Jimena Juárez, Argyro Kavvada, Brian Killough, Paloma Merodio, Stuart Minchin and Steven Ramage
Data 2019, 4(4), 144; https://doi.org/10.3390/data4040144 - 5 Nov 2019
Cited by 36 | Viewed by 6549
Abstract
The emerging global trend of satellite operators producing analysis-ready data combined with open source tools for managing and exploiting these data are leading to more and more countries using Earth observation data to drive progress against key national and international development agendas. This [...] Read more.
The emerging global trend of satellite operators producing analysis-ready data combined with open source tools for managing and exploiting these data are leading to more and more countries using Earth observation data to drive progress against key national and international development agendas. This paper provides examples from Australia, Mexico, Switzerland, and Tanzania on how the Open Data Cube technology has been combined with analysis-ready data to provide new insights and support better policy making across issues as diverse as water resource management through to urbanization and environmental–economic accounting. Full article
(This article belongs to the Special Issue Earth Observation Data Cubes)
Show Figures

Figure 1

21 pages, 9922 KiB  
Article
Land Cover Mapping using Digital Earth Australia
by Richard Lucas, Norman Mueller, Anders Siggins, Christopher Owers, Daniel Clewley, Peter Bunting, Cate Kooymans, Belle Tissott, Ben Lewis, Leo Lymburner and Graciela Metternicht
Data 2019, 4(4), 143; https://doi.org/10.3390/data4040143 - 1 Nov 2019
Cited by 24 | Viewed by 6623
Abstract
This study establishes the use of the Earth Observation Data for Ecosystem Monitoring (EODESM) to generate land cover and change classifications based on the United Nations Food and Agriculture Organisation (FAO) Land Cover Classification System (LCCS) and environmental variables (EVs) available within, or [...] Read more.
This study establishes the use of the Earth Observation Data for Ecosystem Monitoring (EODESM) to generate land cover and change classifications based on the United Nations Food and Agriculture Organisation (FAO) Land Cover Classification System (LCCS) and environmental variables (EVs) available within, or accessible from, Geoscience Australia’s (GA) Digital Earth Australia (DEA). Classifications representing the LCCS Level 3 taxonomy (8 categories representing semi-(natural) and/or cultivated/managed vegetation or natural or artificial bare or water bodies) were generated for two time periods and across four test sites located in the Australian states of Queensland and New South Wales. This was achieved by progressively and hierarchically combining existing time-static layers relating to (a) the extent of artificial surfaces (urban, water) and agriculture and (b) annual summaries of EVs relating to the extent of vegetation (fractional cover) and water (hydroperiod, intertidal area, mangroves) generated through DEA. More detailed classifications that integrated information on, for example, forest structure (based on vegetation cover (%) and height (m); time-static for 2009) and hydroperiod (months), were subsequently produced for each time-step. The overall accuracies of the land cover classifications were dependent upon those reported for the individual input layers, with these ranging from 80% (for cultivated, urban and artificial water) to over 95% (for hydroperiod and fractional cover). The changes identified include mangrove dieback in the southeastern Gulf of Carpentaria and reduced dam water levels and an associated expansion of vegetation in Lake Ross, Burdekin. The extent of detected changes corresponded with those observed using time-series of RapidEye data (2014 to 2016; for the Gulf of Carpentaria) and Google Earth imagery (2009–2016 for Lake Ross). This use case demonstrates the capacity and a conceptual framework to implement EODESM within DEA and provides countries using the Open Data Cube (ODC) environment with the opportunity to routinely generate land cover maps from Landsat or Sentinel-1/2 data, at least annually, using a consistent and internationally recognised taxonomy. Full article
(This article belongs to the Special Issue Earth Observation Data Cubes)
Show Figures

Figure 1

16 pages, 2606 KiB  
Article
Use of the WRF-DA 3D-Var Data Assimilation System to Obtain Wind Speed Estimates in Regular Grids from Measurements at Wind Farms in Uruguay
by Gabriel Cazes Boezio and Sofía Ortelli
Data 2019, 4(4), 142; https://doi.org/10.3390/data4040142 - 29 Oct 2019
Cited by 5 | Viewed by 2782
Abstract
This work assessed the quality of wind speed estimates in Uruguay. These estimates were obtained using the Weather Research and Forecast Model Data Assimilation System (WRF-DA) to assimilate wind speed measurements from 100 m above the ground at two wind farms. The quality [...] Read more.
This work assessed the quality of wind speed estimates in Uruguay. These estimates were obtained using the Weather Research and Forecast Model Data Assimilation System (WRF-DA) to assimilate wind speed measurements from 100 m above the ground at two wind farms. The quality of the estimates was assessed with an anemometric station placed between the wind farms. The wind speed estimates showed low systematic errors at heights of 87 and 36 m above the ground. At both levels, the standard deviation of the total errors was approximately 25% of the mean observed speed. These results suggested that the estimates obtained could be of sufficient quality to be useful in various applications. The assimilation process proved to be effective, spreading the observational gain obtained at the wind farms to lower elevations than those at which the assimilated measurements were taken. The smooth topography of Uruguay might have contributed to the relatively good quality of the obtained wind estimates, although the data of only two stations were assimilated, and the resolution of the regional atmospheric simulations employed was relatively low. Full article
(This article belongs to the Special Issue Overcoming Data Scarcity in Earth Science)
Show Figures

Figure 1

12 pages, 2008 KiB  
Article
Capacity Allocation of Game Tickets Using Dynamic Pricing
by Aniruddha Dutta
Data 2019, 4(4), 141; https://doi.org/10.3390/data4040141 - 18 Oct 2019
Cited by 1 | Viewed by 6026
Abstract
This study examines a pricing approach that is applicable in the field of online ticket sales for game tickets. The mathematical principle of dynamic programing is combined with empirical data analysis to determine demand functions for university football game tickets. Based on the [...] Read more.
This study examines a pricing approach that is applicable in the field of online ticket sales for game tickets. The mathematical principle of dynamic programing is combined with empirical data analysis to determine demand functions for university football game tickets. Based on the calculated demand functions, the application of DP strategies is found to generate more revenues than a fixed price strategy. The other important result is the capacity distribution of tickets according to the football game intensity. Prior studies have shown that it is sometimes more profitable or football clubs to allocate a share of tickets to a retailer and earn a commission based on the sales, rather than selling the entire capacity of tickets by itself. This paper finds that in a high intensity game, where the demand is generally high, it is optimal for the club to sell all tickets by itself. Whereas, for less popular games, where there is considerable fluctuation in demand, the capacity allocation problem for maximized revenues from ticket sales, becomes a harder optimization challenge for the club. According to DP optimization, when the demand for tickets is relatively low, it is optimal for the club to retain 20–40% of the tickets and the rest of the capacity should be sold to online retailers. In the real world, this pricing technique has been used by football clubs and thus the secondary market online retailers like Ticketmaster and Vivid Seats have become popular in the last decade. Full article
Show Figures

Figure 1

19 pages, 2511 KiB  
Data Descriptor
Lifestyles and Cycling Behavior—Data from a Cross-Sectional Study
by Martin Loidl, Christian Werner, Laura Heym, Patrick Kofler and Günther Innerebner
Data 2019, 4(4), 140; https://doi.org/10.3390/data4040140 - 17 Oct 2019
Cited by 7 | Viewed by 3643
Abstract
Cycling experiences a remarkable renaissance as an everyday mode of transport and in an increasing number of cities, cycling substantially contributes to the overall traffic. However, cyclists are not a homogeneous group of road users, but very diverse in terms of behavior, motivators, [...] Read more.
Cycling experiences a remarkable renaissance as an everyday mode of transport and in an increasing number of cities, cycling substantially contributes to the overall traffic. However, cyclists are not a homogeneous group of road users, but very diverse in terms of behavior, motivators, and deterrents. In order to gain better insights into driving forces and behavior patterns of cyclists, we conducted an opt-in online survey, in which socio-demographic, lifestyle, and mobility behavior data were collected. In total, 1234 responses with a completion rate of 87% (1073 complete survey) were collected between 3 May and 3 June 2019. With reference to complete responses, the gender ratio is balanced (53% female) and the mean age is 42 (σ = 12.75). A relative majority of participants cycles frequently. The fully anonymized dataset contains 107 data points per response, including survey metadata. Full article
Show Figures

Figure 1

9 pages, 8541 KiB  
Data Descriptor
Korean Tourist Spot Multi-Modal Dataset for Deep Learning Applications
by Changhoon Jeong, Sung-Eun Jang, Sanghyuck Na and Juntae Kim
Data 2019, 4(4), 139; https://doi.org/10.3390/data4040139 - 12 Oct 2019
Cited by 7 | Viewed by 5326
Abstract
Recently, deep learning-based methods for solving multi-modal tasks such as image captioning, multi-modal classification, and cross-modal retrieval have attracted much attention. To apply deep learning for such tasks, large amounts of data are needed for training. However, although there are several Korean single-modal [...] Read more.
Recently, deep learning-based methods for solving multi-modal tasks such as image captioning, multi-modal classification, and cross-modal retrieval have attracted much attention. To apply deep learning for such tasks, large amounts of data are needed for training. However, although there are several Korean single-modal datasets, there are not enough Korean multi-modal datasets. In this paper, we introduce a KTS (Korean tourist spot) dataset for Korean multi-modal deep-learning research. The KTS dataset has four modalities (image, text, hashtags, and likes) and consists of 10 classes related to Korean tourist spots. All data were extracted from Instagram and preprocessed. We performed two experiments, image classification and image captioning with the dataset, and they showed appropriate results. We hope that many researchers will use this dataset for multi-modal deep-learning research. Full article
Show Figures

Figure 1

25 pages, 6284 KiB  
Article
Snow Cover Evolution in the Gran Paradiso National Park, Italian Alps, Using the Earth Observation Data Cube
by Charlotte Poussin, Yaniss Guigoz, Elisa Palazzi, Silvia Terzago, Bruno Chatenoux and Gregory Giuliani
Data 2019, 4(4), 138; https://doi.org/10.3390/data4040138 - 9 Oct 2019
Cited by 25 | Viewed by 5685
Abstract
Mountainous regions are particularly vulnerable to climate change, and the impacts are already extensive and observable, the implications of which go far beyond mountain boundaries and the environmental sectors. Monitoring and understanding climate and environmental changes in mountain regions is, therefore, needed. One [...] Read more.
Mountainous regions are particularly vulnerable to climate change, and the impacts are already extensive and observable, the implications of which go far beyond mountain boundaries and the environmental sectors. Monitoring and understanding climate and environmental changes in mountain regions is, therefore, needed. One of the key variables to study is snow cover, since it represents an essential driver of many ecological, hydrological and socioeconomic processes in mountains. As remotely sensed data can contribute to filling the gap of sparse in-situ stations in high-altitude environments, a methodology for snow cover detection through time series analyses using Landsat satellite observations stored in an Open Data Cube is described in this paper, and applied to a case study on the Gran Paradiso National Park, in the western Italian Alps. In particular, this study presents a proof of concept of the preliminary version of the snow observation from space algorithm applied to Landsat data stored in the Swiss Data Cube. Implemented in an Earth Observation Data Cube environment, the algorithm can process a large amount of remote sensing data ready for analysis and can compile all Landsat series since 1984 into one single multi-sensor dataset. Temporal filtering methodology and multi-sensors analysis allows one to considerably reduce the uncertainty in the estimation of snow cover area using high-resolution sensors. The study highlights that, despite this methodology, the lack of available cloud-free images still represents a big issue for snow cover mapping from satellite data. Though accurate mapping of snow extent below cloud cover with optical sensors still represents a challenge, spatial and temporal filtering techniques and radar imagery for future time series analyses will likely allow one to reduce the current cloud cover issue. Full article
(This article belongs to the Special Issue Earth Observation Data Cubes)
Show Figures

Figure 1

8 pages, 449 KiB  
Data Descriptor
Matrix Metalloproteinases as Markers of Acute Inflammation Process in the Pulmonary Tuberculosis
by Anastasia I. Lavrova, Diljara S. Esmedljaeva, Vitaly Belik and Eugene B. Postnikov
Data 2019, 4(4), 137; https://doi.org/10.3390/data4040137 - 5 Oct 2019
Cited by 10 | Viewed by 3423
Abstract
The main factors of pathogenesis in the pulmonary tuberculosis are not only the bacterial virulence and sensitivity of the host immune system to the pathogen, but also the degree of destruction of the lung tissue. Such destruction processes lead to the development of [...] Read more.
The main factors of pathogenesis in the pulmonary tuberculosis are not only the bacterial virulence and sensitivity of the host immune system to the pathogen, but also the degree of destruction of the lung tissue. Such destruction processes lead to the development of caverns, in most cases requiring surgical interventions besides the drug therapy. Identification of special biochemical markers allowing to assess the necessity of surgery or therapy prolongation remains a challenge. We consider promising markers—metalloproteinases—analyzing the data obtained from patients with pulmonary tuberculosis infected by different strains of Mycobacterium tuberculosis. We argue that the presence of drug-resistant strains in lungs leading to complicated clinical prognosis could be justified not only by the difference in medians of biomarkers concentration (as determined by the Mann–Whitney test for small samples), but also by the qualitative difference in their probability distributions (as detected by the Kolmogorov–Smirnov test). Our results and the provided raw data could be used for further development of precise biochemical data-based diagnostic and prognostic tools for pulmonary tuberculosis. Full article
(This article belongs to the Special Issue Benchmarking Datasets in Bioinformatics)
Show Figures

Figure 1

18 pages, 2384 KiB  
Article
Geometrical Platform of Big Database Computing for Modeling of Complex Physical Phenomena in Electric Current Treatment of Liquid Metals
by Yuriy Zaporozhets, Artem Ivanov and Yuriy Kondratenko
Data 2019, 4(4), 136; https://doi.org/10.3390/data4040136 - 5 Oct 2019
Cited by 4 | Viewed by 2689
Abstract
According to the principles of multiphysical, multiscale simulation of phenomena and processes which take place during the electric current treatment of liquid metals, the need to create an adjustable and concise geometrical platform for the big database computing of mathematical models and simulations [...] Read more.
According to the principles of multiphysical, multiscale simulation of phenomena and processes which take place during the electric current treatment of liquid metals, the need to create an adjustable and concise geometrical platform for the big database computing of mathematical models and simulations is justified. In this article, a geometrical platform was developed based on approximation of boundary contours using arcs for application of the integral equations method and matrix transformations. This method achieves regular procedures using multidimensional scale matrices for big data transfer and computing. The efficiency of this method was verified by computer simulation and used for different model contours, which are parts of real contours. The obtained results showed that the numerical algorithm was highly accurate based on the presented geometrical platform of big database computing and that it possesses a potential ability for use in the organization of computational processes regarding the modeling and simulation of electromagnetic, thermal, hydrodynamic, wave, and mechanical fields (as a practical case in metal melts treated by electric current). The efficiency of this developed approach for big data matrices computing and equation system formation was displayed, as the number of numerical procedures, as well as the time taken to perform them, were much smaller when compared to the finite element method used for the same model contours. Full article
(This article belongs to the Special Issue Machine Learning and Materials Informatics)
Show Figures

Figure 1

25 pages, 1276 KiB  
Concept Paper
A Transformative Concept: From Data Being Passive Objects to Data Being Active Subjects
by Hans-Peter Plag and Shelley-Ann Jules-Plag
Data 2019, 4(4), 135; https://doi.org/10.3390/data4040135 - 2 Oct 2019
Cited by 2 | Viewed by 3700
Abstract
The exploitation of potential societal benefits of Earth observations is hampered by users having to engage in often tedious processes to discover data and extract information and knowledge. A concept is introduced for a transition from the current perception of data as passive [...] Read more.
The exploitation of potential societal benefits of Earth observations is hampered by users having to engage in often tedious processes to discover data and extract information and knowledge. A concept is introduced for a transition from the current perception of data as passive objects (DPO) to a new perception of data as active subjects (DAS). This transition would greatly increase data usage and exploitation, and support the extraction of knowledge from data products. Enabling the data subjects to actively reach out to potential users would revolutionize data dissemination and sharing and facilitate collaboration in user communities. The three core elements of the transformative DAS concept are: (1) “intelligent semantic data agents” (ISDAs) that have the capabilities to communicate with their human and digital environment. Each ISDA provides a voice to the data product it represents. It has comprehensive knowledge of the represented product including quality, uncertainties, access conditions, previous uses, user feedbacks, etc., and it can engage in transactions with users. (2) A knowledge base that constructs extensive graphs presenting a comprehensive picture of communities of people, applications, models, tools, and resources and provides tools for the analysis of these graphs. (3) An interaction platform that links the ISDAs to the human environment and facilitates transaction including discovery of products, access to products and derived knowledge, modifications and use of products, and the exchange of feedback on the usage. This platform documents the transactions in a secure way maintaining full provenance. Full article
(This article belongs to the Special Issue Earth Observation Data Cubes)
Show Figures

Figure 1

20 pages, 9786 KiB  
Data Descriptor
Assessing Urban Livability through Residential Preference—An International Survey
by Anna Kovacs-Györi and Pablo Cabrera-Barona
Data 2019, 4(4), 134; https://doi.org/10.3390/data4040134 - 1 Oct 2019
Cited by 10 | Viewed by 3902
Abstract
Livability is a popular term for describing the satisfaction of residents with living in a city. The assessment of livability can be of high relevance for urban planning; however, existing assessment methods have various limitations, especially in terms of transferability. In our main [...] Read more.
Livability is a popular term for describing the satisfaction of residents with living in a city. The assessment of livability can be of high relevance for urban planning; however, existing assessment methods have various limitations, especially in terms of transferability. In our main research article, we developed a conceptual framework and an assessment workflow to provide a transferable way of assessing livability, also considering intra-urban differences of the identified livability assessment factors to use for further geospatial analysis. As a key part of this assessment, we developed a survey to investigate residential preference and satisfaction concerning different urban factors. The current Data Descriptor introduces the questionnaire we used, the distribution of the responses, and the most important findings for the socioeconomic and demographic parameters influencing urban livability. We found that the development of an area, the number of persons in the household, and the income level are significant circumstances in assessing how satisfied a person would be with living in a given city. Full article
Show Figures

Figure 1

14 pages, 735 KiB  
Review
A Lack of “Environmental Earth Data” at the Microhabitat Scale Impacts Efforts to Control Invasive Arthropods That Vector Pathogens
by Emily L. Pascoe, Sajid Pareeth, Duccio Rocchini and Matteo Marcantonio
Data 2019, 4(4), 133; https://doi.org/10.3390/data4040133 - 29 Sep 2019
Cited by 6 | Viewed by 3206
Abstract
We currently live in an era of major global change that has led to the introduction and range expansion of numerous invasive species worldwide. In addition to the ecological and economic consequences associated with most invasive species, invasive arthropods that vector pathogens (IAVPs) [...] Read more.
We currently live in an era of major global change that has led to the introduction and range expansion of numerous invasive species worldwide. In addition to the ecological and economic consequences associated with most invasive species, invasive arthropods that vector pathogens (IAVPs) to humans and animals pose substantial health risks. Species distribution models that are informed using environmental Earth data are frequently employed to predict the distribution of invasive species, and to advise targeted mitigation strategies. However, there are currently substantial mismatches in the temporal and spatial resolution of these data and the environmental contexts which affect IAVPs. Consequently, targeted actions to control invasive species or to prepare the population for possible disease outbreaks may lack efficacy. Here, we identify and discuss how the currently available environmental Earth data are lacking with respect to their applications in species distribution modeling, particularly when predicting the potential distribution of IAVPs at meaningful space-time scales. For example, we examine the issues related to interpolation of weather station data and the lack of microclimatic data relevant to the environment experienced by IAVPs. In addition, we suggest how these data gaps can be filled, including through the possible development of a dedicated open access database, where data from both remotely- and proximally-sensed sources can be stored, shared, and accessed. Full article
(This article belongs to the Special Issue Overcoming Data Scarcity in Earth Science)
Show Figures

Figure 1

16 pages, 1939 KiB  
Article
Handling Data Gaps in Reported Field Measurements of Short Rotation Forestry
by Diana-Maria Seserman and Dirk Freese
Data 2019, 4(4), 132; https://doi.org/10.3390/data4040132 - 25 Sep 2019
Viewed by 3335
Abstract
Filling missing data in forest research is paramount for the analysis of primary data, forest statistics, land use strategies, as well as for the calibration/validation of forest growth models. Consequently, our main objective was to investigate several methods of filling missing data under [...] Read more.
Filling missing data in forest research is paramount for the analysis of primary data, forest statistics, land use strategies, as well as for the calibration/validation of forest growth models. Consequently, our main objective was to investigate several methods of filling missing data under a reduced sample size. From a complete dataset containing yearly first-rotation tree growth measurements over a period of eight years, we gradually retrieved two and then four years of measurements, hence operating on 72% and 43% of the original data. Secondly, 15 statistical models, five forest growth functions, and one biophysical, process-oriented, tree growth model were employed for filling these data gap representations accounting for 72% and 43% of the available data. Several models belonging to (i) regression analysis, (ii) statistical imputation, (iii) forest growth functions, and (iv) tree growth models were applied in order to retrieve information about the trees from existing yearly measurements. Subsequently, the findings of this study could lead to finding a handy tool for both researchers and practitioners dealing with incomplete datasets. Moreover, we underline the paramount demand for far-sighted, long-term research projects for the expansion and maintenance of a short rotation forestry (SRF) repository. Full article
(This article belongs to the Special Issue Forest Monitoring Systems and Assessments at Multiple Scales)
Show Figures

Figure 1

13 pages, 9624 KiB  
Data Descriptor
Horsing Around—A Dataset Comprising Horse Movement
by Jacob W. Kamminga, Lara M. Janßen, Nirvana Meratnia and Paul J. M. Havinga
Data 2019, 4(4), 131; https://doi.org/10.3390/data4040131 - 22 Sep 2019
Cited by 11 | Viewed by 5939
Abstract
Movement data were collected at a riding stable over seven days. The dataset comprises data from 18 individual horses and ponies with 1.2 million 2-s data samples, of which 93,303 samples have been tagged with labels (labeled data). Data from 11 subjects were [...] Read more.
Movement data were collected at a riding stable over seven days. The dataset comprises data from 18 individual horses and ponies with 1.2 million 2-s data samples, of which 93,303 samples have been tagged with labels (labeled data). Data from 11 subjects were labeled. The data from six subjects and six activities were labeled more extensively. Data were collected during horse riding sessions and when the horses freely roamed the pasture over seven days. Sensor devices were attached to a collar that was positioned around the neck of horses. The orientation of the sensor devices was not strictly fixed. The sensors devices contained a three-axis accelerometer, gyroscope, and magnetometer and were sampled at 100 Hz. Full article
Show Figures

Figure 1

Previous Issue
Next Issue
Back to TopTop