Dataset of Nile Red Fluorescence Readings with Different Yeast Strains, Solvents, and Incubation Times

 ,
,  ,
,
Abstract
:1. Summary
2. Data Description
3. Methods
Author Contributions
Funding
Acknowledgments
Conflicts of Interest
References
- Kimura, K.; Yamaoka, M.; Kamisaka, Y. Rapid estimation of lipids in oleaginous fungi and yeasts using Nile red fluorescence. J. Microbiol. Methods. 2004, 56, 331–338. [Google Scholar] [CrossRef] [PubMed]
- Sitepu, I.R.; Garay, L.A.; Sestric, R.; Levin, D.; Block, D.E.; German, J.B.; Boundy-Mills, K.L. Oleaginous yeasts for biodiesel: Current and future trends in biology and production. Biotechnol. Adv. 2014, 32, 1336–1360. [Google Scholar] [CrossRef] [PubMed] [Green Version]
- Rostron, K.A.; Lawrence, C.L. Nile red staining of neutral lipids in yeast. In Histochemistry of Single Molecules; Humana Press: New York, NY, USA, 2017; pp. 219–229. [Google Scholar] [CrossRef]
- Patel, A.; Pruthi, V.; Pruthi, P.A. Innovative screening approach for the identification of triacylglycerol accumulating oleaginous strains. Renew. Energy 2019, 135, 936–944. [Google Scholar] [CrossRef]
- Miranda, C.; Bettencourt, S.; Pozdniakova, T.; Pereira, J.; Sampaio, P.; Franco-Duarte, R.; Pais, C. Modified high-throughput Nile red fluorescence assay for the rapid screening of oleaginous yeasts using acetic acid as carbon source. BMC Microbiol. 2020, 20. [Google Scholar] [CrossRef] [PubMed]
- Balan, V. Microbial Lipid Production; Humana Press: New York, NY, USA, 2019; pp. 33–418. [Google Scholar]
- Zhao, C.; Luo, M.T.; Huang, C.; Chen, X.F.; Xiong, L.; Li, H.L.; Chen, X.D. Determining intracellular lipid content of different oleaginous yeasts by one simple and accurate Nile Red fluorescent method. Prep. Biochem. Biotechnol. 2019, 49, 597–605. [Google Scholar] [CrossRef] [PubMed]
- Ramírez-Castrillón, M.; Jaramillo-Garcia, V.P.; Rosa, P.D.; Landell, M.F.; Vu, D.; Fabricio, M.F.; Ayub, M.A.Z.; Robert, V.; Henriques, J.A.P.; Valente, P. The oleaginous yeast Meyerozyma guilliermondii BI281A as a new potential biodiesel feedstock: Selection and lipid production optimization. Front. Microbiol. 2017, 8. [Google Scholar] [CrossRef] [PubMed]
- Poli, J.S.; Rosa, P.D.; Senter, L.; Mendes, S.D.C.; Ramirez-Castrillon, M.; Vainstein, M.H.; Valente, P. Fatty acid methyl esters produced by oleaginous yeast Yarrowia lipolytica QU21: An alternative for vegetable oils. Rev. Bras. Bioci. 2013, 11, 203–208. [Google Scholar]
- Ramírez-Castrillón, M.; Mendes, S.D.; Inostroza-Ponta, M.; Valente, P. (GTG) 5 MSP-PCR fingerprinting as a technique for discrimination of wine associated yeasts? PLoS ONE 2014, 9, e105870. [Google Scholar] [CrossRef] [PubMed]
- Landell, M.F.; Mautone, J.N.; Valente, P. Biodiversity of yeasts associated to bromeliads in Itapuã park, Viamão/RS. Biociências 2006, 14, 144–149. [Google Scholar]
- Gomes, F.F. Identificação molecular da comunidade de leveduras associadas a macrófitas aquáticas em uma região de marisma da Lagoa dos Patos (RS). Bachelor’s Thesis, Universidade Federal do Rio Grande do Sul, Porto Alegre, Brazil, 2016. [Google Scholar]
- Ramirez-Castrillon, M.; Gomes, F.F.; Souza, A.F.; Leite, B.R.; Pagani, D.M.; Valente, P. Papiliotrema maritimi f.a. sp. nov., a new tremellaceous yeast species associated to macrophytes in a Marshland of South Brazil. bioRxiv 2020. [Google Scholar]


| Strain | Species | Source of Isolation | Oleaginous | Reference |
|---|---|---|---|---|
| BI281A | Meyerozyma guilliermondii | Flower Tilandsia gardneri | Yes | [8] |
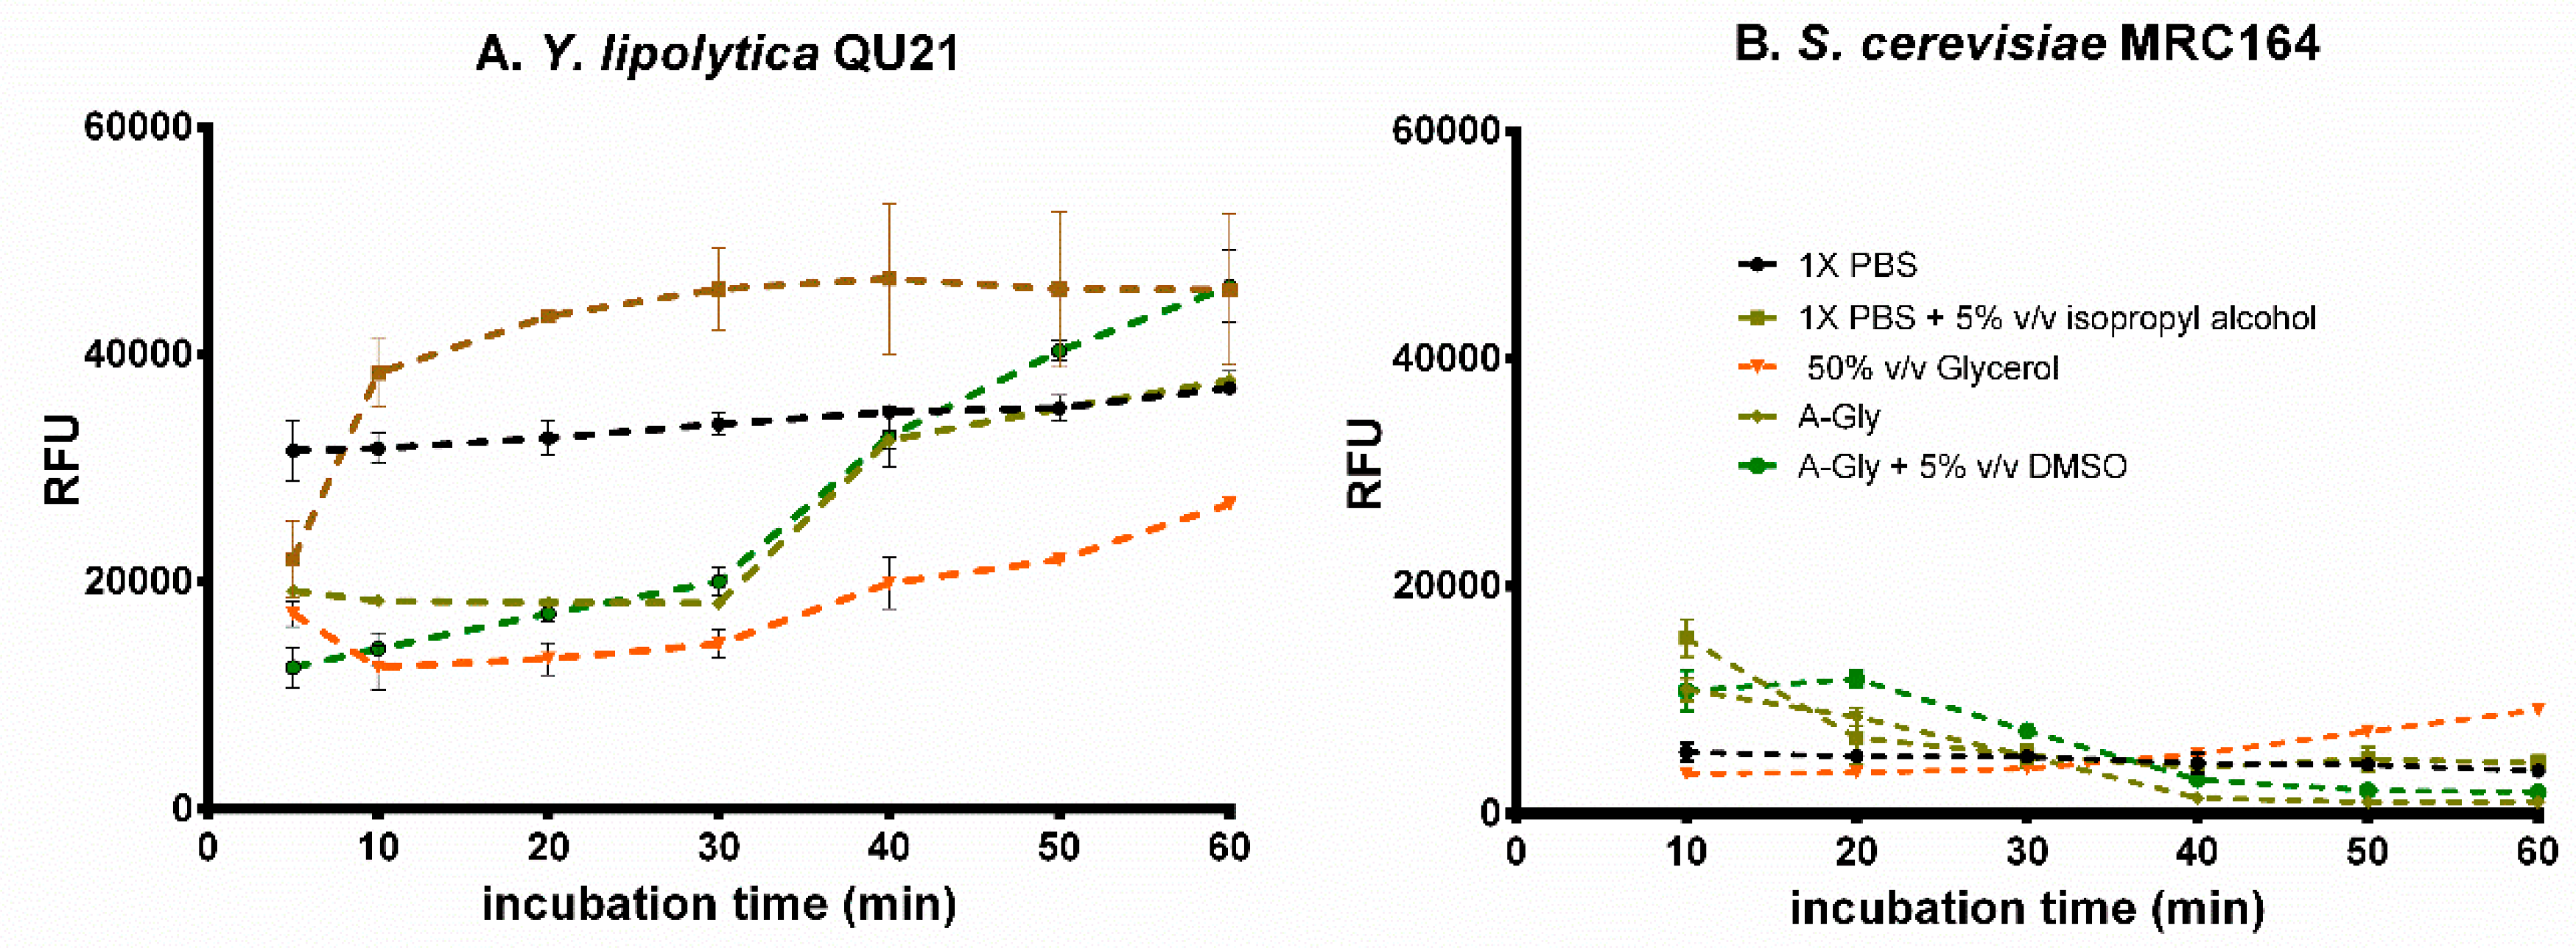
| QU21 | Yarrowia lipolytica | Artisanal cheese | Yes | [9] |
| MRC164 | Saccharomyces cerevisiae | Red wine | No | [10] |
| BI283 | Papiliotrema flavescens | Bromelia antiacantha | Yes | [11] |
| BI296 | Aechmea recurvata | Yes | ||
| BI282 | Bromelia antiacantha | Yes | ||
| BI091 | Flower of Tilandsia crocata | ND * | ||
| BI204 | Tilandsia gardneri | ND * | ||
| BI231 | Vriesea friburgensis | No | ||
| BI276 | Tilandsia gardneri | ND * | ||
| BI081 | Debaryomyces melissophilus | Tilandsia gardneri | No | |
| BI089 | Sporidiobolus pararoseus | Flower of Tilandsia crocata | ND * | |
| BI237 | VishnIacozyma sp. | Vriesea friburgensis | Yes | |
| Bel41 | Occultifur sp. | Bolboschoenus maritimus | No | [12] |
| Bel107 | ND * | |||
| Bel82 | Sporidiobolus sp. | ND * | ||
| Bel40 | Candida sp. | ND * | ||
| Bel106 | Neophaeomoniella sp. | ND * | ||
| Bel49 | Non identified | ND * | ||
| Bel46 | Papiliotrema maritimi sp. nov. | No | [12,13] | |
| Bel88 | No |
| Parameter | Description |
|---|---|
| Data acquisition | All data were obtained with a spectrofluorometer (Perkin Elmer Enspire Multimode Plate Reader 2300 equipment). The optical density was measured in a 96-well test plate. The Fluorescence was measured in black background 96-well test plates (Jet Biofil, China). The data was exported by EnSpire Workstation version 3.00. |
| Data collection parameters | Volume: Solvent with or without cells: 150 μL; Nile Red (50 mg/L): 50 μL. Final volume: 200 μL. Incubation parameters: 5 min or 10 min with orbital shaking (60 rpm, 3 mm diameter) Fluorescence reading: 488 nm of excitation, 585 nm of emission, 100 flashes by well. |
| Data source location | Institution: Universidade Federal do Rio Grande do Sul City/Town/Region: Porto Alegre, Rio Grande do Sul Country: Brazil Latitude and longitude for collected data: 30°04′07.9″ S 51°07′10.9″ W |
© 2020 by the authors. Licensee MDPI, Basel, Switzerland. This article is an open access article distributed under the terms and conditions of the Creative Commons Attribution (CC BY) license (http://creativecommons.org/licenses/by/4.0/).
Share and Cite
Ramirez-Castrillon, M.; Jaramillo-Garcia, V.P.; Barros, H.L.; Henriques, J.A.P.; Stefani, V.; Valente, P. Dataset of Nile Red Fluorescence Readings with Different Yeast Strains, Solvents, and Incubation Times. Data 2020, 5, 77. https://doi.org/10.3390/data5030077
Ramirez-Castrillon M, Jaramillo-Garcia VP, Barros HL, Henriques JAP, Stefani V, Valente P. Dataset of Nile Red Fluorescence Readings with Different Yeast Strains, Solvents, and Incubation Times. Data. 2020; 5(3):77. https://doi.org/10.3390/data5030077
Chicago/Turabian StyleRamirez-Castrillon, Mauricio, Victoria P. Jaramillo-Garcia, Helio Lopes Barros, João A. Pêgas Henriques, Valter Stefani, and Patricia Valente. 2020. "Dataset of Nile Red Fluorescence Readings with Different Yeast Strains, Solvents, and Incubation Times" Data 5, no. 3: 77. https://doi.org/10.3390/data5030077