Next Issue
Volume 5, December
Previous Issue
Volume 5, June


Data, Volume 5, Issue 3 (September 2020) – 30 articles

Cover Story (view full-size image): 
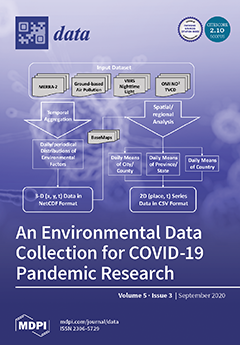
This data descriptor paper introduces a collection of environmental factors, including temperature, humidity, precipitation, NO2 TVCD, air quality index and pollutants and nighttime light. The environmental data are processed and organized across multiple spatiotemporal scales using spatiotemporal aggregation and analytics, e.g., global mapping of daily temperature, humidity and precipitation, daily mean values of climate and weather factors over cities, states/provinces and countries. The data collection can be used for studying the correlation between COVID-19 and the environment, as well as human activities; for example, how the climate/weather conditions slow down or speed up the spread of the pandemic and how COVID-19 mitigation policies impact environmental factors. View this paper
  • Issues are regarded as officially published after their release is announced to the table of contents alert mailing list.
  • You may sign up for e-mail alerts to receive table of contents of newly released issues.
  • PDF is the official format for papers published in both, html and pdf forms. To view the papers in pdf format, click on the "PDF Full-text" link, and use the free Adobe Reader to open them.
Order results
Result details
Section
Select all
Export citation of selected articles as:
11 pages, 314 KiB  
Data Descriptor
Large-Scale Dataset of Local Java Software Build Results
by Matúš Sulír, Michaela Bačíková, Matej Madeja, Sergej Chodarev and Ján Juhár
Data 2020, 5(3), 86; https://doi.org/10.3390/data5030086 - 21 Sep 2020
Cited by 8 | Viewed by 2853
Abstract
When a person decides to inspect or modify a third-party software project, the first necessary step is its successful compilation from source code using a build system. However, such attempts often end in failure. In this data descriptor paper, we provide a dataset [...] Read more.
When a person decides to inspect or modify a third-party software project, the first necessary step is its successful compilation from source code using a build system. However, such attempts often end in failure. In this data descriptor paper, we provide a dataset of build results of open source Java software systems. We tried to automatically build a large number of Java projects from GitHub using their Maven, Gradle, and Ant build scripts in a Docker container simulating a standard programmer’s environment. The dataset consists of the output of two executions: 7264 build logs from a study executed in 2016 and 7233 logs from the 2020 execution. In addition to the logs, we collected exit codes, file counts, and various project metadata. The proportion of failed builds in our dataset is 38% in the 2016 execution and 59% in the 2020 execution. The published data can be helpful for multiple purposes, such as correlation analysis of factors affecting build success, build failure prediction, and research in the area of build breakage repair. Full article
Show Figures

Figure 1

15 pages, 794 KiB  
Article
Bryan’s Maximum Entropy Method—Diagnosis of a Flawed Argument and Its Remedy
by Alexander Rothkopf
Data 2020, 5(3), 85; https://doi.org/10.3390/data5030085 - 17 Sep 2020
Cited by 4 | Viewed by 2570
Abstract
The Maximum Entropy Method (MEM) is a popular data analysis technique based on Bayesian inference, which has found various applications in the research literature. While the MEM itself is well-grounded in statistics, I argue that its state-of-the-art implementation, suggested originally by Bryan, artificially [...] Read more.
The Maximum Entropy Method (MEM) is a popular data analysis technique based on Bayesian inference, which has found various applications in the research literature. While the MEM itself is well-grounded in statistics, I argue that its state-of-the-art implementation, suggested originally by Bryan, artificially restricts its solution space. This restriction leads to a systematic error often unaccounted for in contemporary MEM studies. The goal of this paper is to carefully revisit Bryan’s train of thought, point out its flaw in applying linear algebra arguments to an inherently nonlinear problem, and suggest possible ways to overcome it. Full article
Show Figures

Figure 1

18 pages, 626 KiB  
Article
Information Loss Due to the Data Reduction of Sample Data from Discrete Distributions
by Maryam Moghimi and Herbert W. Corley
Data 2020, 5(3), 84; https://doi.org/10.3390/data5030084 - 13 Sep 2020
Cited by 1 | Viewed by 2526
Abstract
In this paper, we study the information lost when a real-valued statistic is used to reduce or summarize sample data from a discrete random variable with a one-dimensional parameter. We compare the probability that a random sample gives a particular data set to [...] Read more.
In this paper, we study the information lost when a real-valued statistic is used to reduce or summarize sample data from a discrete random variable with a one-dimensional parameter. We compare the probability that a random sample gives a particular data set to the probability of the statistic’s value for this data set. We focus on sufficient statistics for the parameter of interest and develop a general formula independent of the parameter for the Shannon information lost when a data sample is reduced to such a summary statistic. We also develop a measure of entropy for this lost information that depends only on the real-valued statistic but neither the parameter nor the data. Our approach would also work for non-sufficient statistics, but the lost information and associated entropy would involve the parameter. The method is applied to three well-known discrete distributions to illustrate its implementation. Full article
Show Figures

Figure 1

6 pages, 439 KiB  
Data Descriptor
Data on Vietnamese Students’ Acceptance of Using VCTs for Distance Learning during the COVID-19 Pandemic
by Duc-Hoa Pho, Xuan-An Nguyen, Dinh-Hai Luong, Hoai-Thu Nguyen, Thi-Phuong-Thao Vu and Thi-Thuong-Thuong Nguyen
Data 2020, 5(3), 83; https://doi.org/10.3390/data5030083 - 11 Sep 2020
Cited by 7 | Viewed by 4853
Abstract
The outbreak of COVID-19 at the beginning of 2020 has heavily influenced education all around the world. In Vietnam, educational institutes were suspended, and distance learning was conducted to ensure students’ learning process, with distance learning occurring mainly via video conferencing tools (VTCs). [...] Read more.
The outbreak of COVID-19 at the beginning of 2020 has heavily influenced education all around the world. In Vietnam, educational institutes were suspended, and distance learning was conducted to ensure students’ learning process, with distance learning occurring mainly via video conferencing tools (VTCs). The purpose of this paper is to provide data on Vietnamese students’ acceptance of using VCTs in distance learning during the COVID-19 pandemic through an extended technology acceptance model (TAM) and structural equation modeling (SEM) method. This study used the TAM of Venkatesh and Davis. The questionnaire was designed based on Venkatesh and Davis and Salloum et al.’s scale. An online survey with snowball sampling was selected in April. The final dataset consisted of 277 valid records. This data descriptor presented descriptive statistics (mean, standard deviation), internal consistency (Cronbach’s alpha), reliability and validity measures (composite reliability, average value extracted test), and factor loading of items of eight factors: output quality, computer playfulness, subjective norm, perceived usefulness, perceived ease of use, attitude towards to use, behavioral intention to use, and actual system to use. Results indicated that external factors such as subjective norm and computer playfulness had a significant impact on most TAM constructs. Furthermore, output quality was found to have a positive influence on students’ perceived usefulness and acceptance of VCTs in distance learning. Full article
(This article belongs to the Special Issue Big Data and E-learning)
Show Figures

Figure 1

12 pages, 1162 KiB  
Article
Extraction of Missing Tendency Using Decision Tree Learning in Business Process Event Log
by Hiroki Horita, Yuta Kurihashi and Nozomi Miyamori
Data 2020, 5(3), 82; https://doi.org/10.3390/data5030082 - 9 Sep 2020
Cited by 3 | Viewed by 2996
Abstract
In recent years, process mining has been attracting attention as an effective method for improving business operations by analyzing event logs that record what is done in business processes. The event log may contain missing data due to technical or human error, and [...] Read more.
In recent years, process mining has been attracting attention as an effective method for improving business operations by analyzing event logs that record what is done in business processes. The event log may contain missing data due to technical or human error, and if the data are missing, the analysis results will be inadequate. Traditional methods mainly use prediction completion when there are missing values, but accurate completion is not always possible. In this paper, we propose a method for understanding the tendency of missing values in the event log using decision tree learning without supplementing the missing values. We conducted experiments using data from the incident management system and confirmed the effectiveness of our method. Full article
(This article belongs to the Special Issue Challenges in Business Intelligence)
Show Figures

Figure 1

16 pages, 816 KiB  
Review
SARS-CoV-2 Persistence: Data Summary up to Q2 2020
by Gabriele Cervino, Luca Fiorillo, Giovanni Surace, Valeria Paduano, Maria Teresa Fiorillo, Rosa De Stefano, Riccardo Laudicella, Sergio Baldari, Michele Gaeta and Marco Cicciù
Data 2020, 5(3), 81; https://doi.org/10.3390/data5030081 - 9 Sep 2020
Cited by 38 | Viewed by 4875
Abstract
The coronavirus pandemic is causing confusion in the world. This confusion also affects the different guidelines adopted by each country. The persistence of Coronavirus, responsible for coronavirus disease 2019 (Covid-19) has been evaluated by different articles, but it is still not well-defined, and [...] Read more.
The coronavirus pandemic is causing confusion in the world. This confusion also affects the different guidelines adopted by each country. The persistence of Coronavirus, responsible for coronavirus disease 2019 (Covid-19) has been evaluated by different articles, but it is still not well-defined, and the method of diffusion is unclear. The aim of this manuscript is to underline new Coronavirus persistence features on different environments and surfaces. The scientific literature is still poor on this topic and research is mainly focused on therapy and diagnosis, rather than the characteristics of the virus. These data could be an aid to summarize virus features and formulate new guidelines and anti-spread strategies. Full article
(This article belongs to the Special Issue Data-Driven Modelling of Infectious Diseases)
Show Figures

Figure 1

27 pages, 2746 KiB  
Review
The Interaction between Internet, Sustainable Development, and Emergence of Society 5.0
by Vasja Roblek, Maja Meško, Mirjana Pejić Bach, Oshane Thorpe and Polona Šprajc
Data 2020, 5(3), 80; https://doi.org/10.3390/data5030080 - 8 Sep 2020
Cited by 39 | Viewed by 9818
Abstract
(1) Background: The importance of this article is to analyze the technological developments in the field of the Internet and Internet technologies and to determine their significance for sustainable development, which will result in the emergence of Society 5.0. (2) The authors used [...] Read more.
(1) Background: The importance of this article is to analyze the technological developments in the field of the Internet and Internet technologies and to determine their significance for sustainable development, which will result in the emergence of Society 5.0. (2) The authors used automated content analysis for the analysis of 552 articles published in 306 scientific journals indexed by SCII and/or SCI - EXPANDED (Web of Science (WOS) platform). The goal of the research was to present the relationship between the Internet and sustainable development. (3) Results: The results of the analysis show that the top four most important themes in the selected journals were “development”, “information”, “data”, and “business and services”. (4) Conclusions: Our research approach emphasizes the importance of the culmination of scientific innovation with the conceptual, technological and contextual frameworks of the Internet and Internet technology usage and its impact on sustainable development and the emergence of the Society 5.0. Full article
(This article belongs to the Special Issue Development of a Smart Future under Society 5.0)
Show Figures

Figure 1

36 pages, 18219 KiB  
Article
Assessing Sustainability of the Capital and Emerging Secondary Cities of Cambodia Based on the 2018 Commune Database
by Puthearath Chan
Data 2020, 5(3), 79; https://doi.org/10.3390/data5030079 - 7 Sep 2020
Cited by 16 | Viewed by 6548
Abstract
The world is rapidly urbanizing which 68% of its population is expected to live in urban areas by 2050. Likewise, secondary cities of Cambodia are rapidly emerging while the capital is the largest city with a population of more than two million. Improving [...] Read more.
The world is rapidly urbanizing which 68% of its population is expected to live in urban areas by 2050. Likewise, secondary cities of Cambodia are rapidly emerging while the capital is the largest city with a population of more than two million. Improving urban sustainability is, therefore, necessary for the world, as well as Cambodia. Thus, Cambodia has launched clean city standard indicators, proposed sectoral green city indicators, and adapted one target of global sustainable development goal 11 (UN SDG 11), to improve its urban quality and sustainability. However, using these indicators is not sufficient towards achieving urban sustainability because these indicators are limited in social and economic dimensions. Hence, this study aims to develop all dimensional indicators of sustainability based on all targets of UN SDG 11 with the above indicators. This study focused on the priorities of indicators in Cambodia verified and prioritized by Delphi and analytic hierarchy process (AHP) techniques. Then, a priority-based urban sustainability index for Cambodia was formed based on the concept of sustainability in developing countries. Finally, the standard scores were applied to comparatively assess the sustainability of capital and emerging secondary cities of Cambodia based on the 2018 Commune Database. Through this application, the study also sought to find out whether the priority weights of indicators are necessary for the comparative assessment. The results showed that the sustainability levels of Phnom Penh and Sihanoukville were found to be strong in all environmental, social, and economic dimensions. Battambang is also strong although economic sustainability is slightly lower than the average. Siem Reap is low in economic sustainability level while Poi Pet is remarkably low in environmental and social sustainability. Furthermore, the ranks of sustainability levels of the five cities based on weighted scores are different from their ranks based on unweighted scores. Therefore, this study confirms that priority weights of indicators are necessary for the comparative assessment towards improving the accuracy of the comparison. Full article
Show Figures

Figure 1

7 pages, 3417 KiB  
Data Descriptor
13C NMR Dataset Qualitative Analysis of Grecian Wines
by Alberto Mannu, Ioannis K. Karabagias, Salvatore Baldino, Cristina Prandi, Vassilios K. Karabagias and Anastasia V. Badeka
Data 2020, 5(3), 78; https://doi.org/10.3390/data5030078 - 5 Sep 2020
Cited by 1 | Viewed by 2553
Abstract
The development of analytical techniques for characterizing food samples, especially for the wine industry, is a main topic of research. Regarding the classification of wines based on their geographical origin, nuclear magnetic resonance (NMR) spectroscopy represents a fast and effective tool for determining [...] Read more.
The development of analytical techniques for characterizing food samples, especially for the wine industry, is a main topic of research. Regarding the classification of wines based on their geographical origin, nuclear magnetic resonance (NMR) spectroscopy represents a fast and effective tool for determining chemical fingerprints. Herein, a 13C NMR dataset, which was acquired for classification of Grecian wines through multivariate statistics, is reported and described. Thus, the main qualitative differences between grapes of the same geographical origin, observable by the visual analysis of the 13C NMR data, are discussed. Full article
Show Figures

Figure 1

6 pages, 1523 KiB  
Data Descriptor
Dataset of Nile Red Fluorescence Readings with Different Yeast Strains, Solvents, and Incubation Times
by Mauricio Ramirez-Castrillon, Victoria P. Jaramillo-Garcia, Helio Lopes Barros, João A. Pêgas Henriques, Valter Stefani and Patricia Valente
Data 2020, 5(3), 77; https://doi.org/10.3390/data5030077 - 1 Sep 2020
Cited by 2 | Viewed by 3898
Abstract
We used Nile red to estimate lipid content in oleaginous yeasts using a high-throughput approach. We measured the fluorescence intensity of Nile red using different solvents, yeast strains, and incubation times in optimized excitation/emission wavelengths. The data show the relative fluorescence units (RFU) [...] Read more.
We used Nile red to estimate lipid content in oleaginous yeasts using a high-throughput approach. We measured the fluorescence intensity of Nile red using different solvents, yeast strains, and incubation times in optimized excitation/emission wavelengths. The data show the relative fluorescence units (RFU) for Nile red excitation, using 1× PBS, 1× PBS and 5% v/v isopropyl alcohol, 50% v/v glycerol, culture medium A-gly broth, and A-gly broth supplemented with 5% v/v DMSO. In addition, we showed the RFU for the Nile red dye for different oleaginous and non-oleaginous yeast strains, such as Meyerozyma guilliermondii BI281A, Yarrowia lipolytica QU21 and Saccharomyces cerevisiae MRC164. Other measurements of lipid accumulation kinetics were shown for the above and additional yeast strains. These datasets provide the guidelines to obtain the optimal solvent system and the minimal interaction time for the Nile red dye to enter in the cells and obtain a stable readout. Full article
Show Figures

Figure 1

19 pages, 5922 KiB  
Article
Non-Spatial Data towards Spatially Located News about COVID-19: A Semi-Automated Aggregator of Pandemic Data from (Social) Media within the Olomouc Region, Czechia
by Jakub Konicek, Rostislav Netek, Tomas Burian, Tereza Novakova and Jakub Kaplan
Data 2020, 5(3), 76; https://doi.org/10.3390/data5030076 - 30 Aug 2020
Cited by 3 | Viewed by 3305
Abstract
The article describes the process of aggregation of media-based data about the coronavirus pandemic in the Olomouc region, the Czech Republic. Originally non-spatially located news from different sources and various platforms (government, social media, news portals) were automatically aggregated into a centralized database. [...] Read more.
The article describes the process of aggregation of media-based data about the coronavirus pandemic in the Olomouc region, the Czech Republic. Originally non-spatially located news from different sources and various platforms (government, social media, news portals) were automatically aggregated into a centralized database. The application “COVID-map” is an interactive web map solution which visualizes records from the database in a spatial way. The COVID-map has been developed within the Ad hoc online hackathon as an academic project at the Department of Geoinformatics, Palacký University Olomouc, Czech Republic. Alongside spatially localized data, the map application collects statistical data from official sources e.g., from the governmental crisis management office. The impact of the application was immediate. Within a few days after the launch, tens of thousands users per day visited the COVID-map. It has been published by regional and national media. The COVID-map solution could be considered as a suitable implementation of the correctly used cartographical method for the example of the coronavirus pandemic. Full article
(This article belongs to the Special Issue Data-Driven Modelling of Infectious Diseases)
Show Figures

Figure 1

12 pages, 9898 KiB  
Data Descriptor
High-Resolution Surface Water Classifications of the Xingu River, Brazil, Pre and Post Operationalization of the Belo Monte Hydropower Complex
by Margaret Kalacska, Oliver Lucanus, Leandro Sousa and J. Pablo Arroyo-Mora
Data 2020, 5(3), 75; https://doi.org/10.3390/data5030075 - 29 Aug 2020
Cited by 9 | Viewed by 4755
Abstract
We describe a new high spatial resolution surface water classification dataset generated for the Xingu river, Brazil, from its confluence with the Iriri river to the Pimental dam prior to construction of the Belo Monte hydropower complex, and after its operationalization. This river [...] Read more.
We describe a new high spatial resolution surface water classification dataset generated for the Xingu river, Brazil, from its confluence with the Iriri river to the Pimental dam prior to construction of the Belo Monte hydropower complex, and after its operationalization. This river is well-known for its exceptionally high diversity and endemism in ichthyofauna. Pre-existing datasets generated from moderate resolution satellite imagery (e.g., 30 m) do not adequately capture the extent of the river. Accurate measurements of water extent are important for a range of applications utilizing surface water data, including greenhouse gas emission estimation, land cover change mapping, and habitat loss/change estimates, among others. We generated the new classifications from RapidEye imagery (5 m pixel size) for 2011 and PlanteScope imagery (3 m pixel size) for 2019 using a Geographic Object Based Image Analysis (GEOBIA) approach. Full article
Show Figures

Figure 1

9 pages, 2103 KiB  
Data Descriptor
Stark Broadening of Co II Lines in Stellar Atmospheres
by Zlatko Majlinger, Milan S. Dimitrijević and Vladimir A. Srećković
Data 2020, 5(3), 74; https://doi.org/10.3390/data5030074 - 27 Aug 2020
Cited by 6 | Viewed by 2203
Abstract
Data for Stark full widths at half maximum for 46 Co II multiplets were calculated using a modified semiempirical method. In order to show the applicability and usefulness of this set of data for research into white dwarf and A type star atmospheres, [...] Read more.
Data for Stark full widths at half maximum for 46 Co II multiplets were calculated using a modified semiempirical method. In order to show the applicability and usefulness of this set of data for research into white dwarf and A type star atmospheres, the obtained results were used to investigate the significance of the Stark broadening mechanism for Co II lines in the atmospheres of these objects. We examined the influence of surface gravity (log g), effective temperature and the wavelength of the spectral line on the importance of the inclusion of Stark broadening contribution in the profiles of the considered Co II spectral lines, for plasma conditions in atmospheric layers corresponding to different optical depths. Full article
(This article belongs to the Special Issue Astronomy in the Big Data Era: Perspectives)
Show Figures

Figure 1

17 pages, 361 KiB  
Data Descriptor
Forty Years of the Applications of Stark Broadening Data Determined with the Modified Semiempirical Method
by Milan S. Dimitrijević
Data 2020, 5(3), 73; https://doi.org/10.3390/data5030073 - 23 Aug 2020
Cited by 18 | Viewed by 2574
Abstract
The aim of this paper is to analyze the various uses of Stark broadening data for non-hydrogenic lines emitted from plasma, obtained with the modified semiempirical method formulated 40 years ago (1980), which are continuously implemented in the STARK-B database. In such a [...] Read more.
The aim of this paper is to analyze the various uses of Stark broadening data for non-hydrogenic lines emitted from plasma, obtained with the modified semiempirical method formulated 40 years ago (1980), which are continuously implemented in the STARK-B database. In such a way one can identify research fields where they are applied and better see the needs of users in order to better plan future work. This is done by analysis of citations of the modified semiempirical method and the corresponding data in international scientific journals, excluding cases when they are used for comparison with other experimental or theoretical Stark broadening data or for development of the theory of Stark broadening. On the basis of our analysis, one can conclude that the principal applications of such data are in astronomy (white dwarfs, A and B stars, and opacity), investigations of laser produced plasmas, laser design and optimization and their applications in industry and technology (ablation, laser melting, deposition, plasma during electrolytic oxidation, laser micro sintering), as well as for the determination of radiative properties of various plasmas, plasma diagnostics, and investigations of regularities and systematic trends of Stark broadening parameters. Full article
(This article belongs to the Special Issue Astronomy in the Big Data Era: Perspectives)
19 pages, 1775 KiB  
Article
Data Analysis of Land Use Change and Urban and Rural Impacts in Lagos State, Nigeria
by Olalekan O. Onilude and Eric Vaz
Data 2020, 5(3), 72; https://doi.org/10.3390/data5030072 - 11 Aug 2020
Cited by 10 | Viewed by 6101
Abstract
This study examines land use change and impacts on urban and rural activity in Lagos State, Nigeria. To achieve this, multi-temporal land use and land cover (LULC) datasets derived from the GlobeLand30 product of years 2000 and 2010 for urban and rural areas [...] Read more.
This study examines land use change and impacts on urban and rural activity in Lagos State, Nigeria. To achieve this, multi-temporal land use and land cover (LULC) datasets derived from the GlobeLand30 product of years 2000 and 2010 for urban and rural areas of Lagos State were imported into ArcMap 10.6 and converted to raster files (raster thematic maps) for spatial analysis in the FRAGSTATS situated in the Patch Analyst. Thus, different landscape metrics were computed to generate statistical results. The results have shown that fragmentation of cultivated lands increased in the rural areas but decreased in the urban areas. Also, the findings display that land-use change resulted in incremental fragmentation of forest in the urban areas, and reduction in the rural areas. The fragmentation measure of diversity increased in the urban areas, while it decreased in the rural areas during the period of study. These results suggest that cultivated land fragmentation is a complex process connected with socio-economic trends at regional and local levels. In addition, this study has shown that landscape metrics can be used to understand the spatial pattern of LULC change in an urban-rural context. Finally, the outcomes of this study will help the policymakers at the three levels of governments in Nigeria to make crucial informed decisions about sustainable land use. Full article
(This article belongs to the Section Spatial Data Science and Digital Earth)
Show Figures

Figure 1

6 pages, 2205 KiB  
Data Descriptor
Displacements of an Active Moderately Rapid Landslide—A Dataset Retrieved by Continuous GNSS Arrays
by Marco Mulas, Giuseppe Ciccarese, Giovanni Truffelli and Alessandro Corsini
Data 2020, 5(3), 71; https://doi.org/10.3390/data5030071 - 8 Aug 2020
Cited by 7 | Viewed by 2407
Abstract
This paper describes a dataset of continuous GNSS positioning solutions referring to slope movements in the Ca’ Lita landslide (Northern Apennines, Italy). The dataset covers the period from 24 March 2016 to 17 July 2019 and includes time-series of the daily position of [...] Read more.
This paper describes a dataset of continuous GNSS positioning solutions referring to slope movements in the Ca’ Lita landslide (Northern Apennines, Italy). The dataset covers the period from 24 March 2016 to 17 July 2019 and includes time-series of the daily position of three GNSS rovers located in different parts of the landslide: head zone, upper track zone, and lower track zone. Two different types of continuous GNSS arrays have been used: one is based on high-end Leica geodetic receivers, and the other is based on low-cost effective Emlid receivers. Displacements captured in the dataset are up to more than a hundred meters and are characterized by prolonged phases of slow movement and moderately rapid acceleration phases. The data presented in this contribution were used to underline slope processes and validate displacements retrieved by the application of digital image correlation to a stack of a satellite images. Full article
Show Figures

Figure 1

13 pages, 9401 KiB  
Data Descriptor
A Multi-Annotator Survey of Sub-km Craters on Mars
by Alistair Francis, Jonathan Brown, Thomas Cameron, Reuben Crawford Clarke, Romilly Dodd, Jennifer Hurdle, Matthew Neave, Jasmine Nowakowska, Viran Patel, Arianne Puttock, Oliver Redmond, Aaron Ruban, Damien Ruban, Meg Savage, Wiggert Vermeer, Alice Whelan, Panagiotis Sidiropoulos and Jan-Peter Muller
Data 2020, 5(3), 70; https://doi.org/10.3390/data5030070 - 3 Aug 2020
Cited by 7 | Viewed by 4354
Abstract
We present here a dataset of nearly 5000 small craters across roughly 1700 km2 of the Martian surface, in the MC-11 East quadrangle. The dataset covers twelve 2000-by-2000 pixel Context Camera images, each of which is comprehensively labelled by six annotators, whose [...] Read more.
We present here a dataset of nearly 5000 small craters across roughly 1700 km2 of the Martian surface, in the MC-11 East quadrangle. The dataset covers twelve 2000-by-2000 pixel Context Camera images, each of which is comprehensively labelled by six annotators, whose results are combined using agglomerative clustering. Crater size-frequency distributions are centrally important to the estimation of planetary surface ages, in lieu of in-situ sampling. Older surfaces are exposed to meteoritic impactors for longer and, thus, are more densely cratered. However, whilst populations of larger craters are well understood, the processes governing the production and erosion of small (sub-km) craters are more poorly constrained. We argue that, by surveying larger numbers of small craters, the planetary science community can reduce some of the current uncertainties regarding their production and erosion rates. To this end, many have sought to use state-of-the-art object detection techniques utilising Deep Learning, which—although powerful—require very large amounts of labelled training data to perform optimally. This survey gives researchers a large dataset to analyse small crater statistics over MC-11 East, and allows them to better train and validate their crater detection algorithms. The collection of these data also demonstrates a multi-annotator method for the labelling of many small objects, which produces an estimated confidence score for each annotation and annotator. Full article
(This article belongs to the Special Issue Astronomy in the Big Data Era: Perspectives)
Show Figures

Figure 1

18 pages, 5388 KiB  
Article
Towing Test Data Set of the Kyushu University Kite System
by Mostafa A. Rushdi, Tarek N. Dief, Shigeo Yoshida and Roland Schmehl
Data 2020, 5(3), 69; https://doi.org/10.3390/data5030069 - 3 Aug 2020
Cited by 4 | Viewed by 3607
Abstract
Kites can be used to harvest wind energy with substantially lower material and environmental footprints and a higher capacity factor than conventional wind turbines. In this paper, we present measurement data from seven individual tow tests with the kite system developed by Kyushu [...] Read more.
Kites can be used to harvest wind energy with substantially lower material and environmental footprints and a higher capacity factor than conventional wind turbines. In this paper, we present measurement data from seven individual tow tests with the kite system developed by Kyushu University. This system was designed for 7 kW traction power and comprises an inflatable wing of 6 m2 surface area with a suspended kite control unit that is towed on a relatively short tether of 0.4 m by a truck driving at constant speed along a straight runway. To produce a controlled relative flow environment, the experiment was conducted only when the background wind speed was negligible. We recorded the time-series of 11 different sensor values acquired on the kite, the control unit and the truck. The measured data can be used to assess the effects of the towing speed, the flight mode and the lengths of the control lines on the tether force. Full article
Show Figures

Figure 1

13 pages, 532 KiB  
Data Descriptor
An Environmental Data Collection for COVID-19 Pandemic Research
by Qian Liu, Wei Liu, Dexuan Sha, Shubham Kumar, Emily Chang, Vishakh Arora, Hai Lan, Yun Li, Zifu Wang, Yadong Zhang, Zhiran Zhang, Jackson T. Harris, Srikar Chinala and Chaowei Yang
Data 2020, 5(3), 68; https://doi.org/10.3390/data5030068 - 3 Aug 2020
Cited by 22 | Viewed by 8633
Abstract
The COVID-19 viral disease surfaced at the end of 2019 and quickly spread across the globe. To rapidly respond to this pandemic and offer data support for various communities (e.g., decision-makers in health departments and governments, researchers in academia, public citizens), the National [...] Read more.
The COVID-19 viral disease surfaced at the end of 2019 and quickly spread across the globe. To rapidly respond to this pandemic and offer data support for various communities (e.g., decision-makers in health departments and governments, researchers in academia, public citizens), the National Science Foundation (NSF) spatiotemporal innovation center constructed a spatiotemporal platform with various task forces including international researchers and implementation strategies. Compared to similar platforms that only offer viral and health data, this platform views virus-related environmental data collection (EDC) an important component for the geospatial analysis of the pandemic. The EDC contains environmental factors either proven or with potential to influence the spread of COVID-19 and virulence or influence the impact of the pandemic on human health (e.g., temperature, humidity, precipitation, air quality index and pollutants, nighttime light (NTL)). In this platform/framework, environmental data are processed and organized across multiple spatiotemporal scales for a variety of applications (e.g., global mapping of daily temperature, humidity, precipitation, correlation of the pandemic to the mean values of climate and weather factors by city). This paper introduces the raw input data, construction and metadata of reprocessed data, and data storage, as well as the sharing and quality control methodologies of the COVID-19 related environmental data collection. Full article
(This article belongs to the Special Issue Data-Driven Modelling of Infectious Diseases)
Show Figures

Figure 1

20 pages, 4644 KiB  
Data Descriptor
Multi-Slot BLE Raw Database for Accurate Positioning in Mixed Indoor/Outdoor Environments
by Fernando J. Aranda, Felipe Parralejo, Fernando J. Álvarez and Joaquín Torres-Sospedra
Data 2020, 5(3), 67; https://doi.org/10.3390/data5030067 - 30 Jul 2020
Cited by 29 | Viewed by 4828
Abstract
The technologies and sensors embedded in smartphones have contributed to the spread of disruptive applications built on top of Location Based Services (LBSs). Among them, Bluetooth Low Energy (BLE) has been widely adopted for proximity and localization, as it is a simple but [...] Read more.
The technologies and sensors embedded in smartphones have contributed to the spread of disruptive applications built on top of Location Based Services (LBSs). Among them, Bluetooth Low Energy (BLE) has been widely adopted for proximity and localization, as it is a simple but efficient positioning technology. This article presents a database of received signal strength measurements (RSSIs) on BLE signals in a real positioning system. The system was deployed on two buildings belonging to the campus of the University of Extremadura in Badajoz. the database is divided into three different deployments, changing in each of them the number of measurement points and the configuration of the BLE beacons. the beacons used in this work can broadcast up to six emission slots simultaneously. Fingerprinting positioning experiments are presented in this work using multiple slots, improving positioning accuracy when compared with the traditional single slot approach. Full article
(This article belongs to the Special Issue Data from Smartphones and Wearables)
Show Figures

Figure 1

11 pages, 825 KiB  
Data Descriptor
Measurements of Mobile Blockchain Execution Impact on Smartphone Battery
by Yulia Bardinova, Konstantin Zhidanov, Sergey Bezzateev, Mikhail Komarov and Aleksandr Ometov
Data 2020, 5(3), 66; https://doi.org/10.3390/data5030066 - 30 Jul 2020
Cited by 8 | Viewed by 3783
Abstract
This is a data descriptor paper for a set of the battery output data measurements during the turned on display discharge process caused by the execution of modern mobile blockchain projects on Android devices. The measurements were executed for Proof-of-Work (PoW) and Proof-of-Activity [...] Read more.
This is a data descriptor paper for a set of the battery output data measurements during the turned on display discharge process caused by the execution of modern mobile blockchain projects on Android devices. The measurements were executed for Proof-of-Work (PoW) and Proof-of-Activity (PoA) consensus algorithms. In this descriptor, we give examples of Samsung Galaxy S9 operation while a broader range of measurements is available in the dataset. Examples provide the data about battery output current, output voltage, temperature, and status. We also show the measurements obtained utilizing short-range (IEEE 802.11n) and cellular (LTE) networks. This paper describes the proposed dataset and the method employed to gather the data. To provide a further understanding of the dataset’s nature, an analysis of the collected data is also briefly presented. This dataset may be of interest to both researchers from information security and human–computer interaction fields and industrial distributed ledger/blockchain developers. Full article
(This article belongs to the Special Issue Data from Smartphones and Wearables)
Show Figures

Figure 1

12 pages, 636 KiB  
Data Descriptor
Novel Molecular Resources to Facilitate Future Genetics Research on Freshwater Mussels (Bivalvia: Unionidae)
by Nathan A. Johnson and Chase H. Smith
Data 2020, 5(3), 65; https://doi.org/10.3390/data5030065 - 30 Jul 2020
Cited by 2 | Viewed by 2186
Abstract
Molecular data have been an integral tool in the resolution of the evolutionary relationships and systematics of freshwater mussels, despite the limited number of nuclear markers available for Sanger sequencing. To facilitate future studies, we evaluated the phylogenetic informativeness of loci from the [...] Read more.
Molecular data have been an integral tool in the resolution of the evolutionary relationships and systematics of freshwater mussels, despite the limited number of nuclear markers available for Sanger sequencing. To facilitate future studies, we evaluated the phylogenetic informativeness of loci from the recently published anchored hybrid enrichment (AHE) probe set Unioverse and developed novel Sanger primer sets to amplify two protein-coding nuclear loci with high net phylogenetic informativeness scores: fem-1 homolog C (FEM1) and UbiA prenyltransferase domain-containing protein 1 (UbiA). We report the methods used for marker development, along with the primer sequences and optimized PCR and thermal cycling conditions. To demonstrate the utility of these markers, we provide haplotype networks, DNA alignments, and summary statistics regarding the sequence variation for the two protein-coding nuclear loci (FEM1 and UbiA). Additionally, we compare the DNA sequence variation of FEM1 and UbiA to three loci commonly used in freshwater mussel genetic studies: the mitochondrial genes cytochrome c oxidase subunit 1 (CO1) and NADH dehydrogenase subunit 1 (ND1), and the nuclear internal transcribed spacer 1 (ITS1). All five loci distinguish among the three focal species (Potamilus fragilis, Potamilus inflatus, and Potamilus purpuratus), and the sequence variation was highest for ND1, followed by CO1, ITS1, UbiA, and FEM1, respectively. The newly developed Sanger PCR primers and methodologies for extracting additional loci from AHE probe sets have great potential to facilitate molecular investigations targeting supraspecific relationships in freshwater mussels, but may be of limited utility at shallow taxonomic scales. Full article
Show Figures

Figure 1

19 pages, 17789 KiB  
Article
A Dataset to Evaluate IEEE 802.15.4g SUN for Dependable Low-Power Wireless Communications in Industrial Scenarios
by Pere Tuset-Peiró, Ruan D. Gomes, Pascal Thubert, Eva Cuerva, Eduard Egusquiza and Xavier Vilajosana
Data 2020, 5(3), 64; https://doi.org/10.3390/data5030064 - 23 Jul 2020
Cited by 7 | Viewed by 4287
Abstract
This article presents a dataset obtained from the deployment of an IEEE 802.15.4g SUN (Smart Utility Network) single-hop network (11 nodes) in a large industrial scenario (110,044 m 2 ) for a long period of time (99 days). The dataset contains ∼11 M [...] Read more.
This article presents a dataset obtained from the deployment of an IEEE 802.15.4g SUN (Smart Utility Network) single-hop network (11 nodes) in a large industrial scenario (110,044 m 2 ) for a long period of time (99 days). The dataset contains ∼11 M entries with RSSI (Received Signal Strength Indicator), CCA (Clear Channel Assessment), and PDR (Packet Delivery Ratio) values. The analyzed results show a high variability in the average RSSI (i.e., between −82.1 dBm and −101.7 dBm) and CCA (i.e., between −111.2 dBm and −119.9 dBm) values, which is caused by the effects of multi-path propagation and external interference. Despite being above the sensitivity limit for each modulation, these values result in poor average PDR values (i.e., from 65.9% to 87.4%), indicating that additional schemes are needed to meet the link reliability requirements of industrial applications. Hence, the presented dataset will allow researchers and practitioners to propose novel mechanisms and evaluate their performance using realistic conditions, enabling the dependability vision of the RAW (Reliable and Available Wireless) WG (Working Group) at the IETF (Internet Engineering Task Force). Full article
Show Figures

Figure 1

4 pages, 198 KiB  
Data Descriptor
Genotyping by Sequencing Reads of 20 Vicia faba Lines with High and Low Vicine and Convicine Content
by Felix Heinrich, Mehmet Gültas, Wolfgang Link and Armin Otto Schmitt
Data 2020, 5(3), 63; https://doi.org/10.3390/data5030063 - 20 Jul 2020
Viewed by 2705
Abstract
The grain faba bean (Vicia faba) which belongs to the family of the Leguminosae, is a crop that is grown worldwide for consumption by humans and livestock. Despite being a rich source of plant-based protein and various agro-ecological advantages its usage [...] Read more.
The grain faba bean (Vicia faba) which belongs to the family of the Leguminosae, is a crop that is grown worldwide for consumption by humans and livestock. Despite being a rich source of plant-based protein and various agro-ecological advantages its usage is limited due to its anti-nutrients in the form of the seed-compounds vicine and convicine (V+C). While markers for a low V+C content exist the underlying pathway and the responsible genes have remained unknown for a long time and only recently a possible pathway and enzyme were found. Genetic research into Vicia faba is difficult due to the lack of a reference genome and the near exclusivity of V+C to the species. Here, we present sequence reads obtained through genotyping-by-sequencing of 20 Vicia faba lines with varying V+C contents. For each line, ∼3 million 150 bp paired end reads are available. This data can be useful in the genomic research of Vicia faba in general and its V+C content in particular. Full article
15 pages, 1021 KiB  
Data Descriptor
Luxembourg Fund Data Repository
by Angeliki Skoura, Julian Presber and Jang Schiltz
Data 2020, 5(3), 62; https://doi.org/10.3390/data5030062 - 19 Jul 2020
Viewed by 4640
Abstract
In this paper, we introduce the Luxembourg Fund Data Repository, a novel database of investment funds available for academic research that was created at the Department of Finance of the University of Luxembourg. The database contains the population of Undertakings for Collective Investment [...] Read more.
In this paper, we introduce the Luxembourg Fund Data Repository, a novel database of investment funds available for academic research that was created at the Department of Finance of the University of Luxembourg. The database contains the population of Undertakings for Collective Investment in Transferable Securities funds domiciled in Luxembourg from the starting month of their existence (March 1988) to October 2016. The fund characteristics are organized in a comprehensive database architecture encompassing static and dynamic data over the entire life of the funds. The characteristics include fund identifiers, official name, status information, management company and other service providers, daily and monthly performance time-series, portfolio holdings, classification of investment objective, fees, dividends, and cash flows. The database was constructed after collecting and assembling complementary historical information from three data providers. Importantly, funds no longer in existence due to liquidation or mergers are included in the database, preventing survivorship bias. The database has been constructed to serve as a research dataset of high accuracy due to the maximization of population coverage, the maximization of historical coverage, and validation by using information acquired from the supervisory authority of the financial sector of Luxembourg. License currently available to researchers of the Department of Finance of the University of Luxembourg. Future plans for extending accessibility to the global academic community. Full article
Show Figures

Figure 1

11 pages, 9370 KiB  
Data Descriptor
Single-Beam Acoustic Doppler Profiler and Co-Located Acoustic Doppler Velocimeter Flow Velocity Data
by Marilou Jourdain de Thieulloy, Mairi Dorward, Chris Old, Roman Gabl, Thomas Davey, David M. Ingram and Brian G. Sellar
Data 2020, 5(3), 61; https://doi.org/10.3390/data5030061 - 14 Jul 2020
Cited by 6 | Viewed by 4305
Abstract
Acoustic Doppler Profilers (ADPs) are routinely used to measure flow velocity in the ocean, enabling multi-points measurement along a profile while Acoustic Doppler Velocimeters (ADVs) are laboratory instruments that provide very precise point velocity measurement. The experimental set-up allows laboratory comparison of measurement [...] Read more.
Acoustic Doppler Profilers (ADPs) are routinely used to measure flow velocity in the ocean, enabling multi-points measurement along a profile while Acoustic Doppler Velocimeters (ADVs) are laboratory instruments that provide very precise point velocity measurement. The experimental set-up allows laboratory comparison of measurement from these two instruments. Simultaneous multi-point measurements of velocity along the horizontal tank profile from Single-Beam Acoustic Doppler Profiler (SB-ADP) were compared against multiple co-located point measurements from an ADV. Measurements were performed in the FloWave Ocean Energy Research Facility at the University of Edinburgh at flow velocities between 0.6 ms 1 and 1.2 ms 1 . This paper describes the data; the analysis of the inter-instrument comparison is presented in an associated Sensors paper by the same authors. This data-set contains (a) time series of raw SB-ADP uni-directional velocity measurements along a 10 m tank profile binned into 54 measurements cells and (b) ADV point measurements of three-directional velocity time series recorded in beam coordinates at selected locations along the profile. Associated with the data are instrument generated quality data, metadata and user-derived quality flags. An analysis of the quality of SB-ADP data along the profile is presented. This data-set provides multiple contemporaneous velocity measurements along the tank profile, relevant for correlation statistics, length-scale calculations and validation of numerical models simulating flow hydrodynamics in circular test facilities. Full article
Show Figures

Figure 1

8 pages, 569 KiB  
Data Descriptor
An Arabic Dataset for Disease Named Entity Recognition with Multi-Annotation Schemes
by Nasser Alshammari and Saad Alanazi
Data 2020, 5(3), 60; https://doi.org/10.3390/data5030060 - 13 Jul 2020
Cited by 8 | Viewed by 5027
Abstract
This article outlines a novel data descriptor that provides the Arabic natural language processing community with a dataset dedicated to named entity recognition tasks for diseases. The dataset comprises more than 60 thousand words, which were annotated manually by two independent annotators using [...] Read more.
This article outlines a novel data descriptor that provides the Arabic natural language processing community with a dataset dedicated to named entity recognition tasks for diseases. The dataset comprises more than 60 thousand words, which were annotated manually by two independent annotators using the inside–outside (IO) annotation scheme. To ensure the reliability of the annotation process, the inter-annotator agreements rate was calculated, and it scored 95.14%. Due to the lack of research efforts in the literature dedicated to studying Arabic multi-annotation schemes, a distinguishing and a novel aspect of this dataset is the inclusion of six more annotation schemes that will bridge the gap by allowing researchers to explore and compare the effects of these schemes on the performance of the Arabic named entity recognizers. These annotation schemes are IOE, IOB, BIES, IOBES, IE, and BI. Additionally, five linguistic features, including part-of-speech tags, stopwords, gazetteers, lexical markers, and the presence of the definite article, are provided for each record in the dataset. Full article
Show Figures

Figure 1

11 pages, 1659 KiB  
Data Descriptor
The Dataset of the Experimental Evaluation of Software Components for Application Design Selection Directed by the Artificial Bee Colony Algorithm
by Alexander Gusev, Dmitry Ilin and Evgeny Nikulchev
Data 2020, 5(3), 59; https://doi.org/10.3390/data5030059 - 8 Jul 2020
Cited by 8 | Viewed by 2556
Abstract
The paper presents the swarm intelligence approach to the selection of a set of software components based on computational experiments simulating the desired operating conditions of the software system being developed. A mathematical model is constructed, aimed at the effective selection of components [...] Read more.
The paper presents the swarm intelligence approach to the selection of a set of software components based on computational experiments simulating the desired operating conditions of the software system being developed. A mathematical model is constructed, aimed at the effective selection of components from the available alternative options using the artificial bee colony algorithm. The model and process of component selection are introduced and applied to the case of selecting Node.js components for the development of a digital platform. The aim of the development of the platform is to facilitate countrywide simultaneous online psychological surveys in schools in the conditions of unstable internet connection and the large variety of desktop and mobile client devices, running different operating systems and browsers. The module whose development is considered in the paper should provide functionality for the archiving and checksum verification of the survey forms and graphical data. With the swarm intelligence approach proposed in the paper, the effective set of components was identified through a directional search based on fuzzy assessment of the three experimental quality indicators. To simulate the desired operating conditions and to guarantee the reproducibility of the experiments, the virtual infrastructure was configured. The application of swarm intelligence led to reproducible results for component selection after 312 experiments instead of the 1080 experiments needed by the exhaustive search algorithm. The suggested approach can be widely used for the effective selection of software components for distributed systems operating in the given conditions at this stage of their development. Full article
Show Figures

Figure 1

6 pages, 1086 KiB  
Data Descriptor
An Update to the TraVA Database: Time Series of Capsella bursa-pastoris Shoot Apical Meristems during Transition to Flowering
by Anna V. Klepikova and Artem S. Kasianov
Data 2020, 5(3), 58; https://doi.org/10.3390/data5030058 - 30 Jun 2020
Cited by 1 | Viewed by 2263
Abstract
Transition to flowering is a crucial part of plant life directly affecting the fitness of a plant. Time series of transcriptomes is a useful tool for the investigation of process dynamics and can be used for the identification of novel genes and gene [...] Read more.
Transition to flowering is a crucial part of plant life directly affecting the fitness of a plant. Time series of transcriptomes is a useful tool for the investigation of process dynamics and can be used for the identification of novel genes and gene networks involved in the process. We present a detailed time series of polyploid Capsella bursa-pastoris shoot apical meristems created with RNA-seq. The time series covers transition to flowering and can be used for thorough analysis of the process. To make the data easy to access, we uploaded them in our database Transcriptome Variation Analysis (TraVA), which provides a convenient depiction of the gene expression profiles, the differential expression analysis between the homeologs and quick data extraction. Full article
Show Figures

Figure 1

16 pages, 3385 KiB  
Data Descriptor
Experimental Force Data of a Restrained ROV under Waves and Current
by Roman Gabl, Thomas Davey, Yu Cao, Qian Li, Boyang Li, Kyle L. Walker, Francesco Giorgio-Serchi, Simona Aracri, Aristides Kiprakis, Adam A. Stokes and David M. Ingram
Data 2020, 5(3), 57; https://doi.org/10.3390/data5030057 - 30 Jun 2020
Cited by 23 | Viewed by 4437
Abstract
Hydrodynamic forces are an important input value for the design, navigation and station keeping of underwater Remotely Operated Vehicles (ROVs). The experiment investigated the forces imparted by currents (with representative real world turbulence) and waves on a commercially available ROV, namely the BlueROV2 [...] Read more.
Hydrodynamic forces are an important input value for the design, navigation and station keeping of underwater Remotely Operated Vehicles (ROVs). The experiment investigated the forces imparted by currents (with representative real world turbulence) and waves on a commercially available ROV, namely the BlueROV2 (Blue Robotics, Torrance, USA). Three different distances of a simplified cylindrical obstacle (shading effects) were investigated in addition to the free stream cases. Eight tethers held the ROV in the middle of the 2 m water depth to minimise the influence of the support structure without completely restricting the degrees of freedom (DoF). Each tether was equipped with a load cell and small motions and rotations were documented with an underwater video motion capture system. The paper describes the experimental set-up, input values (current speed and wave definitions) and initial processing of the data. In addition to the raw data, a processed dataset is provided, which includes forces in all three main coordinate directions for each mounting point synchronised with the 6DoF results and the free surface elevations. The provided dataset can be used as a validation experiment as well as for testing and development of an algorithm for position control of comparable ROVs. Full article
Show Figures

Figure 1

Previous Issue
Next Issue
Back to TopTop