

Data, Volume 6, Issue 1 (January 2021) – 6 articles
Cover Story (view full-size image):
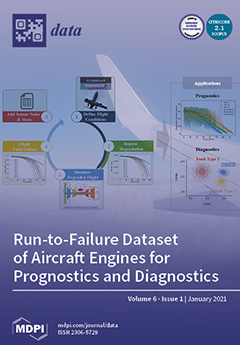
A key enabler of intelligent maintenance systems is the ability to predict the remaining useful lifetime of its components, i.e., prognostics. The development of data-driven prognostic models requires datasets with run-to-failure trajectories. However, large representative run-to-failure datasets are often unavailable in real applications because failures are rare in safety-critical systems. To foster the development of prognostics methods, we provided a new realistic dataset of run-to-failure trajectories for a fleet of aircraft engines. The dataset was generated with the Commercial Modular Aero-Propulsion System Simulation (CMAPSS) model developed at NASA. The damage propagation modelling used builds on the modelling strategy from previous work and incorporated two new levels of fidelity: real flight conditions and a degradation process dependent on the operation history. View this paper.
- Issues are regarded as officially published after their release is announced to the table of contents alert mailing list.
- You may sign up for e-mail alerts to receive table of contents of newly released issues.
- PDF is the official format for papers published in both, html and pdf forms. To view the papers in pdf format, click on the "PDF Full-text" link, and use the free Adobe Reader to open them.
Previous Issue
Next Issue