Article

Numerical Simulation of Non-Equilibrium Two-Phase Wet Steam Flow through an Asymmetric Nozzle

by
Miah Md Ashraful Alam
1,*,
Manabu Takao
1 and
Toshiaki Setoguchi
2
1
Department of Mechanical Engineering, Matsue National College of Technology, Matsue 690-8518, Japan
2
Institute of Ocean Energy, Saga University, Saga 840-8502, Japan
*
Author to whom correspondence should be addressed.
Fluids 2017, 2(4), 63; https://doi.org/10.3390/fluids2040063
Submission received: 30 September 2017 / Revised: 10 November 2017 / Accepted: 13 November 2017 / Published: 15 November 2017
(This article belongs to the Special Issue Non-Equilibrium Thermodynamics in Multiphase Flows)

Abstract

:
The present study reported of the numerical investigation of a high-speed wet steam flow through an asymmetric nozzle. The spontaneous non-equilibrium homogeneous condensation of wet steam was numerically modeled based on the classical nucleation theory and droplet growth rate equation combined with the field conservations within the computational fluid dynamics (CFD) code of ANSYS Fluent 13.0. The equations describing droplet formations and interphase change were solved sequentially after solving the main flow conservation equations. The calculations were carried out assuming the flow two-dimensional, compressible, turbulent, and viscous. The SST k-ω model was used for modeling the turbulence within an unstructured mesh solver. The validation of numerical model was accomplished, and the results showed a good agreement between the numerical simulation and experimental data. The effect of spontaneous non-equilibrium condensation on the jet and shock structures was revealed, and the condensation shown a great influence on the jet structure.

1. Introduction

Phase transfer of steam from the gaseous to the liquid phase occurs close to equilibrium conditions only if the cooling rate is very small. Non-equilibrium condensation arises in transonic/supersonic flows with a high cooling rate. This means that the time scale of flow is faster than the time scale of the phase transfer. In that situation, the release of latent heat occurs nearly instantaneous and leads a significant alternation of the flowfield because this heat is taken over by the surrounding vapor phase. As phase change affects the flow features, many numerical works have been conducted to model the non-equilibrium condensation phenomena in high-speed flows [1,2,3,4,5,6,7]. Consequently, many researchers have investigated the same condensation phenomena experimentally [8,9,10,11,12].
Modeling of wet steam flow is of practical importance in a number of engineering fields, such as transonic/supersonic nozzles, low-pressure steam turbines. Non-equilibrium condensation not only takes place in the transonic/supersonic flow fields, but also in other gaseous flows, such as in the flow of exhaust gas caused by the combustion of hydrocarbon fuels. It is noted that the non-equilibrium condensation in the exhaust gas flows through the nozzle of an airplane may lead a condensation shock behind the airplane traveling at a transonic/supersonic speed. The flow with the non-equilibrium condensation may have quite different features from that of without condensation. So far, no work has been reported on the non-equilibrium condensation in the exhaust gas flows through a supersonic nozzle. Moreover, a detailed investigation on the non-equilibrium condensation in the exhaust gas flows through the supersonic asymmetric nozzle, who are widely used in the aerospace industry, is necessary to perform proper design. In the present paper, the non-equilibrium condensation model for pure steam flow was used to replicate the water-vapor condensation in the flow of exhaust gas containing water-vapors. The asymmetric nozzle geometry of Zudov and Lokotoko [13] was used to simulate the present two-phase flow phenomena. The numerical results were compared with the experimental data and with the other computational results. The commercial computational fluid dynamics (CFD) code of ANSYS Fluent 13.0 (ANSYS, Pittsburgh, PA, USA) was used to solve the compressible Navier-Stokes equations with the SST k-ω turbulence model. The wet steam model was employed to investigate the effect of condensation on the flow features.

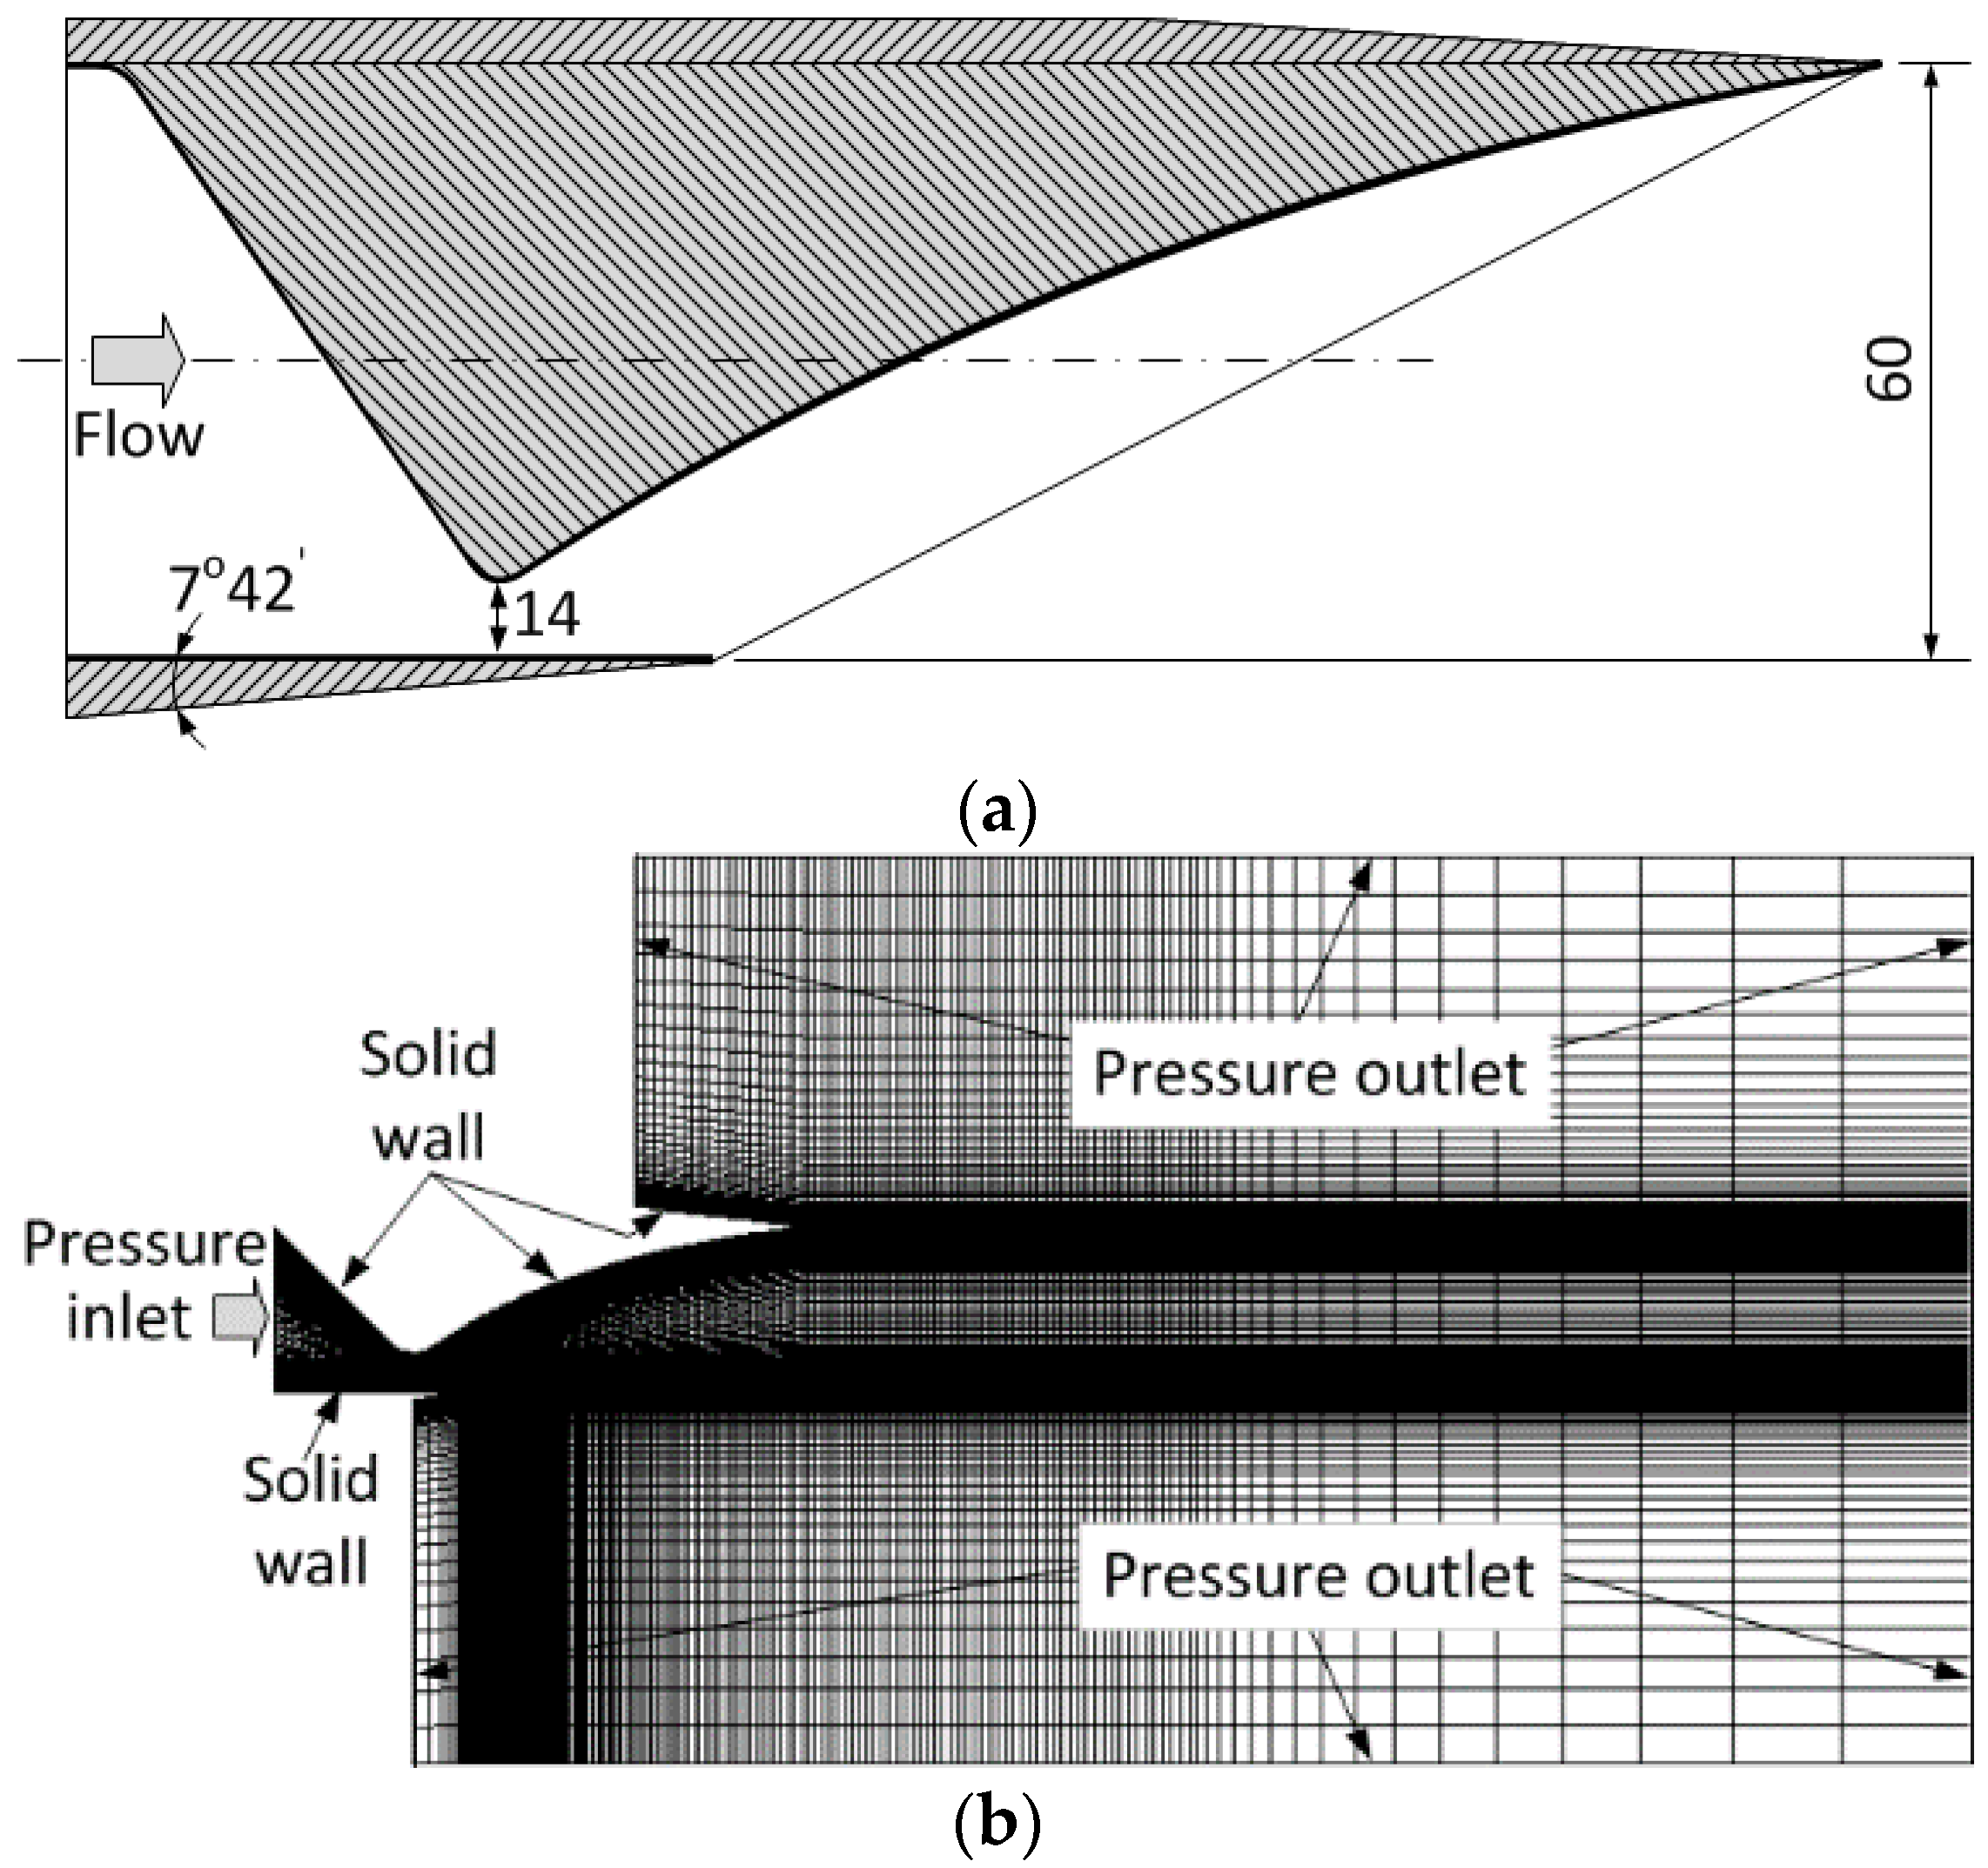
2. Computational Methodologies

The Eulerian–Eulerian approach was adopted for modeling the wet steam flow. The two phases in condensing wet steam flow, namely vapor and liquid, are treated as a single fluid with the combined transport equations; this is known as the ‘pseudo-fluid’ approach. Assumptions made in this model are the velocity slip between the droplets and that the gaseous-phase is negligible, the interactions between droplets are neglected, the volume occupied by droplets is negligibly small, the mass fraction of the condensed phase β (also known as wetness factor) is small (β < 0.2), the heat exchange between the liquid phase and solid boundary is not taken into account. Under these assumptions, the mixture density ρ can be related to the vapor density ρv by the following equation:
ρ = ρ V ( 1 β )
In addition, the temperature and pressure of the mixture will be equivalent to the temperature and pressure of the vapor-phase.

2.1. Governing Equations

The mixture flow is governed by the compressible Navier-Stokes equations given in vector form as shown below:
W Q t V Q d V + [ F G ] d A = V H d V
where the vectors W, Q, F, and G are defined as:
W = [ ρ ρ u ρ v ρ E ] ,   Q = [ p u v T ] ,   F = [ ρ v ρ v u + p i ^ ρ v v + p j ^ ρ v E + p v ] ,   G = [ 0 τ x i τ y i τ i j v j + q ]
The vector H contains the source terms of the body forces and energy sources. Here ρ, v, E, and p are the density, velocity, total energy per unit mass, and the pressure of the fluid, respectively. τ is the viscous stress tensor, and q is the heat flux. The total energy E is related to the total enthalpy H by E = H p / ρ where, H = h + | v | 2 / 2 .
The Jacobian matrix W / Q in Equation (2) is replaced with the preconditioning matrix Γ for transforming the system into the conservation form, and the matrix Γ is given by:
Γ = [ Θ 0 0 ρ T Θ u ρ 0 ρ T u Θ v 0 ρ ρ T u Θ H δ ρ u ρ v ρ T H + ρ C p ]
where:
ρ T = ρ T | p
and the parameter Θ is given by:
Θ = ( 1 U r 2 ρ T ρ C p )
The reference velocity U r is chosen locally such that the eigenvalues of the system remain well-conditioned with respect to the convective and diffusive time scales [14].
In the wet steam model, two additional transport equations are needed to be solved [15]. The first transport equation governs the mass fraction of the condensed liquid phase (β):
ρ β t + x i ( ρ u i β ) = Γ
where Γ is the mass generation rate due to the condensation and evaporation. The second transport equation models the evolution of the number density of the droplets per unit volume (η):
ρ η t + x i ( ρ u i η ) = ρ I
where I is the nucleation rate (number of new droplets per unit volume per second).

2.2. Phase Change Model

The assumptions suggested to the phase change model are, the homogeneous condensation, the droplet growth is based on the average representative mean radii, the droplet surrounding is the infinite vapor space, spherical droplets, and the heat capacity of the droplet is neglected compared with the latent heat released in the condensation.
In the classical nucleation theory, the mass generation rate Γ during non-equilibrium condensation process is given by the sum of a mass increase due to the nucleation (the formation of critically sized droplets) and also due to the growth/demise of these droplets [15]. Therefore, Γ is written as:
Γ = 4 3 π ρ l I r * 3 + 4 π ρ l η r ¯ 2 r ¯ t
where r ¯ is the average radius of the droplet, and r * is the Kelvin-Helmholtz critical droplet radius, above which the droplet will grow and below which the droplet will evaporate. An expression for r * is given by [16]:
r * = 2 σ ρ l R T ln S
where σ is the liquid surface tension, ρ l is the condensed liquid density, and S is the supersaturation ratio defined as the ratio of the vapor pressure to the equilibrium saturation pressure.
The condensation process involves two mechanisms, the transfer of mass from the vapor to the droplets and the transfer of heat from the droplets to the vapor in the form of latent heat. This energy transfer relation can be written as [15]:
d r ¯ d t = P h l v ρ l 2 π R T γ + 1 2 γ C p ( T 0 T )
The classical homogeneous nucleation theory describes the formation of a liquid phase in the form of droplets from a supersaturated phase in the absence of impurities or foreign particles. The nucleation rate described by the steady-state classical homogeneous nucleation theory [16] and corrected for non-isothermal effects is given by:
I = q c ( 1 + θ ) ( ρ v 2 ρ l ) 2 σ M m 3 π e ( 4 π r * 2 σ 3 k b T )
where qc is the condensation coefficient which is usually considered as unity, kb is the Boltzmann constant, Mm is the mass of one water molecule, ρ v is the vapor density at temperature T and θ is the non-isothermal correction factor.

2.3. Equation of State

Consistent with the expressions used for calculating the thermodynamic properties of the steam, the equation of state which relates the pressure to the vapor density and the temperature adopted for the vapor phase is [17]:
p = ρ v R T ( 1 + B ρ v + C ρ v 2 )
where B and C are the second and the third virial coefficients given by the following empirical functions:
B = a 1 ( 1 + ζ / α ) 1 + a 2 e ζ ( 1 e ζ ) 5 / 2 + a 3 ζ
where B is given in m3/kg, ζ = 1500 / T with T in Kelvin, α = 10000.0, a 1 = 0.0015 , a 2 = 0.000942 , and a 3 = 0.0004882 .
C = a ( ζ ζ 0 ) e α ζ + b
where C is given in m6/kg2, ζ = T / 647.286 , ζ 0 = 0.8978 , α = 11.16, a = 1.772, and b = 1.5 × 10⁻⁶.
The mixture properties are related to the vapor and liquid properties via the wetness factor using the following mixing law:
φ m = φ l β + ( 1 β ) φ v
where φ represents any of the thermodynamics properties.

2.4. Turbulence Model

The SST k-ω model, a two equation eddy-viscosity (shear stress transport) turbulence model [18,19,20], was employed in the present computation to model the turbulence. This turbulence model is an effective blend of the robust and accurate formulation of the Wilcox’s k-ω model in the near-wall region with the free-stream independence of the k-ε model in the far field. A more comprehensive description of the theory and its application to turbulence can be found in [18,19,20,21].

2.5. Numerical Methods

The numerical scheme employed simulating the system of governing equations is the density-based solver within the commercial CFD code of ANSYS Fluent 13.0 [21]. The governing equations were discretized in the finite volume form on quadratic type elements using cell-vertex storage. A fully implicit method was implemented on the present spatial domain. The convective fluxes were formulated using the Roe’s flux difference splitting scheme [22], and the third-order accuracy of this scheme was conceived from the original MUSCL [23] finite volume scheme that is a blend of the central differencing and the second-order upwind schemes, in which the physical domain is subdivided into the numerical cells, and the integral equations were applied to each cell. Second-order central difference scheme was used for the viscous terms. The first-order upwind scheme was used for the transport equations in the wet steam model.

2.6. Computational Conditions

The geometric details of the asymmetric nozzle used in the present work is shown in Figure 1. The nominal height of nozzle throat is D = 14 mm (characteristics length), and the distance between the nozzle lower and upper ends is 60 mm. To ensure the computational domain independent solutions, the downstream domain after the upper end was extended to the distance of 50D and 13D in the x- and y-directions, respectively. The calculation area was meshed with structured quadratic type mesh elements using ICEM 13.0. The grids were densely clustered in the boundary layers in order to provide more reasonable predictions. The fineness of the computational grids was examined to ensure that the obtained solutions were independent of the grids employed. The resulting number of grids applied is 220 × 120 in the nozzle and 70 × 220 in the plume region.
The numerical works were done under two initial conditions (ICs). In first case, the inlet total pressure and total temperature are p0 = 7 bar and T0 = 436–476 K, respectively, while in the second case, they are p0 = 32 bar and T0 = 510–544 K, respectively. The initial total temperatures, in both cases, were varied to investigate the effect of superheat. The boundary conditions used were the inlet total pressure and outlet static pressure at the upstream and downstream of the computational domain, respectively. Adiabatic and no-slip boundary conditions were applied on the solid surfaces.
A solution convergence was obtained when the residuals for each of the conserved variables were reduced below the order of magnitude six. Another convergence criterion was to check the conserved quantities directly through the computational boundaries. The net mass flux was investigated when there was an applicable imbalance through the computational boundaries.

3. Results and Discussion

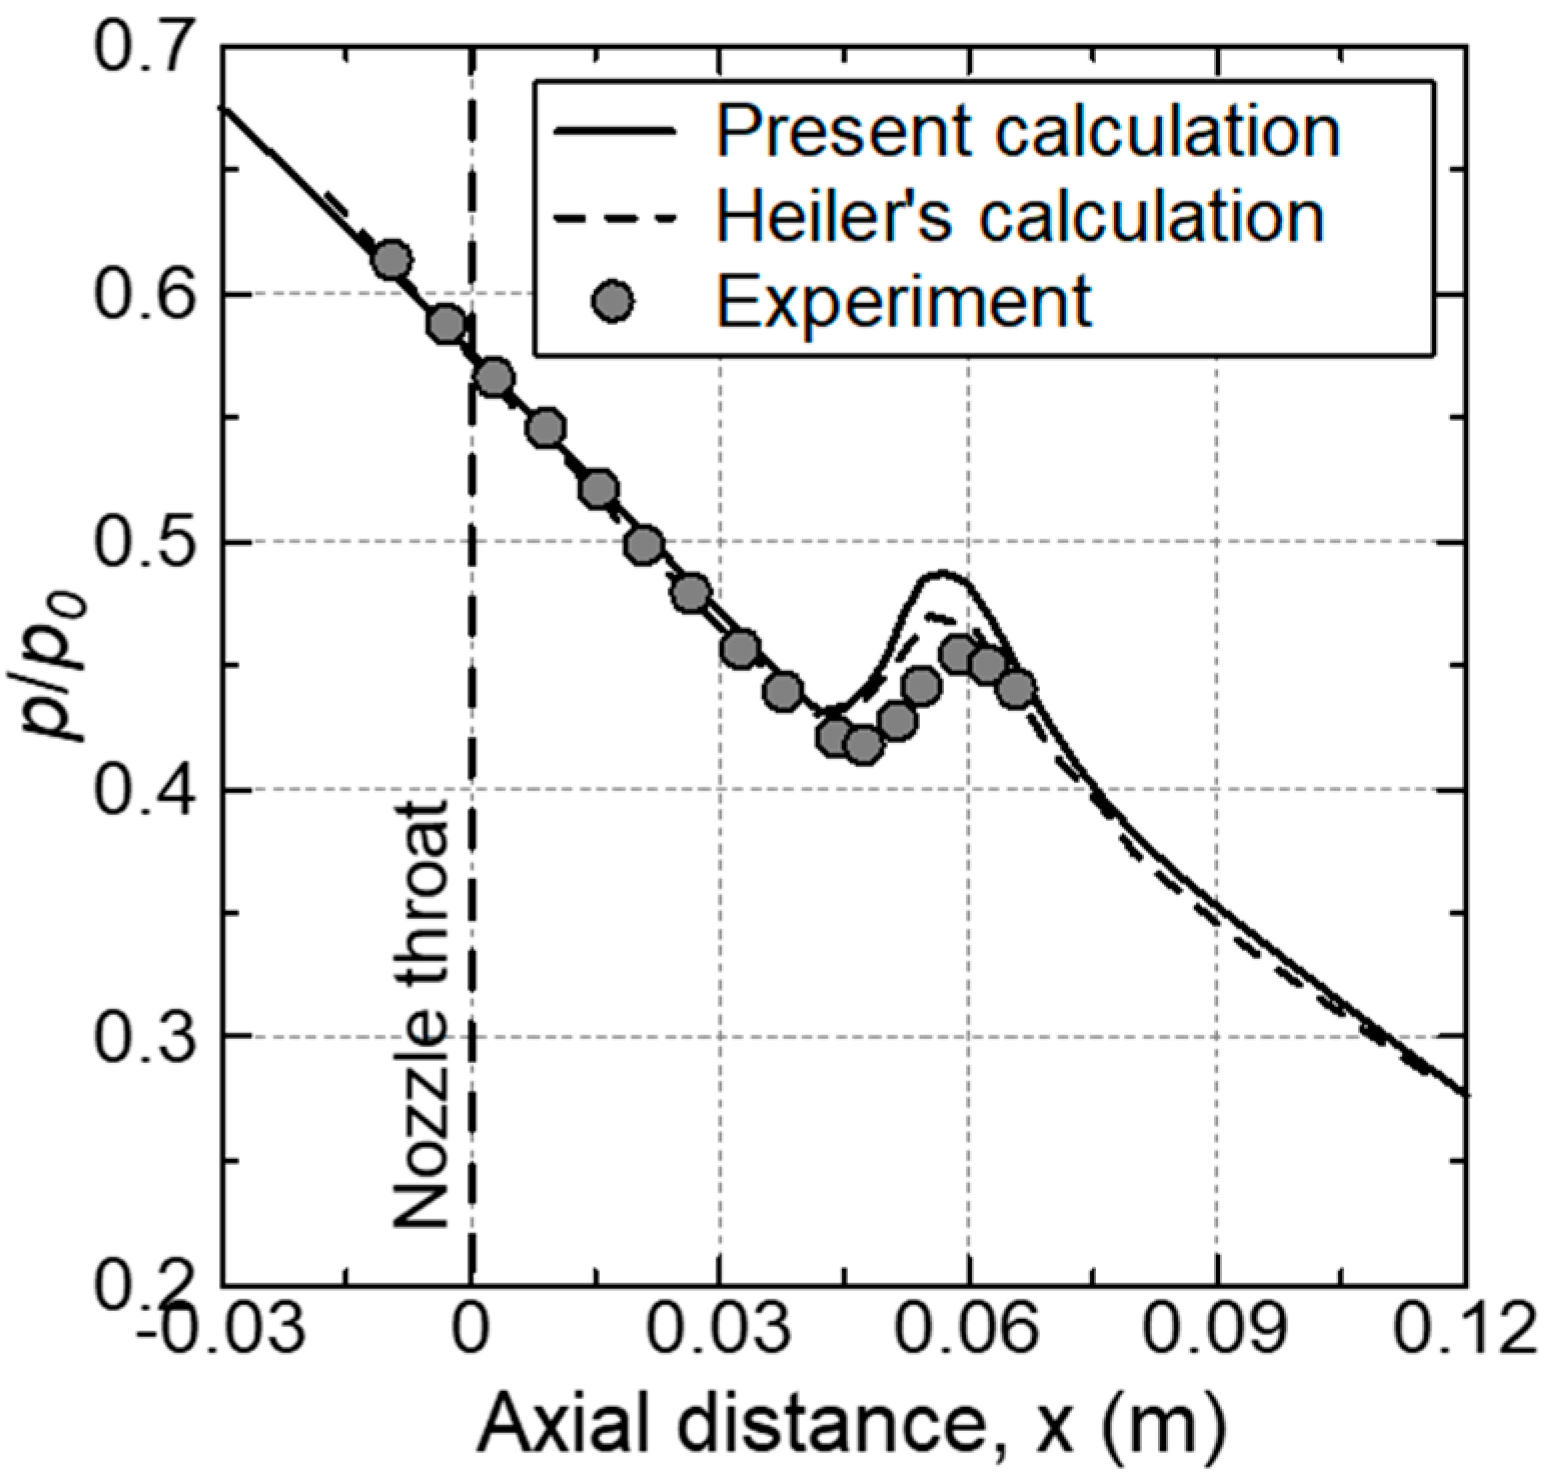
3.1. Computational Fluid Dynamics (CFD) Code Validation

To validate the numerical work, the test case considered a supersonic wet steam flow through a Barschdorff nozzle [24]. This nozzle is an arc nozzle with a critical throat height of 60 mm and with a radius of wall curvature of 584 mm. The simulation was performed to the nozzle with the inlet total pressure of p0 = 0.0785 MPa and total temperature of T0 = 380.55 K. The numerical results were compared with the experimental data [24] and with Heiler’s calculation [25]. The obtained centerline pressure distribution presented in Figure 2 shows a good agreement with the experimental measurements and with the numerical results. The steam expands isentropically in the converging portion of the nozzle. In the diverging section, the steam undergoes a rapid expansion that leads to an occurrence of spontaneous non-equilibrium condensation. The heat released by the spontaneous condensation of wet steam slows down the flow and results in a pressure jump that is called the condensation shock.

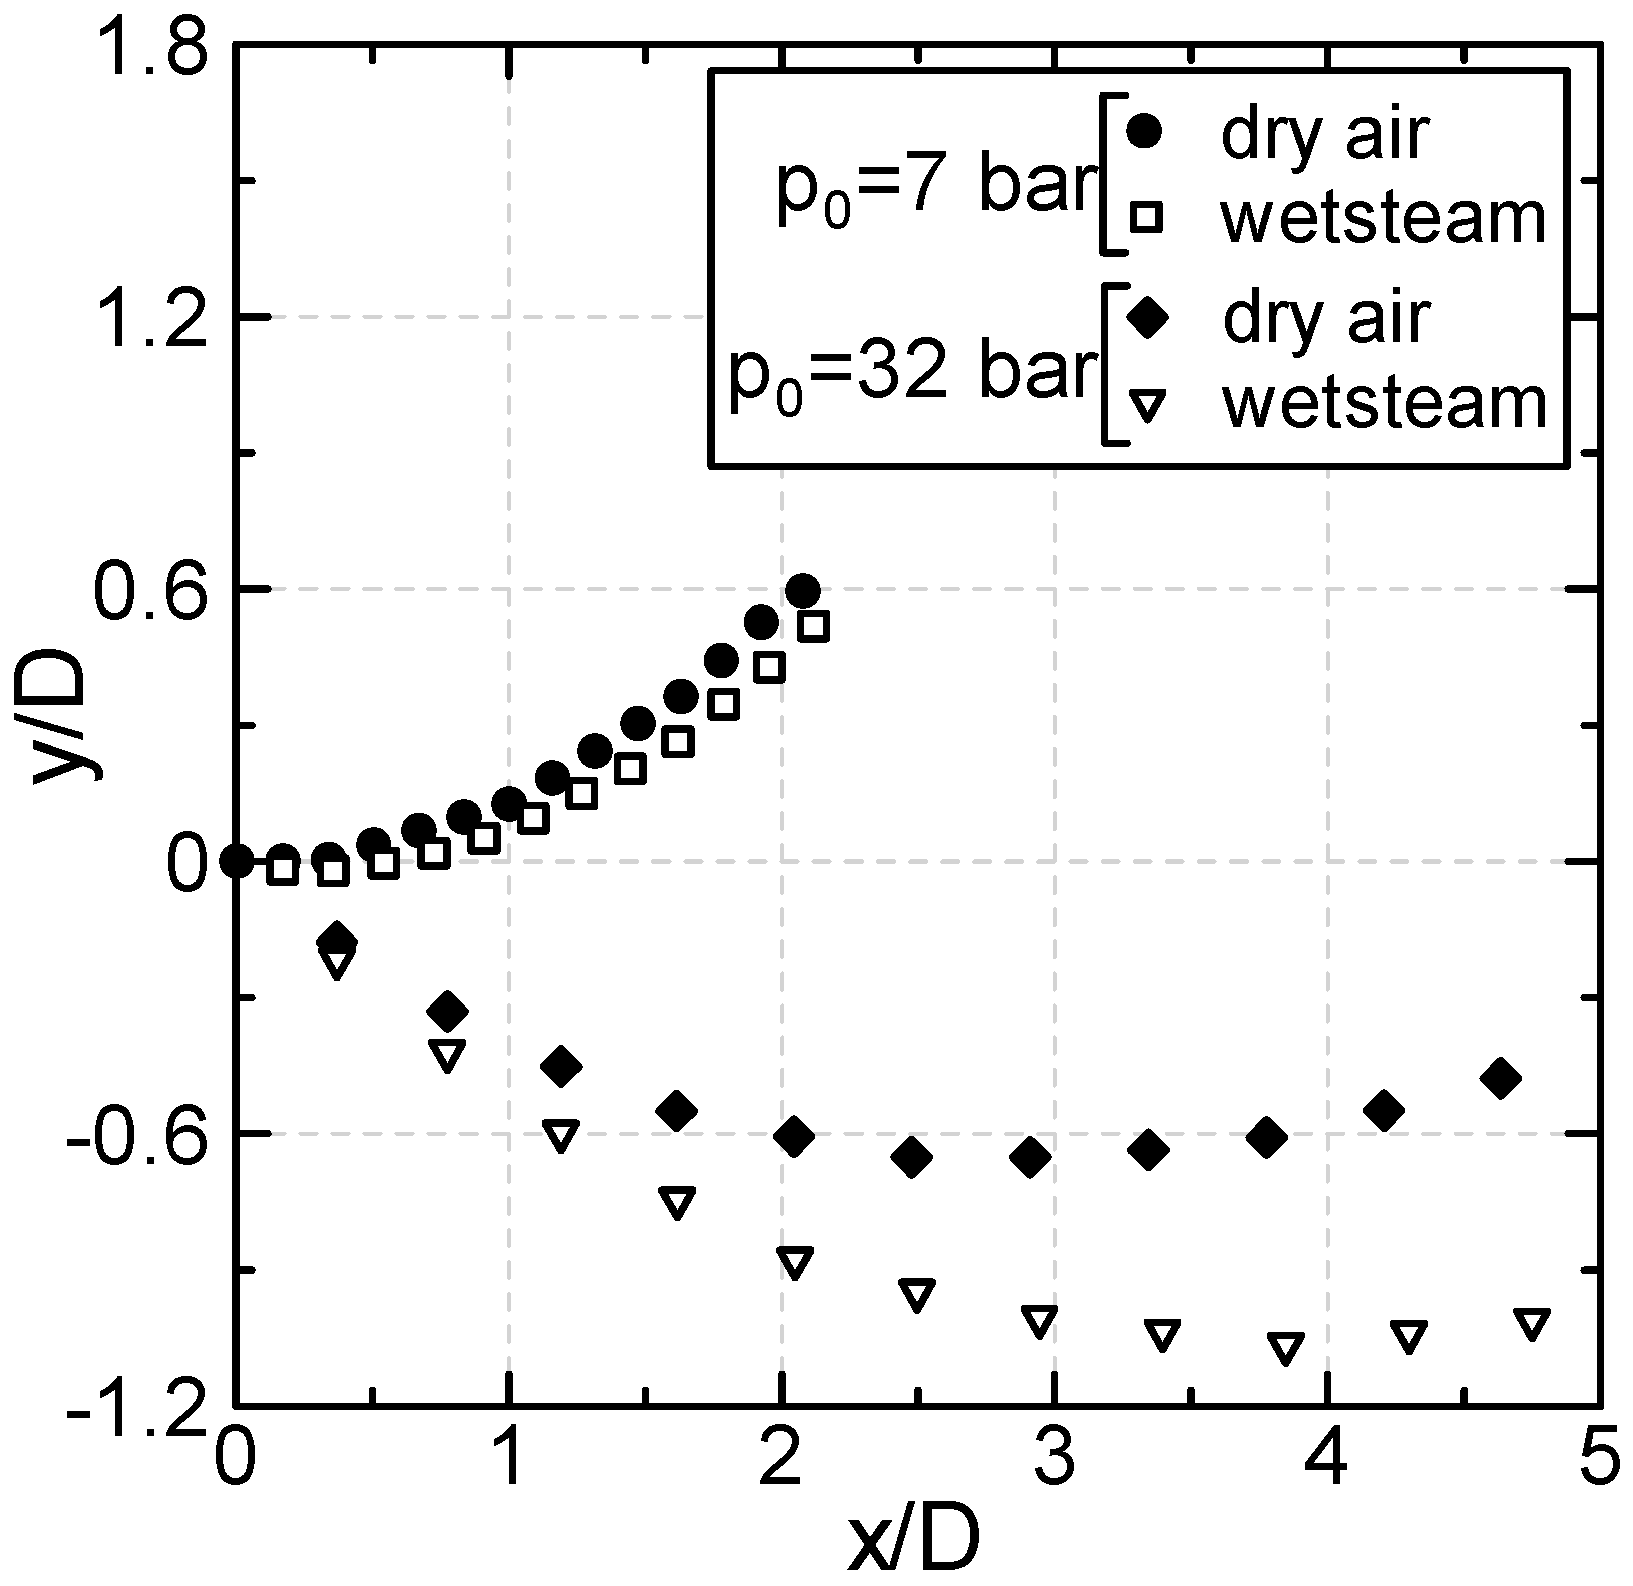
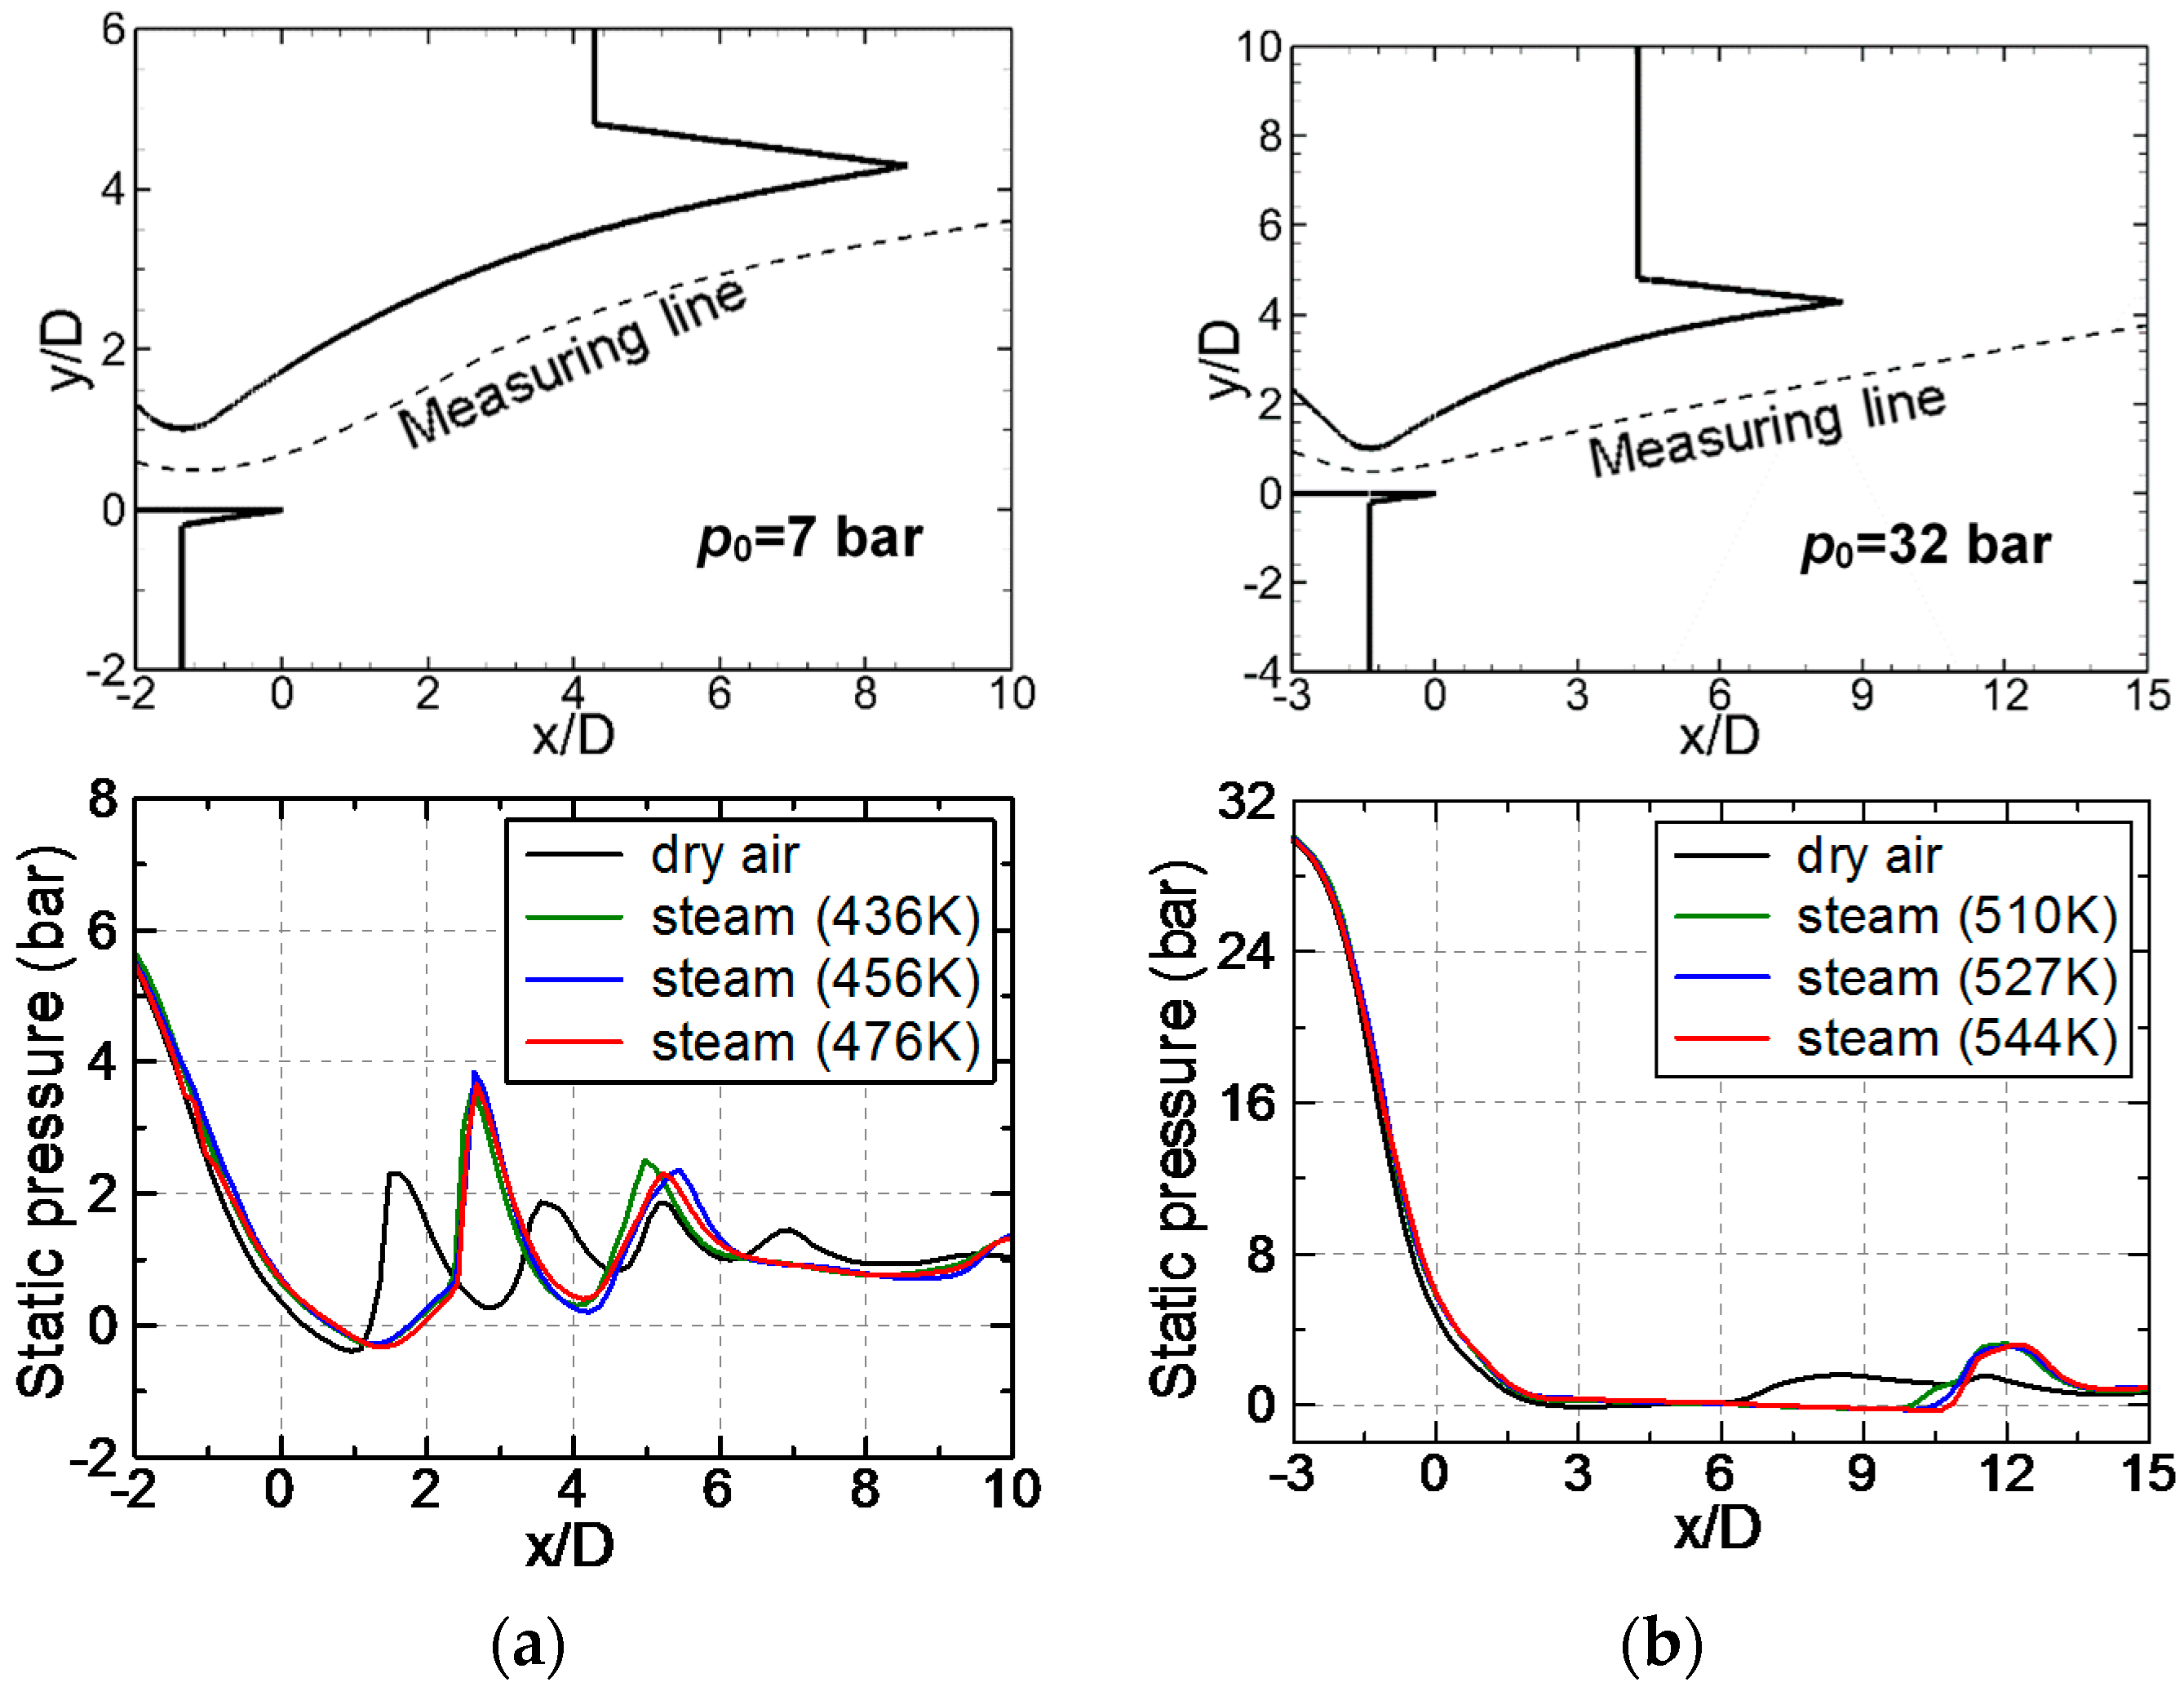
3.2. Wet Steam Flow in the Asymmetric Nozzle

As we know, the distribution of pressures is strongly depended on the nozzle inlet total pressure p0, and this fact can be numerically confirmed from the survey of static pressures, and the predicted data along the measured lines (dashed lines) are plotted in Figure 3a,b. The pressures under each operating condition shows a unique characteristic, and the pressure field shows a characteristics of quasi-periodic structure. This is due to the presence of shock cells. The length of the shock cell increases with the increase of inlet total pressure. It is found that the non-equilibrium condensation of wet steam influences the pressure field. In both cases, the length of the shock cell increases under the wet steam flow condition.
Figure 4a,b show the typical iso-density contours of dry air flow in the asymmetric nozzle at p0 = 7 bar, T0 = 436 K and p0 = 32 bar, T0 = 510 K, respectively. At p0 = 7 bar in Figure 4a, the flow is under-expanded after the nozzle throat, and the oblique shock creates the consecutive shock cells. The flow is found to detach from the nozzle upper wall and reattached again at an axial location of x/D = 4. A small circulation, as shown in Figure 5a, is found near the upper wall in this flow-separation region (in the range of x/D = 0 to 4). When the nozzle inlet total pressure is increased to p0 = 32 bar, as shown in Figure 4b, the length of the shock cells is found to increase, and the shock cells are extended to the downstream.
Typical iso-density contours of the wet steam flow in the asymmetric nozzle at p0 = 7 bar, T0 = 436 K and p0 = 32 bar, T0 = 510 K are shown in Figure 6a,b, respectively. The length of shock cells in both cases increase due to the spontaneous of non-equilibrium condensation of wet steam. The heating of surrounding gas by the release of latent heat of condensation results in the formation of condensation shocks. The flow tends to expand outwards in order to adjust with the condensation shock. A quantitative evidence about that phenomenon is presented in Figure 7. The predicted results of configuration of shock cell lower boundary is presented in the figure. The location of shock cell boundary is defined by the largest value of density gradient (dρ/dy) on an arbitrary cross-section normal to the x-axis. The expansion of the shock cell reduces the length of flow-separation region near the upper wall of the nozzle, as shown in Figure 5b. The length of shock cell increases by 80.4% and 29.4% at p0 = 7 bar and p0 = 32 bar, respectively. As the latent heat releases into the gaseous phase by the wet steam condensation, the temperature of gaseous phase increases and so does of the total temperature, as shown in Figure 8.
Figure 9a,b shows the typical contours of nucleation rate of wet steam flow at p0 = 7 bar, T0 = 436 K and p0 = 32 bar, T0 = 510 K, respectively. While the corresponding typical contours of liquid mass fractions are illustrated in Figure 10a,b. The computational conditions are given on these figures. As seen from Figure 9 and Figure 10, the condensate nuclei in both cases start generating from the upstream of the nozzle throat and reach the maximum at the onset of condensation. In the present study, the dry steam enters the nozzle, and the averaged liquid mass fractions leaving the nozzle, i.e., at an axial location downstream of the nozzle upper end are 0.072 and 0.1 for the inlet conditions of p0 = 7 bar, T0 = 436 K and p0 = 32 bar, T0 = 510 K, respectively. As seen from these figures, the liquid mass fraction begins to increase at the onset of condensation, and it distributes over the expansion region of the flow field.
During the simulation of wet steam flow in the asymmetric nozzle at p0 = 7 bar, the inlet total temperature T0 is changed between 436 K and 476 K, while the temperature is varied between 510 K and 544 K for the nozzle flow at 32 bar to investigate the effect of steam superheat on the occurrence of non-equilibrium condensation. The results are presented in Figure 11a,b. In these figures, dotted and solid lines represent the liquid mass fraction and nucleation rate, respectively. The first point of temperature (465 K and 510 K), in both cases, represents the corresponding saturation temperature. The distributions of liquid mass fraction and nucleation rate indicate that the increase of inlet total temperature delays the occurrence of non-equilibrium condensation, and the point of onset of condensation moves to the downstream with the inlet total temperature. Moreover, the average liquid mass fraction at a given pressure decreases with the increase of the inlet total temperature.

4. Conclusions

This numerical work was performed to analyze the steam condensing flow in an asymmetric nozzle. The classical nucleation theory and the equation of droplet growth rate within the Eulerian–Eulerian approach were employed to model the spontaneous non-equilibrium homogeneous condensation of wet-steam flow. The influence of thermal parameter on the changes of onset of condensation was investigated by examining the nucleation region and liquid droplet growth. The rise in steam temperature at the nozzle inlet delayed the point of condensation. The length of shock cells was increased due to the effect of spontaneous non-equilibrium condensation of steam. The release of latent heat into the gaseous phase by the steam condensation increased the temperature of the gaseous phase, which results in the increase of total temperature of the flow.

Author Contributions

Miah Md Ashraful Alam and Toshiaki Setoguchi conceived and designed the study; Miah Md Ashraful Alam performed the numerical simulation; Miah Md Ashraful Alam and Manabu Takao analyzed the data; and Miah Md Ashraful Alam wrote the paper.

Conflicts of Interest

The authors declare no conflict of interest.

References

  1. Gyarmathy, G. Condensation in flowing steam. In A von Karman Institute Book on Two-Phase Steam Flow in Turbines and Separators; Moore, M.J., Sieverding, C.H., Eds.; Hemisphere: London, UK, 1976; pp. 127–189. [Google Scholar]
  2. Young, J.B. The spontaneous condensation of steam in supersonic nozzles. Phys. Chem. Hydrodyn. 1982, 3, 57–82. [Google Scholar]
  3. Bakhtar, F.; Zidi, K. Nucleation phenomena in flowing high-pressure steam, part 2: Theoretical analysis. Proc. Inst. Mech. Eng. 1990, 204, 233–242. [Google Scholar] [CrossRef]
  4. White, A.J.; Young, J.B. Time-marching method for the prediction of two-dimensional, unsteady flows of condensing steam. J. Propuls. Power 1993, 9, 579–587. [Google Scholar] [CrossRef]
  5. Kermani, M.J.; Gerber, A.G. A general formula for the evaluation of thermodynamic and aerodynamic losses in nucleating steam flow. Int. J. Heat Mass Trans. 2003, 46, 3265–3278. [Google Scholar] [CrossRef]
  6. Yang, Y.; Shen, S. Numerical simulation on non-equilibrium spontaneous condensation in supersonic steam flow. Int. J. Heat Mass Trans. 2009, 32, 902–907. [Google Scholar]
  7. Yousif, A.H.; Al-Debagh, A.M.; Al-Zuhairy, R.C. Non-equilibrium spontaneous condensation in transonic steam flow. Int. J. Therm. Sci. 2013, 64, 32–42. [Google Scholar] [CrossRef]
  8. Dykas, S.; Majkut, M.; Strozik, M.; Smolka, K. Losses estimation in transonic wet steam flow through linear blade cascade. Int. J. Therm. Sci. 2015, 24, 109–116. [Google Scholar] [CrossRef]
  9. Gyarmathy, G.; Lesch, F. Fog droplet observation in Laval nozzles and in an experimental turbine. Proc. Inst. Mech. Eng. 1969, 184, 29–36. [Google Scholar]
  10. Bakhtar, F.; Zidi, K. Nucleation phenomena in flowing high-pressure steam, part 1: Experimental results. Proc. Inst. Mech. Eng. 1989, 203, 195–200. [Google Scholar] [CrossRef]
  11. White, A.J.; Young, J.B.; Walters, P.T. Experimental validation of condensing flow theory for a stationary cascade of steam turbine blades. Philos. Trans. R. Soc. A 1996, 354, 59–88. [Google Scholar] [CrossRef]
  12. Moses, C.A.; Stein, G.D. On the growth of steam droplets formed in a Laval nozzle using both static pressure and light scattering measurements. J. Fluids Eng. 1978, 100, 311–322. [Google Scholar] [CrossRef]
  13. Zudov, V.; Lokotko, A. Numerical and experimental investigation of two-dimensional asymmetric nozzles. In Proceedings of the 3rd European Symposium of Aerothermodynamics for Space Vehicles, Noordwijk, The Netherlands, 24–26 November 1998. [Google Scholar]
  14. Weiss, J.M.; Smith, W.A. Preconditioning applied to variable and constant density flows. AIAA J. 1995, 33, 2050–2057. [Google Scholar] [CrossRef]
  15. Ishazaki, K.; Ikohagi, T.; Daiguji, H. A High-Resolution Numerical Method for Transonic Non-equilibrium Condensation Flows through a Steam Turbine Cascade. In Proceedings of the 6th International Symposium on Computational Fluid Dynamics, Lake Tahoe, CA, USA, 4–8 September 1995; Volume 1, pp. 479–484. [Google Scholar]
  16. Young, J.B. Two-dimensional, nonequilibrium, wet-steam calculations for nozzles and turbine cascades. J. Turbomach. 1992, 114, 569–579. [Google Scholar] [CrossRef]
  17. Young, J.B. An equation of state for steam for turbomachinery and other flow calculations. J. Eng. Gas Turbines Power 1988, 110, 1–7. [Google Scholar] [CrossRef]
  18. Menter, F.R. Zonal two equation k-ω turbulence models for aerodynamic flows. AIAA Pap. 1993. [Google Scholar] [CrossRef]
  19. Menter, F.R. Two-equation eddy-viscosity turbulence models for engineering applications. AIAA J. 1994, 32, 269–289. [Google Scholar] [CrossRef]
  20. Menter, F.R.; Kuntz, M.; Langtry, R. Ten years of industrial experience with the SST turbulence model. In Turbulence, Heat and Mass Transfer; Hanjalic, K., Nagano, Y., Tummers, M., Eds.; Begell House Inc.: Danbury, CT, USA, 2003; Volume 4, pp. 625–632. [Google Scholar]
  21. ANSYS. Fluent User’s Guide; ANSYS Inc.: Pittsburgh, PA, USA, 2011. [Google Scholar]
  22. Roe, P.L. Approximate Riemann solvers, parameter vectors, and difference schemes. J. Comp. Phys. 1981, 43, 357–372. [Google Scholar] [CrossRef]
  23. Van Leer, B. Towards the ultimate conservative difference scheme V: A second order sequel to Godunov’s method. J. Comp. Phys. 1979, 32, 101–136. [Google Scholar] [CrossRef]
  24. Dykas, S. Numerical calculation of the steam condensing flow. Task Q. 2001, 5, 519–535. [Google Scholar]
  25. Heiler, M. Instationäre Phänomene in Homogen/Heterogen Kondensierenden Düsen-und Tubinens-Trömungen. Ph.D. Thesis, Fakultät für Maschinenbau, Universität Karlsruhe (TH), Karlsruhe, Germany, 1999. [Google Scholar]
Figure 1. Nozzle geometry and computational grids. (a) A geometric details of asymmetric nozzle; and (b) the typical mesh and boundary conditions.
Fluids 02 00063 g001
Figure 2. Distribution of static pressures along the axis of a Barschdorff nozzle.
Fluids 02 00063 g002
Figure 3. Distribution of static pressures along measuring line of asymmetric nozzle. (a) p0 = 7 bar; and (b) p0 = 32 bar.
Fluids 02 00063 g003
Figure 4. Typical iso-density contours of dry airflow. (a) p0 = 7 bar, T0 = 436 K; and (b) p0 = 32 bar, T0 = 510 K.
Fluids 02 00063 g004
Figure 5. Typical velocity contours and streamlines at p0 = 7 bar, T0 = 436 K. (a) Dry airflow; and (b) the wet-steam flow.
Fluids 02 00063 g005
Figure 6. Typical iso-density contours of wet steam flow. (a) p0 = 7 bar, T0 = 436 K; and (b) p0 = 32 bar, T0 = 510 K.
Fluids 02 00063 g006
Figure 7. Configurations of the lower shock cell boundary.
Fluids 02 00063 g007
Figure 8. Distributions of total temperature along measuring line. (a) p0 = 7 bar, T0 = 436 K; and (b) p0 = 32 bar, T0 = 510 K.
Fluids 02 00063 g008
Figure 9. Typical contours of nucleation rate in wet steam flow. (a) p0 = 7 bar, T0 = 465 K; and (b) p0 = 32 bar, T0 = 527 K.
Fluids 02 00063 g009
Figure 10. Typical contours of liquid mass fraction in wet steam flow. (a) p0 = 7 bar, T0 = 465 K; and (b) p0 = 32 bar, T0 = 527 K.
Fluids 02 00063 g010
Figure 11. Distributions of liquid mass fraction and nucleation rate in wet steam flow. (a) p0 = 7 bar; and (b) p0 = 32 bar.
Fluids 02 00063 g011

