Article

Thermal Fluid Analysis of Cold Plasma Methane Reformer

by
Sarvenaz Sobhansarbandi
1,
Lizon Maharjan
2,
Babak Fahimi
2 and
Fatemeh Hassanipour
3,*
1
Department of Civil and Mechanical Engineering, The University of Missouri-Kansas City, Kansas City, MO 64110, USA
2
Department of Electrical Engineering, The University of Texas at Dallas, Richardson, TX 75080, USA
3
Department of Mechanical Engineering, The University of Texas at Dallas, Richardson, TX 75080, USA
*
Author to whom correspondence should be addressed.
Fluids 2018, 3(2), 31; https://doi.org/10.3390/fluids3020031
Submission received: 3 February 2018 / Revised: 20 April 2018 / Accepted: 23 April 2018 / Published: 1 May 2018
(This article belongs to the Special Issue Flow and Heat or Mass Transfer in the Chemical Process Industry)

Abstract

:
One of the most important methods of methane utilization is the conversion to synthesis gas (syngas). However, conventional ways of reforming methane usually require very high temperature, therefore non-thermal (non-equilibrium) plasma methane reforming is an attractive alternative. In this study, a novel plasma based reformer named 3D Gliding Arc Vortex Reformer (3D-GAVR) was investigated for partial oxidation of methane to produce syngas. The tangential input creates a vortex in the plasma zone and an expanded plasma presides within the entire area between the two electrodes. Using this method, the experimental results show that hydrogen can be produced for as low as $ 4.45 per kg with flow rates of around 1 L per minute. The maximum methane conversion percentage which is achieved by this technology is up to 62.38%. In addition, a computational fluid dynamics (CFD) modeling is conducted for a cold plasma reformer chamber named reverse vortex flow gliding arc reactor (RVF-GA) to investigate the effects of geometry and configuration on the reformer performance. In this modified reformer, an axial air input port is added to the top of the reaction vessel while the premixed reactants can enter the cylindrical reaction zone through tangential jets. The CFD results show that a reverse vortex flow (RVF) scheme can be created which has an outer swirling rotation along with a low pressure area at its center with some component of axial flow. The reversed vortex flow utilizes the uniform temperature and heat flux distribution inside the cylinder, and enhances the gas mixtures leading to expedition of the chemical reaction and the rate of hydrogen production.

Graphical Abstract

1. Introduction

Employment of fuel cells [1,2,3] for power generation has been recognized as an important area where hydrogen could be used to achieve higher energy efficiencies and greatly reduce emissions. However, since hydrogen is not readily available, production of H 2 from reforming of different types of fuel such as methanol, ethanol, glycerol, methane (Natural gas/Biogas), E85, gasoline, diesel/biodiesel, etc. has been recently studied. There are several conventional reforming technologies, including steam reforming, partial oxidation, auto-thermal reforming, methanol reforming and catalytic cracking, to address these needs.
Hydrogen is predominantly produced using a centralized large scale catalyst reforming plant. Normally, the process requires high pressure (up to 25 bar) and high temperature (above 800 ° C) within a large facility. However, transportation of hydrogen and distribution infrastructure over a large area would be prohibitively expensive. This lead to a more favorable distributed approach where hydrogen is produced on-site and on-demand, especially through the reforming of methane, which is readily available to most consumers. The conventional ways of reforming methane usually require very high temperature, which leads to developing combined heat and power (CHP) technologies. For CHP systems, solid oxide fuel cells (SOFCs) with very high operating temperature (typically 700–1000 ° C) are used [1]. The CHP systems based on SOFCs usually have long set-up time and high operational temperature, making them unsuitable for some the residential applications [2]. However, such technology (utility based SOFC) is one of the most efficient and environmental-friendly technologies in large-scale and have reached pilot-scale demonstration stages in many regions such as the US, Europe and Japan [4]. The SOFCs high operating temperature generates high quality heat byproduct which can be used for co-generation, or in combined cycle applications. This type of system is flexible with choice of fuel and has very low emissions by removing the danger of carbon monoxide in exhaust gases, since any produced CO is converted to CO 2 at the high operating temperature [4]. In comparison, proton exchange membrane fuel cell (PEMFC) operates at lower operating temperature and it is less sensitive to operating conditions [5,6,7], but they require hydrogen input at purity level of 99% or higher. A series of PEMFC-based CHP have been proposed in the literature [3,6,8,9]. In some works on PEMFC-based CHP systems, a cold plasma reforming of methane is employed, as reported by Barelli and Ottaviano [10]. In their work, such CHP system will be further extended with heat processor and multiport power electronics interface (MPEI) to integrate all the possible power sources and electrical loads found in residential applications. The PEMFCs are very sensitive to CO poisoning, and often require regular hydrogen purging for maintenance. SOFCs on the other hand are not vulnerable to CO poisoning and can take syngas directly as input without any purification. This eliminates capital and operational costs associated with hydrogen separation and purification, and provides attractive application for plasma assisted reformation systems. Consequently, the objective of this study is producing the hydrogen as the product of synthesis gas (syngas) with the lowest price for the application in SOFC systems.
One of the most significant methods of producing syngas is through conversion of methane, which has an important application in the petrochemical industry. Syngas is a combination of hydrogen and carbon monoxide, and can be applied in a variety of petrochemical processes such as methanol production via the so-called Fischer–Tropsch synthesis [11]. Synthesis gas production can be obtained by three primary methods for methane reforming. The first method is the methane steam reforming, a direct reaction between steam and methane which yield to a high fraction of hydrogen. Generally, this reaction happens over catalysts with high temperatures of around 425–550 ° C. The reaction is highly endothermic and therefore consumes a high rate of energy [12]. The second method is the methane reforming with carbon dioxide. The thermodynamic and equilibrium characteristics of this reaction is similar to the steam reforming process, and it is strongly endothermic. However, this method produces syngas with a lower H 2 /CO ratio. The principal trouble is from the deactivation of the catalyst utilized since the coke is deposited under the normal reaction conditions [13]. In the third method, which is the interest of this study, the partial oxidation of methane or oxygen-enhanced reforming produce syngas with a H 2 /CO ratio close to 2. This reaction utilizes a small amount of oxygen to produce the high exothermic reaction without the application of a catalyst. Since this reaction generates heat, the temperature may rise to 1300–1400 ° C [14].
Minimizing the use of steam is attracting great interest in recent years due to the significant drawbacks such as endothermic reactions, a 3/l H 2 /CO ratio as product, steam corrosion issues, and costs in handling the excess of H 2 O. The process has thus moved from steam reforming to “wet” oxidation, and much research has been devoted to direct “dry” oxidation of CH 4 /O 2 mixtures recently. A reactor utilizes this reaction would be much more energy efficient than the energy intensive steam reforming process, since the direct oxidation reaction is slightly exothermic. This indicates that a single stage process for syngas generation would be a viable alternative to steam reforming [15].
In non-thermal (non-equilibrium) plasma, the plasma is characterized by high temperature of the electron (∼ 10 5 K) while keeping a low bulk temperature of the gas phase (< 10 3 K) [16]. This high rate of energy and abundant electrons of the plasma activate reactants and initiate radical reactions. The plasma (discharge) initiation may be very quick (microsecond scale) with utilizing high voltage excitation. The advantages of this reaction is low operating temperature, fast start-up, transient performance, and eliminating the need to use expensive catalytic materials [17]. Different types of plasmas have been utilized in reforming of hydrocarbons and oxygenated hydrocarbons for hydrogen rich gas production [10,17,18,19]. Among these types, a high-frequency pulse plasma has demonstrated high-energy efficiency which can operate at relatively lower temperatures than arc discharge plasmas [20]. In auto-thermal reforming plasmas [21], high net efficiency and good volumetric throughput is achieved, however, oxygen necessitates either air separation or results in dilution with nitrogen for this type of plasma. Auto-thermal plasmas have significantly lower electrical energy consumption, which has a great potential for the application of this type in some circumstances (e.g., mobile fuel cell systems) while operating at higher temperatures.
Several studies investigate the methane reforming utilizing different types of plasmas, specifically with non-equilibrium plasma. Gliding arc discharge is a new method for non-equilibrium plasma generation with high efficiency and environmental friendliness, which is the target of this study. In this study, the partial oxidation of methane to produce syngas using a novel plasma based reformer was investigated. The effects of several operational parameters on the methane conversion and the selectivity of products were considered. In addition, the computational fluid dynamics modeling of another innovative cold plasma reformer chamber named a reverse vortex flow gliding arc reactor (RVF-GA), where the geometry and inlets of the 3D-GAVR are modified, was conducted to investigate the effect of geometry size and configuration for efficient performance.

2. Experimental Modeling

2.1. Partial Oxidation

The chemical process considered for reformation in this study is partial oxidation. In industrial practices, partial oxidation is often followed by Water Gas Shift (WGS) reaction, which increases the production yield of H 2 and eliminates toxic CO by converting it to CO 2 . However, WGS does not affect the findings of this study and is not included. The reaction for partial oxidation is given in the following equation where the reaction is an exothermic reaction with enthalpy of −36.1 kJ/mol [22].
CH 4 + 1 2 O 2 CO + 2 H 2 ( a )
It is to be noted that atmospheric air consists of 78.09 % of N 2 which is not reactive and serves as the carrier gas, and 20.95 % of O 2 . Therefore, air is used instead of compressed oxygen for partial oxidation. The flow rate of air needs to be 4.77 times higher than the required flow rate of O 2 .

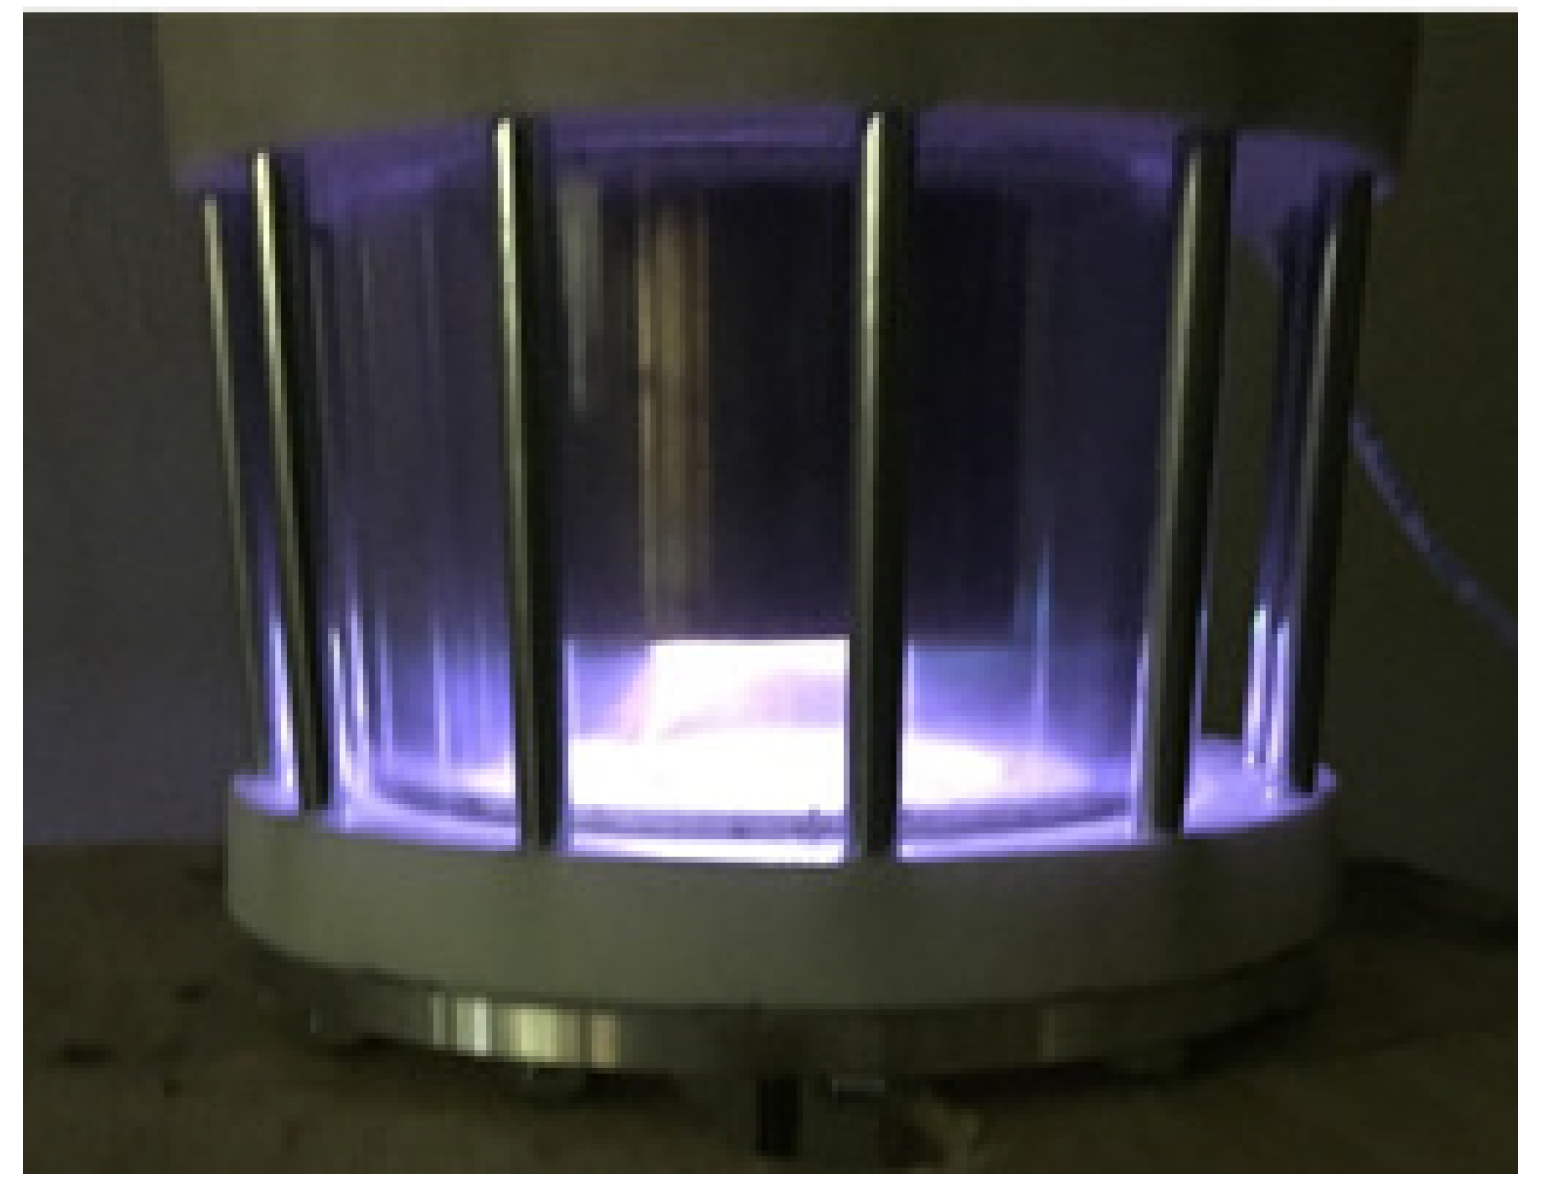
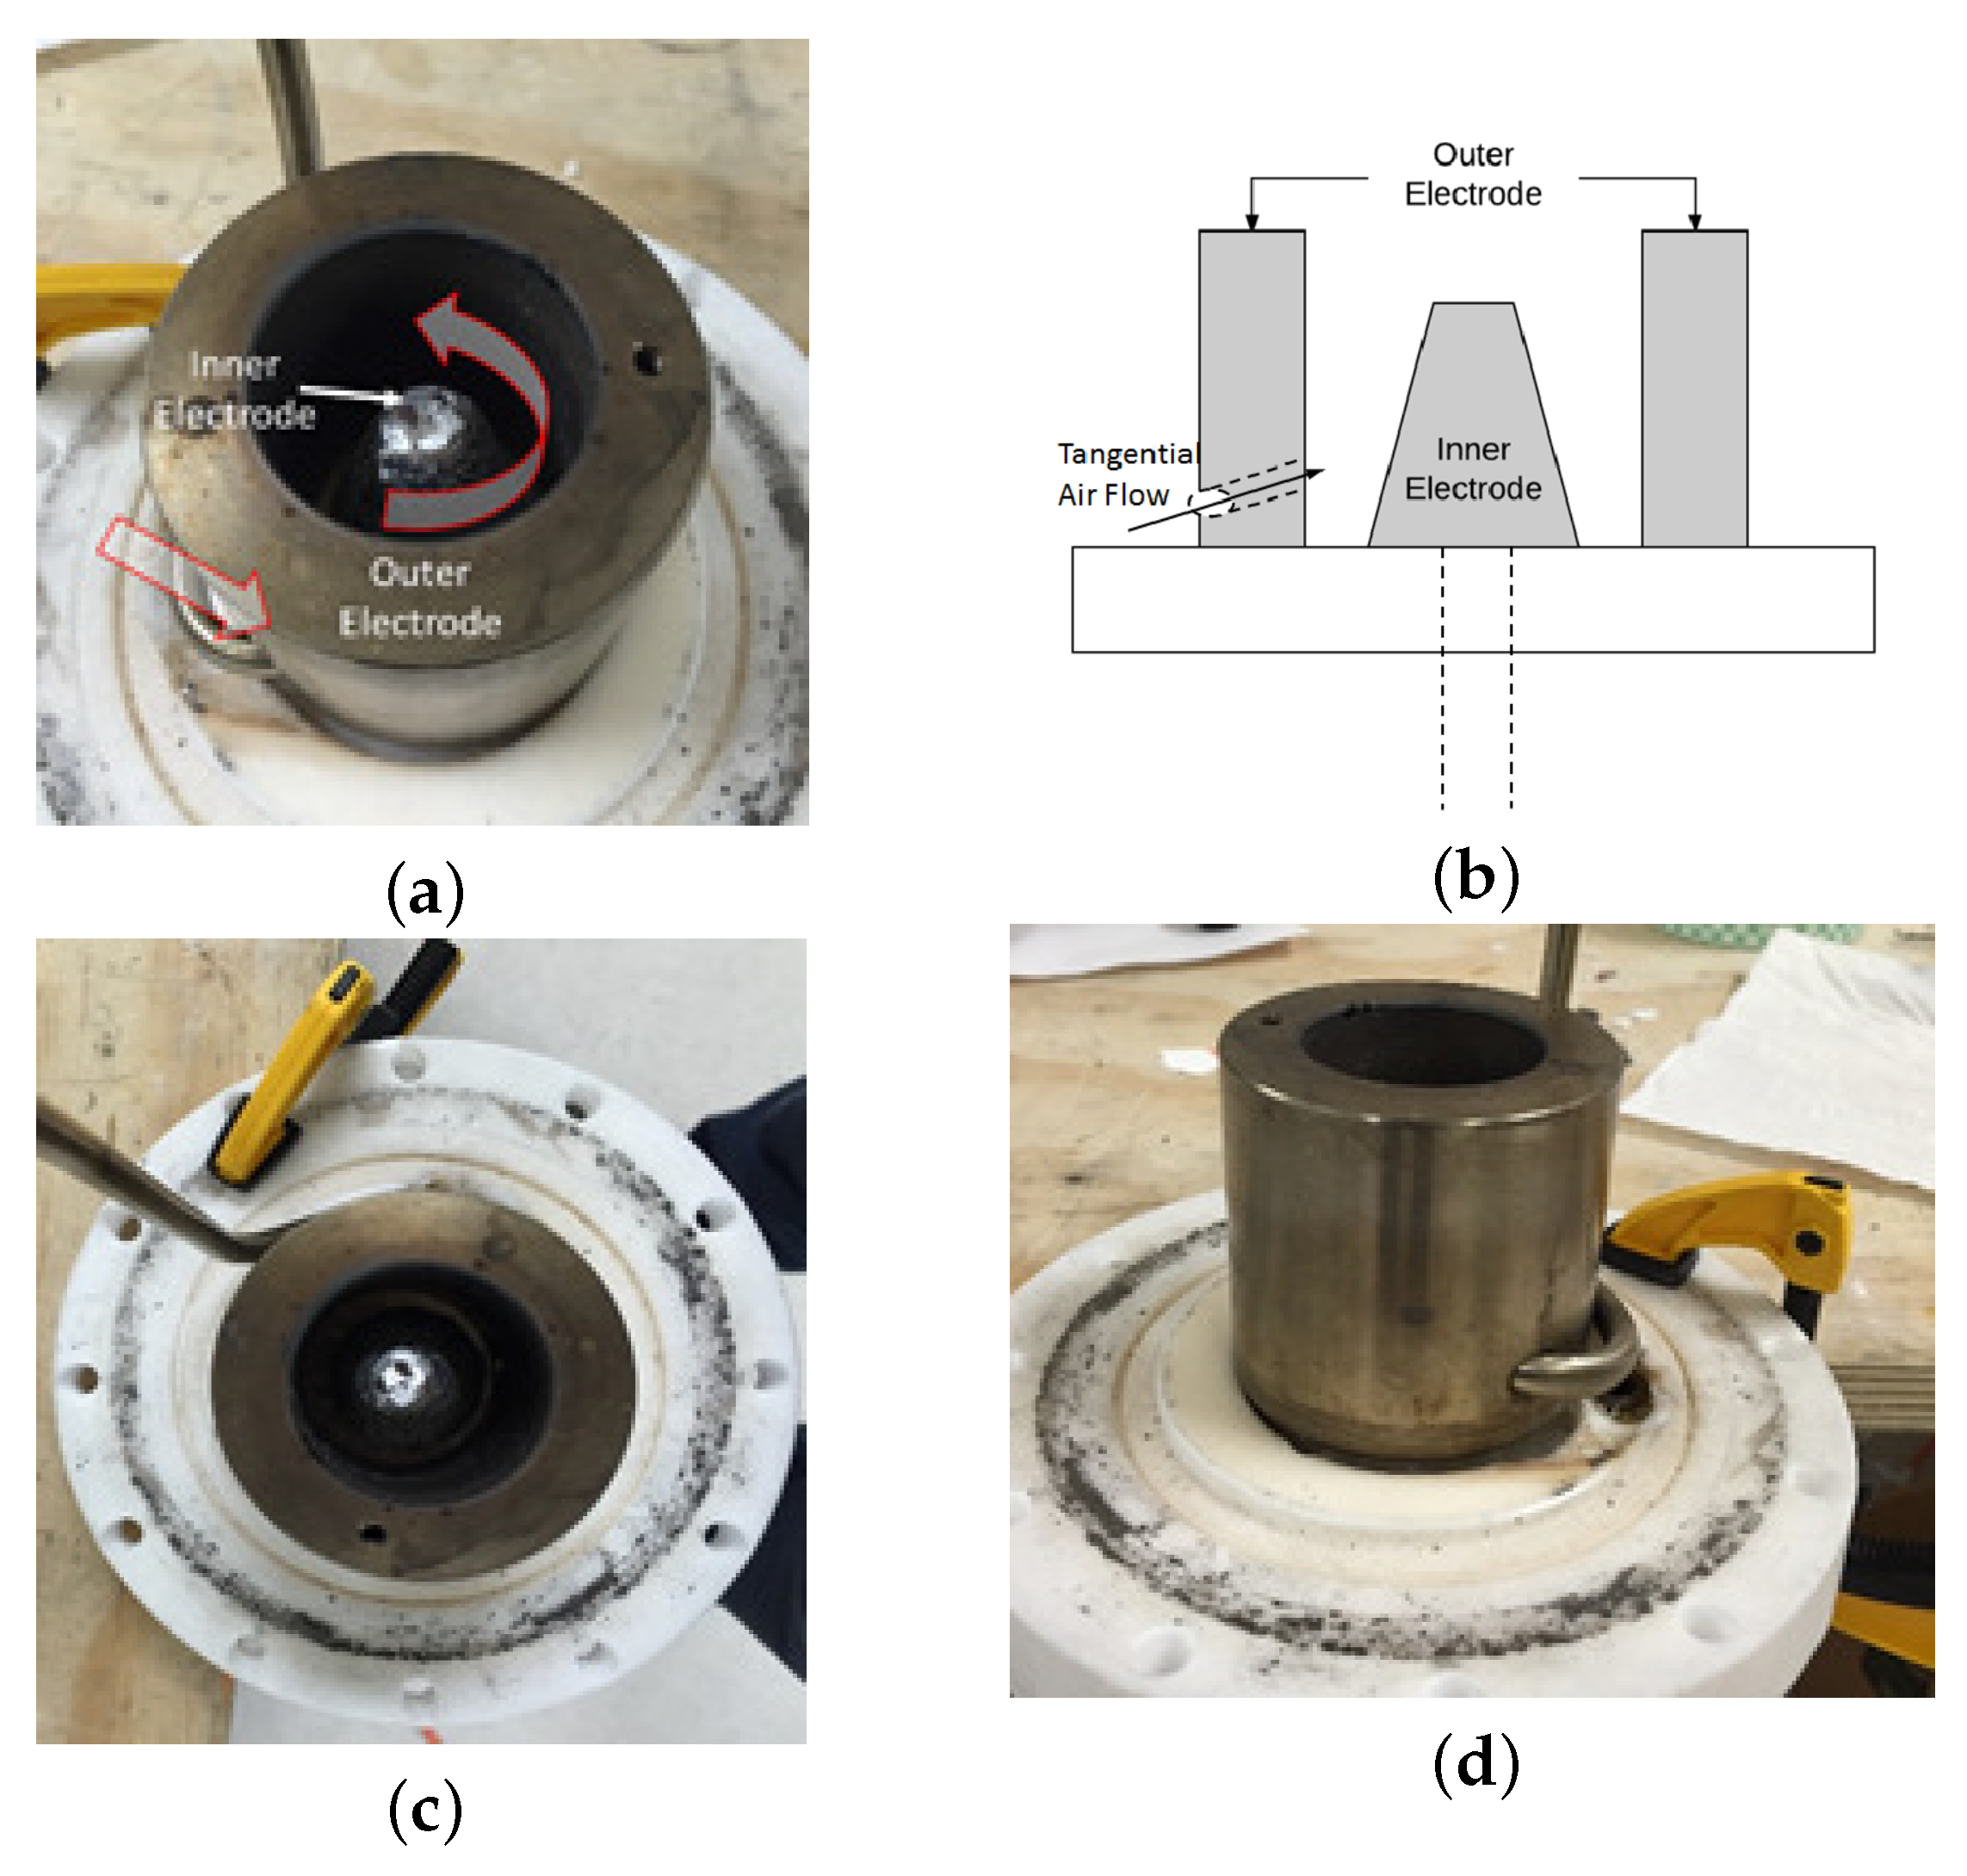
2.2. 3D Gliding Arc Vortex Reformer

Presented in this study is a novel plasma based reformer hereafter referred as 3D Gliding Arc Vortex Reformer (3D-GAVR). The fundamentals of this reformer are based on gliding arc discharge, as described by Czernichowski [22]. A few variations of gliding arc discharge have been proposed [23]. Unlike the previously proposed reformer topologies, 3D-GAVR expands the plasma zone and introduces vortex type air flow which further intensifies the plasma. The geometry of the reformer and cross-sectional area are shown in Figure 1a,b, respectively. Figure 1c,d shows the top and side views of the 3D-GAVR, respectively.
Following the structure of gliding arc, the distance between two electrodes is shortest at the bottom and longest at the top. This helps in arc propagation and keeps the arc in non-thermal region. When the voltage is applied, the arc initiates at the bottom due to smallest resistance and starts moving upwards. However, due to cylindrical electrodes, the movement occurs in rotational and upward direction simultaneously. The direction of rotation is dictated by the direction of input mixture flow. The tangential input creates a vortex in the plasma zone, as shown by red arrows in Figure 1a. This turbulent movement of mixture inside the reformer creates an expanded plasma that incorporates entire area between the two electrodes, hence allowing for more efficient reformation than traditional gliding arc structures. Furthermore, the increase in airflow increases the intensity of plasma rather than decreasing it, suggesting an operational flow rate of that is higher than other topologies such as pin and plate. Therefore, the suggested reformer can provide a solution that has higher efficiencies at higher flow rates. Operation of 3D-GAVR is depicted in Figure 2.
In addition, the thick electrodes, higher flow rates, and absence of sharp/pointed edges on the electrodes substantially reduces the electrode deterioration, and consequently maintenance time and cost. Although carbon should not be a product of an ideal partial oxidation reaction, the results do not always adhere to theoretical assumptions and some carbon deposition is often noticed. The given reformer topology is more tolerant towards carbon deposition than the counterparts. Moreover, excessive carbon deposition can be solved by slight increase in the input air flow.

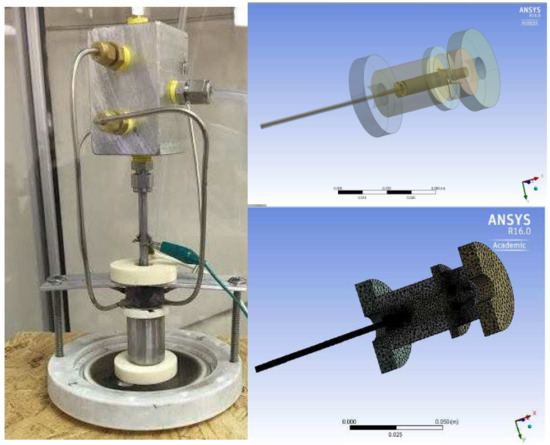
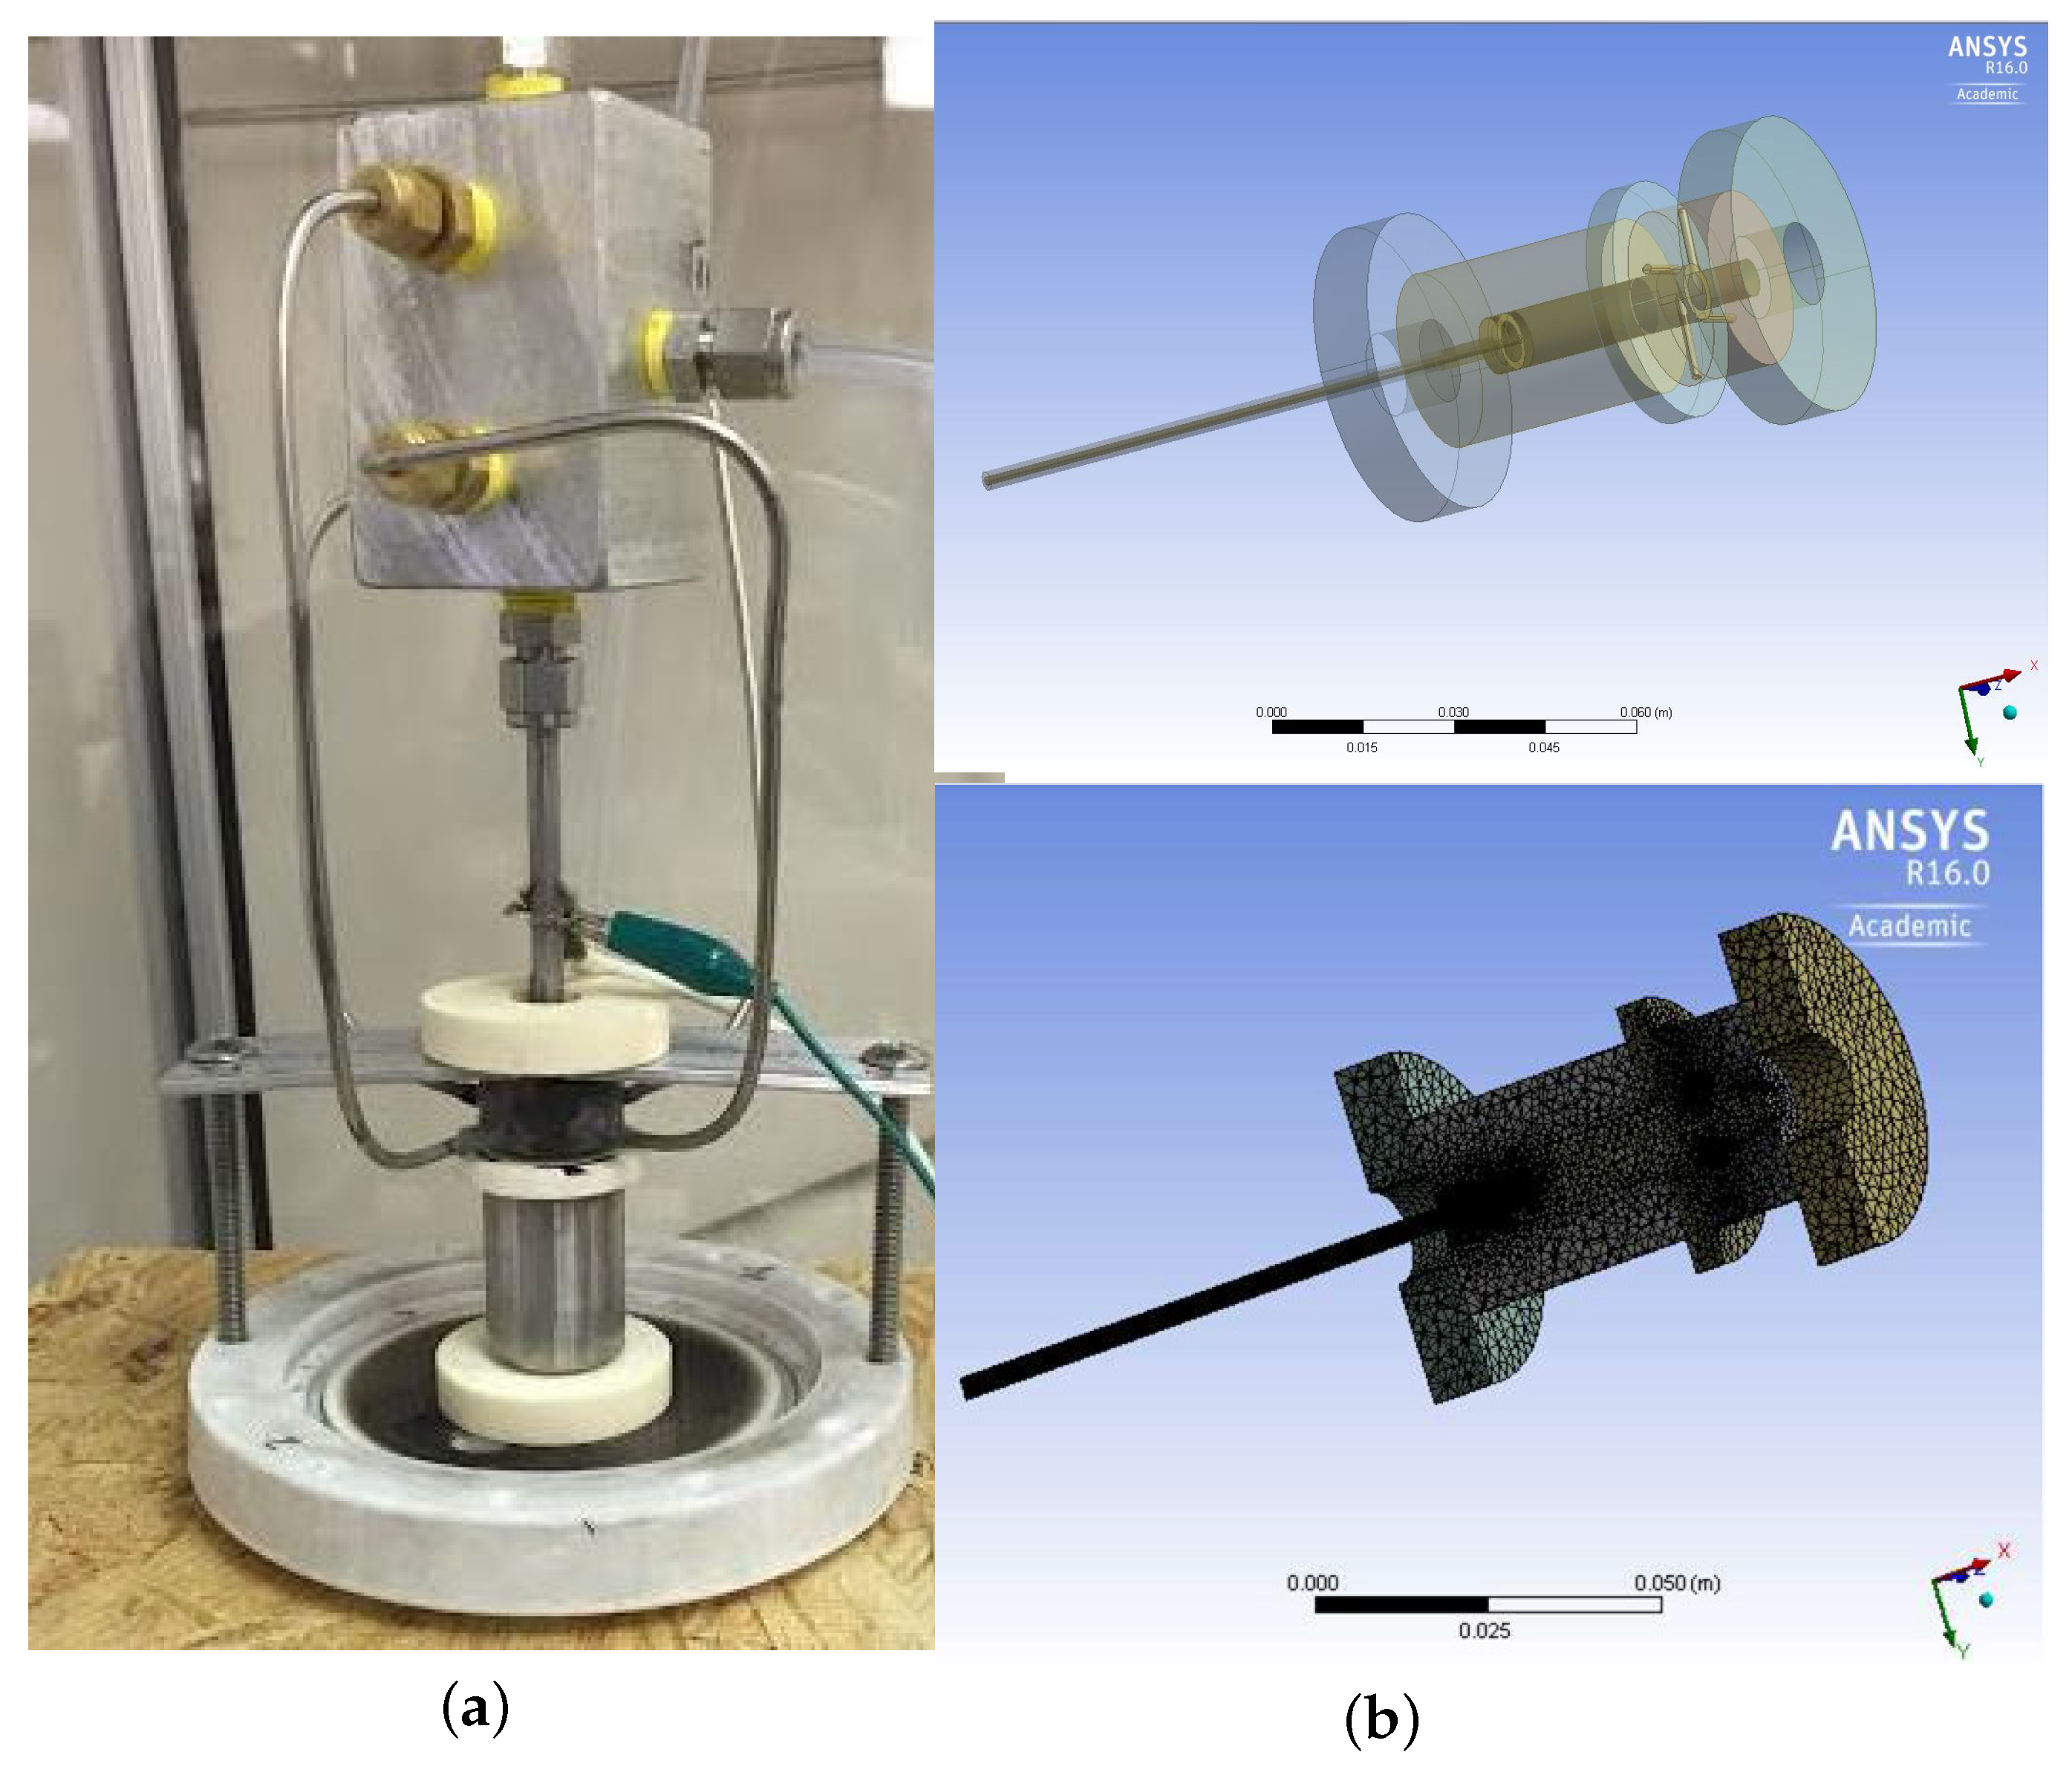
2.3. Experimental Setup

The objective of the experiment was to pass a mixture of air and methane through 3D-GAVR, perform reformation, and detect the composition of the produced syngas. The setup prepared for the experiment is presented in Figure 3a, and allows for online detection of syngas composition without stopping the experiment. This step is important for maintaining consistency, especially during the comparative analysis that involves changes in specific parameters.
The setup description is presented in the form of block diagram in Figure 3b. The electric power required for reformation is provided through a flyback converter which was designed to provide up to 6 kV pulses at 2 kHz. However, the experiment was performed with pulses of peak voltage around 3 kV. The input power to the flyback converter is provided by Magna power TSA600 DC power supply. The compressed air and methane cylinders have been used to supply mixture into 3D-GAVR. The flow is controlled using individual flow controller, as shown in Figure 3a. Post reformation syngas is then transferred to Gas Chromatogram (GC) for detection of gas composition. The results of GC are presented in the following section. A condenser is placed between GC and the reformer, as shown in Figure 3b, to eliminate moisture as required for the safety of GC. The reformer is allowed to operate for a few minutes to reach steady state operation and GC valve is opened to collect sample syngas. The excess gas is safely released using the vent. Each test involved collection of three samples with intervals of 10 min to ensure accuracy of the readings. For sensitivity analysis, the parameters were changed and the procedures were repeated.

2.4. Calculation Method
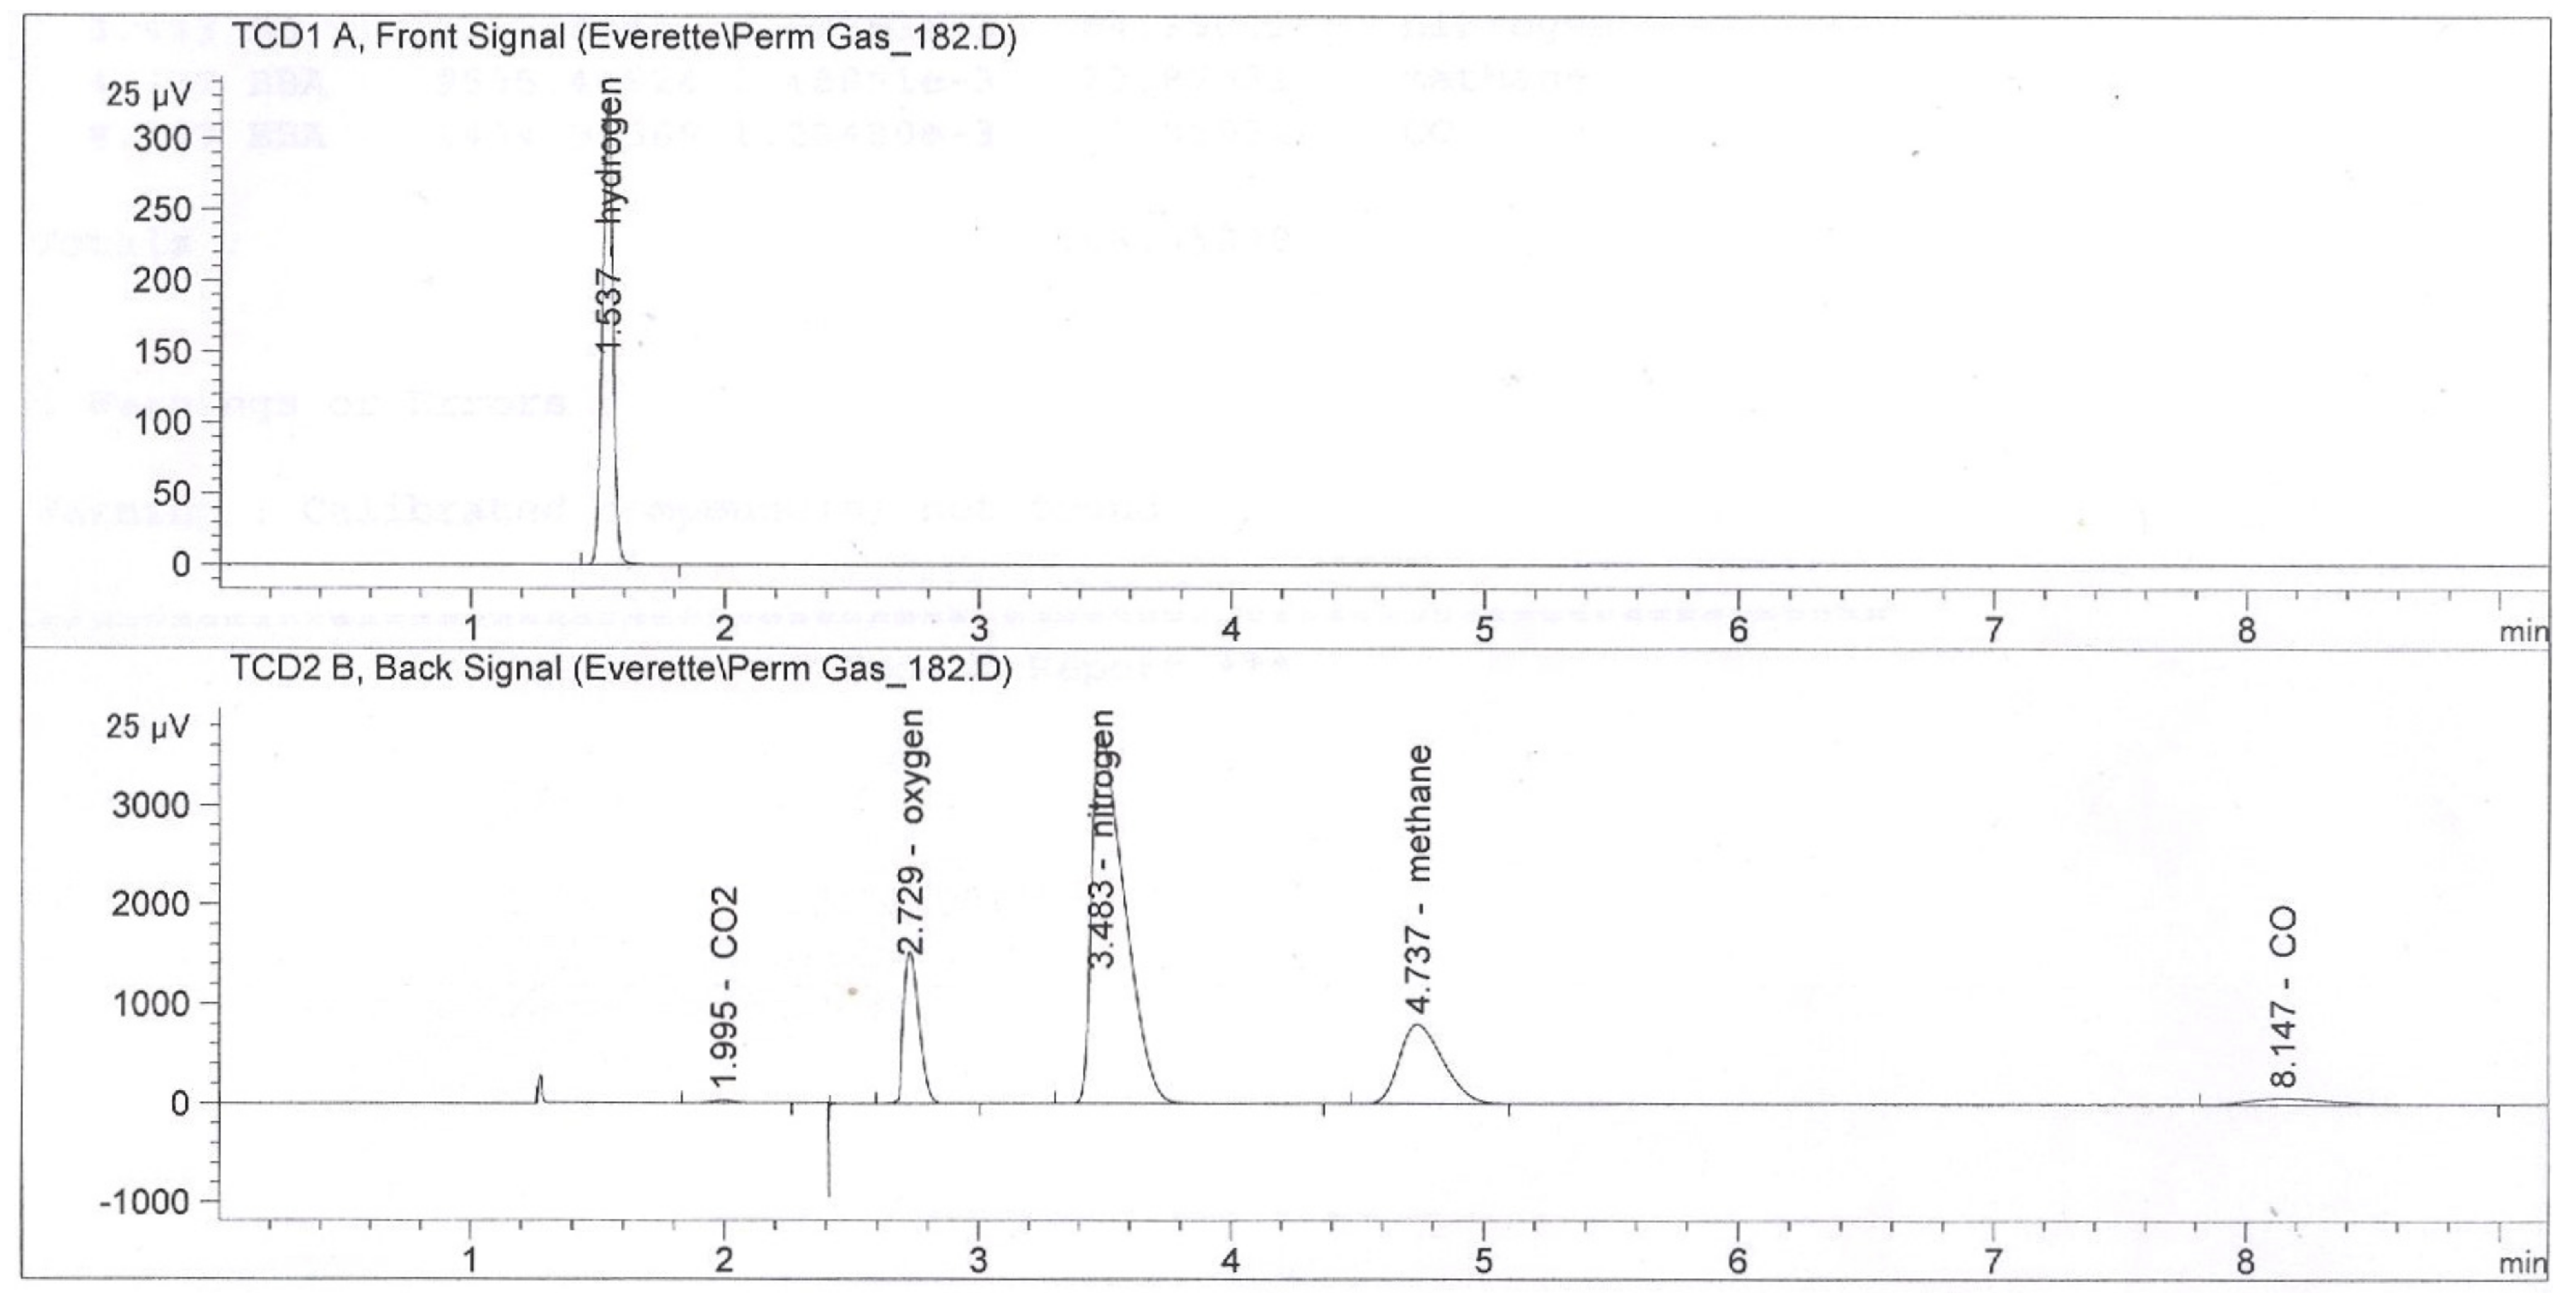
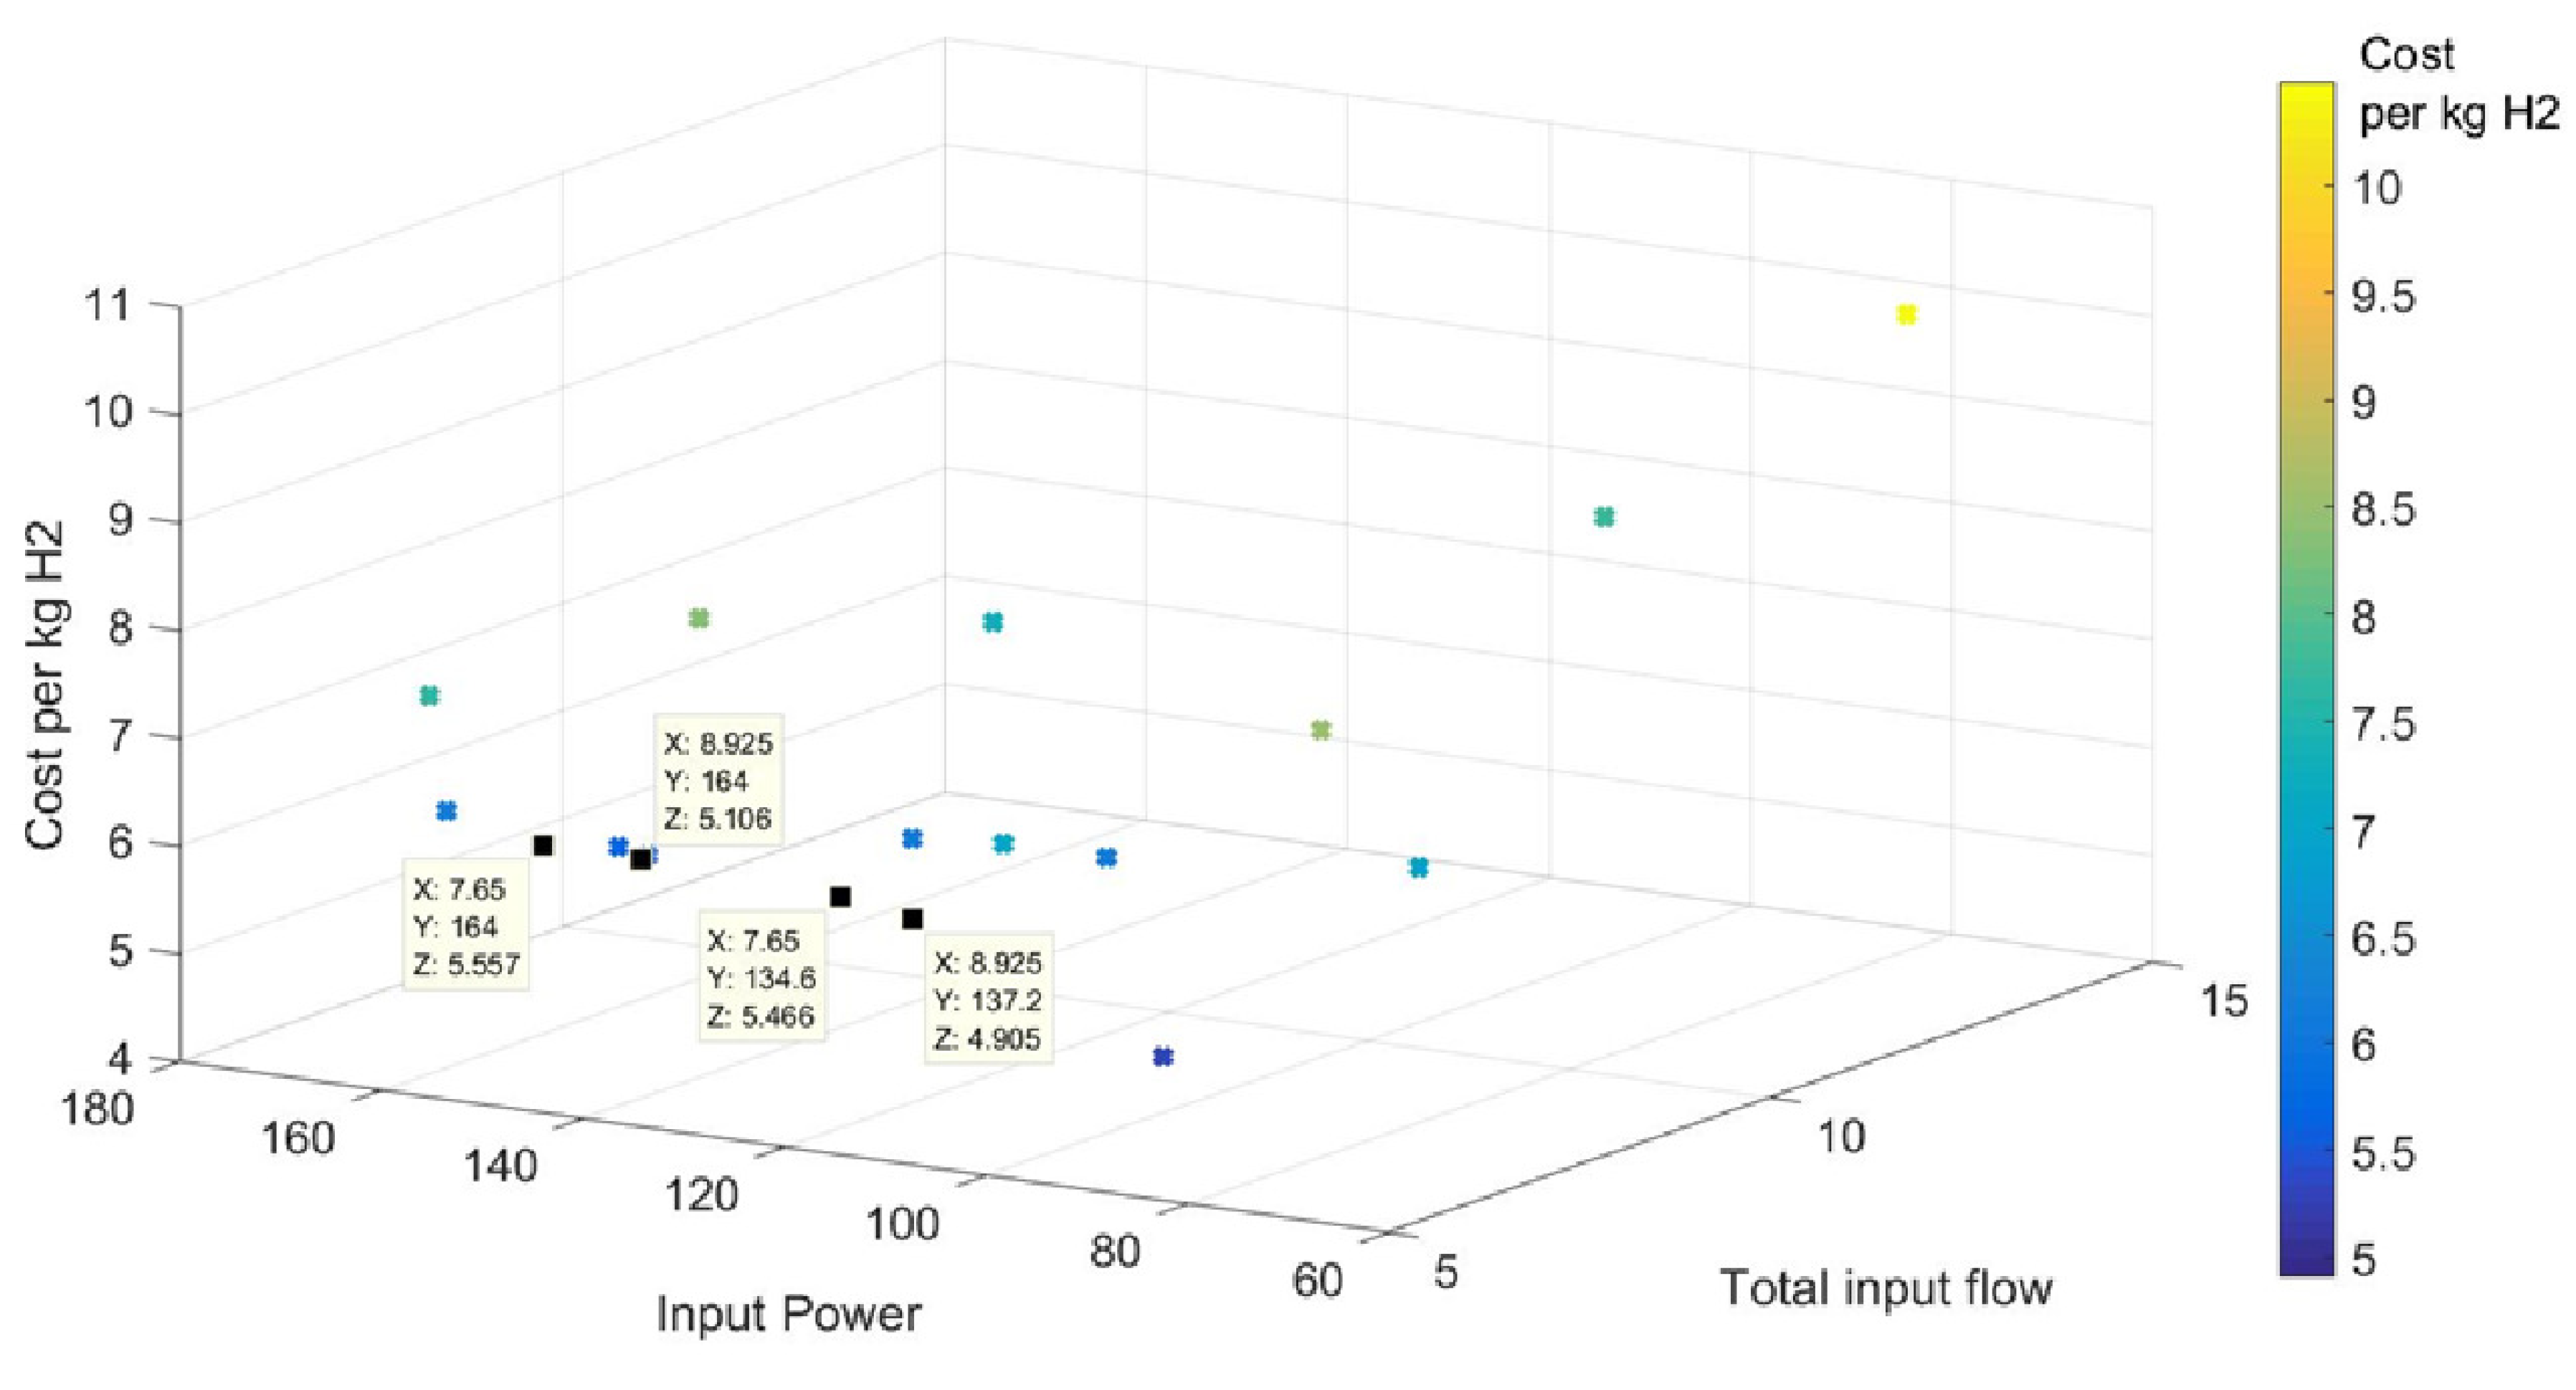
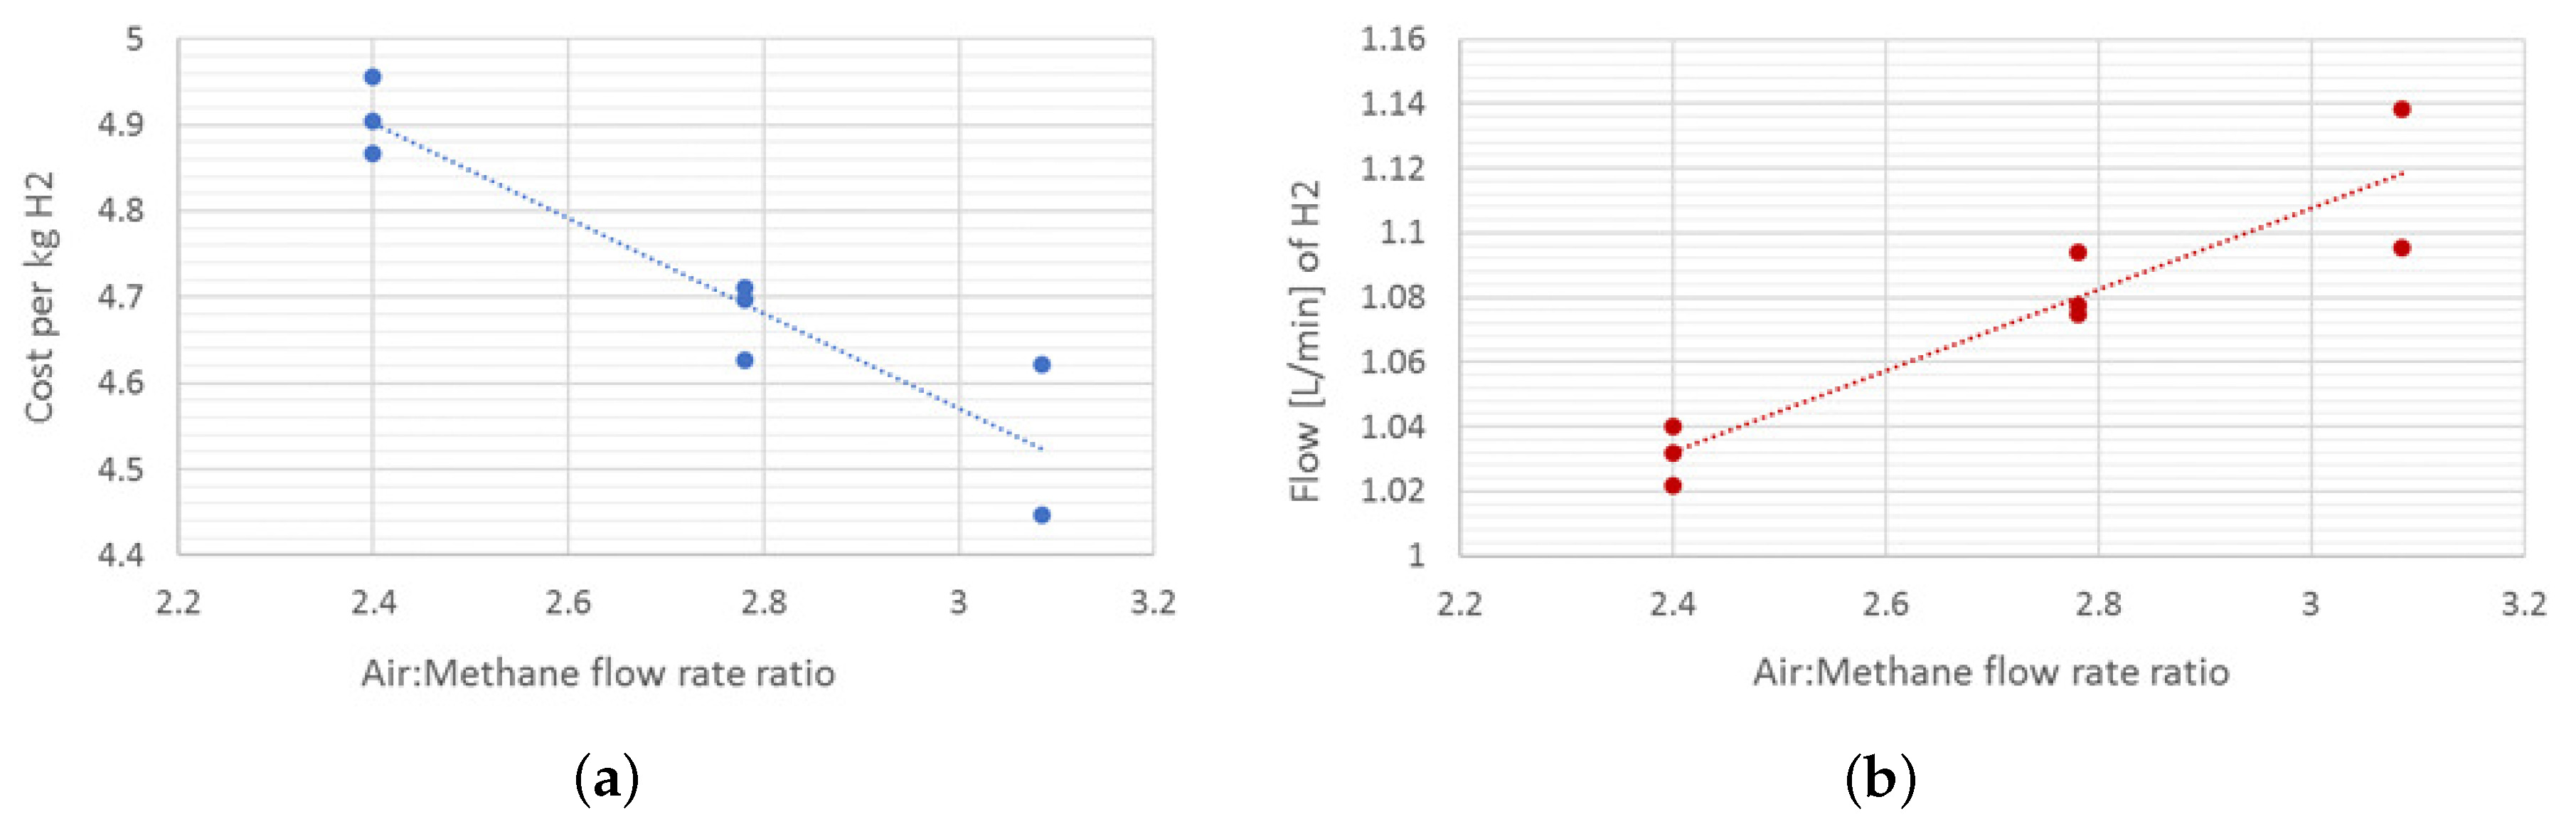
The parameters collected from the experimental analysis are listed in Table 1, which summarizes the output presented in Figure 4 along with the input to the system. Table 1 is mentioned as a mere example to clarify the origin of data in Table 2. It is to be noted that this is not an optimal operation point. The input methane and air flow are measured using respective flow meters, and the input voltage and current are the values read by DC power supply, therefore the efficiency of the flyback converter is included in the calculation. The output of the cold plasma system is syngas since water gas shift has not been performed. The composition of syngas was detected using Gas Chromatogram (GC) Agilent 7890B (Agilent Technologies, Santa Clara, CA, USA). The output of the GC is the molar percent contents of different constituents of the output syngas. A typical result from GC is shown in Figure 4, which consists of molar percentages of CH 4 , CO, CO 2 , H 2 , N 2 and O 2 , as shown in Reaction (b). This dataset is used as input to the database that performs calculations for cost in $ per kg and flow rate of hydrogen in liters per minute (L/min). N 2 and O 2 do not affect these calculations, hence are not included in Table 1 and Table 2. These calculations are made by first calculating the cost rate of the methane in $/s, following Equations (4) and (5). The cost rate of electricity is calculated using Equation (6). The cost of produced H 2 and the rate of production of H 2 are important parameters that serve as the basis of comparisons; these parameters are calculated based on Equations (9) and (10). The cost calculation of H 2 includes cost of input methane and input electricity to the system. The input CH 4 flow rate was converted to liters per second and the cost rate of $0.366/ccf at 20 psia was used to calculate the price per second of CH 4 . Similarly, input power in watts was converted to kWh per second and electric cost rate of $0.09/kWh was utilized to calculate the price per second of electricity in Equation (9). Hence, the cost of H 2 per kg is also a good representation of the efficiency of the system.
The Alicat flow meter utilized has limitations related to number of components in the composition of gas, hence, the output flow rate could not be measured accurately. This was compensated by estimating the molar flow rate of hydrogen using mass balance and molar flow rate of carbon. Mass balance suggests that the total number of moles of carbon in the input and output side of the reaction should be equal, consequently, the molar flow rate of carbon should also be equal. The compositions of experimental input and output gas mixture are presented in Reaction (b). Air was used instead of oxygen, which introduces inert nitrogen to both input and output side of the reaction. More importantly, ideal reactions such as Reaction (a) is not possible in plasma assisted systems, therefore, output gas consists of CO 2 , and unreacted CH 4 in addition to expected CO and H 2 . Considering Reaction (b), the number of moles of carbon in reactant side CH 4 should be equal to total number of moles of carbon in product shown in Equation (1). Using the percent values of CO, CO 2 and unreacted CH 4 obtained from the GC readings as shown in Figure 4, molar flow rate of output carbon and hydrogen can be calculated using Equations (2) and (3), respectively.
CH 4 + Air CO + unreacted   CH 4 + N 2 + O 2 + H 2 ( b )
Percent composition of moles C ( % C ) = % CO 2 + % CO + % unreacted CH 4
Molar flow rate of C ( mol min ) = Molar flow rate of CH 4 ( mol min )
Molar flow rate of H 2 ( mol min ) = Molar flow rate of CH 4 ( mol min ) × ( % H 2 % C )
Volumetric flow of CH 4 ( ccf s ) = ( Flow in L min ) 60 × ( ccf L )
Cos t rate of CH 4 ( $ s ) = ( ccf s ) × ( price per ccf ) × ( Volume at operating pressure Volume at atm pressure )
Electricity cos t rate ( $ s ) = Input power ( W ) 1000 × 3600 ) × ( price per kWh )
Molar flow rate of CH 4 ( mole min ) = Vol . flow rate of CH 4 ( L min ) × ( g L ) × ( mol g )
Molar flow rate of H 2 ( mole min ) = Molar flow rate of CH 4 ( mol min ) × ( % H 2 % C )
Cos t of produced H 2 ( $ kg ) = Cos t rate of CH 4 ( $ s ) + Electricity cos t rate ( $ s ) Molar flow rate H 2 ( mol min ) × ( g mol ) × ( kg 1000 × 60 s )
Rate of H 2 production ( L min ) = Molar flow rate of H 2 ( mol min ) × ( g mol ) × ( L g )

2.5. Results

The gas compositions are collected from the experiments and the calculations for price and production rate of hydrogen are made as described in previous section. The experimental analysis has been divided into two distinct portions. In the first analysis, the variation of power and flow rate for ideal Air and CH 4 with flow rate ratio of 2.4:1, respectively, are investigated. Since molar volumes of all gases is 22.4 L, the flow rate ratio can be derived by considering coefficient of O 2 per mole of CH 4 in Reaction (a), and the percent content of oxygen in air (20.95%) which will be 1 / 2 × 1 / 0.2095 = 2.4 . The cost and flow rate of hydrogen for each test were calculated and the results are provided in Table 2. It should be noted that each data point is obtained by repeating each test three times to ensure consistency.
Figure 5 presents the summary of Table 2 which presents dependency of the cost of the produced H 2 in input power and total input flow. As indicated, most of the points with lowest cost lie around the region where the total flow is 7.65–8.925 L/min, which corresponds to CH 4 flow rate of 2.25–2.625 L/min and Air flow of 5.4–6.3 L/min, and the power ranged 135–164 W. The most efficient point is encircled in Table 2 and was chosen for the second portion of the experiment. The second portion involves keeping the power constant and varying the flow rate ratio of Air:CH 4 .
The results of second portion of the experiment are listed in Table 3. This section of testing involved starting at the most efficient point of the first part of the test and varying the Air:CH 4 flow rate ratio. The ratio was varied from 2.4:1 to 3.09:1. The lower limit was decided by theoretical limits as described earlier. Going below this value resulted in carbon deposition. The higher limit was governed by thermal limitation of chamber’s Teflon end caps. The results of the test are explained in Figure 6a,b. The cost of the produced H 2 decreases, and the flow rate of H 2 increases, with approximate linearity, as the Air:CH 4 ratio increases. Thus, increasing the ratio has positive effects on both cost and rate of production within this range. However, it is important to realize that increasing the ratio further will eventually lead to combustion and formation of water vapor causing drastic decrease in H 2 production. The %H 2 in the output mixture decreases as the ratio increases, which contradicts the trend of H 2 flow rate. This can be explained by considering that the percent value is not an absolute quantity: this quantity depends on the flow rate of other output gases. As the ratio is increased, the flow rate of input air is increased while the flow of CH 4 is kept the same. Although higher amount of H 2 is produced, the rate of increase of H 2 is smaller than the rate of increase in components introduced due to increase in input air flow. Therefore, the percent H 2 decreases even though the flow rate of the produced H 2 increases.
Hence, H 2 can be produced for as low as $ 4.45 per kg with flow rates of around 1 L per minute. The maximum methane conversion percentage which is achieved by this technology is up to 62.38%. The non-optimized dimensions of 3D-GAVR is around 7 cm in radius and 15 cm in height with significant room for reduction. Therefore, further optimization of performance and size, and cascaded performance of multiple reformers can provide an attractive solution for on-site hydrogen generation in H 2 dispensing stations. This will help eliminate distribution cost and reduce storage costs which make up a significant portion of current hydrogen fuel cost [24].
Moreover, a comparison was made between the results from this study and the other studies in the literature. The results are presented in Figure 7a–c, where the histograms are presented by Petitpas et al. [17] and the black dot on the y-axis represents the performance of the proposed 3DGAVR.
The values were obtained using the method presented by Petitpas et al. [17] for fair comparison. Figure 7a compares the methane conversion rate of 3DGAVR with previous publications. The conversion rate percent, obtained by Equation (11), is 62.8%. As shown in Figure 7a, this conversion rate is higher than most of the systems that use Methane as fuel (represented by green histograms). The efficiency of 3DGAVR is calculated to be 10.76% using Equation (12), which is significantly lower than most of the systems, as presented in Figure 7b. However, considering only the systems that use Methane as fuel, this efficiency is still higher than 42% of the listed results. Lastly, the specific energy requirement for 3DGAVR is 88.9 kJ/mol using Equation (13). As seen in Figure 7c, this value is competitive, even with consideration of entire fuel spectrum.
χ = [ CO + CO 2 + CH 4 + ] produced n × [ C n H m ] injected
η = ( H 2 + CO ) produced × LHV ( H 2 ) Input plasma energy + fuel injected × LHV ( fuel )
ν = Input plasma power [ H 2 + CO ] produced
Consequently, the computational fluid dynamics modeling of another innovative cold plasma reformer chamber called a reverse vortex flow gliding arc reactor (RVF-GA), where the geometry and inlets of the 3D-GAVR are modified, was conducted to investigate the effect of geometry size and configuration for efficient performance.

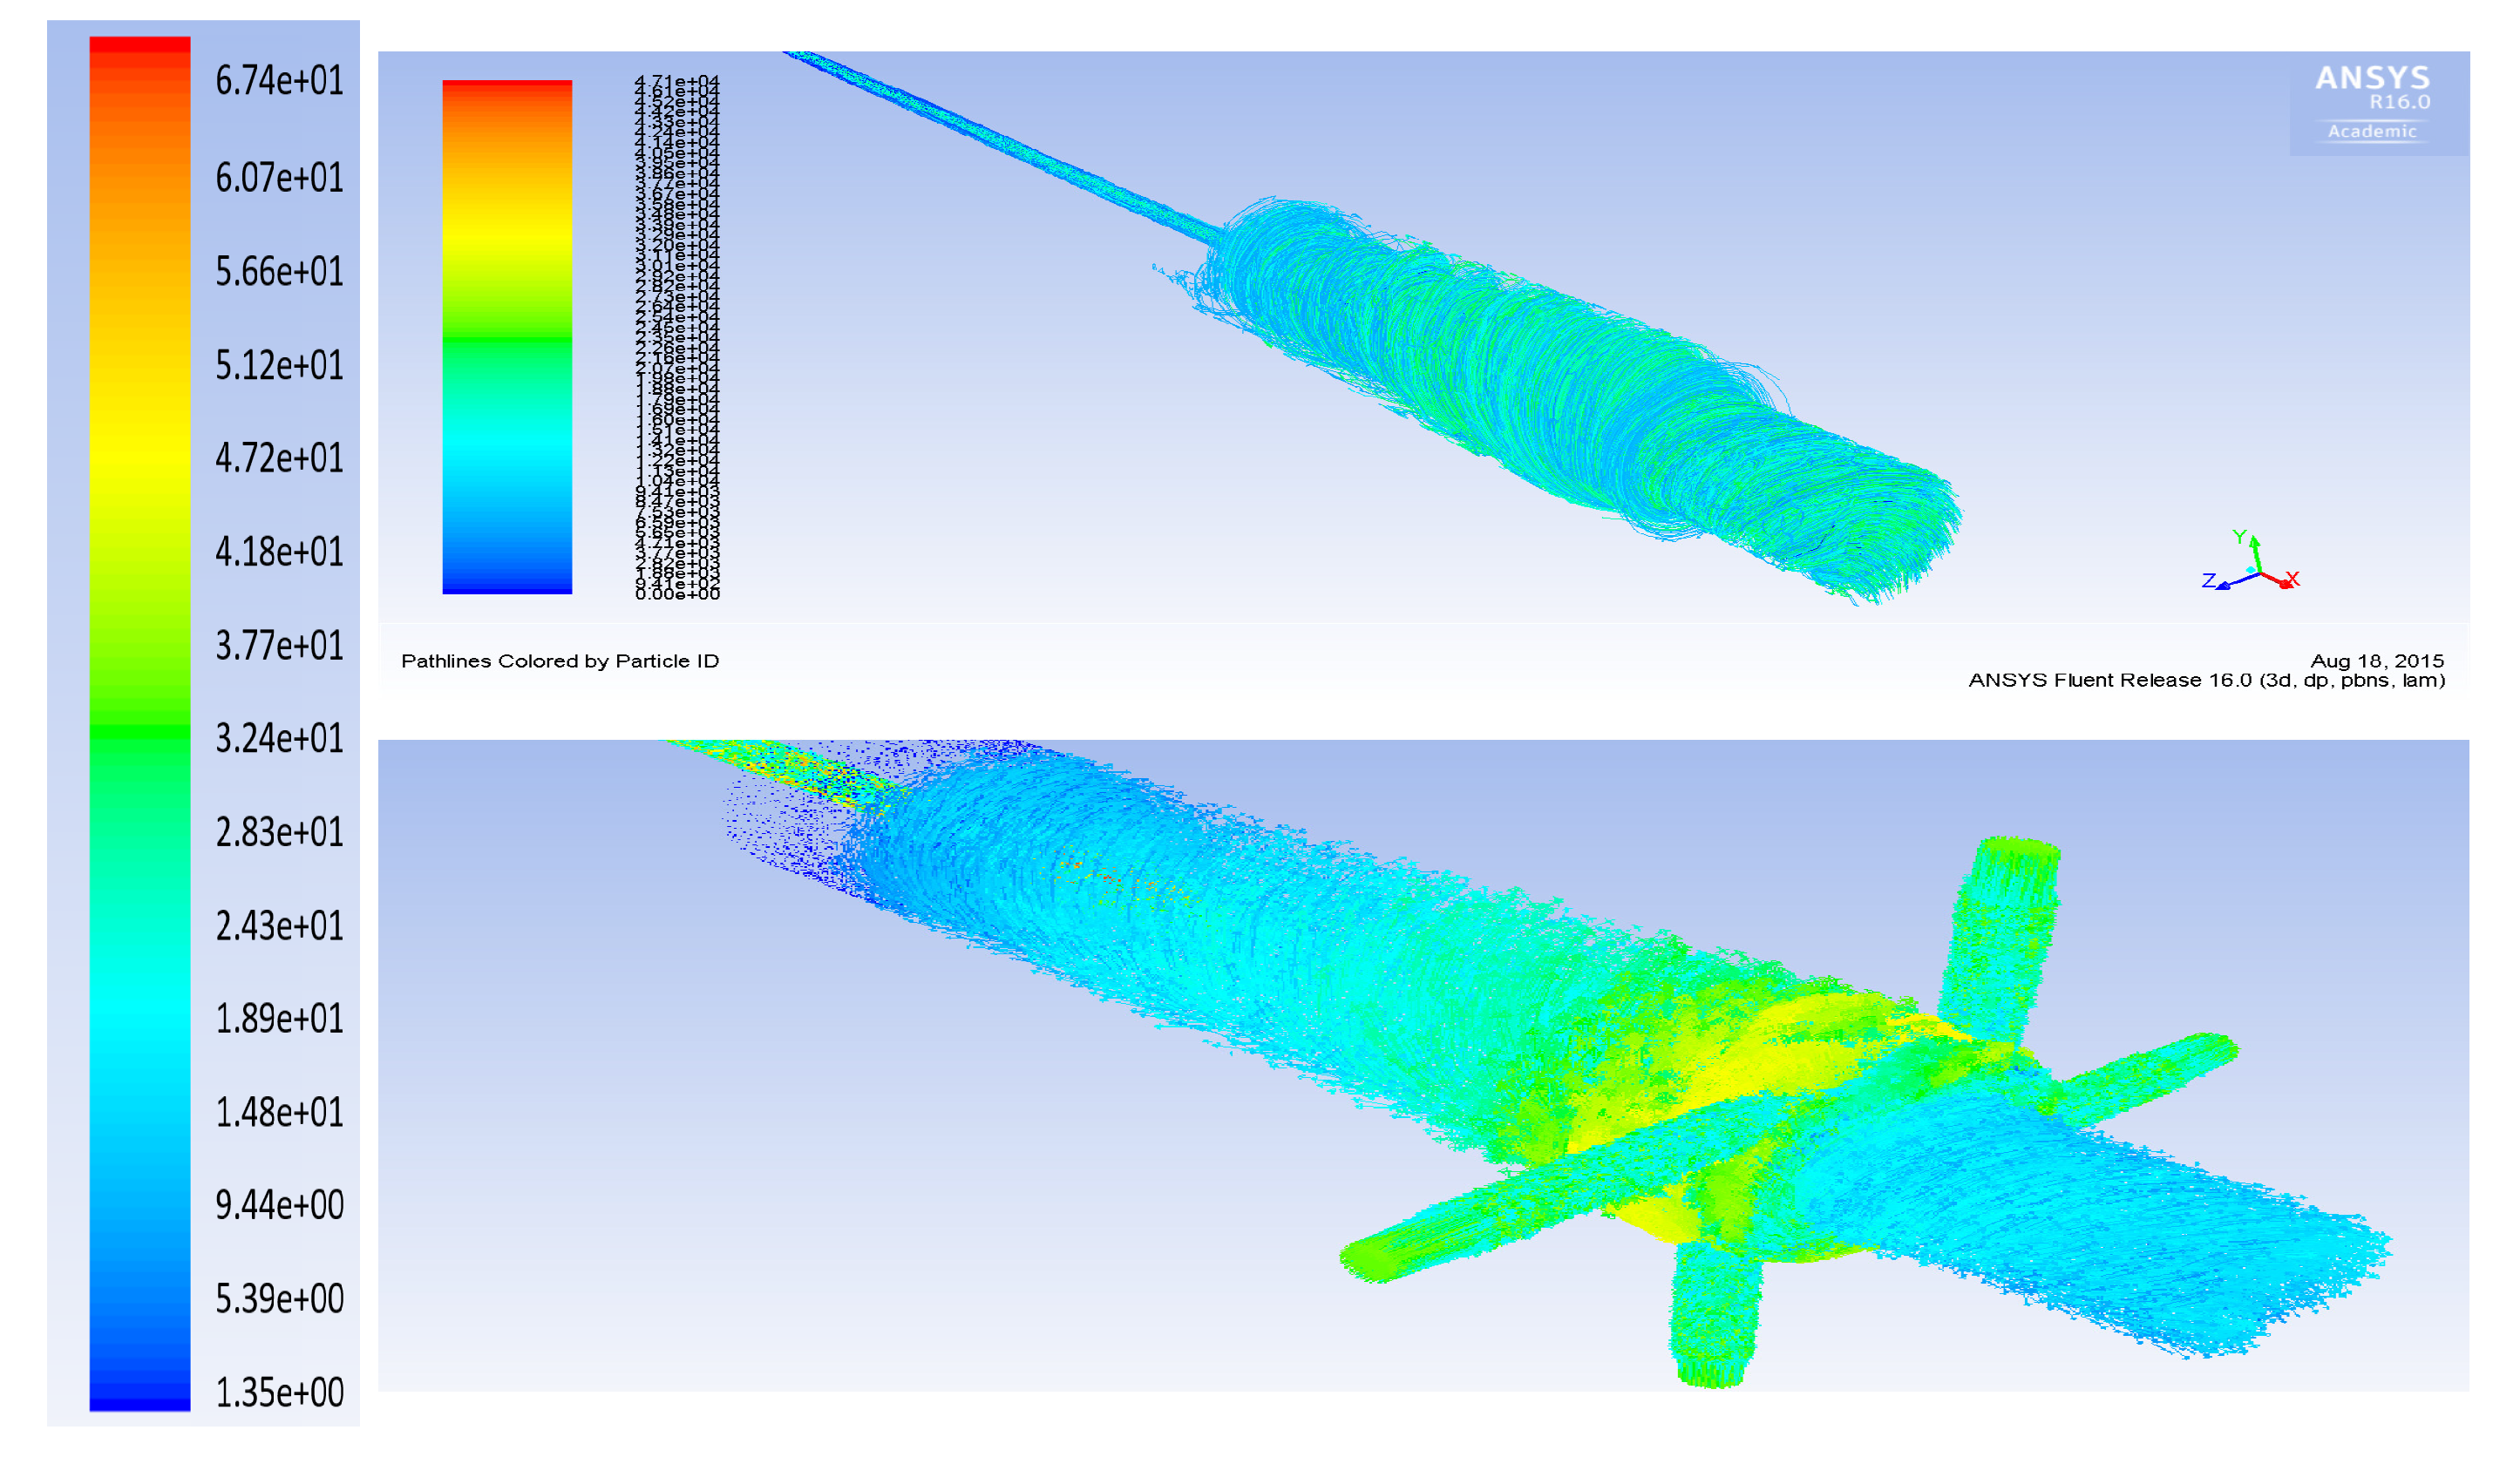
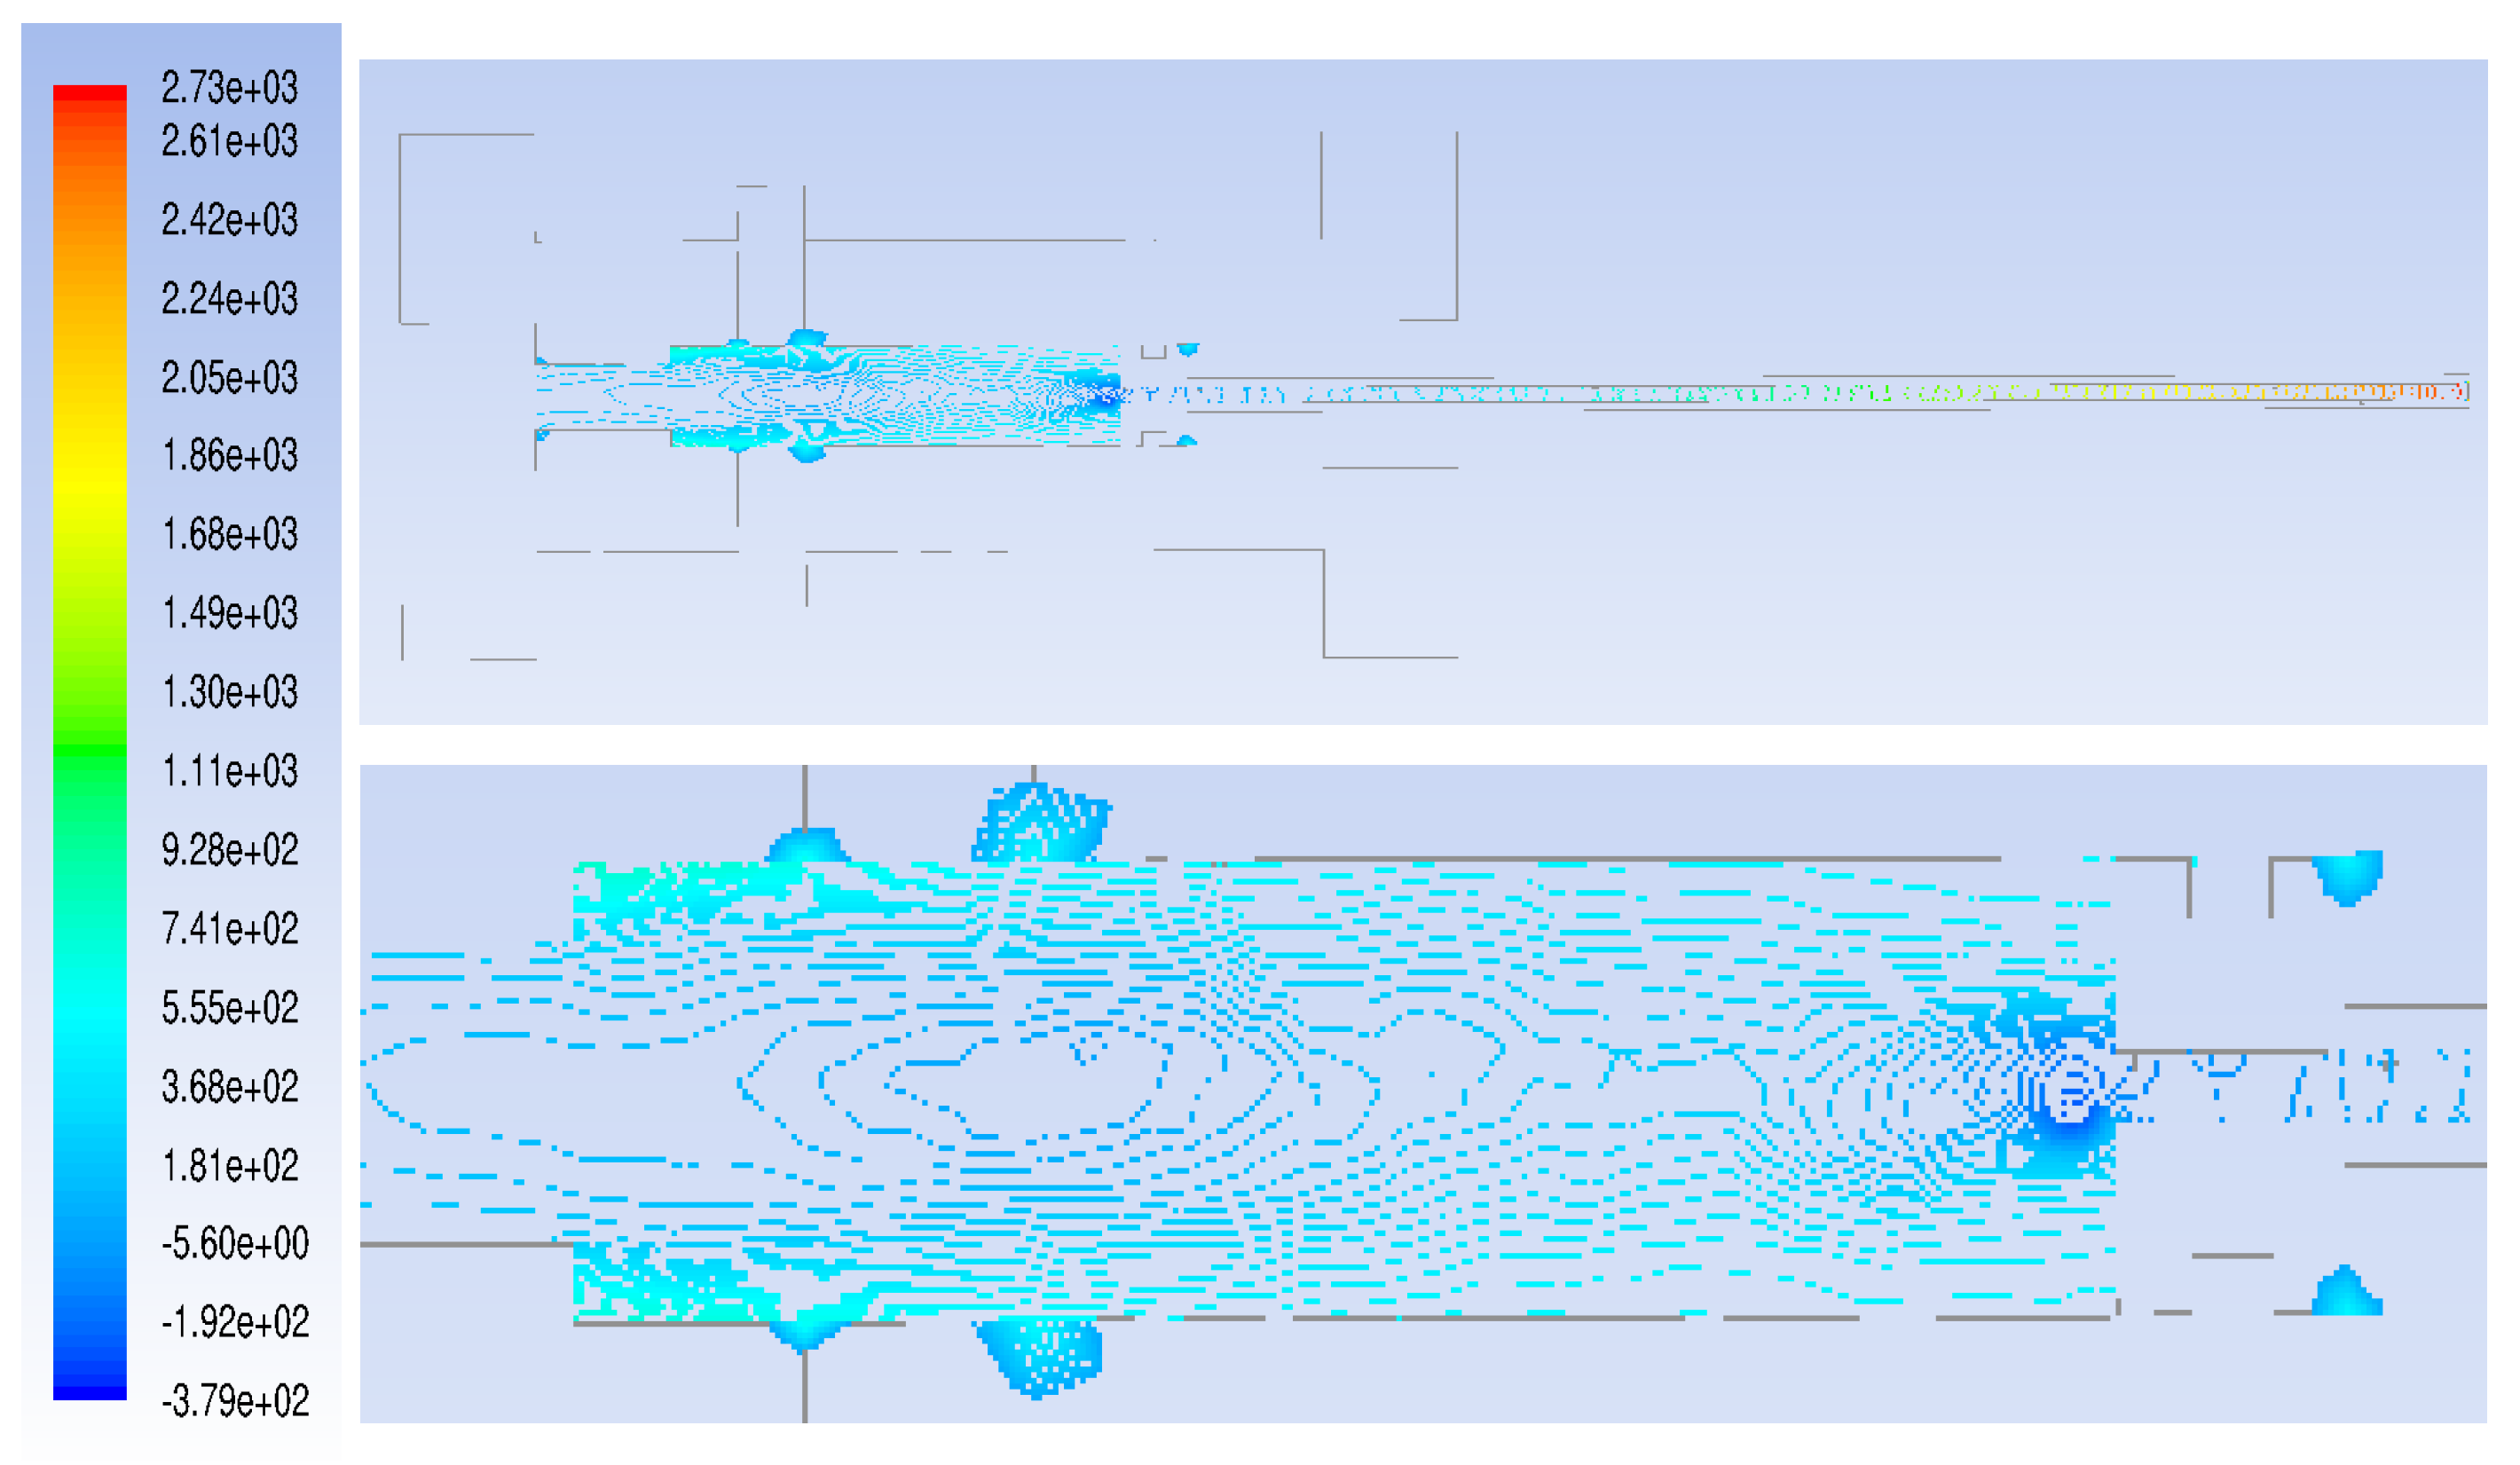
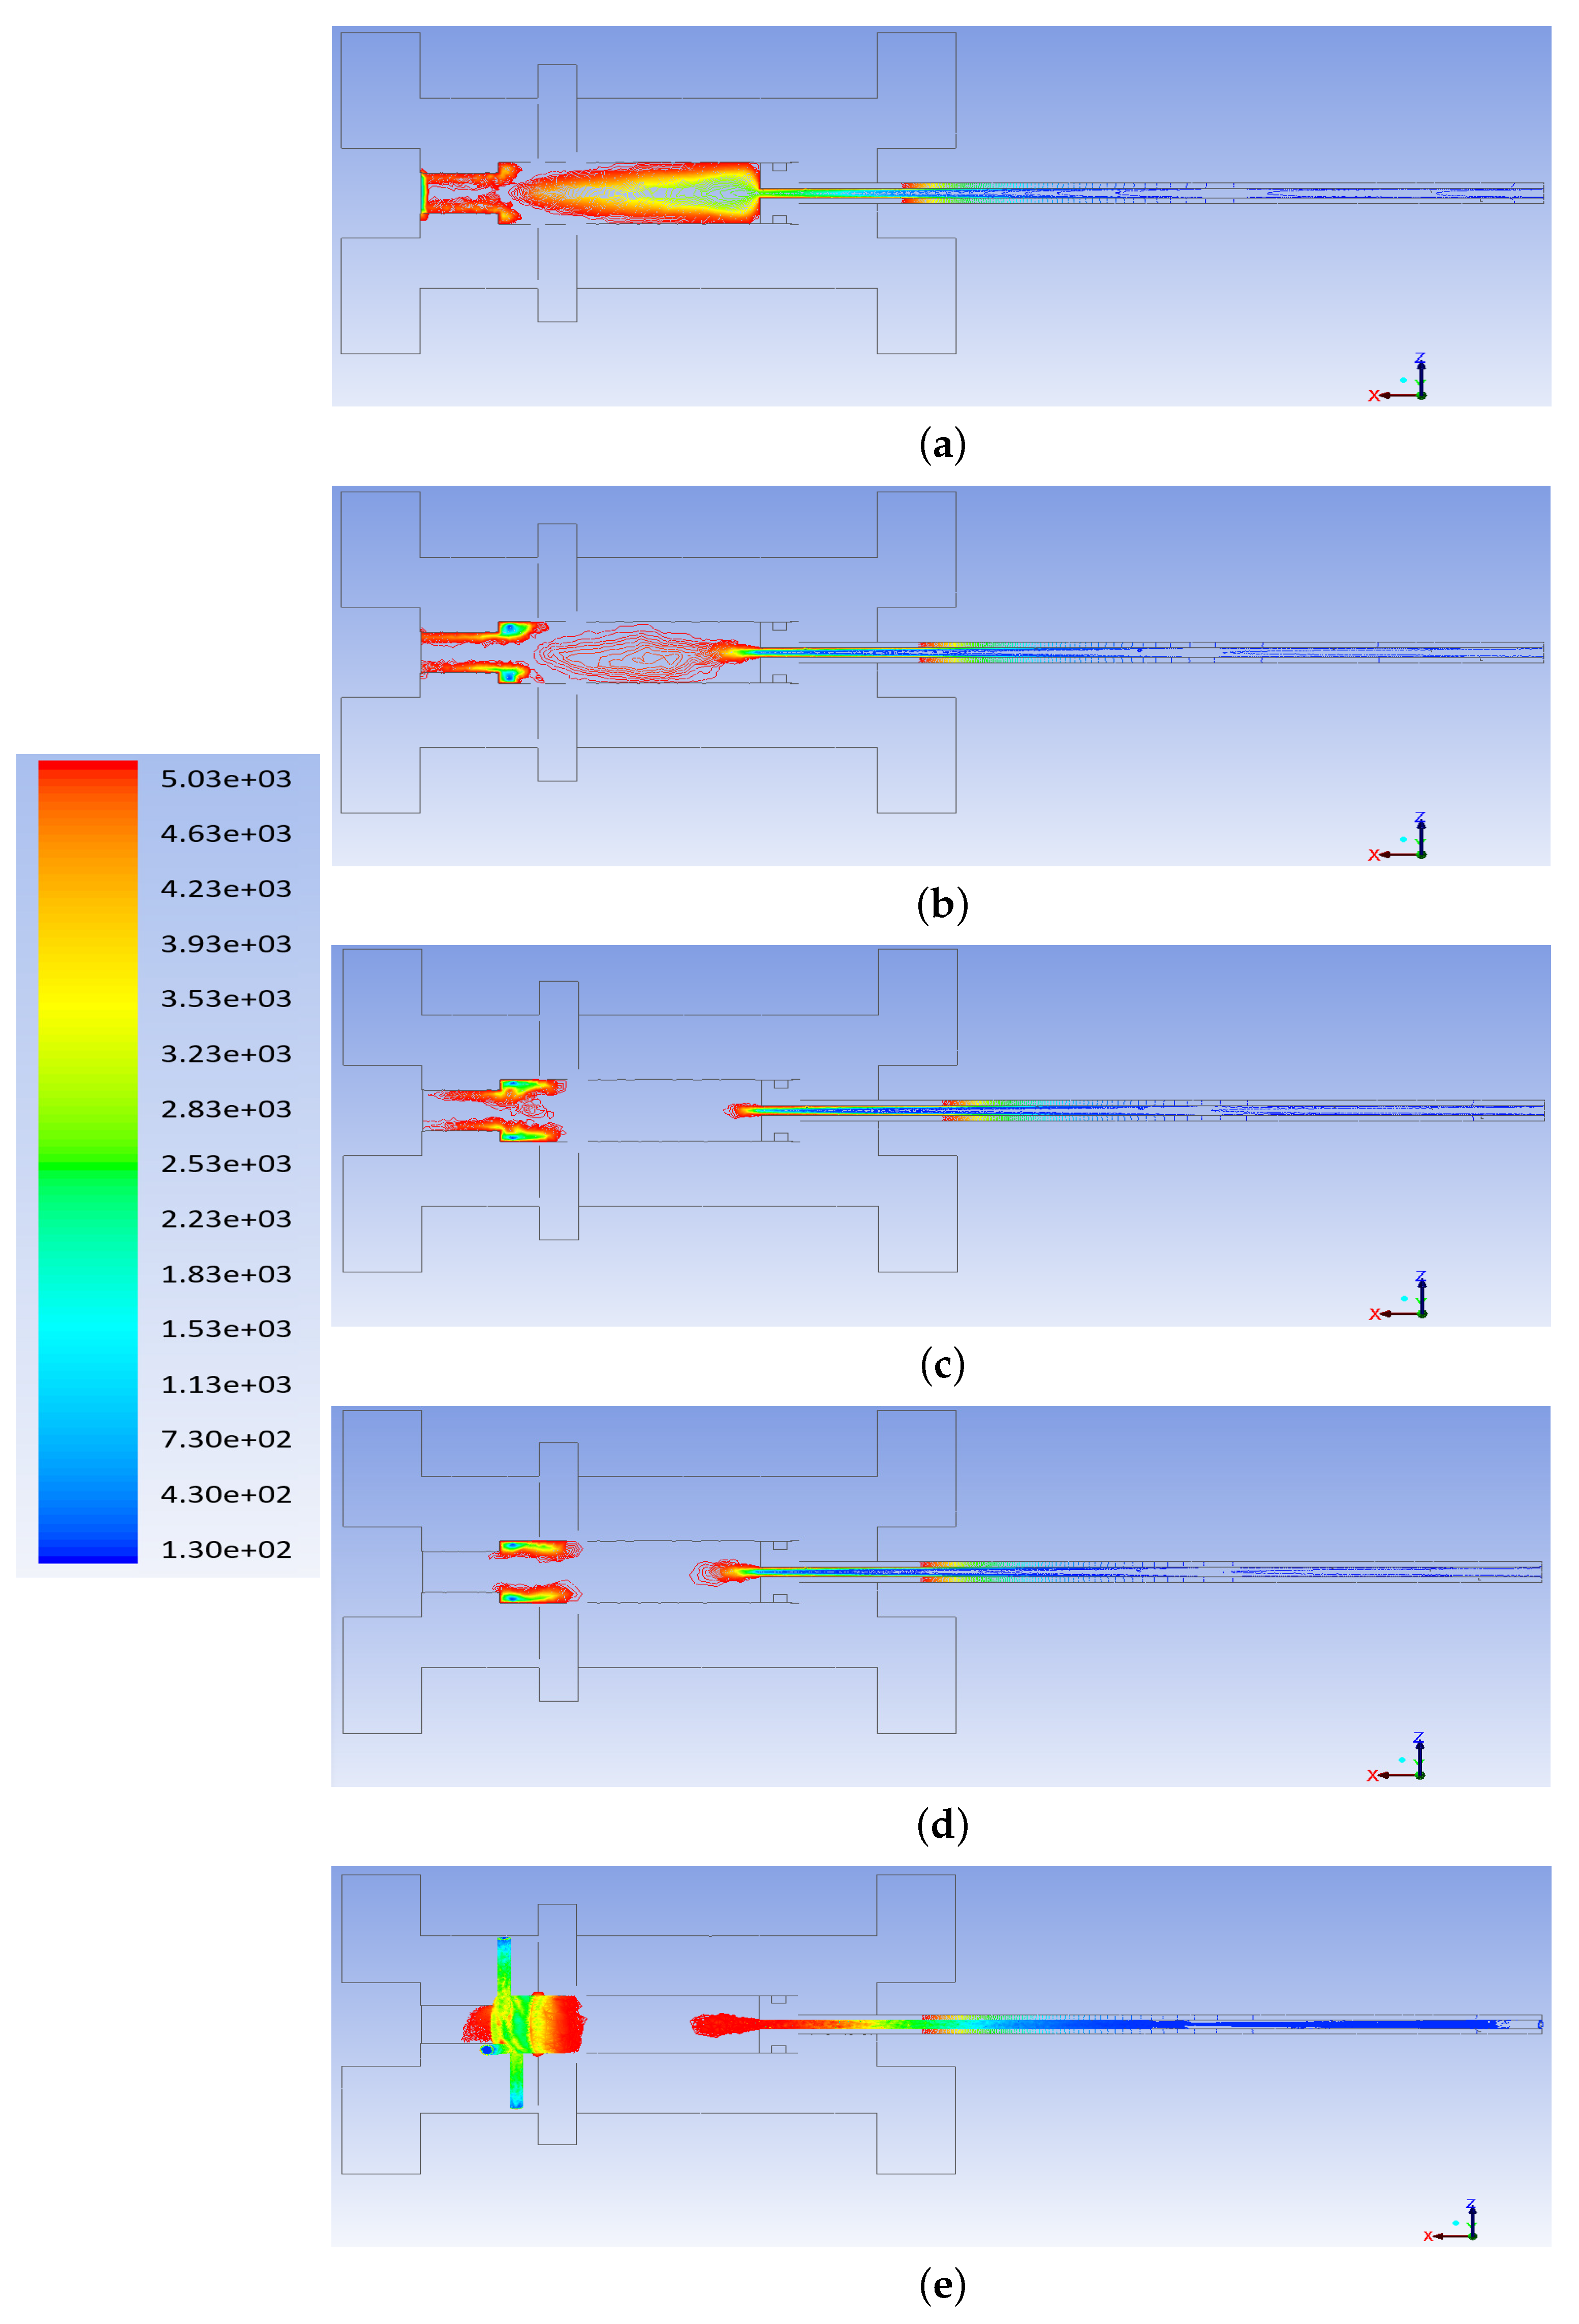
3. Computational Fluid Dynamics Modeling

The obtained results from the experimental analysis enabled us to do further investigation to find the effect of geometry size and configuration of the reformer chamber in increasing the efficiency of the system. A comprehensive multi-physics computational fluid dynamics (CFD) modeling of the cold plasma chamber, where the geometry and inlets of the 3D-GAVR are modified, was conducted on the chamber named as a reverse vortex flow gliding arc reactor (RVF-GA) model [18]. A schematic of the RVF-GA reactor is shown in Figure 8, where it is designed in a way that the preheated air and vaporized fuel can be mixed in a small region of the reactor. The geometry is designed in a way to provide an axial air input at the top of the vessel, which yields to introducing more amount of air to the reaction zone and consequently enable us to investigate an extensive range of O:C ratio. The high voltage electrode and the grounded exhaust nozzle are separated by utilizing a dielectric ring made from boron nitride. The reactants are premixed and entered the cylindrical reaction zone through tangential jets that are assembled within the dielectric ring. The pointed tip of the high voltage electrode, which is located in front of the tangential swirl jets, is region where the gliding arc discharge is initiated. This configuration enables the maximum interaction between the reactant stream and the plasma discharge and also to be the driving force which causes discharge rotation and elongation. The internal volume of the reaction vessel is approximately 0.4 L (with inner diameter of 4.3 cm) and there is a small post-plasma treatment volume, which is essentially a 0.5 inch diameter stainless steel exhaust tube that has the length of approximately 30 inch [18,25,26].
To perform current CFD analysis, a regular personal computer (PC) with Intel(R) Core(TM) i7-4770 CPU, 64-bit operating system was used. Commercial software (ANSYS FLUENT 16) was used to simulate the chamber and study the heat generation and heat transfer inside the chamber. The analysis began by highlighting the exact dimensions and configurations of the chamber shown in Figure 8. Bottom and top cylinder, input and output cap, the ceramic layer and the plunger are considered in the model. Double precision method with four processor parallel solver are applied. The unstructured meshes with physics preference of CFD and solver preference of Fluent was applied on the body, and the accuracy of meshing was checked by a slow transition and high smoothing mode with the total number of 7 × 10 5 elements and 125,000 nodes. The mesh refinement (gradient adaption tool) was applied to improve the mesh quality, by searching for the locations where a mesh refinement would be useful. The goal was to achieve a mesh independent solution which results in the optimal mesh for the solution (Figure 8).
The governing equations of continuity, momentum conservation and energy equation were solved for the model to describe the flow of the fluid inside of the chamber. The continuity equation can be written as follows:
. ( ρ v ) = ρ t
where ρ is the density of the air (1.225 kg/m 3 ), v is the velocity and t is time. The momentum equation (Navier–Stokes equation) for this model takes the following form:
t ( ρ v ) + . ( ρ v v ) = p + . ( τ = ) + ρ g + F
where p is the static pressure, τ = is the stress tensor and ρ g and F are the gravitational body force and external body forces, respectively (where F contains other model-dependent source terms). The stress tensor τ = is given by:
τ = = μ [ ( v + v T ) 2 3 . v I ]
where μ is the molecular viscosity of air, and I is the unit tensor where the viscosity of the air is 1.79 × 10 5 kg/m·s.
The energy model with the viscous model is used, which can be represented as the general form of:
t ( ρ E ) + . ( v ( ρ E + p ) ) = . k e f f T j h j J j + ( τ = e f f . v ) + S h
where k e f f is the thermal conductivity of the air as 0.02 W/mK. The second and third terms on the big parenthesis on right side are species diffusion and viscous dissipation, respectively. h j and J j are sensible enthalpy and diffusion flux, respectively. S h in Equation (14) is the heat of chemical reaction, however, as the preliminary modeling, the chemical reaction is not considered, therefore that value is equal to zero for the purpose of this modeling.
Simulation is performed using the precise boundary conditions. The defined materials are air as the fluid, and the alumina-based-ceramic and Kovar as solids, which are set as the cell zone conditions. The boundary conditions are specified as follows:
  • The flow rate of the axial top inlet port of the air is set around 12.65 SLPM which is applied as an input air.
  • The mixture flow rates are assigned around 12.35 SLPM in total (5 SLPM air, and 7.35 SLPM methane for future modeling), which is divided into the four tangential swirl jets equally. For this modeling, this value is assigned just as the air entering the chamber through the swirl jets.
  • The input power is 550 W and it is set as the input heat flux of the arc which is around 894 kW/m 2 . This heat flux is applied at the two surfaces where the arc is created during the process.
The SIMPLE algorithm is applied and represented by pressure–velocity coupling method under relaxation factors of pressure as 0.3, density as 1, body forces as 1, momentum as 0.7 and energy as 1. The solution of the flow field is presumed to be converged when the continuity and momentum equations residuals reduced to less than 10 6 . Comprehensive convergence tests were done to investigate the time step size.
Figure 9 and Figure 10 show the obtained results for the velocity vectors from simulation in 2D and 3D, respectively, and Figure 11 shows the pressure distribution along the reformer chamber where the created arc has the dimension of 5 mm thickness and it moves by time change. The results show that a reverse vortex flow (RVF) scheme is created which has an outer swirling rotation along with a low pressure area at its center with some component of axial flow where this flow regime is similar to a natural tornado. Due do the smaller size of the exhaust diaphragm compared with the internal diameter of the vessel cylinder, it acts as a barrier which generates vortex flow to reverse direction and flow upwards initially into the cylindrical vessel. This rotational velocity profile can enhance the gas mixtures, and as a result increasing the rate of chemical reaction of methane and oxygen. The Reynolds number is calculated by the average axial velocity near the outlet, where the dimension is similar to a pipe, as follows:
R e = u L ν = 2.5 × 0.03 0.0000156 4800
Figure 12 shows the temperature profile of the gas mixture at different time steps. The profile shows an interesting temperature range around the arc just in front of the tangential swirl jets where the applied heat flux can provide the required temperature for the chemical reaction and as such a catalyst is no longer required for this reaction.
The obtained results of velocity distribution and the temperature profile with respect to position are shown in Figure 13, where the high velocity value is due to the RVF inside of the chamber which creates a turbulent flow behavior of the mixture, and the high temperature value belongs to the applied heat flux. The reversed vortex flow utilizes the uniform temperature and heat flux distribution inside the cylinder, which helps to expedite the chemical reaction and the rate of hydrogen production. Modifying the inlet’s positions will increase the rate of reversed vortex flow, and consequently the uniform power distribution. It is found that the RVF compared with forward vortex flow (FVF) which is described in the previous section can perform more efficiently by minimizing heat losses through the cylindrical vessel walls.
By further improving the simulation model, such as applying the chemical reaction, by species transport and reactions and choosing the mixture material, one can reach the precise amount of hydrogen production for the proposed system as well as improving the heat transfer/storage and consequently an optimized reformer chamber model, which are not in the scope of this study.

4. Conclusions

In this study, the partial oxidation of methane to produce syngas using a novel plasma based reformer named 3D Gliding Arc Vortex Reformer (3D-GAVR) was investigated. The fundamentals of this reformer are based on gliding arc discharge. The tangential input creates a vortex in the plasma zone and an expanded plasma that incorporates entire area between the two electrodes, thus allowing for more efficient reformation than traditional gliding arc structures. The effects of several operational parameters on the methane conversion and the selectivity of products were considered. The gas compositions are collected from the experiments and the calculations for price and production rate of hydrogen are made. The results show that hydrogen can be produced for as low as $ 4.45 per kg with flow rates of around 1 L per minute. The maximum methane conversion percentage that is achieved by this technology is up to 62.38%. Therefore, the suggested reformer can provide a solution that has higher efficiencies at higher flow rates. The non-optimized dimensions of 3D-GAVR is around 7 cm in radius and 15 cm in height with a lot of room for reduction. Hence, further optimization of performance and size, and cascaded performance of multiple reformers can provide an attractive solution for on-site hydrogen generation in H 2 dispensing stations. Consequently, a computational fluid dynamics (CFD) modeling of another innovative cold plasma reformer chamber named a reverse vortex flow gliding arc reactor (RVF-GA), where the geometry and inlets of the 3D-GAVR are modified, was conducted to investigate the effect of geometry size and configuration for efficient performance. In this reformer, an axial air input port is added to the top of the reaction vessel to allow for more air to be introduced into the reaction zone and the premixed reactants can enter the cylindrical reaction zone through tangential jets that are machined within the dielectric ring. The results show that a reverse vortex flow (RVF) scheme is created which has an outer swirling rotation along with a low pressure area at its center with some component of axial flow. In general, this flow scheme is very similar to a natural tornado. The exhaust diaphragm is much smaller than the internal diameter of the vessel cylinder and acts as a barrier that causes vortex flow to reverse direction and initially flow upwards into the cylindrical vessel. The reversed vortex flow utilizes the uniform temperature and heat flux distribution inside the cylinder, and enhances the gas mixtures which helps to expedite the chemical reaction and the rate of hydrogen production compared with forward vortex flow.

Author Contributions

S.S. and L.M. conceived, designed, performed and analyzed the experiments. S.S. also contributed to the computational modeling and analysis. S.S. and L.M. wrote the paper. B.F. contributed to the reagents and materials, and F.H. contributed to providing the computational tools and leading the team.

Acknowledgments

The authors acknowledge financial support from Everette Energy LLC. They would also like to thank Matthew McDonough from Sandia National lab for his helpful advice and useful discussion.

Conflicts of Interest

The authors declare no conflict of interest.

References

  1. Aleknaviciute, I. Plasma Assisted Decomposition of Methane and Propane and Cracking of Liquid Hexadecane. Ph.D. Thesis, Brunel University, Uxbridge, UK, 2014. [Google Scholar]
  2. Tao, X.; Bai, M.; Li, X.; Long, H.; Shang, S.; Yin, Y.; Dai, X. CH4-CO2 reforming by plasma—Challenges and opportunities. Prog. Energy Combust. Sci. 2011, 37, 113–124. [Google Scholar] [CrossRef]
  3. Zhou, Z.; Zhang, J.; Ye, T.; Zhao, P.; Xia, W. Hydrogen production by reforming methane in a corona inducing dielectric barrier discharge and catalyst hybrid reactor. Chin. Sci. Bull. 2011, 56, 2162–2166. [Google Scholar] [CrossRef]
  4. Stambouli, A.B.; Traversa, E. Solid oxide fuel cells (SOFCs): A review of an environmentally clean and efficient source of energy. Renew. Sustain. Energy Rev. 2002, 6, 433–455. [Google Scholar] [CrossRef]
  5. Jiang, W.; Fahimi, B. Multiport power electronic interface-concept, modeling, and design. IEEE Trans. Power Electron. 2011, 26, 1890–1900. [Google Scholar] [CrossRef]
  6. Barelli, L.; Bidini, G.; Gallorini, F.; Ottaviano, A. An energetic–exergetic comparison between PEMFC and SOFC-based micro-CHP systems. Int. J. Hydrog. Energy 2011, 36, 3206–3214. [Google Scholar] [CrossRef]
  7. Gandiglio, M.; Lanzini, A.; Santarelli, M.; Leone, P. Design and optimization of a proton exchange membrane fuel cell CHP system for residential use. Energy Build. 2014, 69, 381–393. [Google Scholar] [CrossRef]
  8. Oh, S.D.; Kim, K.Y.; Oh, S.B.; Kwak, H.Y. Optimal operation of a 1-kW PEMFC-based CHP system for residential applications. Appl. Energy 2012, 95, 93–101. [Google Scholar] [CrossRef]
  9. Arsalis, A.; Nielsen, M.P.; Kær, S.K. Modeling and parametric study of a 1 kW e HT-PEMFC-based residential micro-CHP system. Int. J. Hydrog. Energy 2011, 36, 5010–5020. [Google Scholar] [CrossRef]
  10. Barelli, L.; Ottaviano, A. Solid oxide fuel cell technology coupled with methane dry reforming: A viable option for high efficiency plant with reduced CO2 emissions. Energy 2014, 71, 118–129. [Google Scholar] [CrossRef]
  11. Sreethawong, T.; Thakonpatthanakun, P.; Chavadej, S. Partial oxidation of methane with air for synthesis gas production in a multistage gliding arc discharge system. Int. J. Hydrog. Energy 2007, 32, 1067–1079. [Google Scholar] [CrossRef]
  12. O’Connor, A.M.; Ross, J.R. The effect of O2 addition on the carbon dioxide reforming of methane over Pt/ZrO2 catalysts. Catal. Today 1998, 46, 203–210. [Google Scholar] [CrossRef]
  13. Wang, S.; Lu, G.; Millar, G.J. Carbon dioxide reforming of methane to produce synthesis gas over metal-supported catalysts: State of the art. Energy Fuels 1996, 10, 896–904. [Google Scholar] [CrossRef]
  14. Jing, Q.; Lou, H.; Fei, J.; Hou, Z.; Zheng, X. Syngas production from reforming of methane with CO2 and O2 over Ni/SrO–SiO2 catalysts in a fluidized bed reactor. Int. J. Hydrog. Energy 2004, 29, 1245–1251. [Google Scholar] [CrossRef]
  15. Bharadwaj, S.; Schmidt, L. Catalytic partial oxidation of natural gas to syngas. Fuel Process. Technol. 1995, 42, 109–127. [Google Scholar] [CrossRef]
  16. Odeyemi, O.O. Generation of Hydrogen-Rich Gas Using Non Equilibrium Plasma Discharges. PhD Thesis, Drexel University, Philadelphia, PA, USA, 2013. [Google Scholar]
  17. Petitpas, G.; Rollier, J.D.; Darmon, A.; Gonzalez-Aguilar, J.; Metkemeijer, R.; Fulcheri, L. A comparative study of non-thermal plasma assisted reforming technologies. Int. J. Hydrog. Energy 2007, 32, 2848–2867. [Google Scholar] [CrossRef]
  18. Gallagher, M.J.; Geiger, R.; Polevich, A.; Rabinovich, A.; Gutsol, A.; Fridman, A. On-board plasma-assisted conversion of heavy hydrocarbons into synthesis gas. Fuel 2010, 89, 1187–1192. [Google Scholar] [CrossRef]
  19. Deminsky, M.; Jivotov, V.; Potapkin, B.; Rusanov, V. Plasma-assisted production of hydrogen from hydrocarbons. Pure Appl. Chem. 2002, 74, 413–418. [Google Scholar] [CrossRef]
  20. Aleknaviciute, I.; Karayiannis, T.; Collins, M.; Xanthos, C. Towards clean and sustainable distributed energy system: The potential of integrated PEMFC-CHP. Int. J. Low-Carbon Technol. 2016, 11, 296–304. [Google Scholar] [CrossRef]
  21. Giddey, S.; Badwal, S.; Kulkarni, A.; Munnings, C. A comprehensive review of direct carbon fuel cell technology. Prog. Energy Combust. Sci. 2012, 38, 360–399. [Google Scholar] [CrossRef]
  22. Czernichowski, A. GlidArc assisted preparation of the synthesis gas from natural and waste hydrocarbons gases. Oil Gas Sci. Technol. 2001, 56, 181–198. [Google Scholar] [CrossRef]
  23. Diatczyk, J.; Komarzyniec, G.; Stryczewska, H. Power consumption of gliding arc discharge plasma reactor. Int. J. Plasma Environ. Sci. Technol. 2011, 5, 12–16. [Google Scholar]
  24. Bonner, B. Current Hydrogen Cost. Available online: https://www.hydrogen.energy.gov/pdfs/htac_oct13_10_bonner.pdf (accessed on 26 April 2018).
  25. Gutsol, A.; Bakken, J. A new vortex method of plasma insulation and explanation of the Ranque effect. J. Phys. D Appl. Phys. 1998, 31, 704. [Google Scholar] [CrossRef]
  26. Gutsol, A.; Larjo, J.; Hernberg, R. Comparative calorimetric study of ICP generator with forward-vortex and reverse-vortex stabilization. Plasma Chem. Plasma Process. 2002, 22, 351–369. [Google Scholar] [CrossRef]
Figure 1. (a) Geometry of 3D-GAVR prototype; (b) CSA of 3D-GAVR; (c) top view 3D-GAVR; and (d) side view 3D-GAVR.
Fluids 03 00031 g001
Figure 2. 3D-GAVR operation.
Fluids 03 00031 g002
Figure 3. (a) Test setup; and (b) system lock diagram of setup.
Fluids 03 00031 g003
Figure 4. GC compositions percentage.
Fluids 03 00031 g004
Figure 5. Change is cost of hydrogen with total flow and input power.
Fluids 03 00031 g005
Figure 6. (a) Variance of cost per kg of generated H 2 ; and (b) variance of Flow rate of generated H 2 with Air:Methane ratio.
Fluids 03 00031 g006
Figure 7. Performance parameters and comparison of 3DGAVR: (a) conversion rate; (b) efficiency; and (c) specific energy requirement. Reproduced with permission from [17].
Fluids 03 00031 g007
Figure 8. (a) The modified cold plasma chamber setup; and (b) geometry and meshed model in ANSYS FLUENT.
Fluids 03 00031 g008
Figure 9. Velocity vectors of the gas mixture (m/s).
Fluids 03 00031 g009
Figure 10. Velocity vectors of the gas mixture (m/s).
Fluids 03 00031 g010
Figure 11. Pressure distribution (Pascal).
Fluids 03 00031 g011
Figure 12. Temperature profile of the gas mixture: (a) contours of static temperature (K) at iteration #1; (b) contours of static temperature (K) at iteration #25; (c) contours of static temperature (K) at iteration #50; (d) contours of static temperature (K) at iteration #100–1000; and (e) contours of total temperature (K) at iteration #1000.
Fluids 03 00031 g012
Figure 13. Velocity–temperature profile vs. position.
Fluids 03 00031 g013
Table 1. Experimentally obtained parameters.
CH 4 Flow (L/min)Air Flow (L/min)VI%CH 4 %CO%CO 2 %H 2
4.16710120.10.923.881.870.354.99
Table 2. Experimental results—constant flow rate ratio of 2.4:1, where price per ccf of methane psia = $0.366 and Price per kWh of electricity = $0.09.
CH 4 (L/min)Air (L/min)Total FlowPower%CH 4 %CO%CO 2 %H 2 $ kg H 2 ( L min ) L kWh H 2 CH 4 RatioCH 4 %conv.
1.53.65.167.4524.962.160.276.278.540.32282.450.25&8.86
1.53.65.183.02920.193.780.539.885.310.56404.170.4917.62
1.53.65.198.921.653.100.418.307.070.46277.640.3813.96
1.53.65.1155.9319.203.750.639.257.680.54209.640.4818.55
1.8754.56.37567.4522.912.560.416.676.950.45397.620.2911.46
1.8754.56.37516418.514.110.7410.276.190.76278.890.5520.75
1.8754.56.375138.816.335.871.507.078.300.52223.680.4331.09
2.255.47.65108.0921.263.080.518.086.180.68375.480.3814.45
2.255.47.65127.420.453.350.598.666.100.74347.840.4216.17
2.255.47.65148.5120.143.590.659.176.200.78316.520.4617.38
2.255.47.65153.619.333.940.7310.185.600.88344.840.5319.46
2.255.47.65156.619.143.960.7410.155.640.89339.310.5319.72
2.255.47.6516418.904.080.7710.505.560.92336.680.5620.43
2.255.47.65134.5515.484.071.108.395.470.85377.140.5425.04
2.6256.38.92516418.864.230.8410.635.111.08394.840.5621.18
2.6256.38.925137.1615.494.391.208.964.911.03451.490.5826.52
37.210.2138.813.574.361.355.207.330.75323.690.3829.61
3.75912.7567.4525.491.420.293.8110.480.49431.760.156.29
4.1671014.167108.0922.722.220.495.327.700.81447.170.2310.64
Table 3. Results of experimental modeling, where price per ccf of methane psia = $0.366 and price per kWh of electricity = $0.09.
CH 4 (L/min)Air (L/min)VI%CH 4 %CO%CO 2 %H 2 $ kg H 2 ( L min ) H 2 CH 4 CH 4 %conv.
2.6258.167.92.026.065.783.576.954.621.101.156.68
2.6258.167.92.025.716.003.647.204.451.141.2662.83
2.6257.367.92.0211.714.681.778.034.711.070.6935.52
2.6257.367.92.0211.514.781.858.054.701.080.7036.56
2.6257.367.92.0211.394.881.898.184.631.090.7237.27
2.6256.367.92.0215.274.451.258.984.871.040.5927.19
2.6256.367.92.0215.494.391.208.964.911.030.5826.52
2.6256.367.92.0215.584.341.188.884.961.020.5726.17

