Evaluation of Interfacial Heat Transfer Models for Flashing Flow with Two-Fluid CFD

Abstract
:1. Introduction
2. Theories and Analytical Solutions
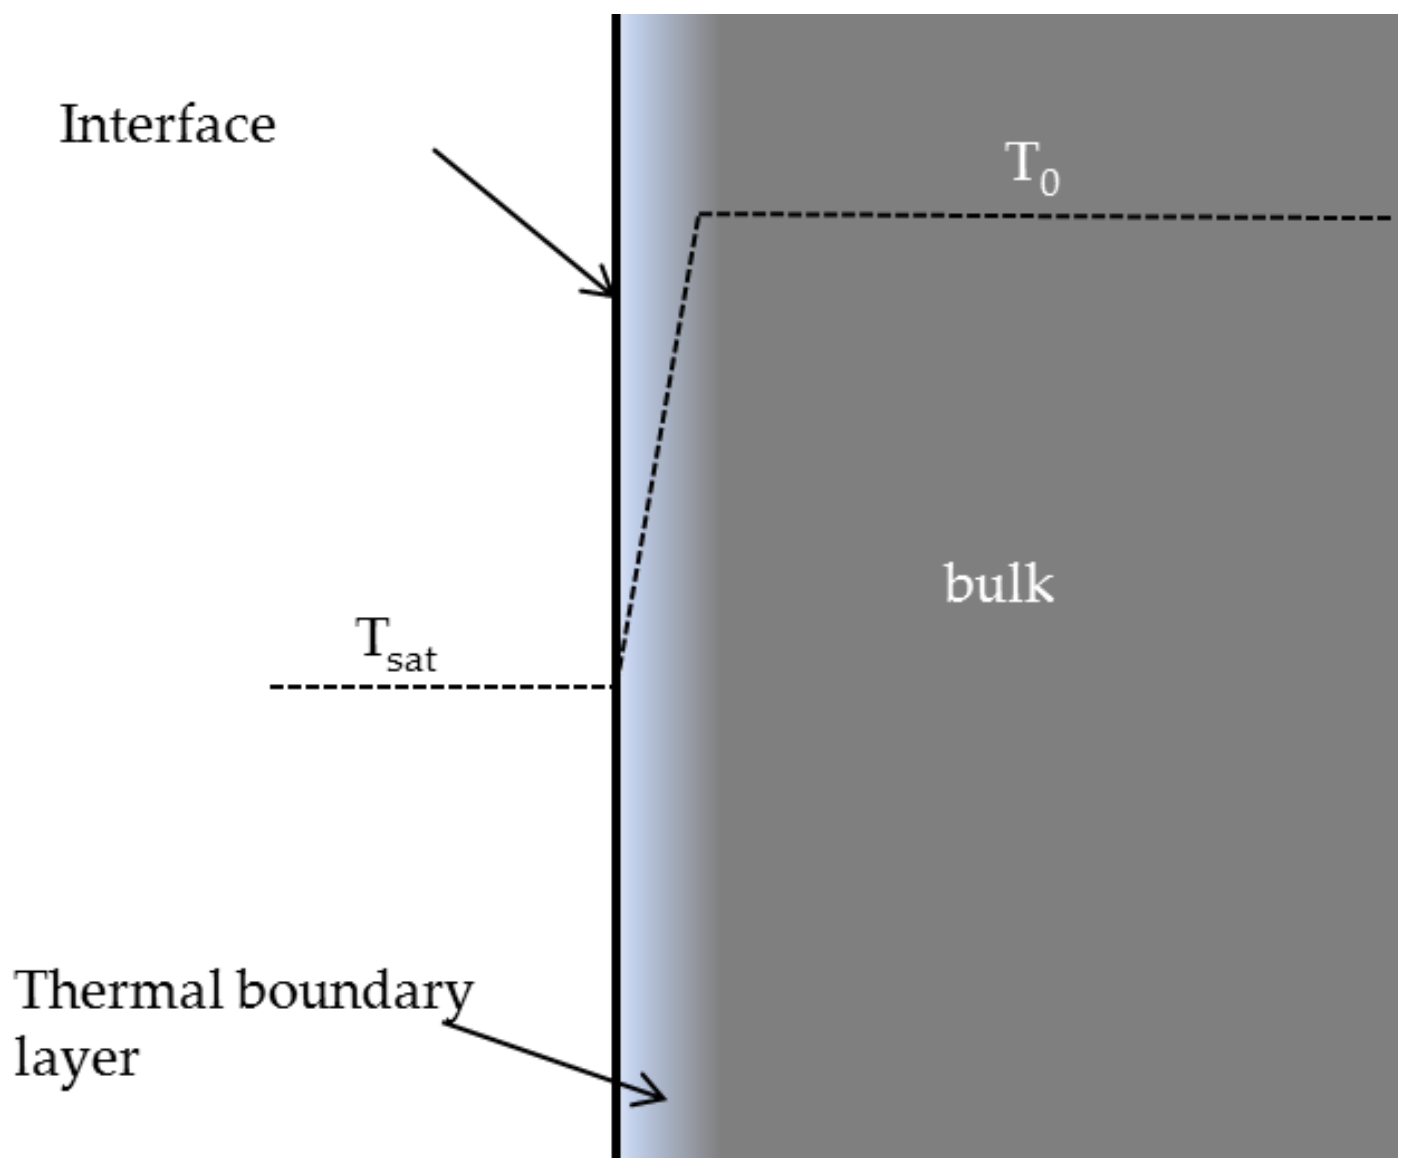
2.1. Conduction
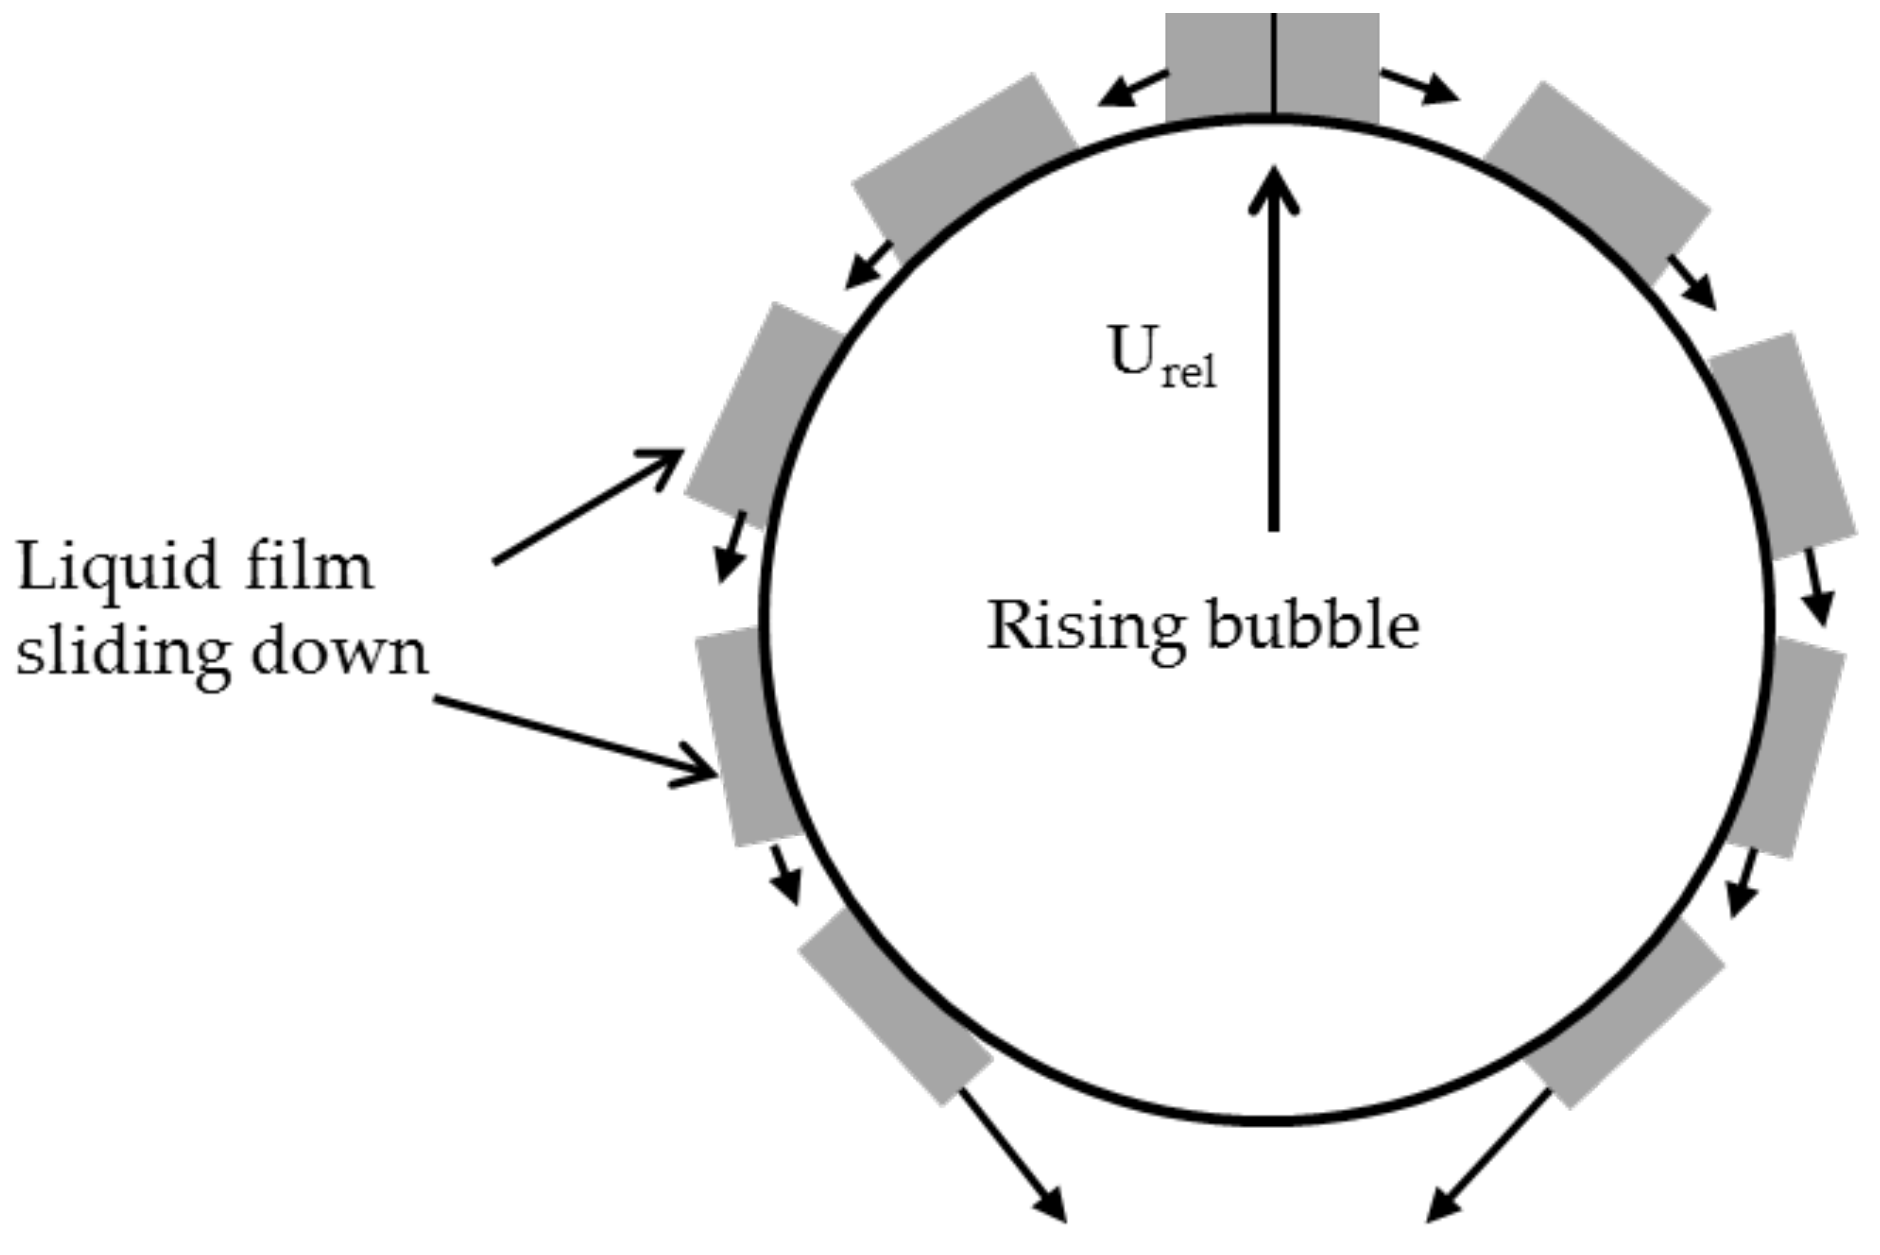
2.2. Convection
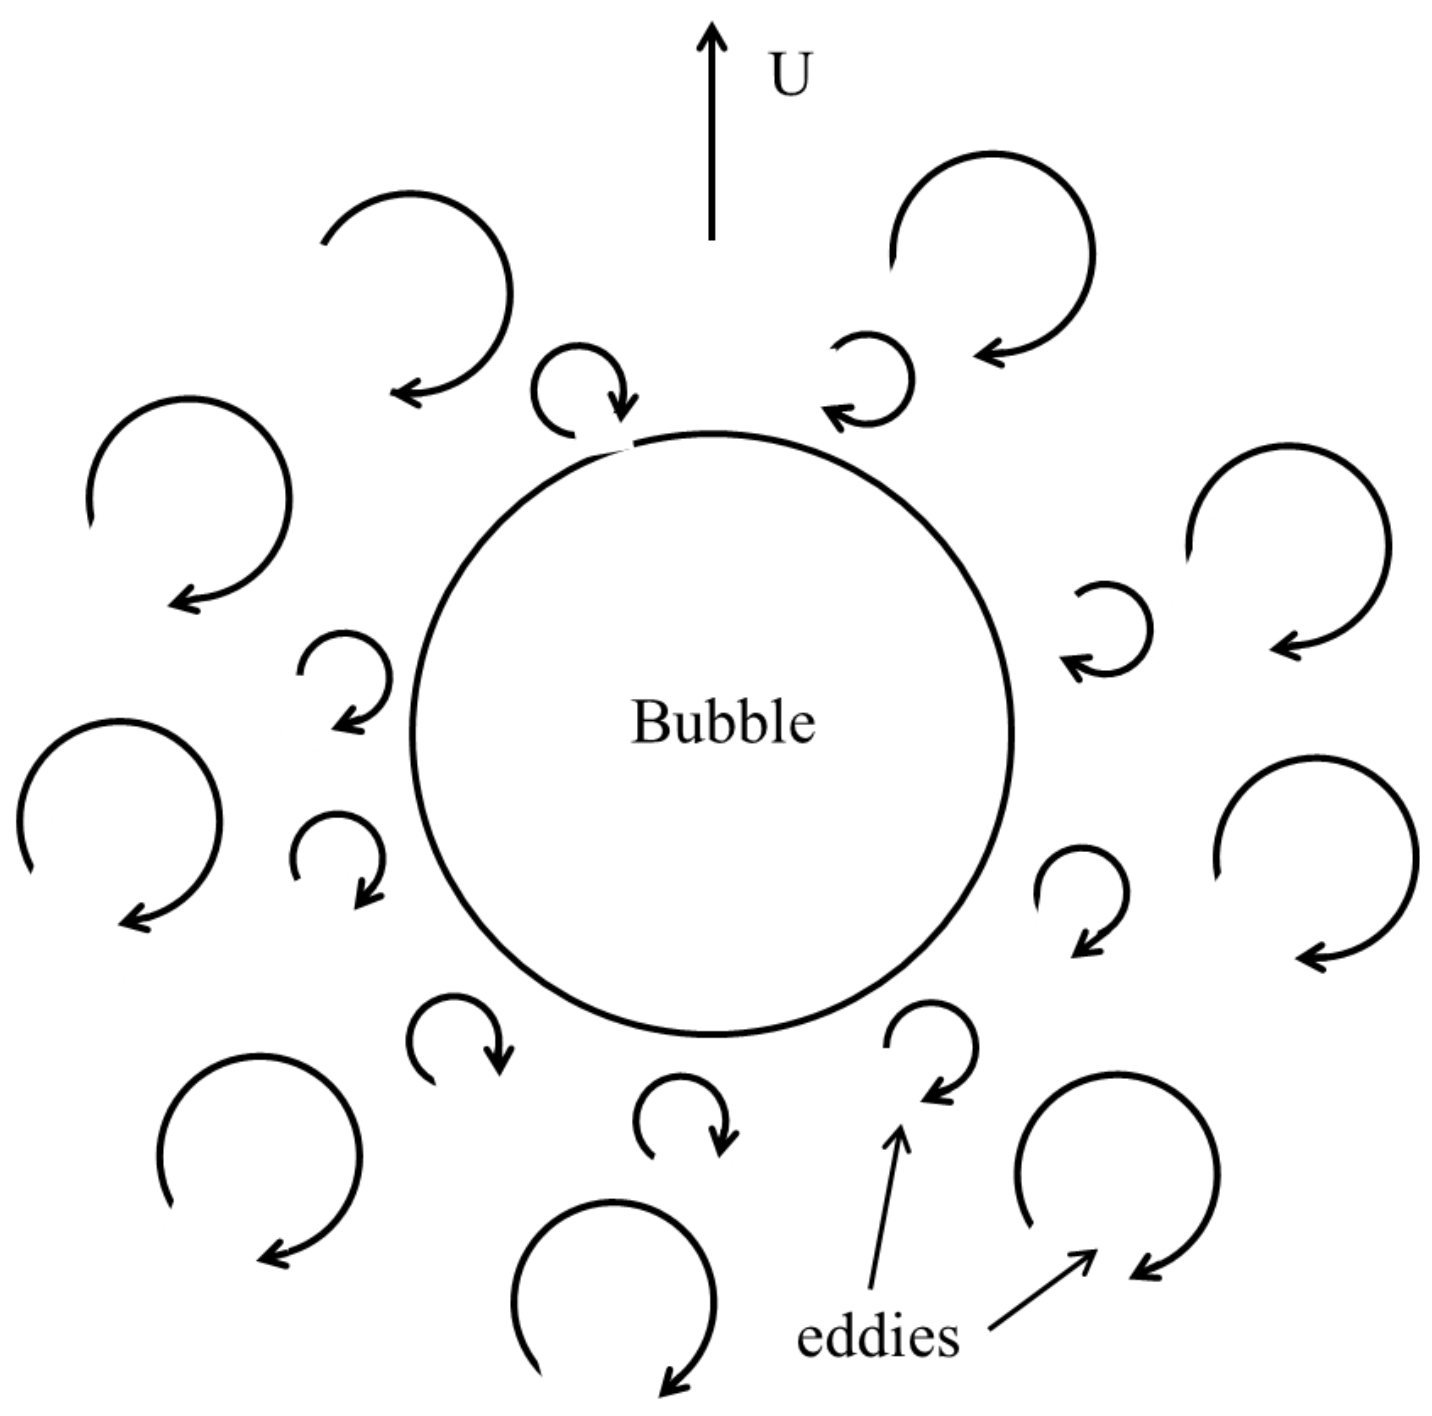
2.3. Effect of Turbulence
3. Empirical Correlations
4. CFD Simulation of Bubble Growth in Superheated Liquid
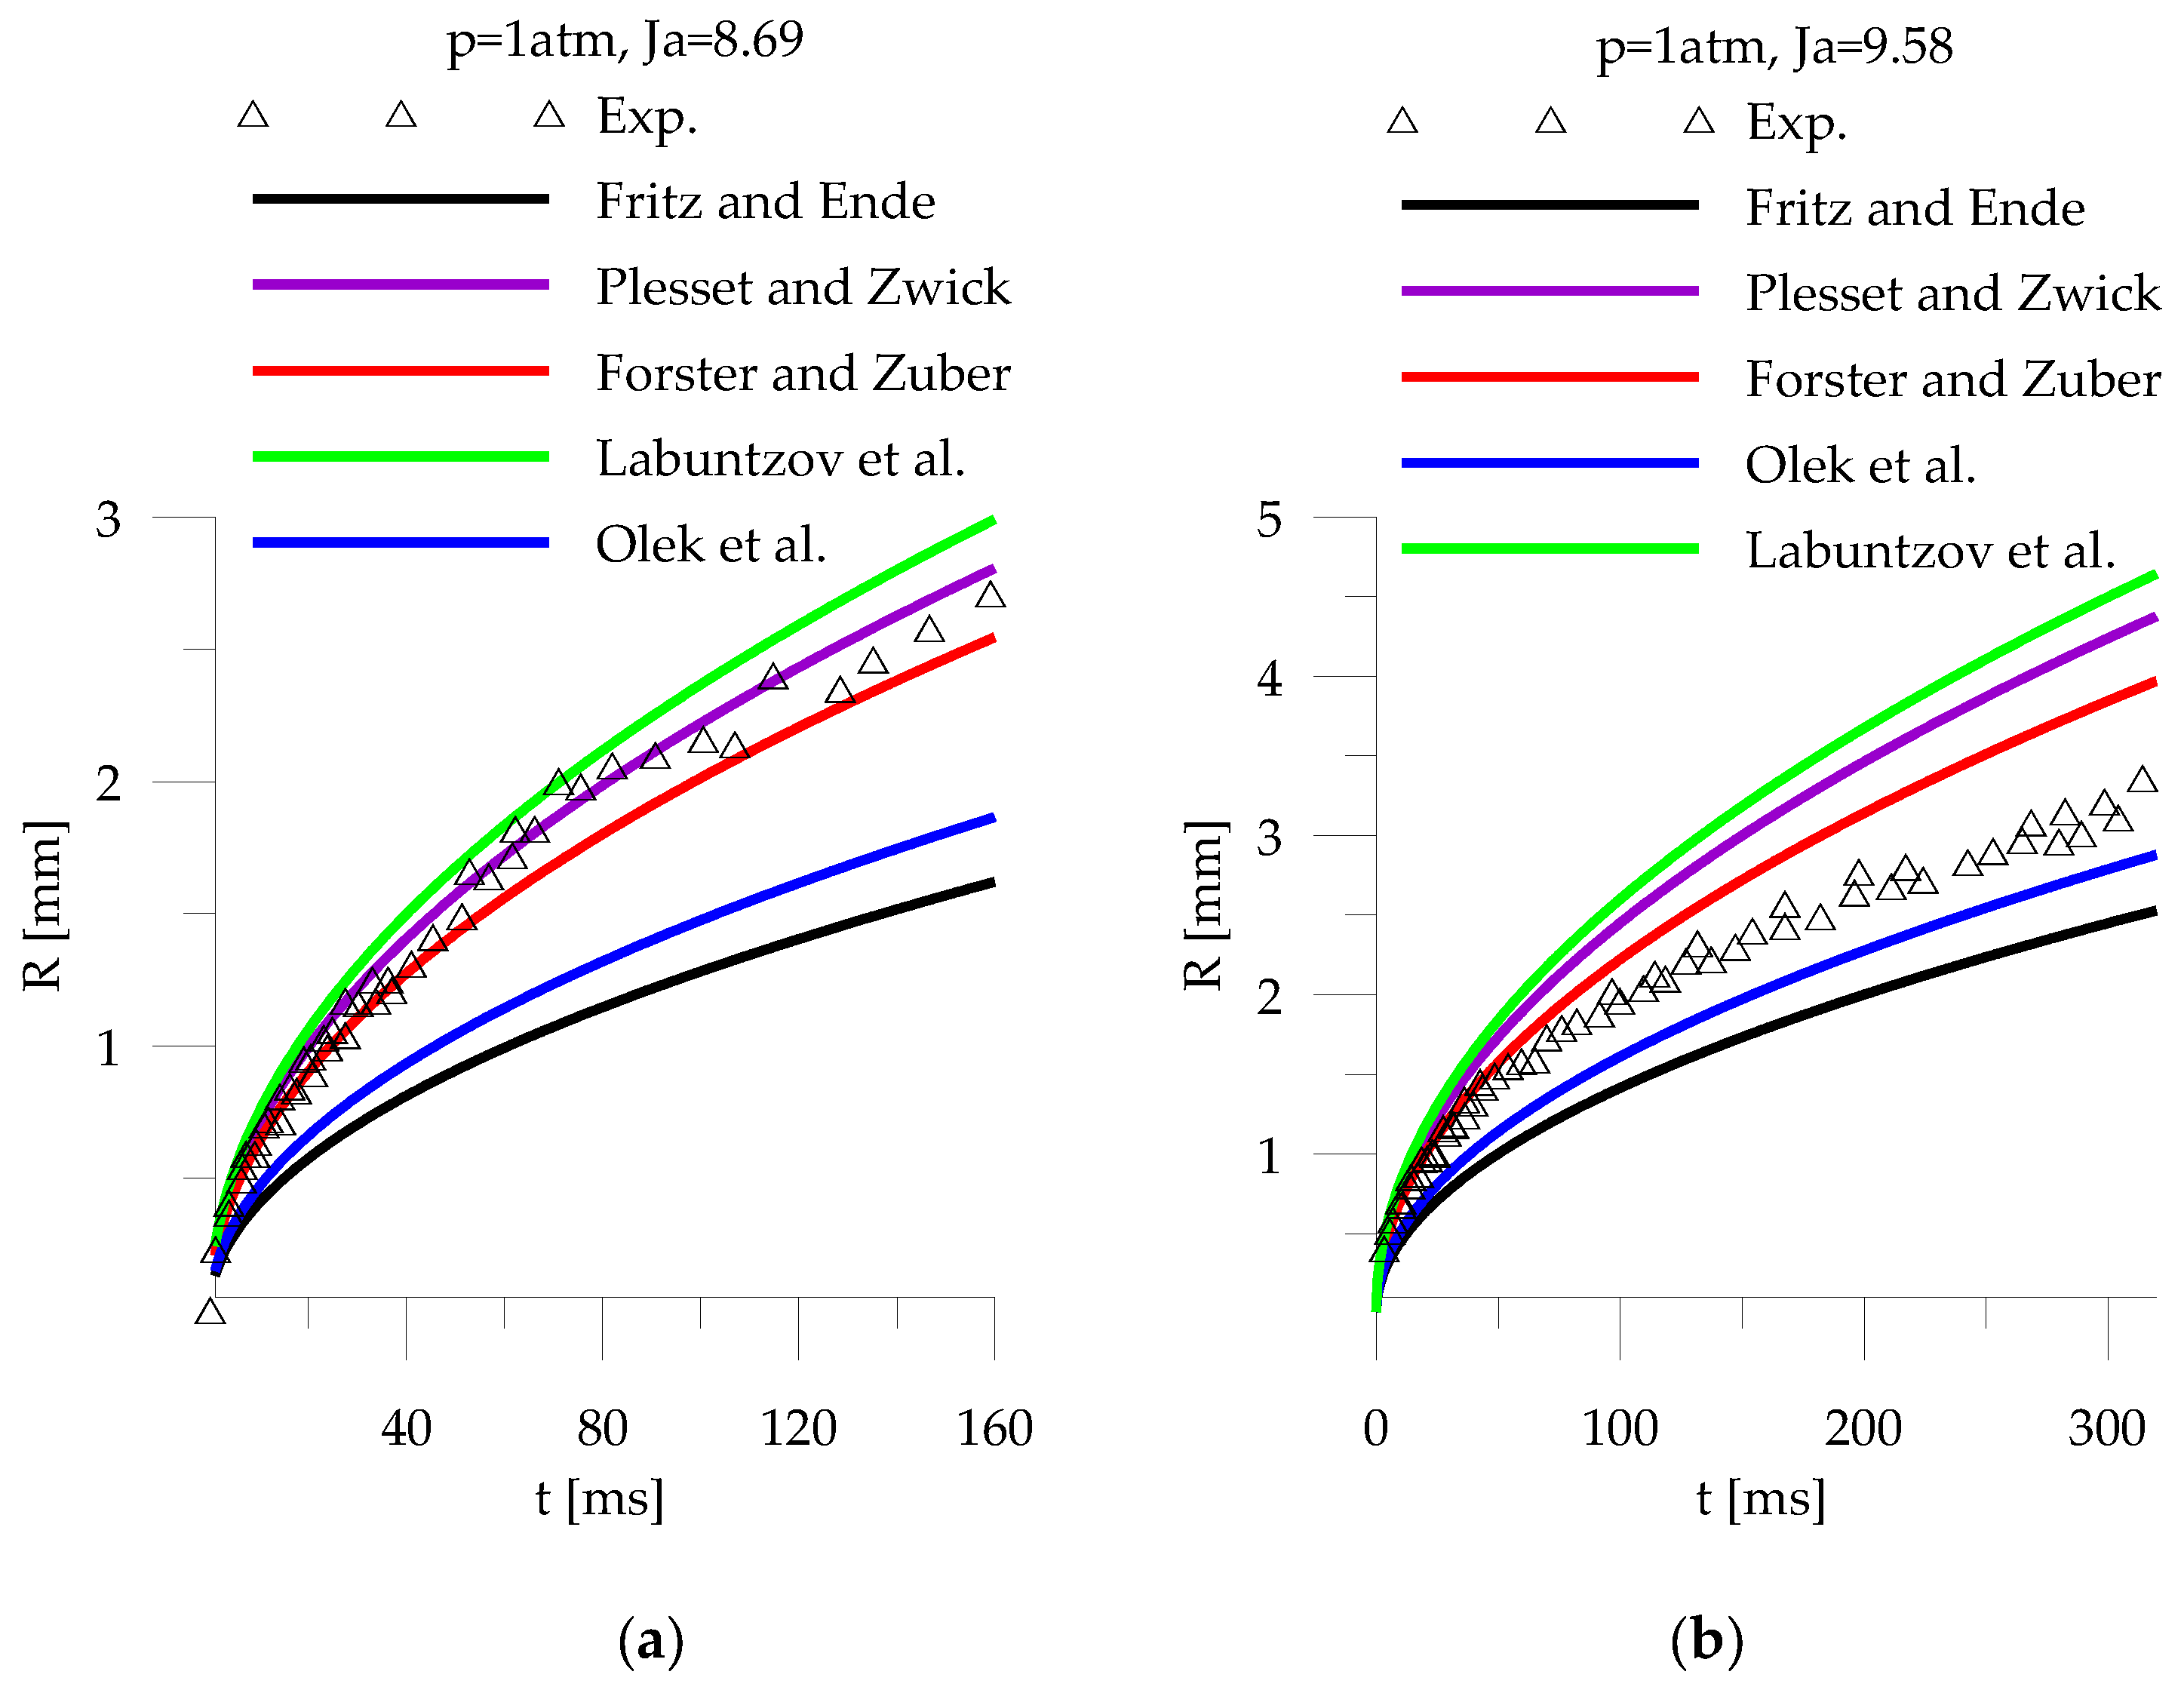
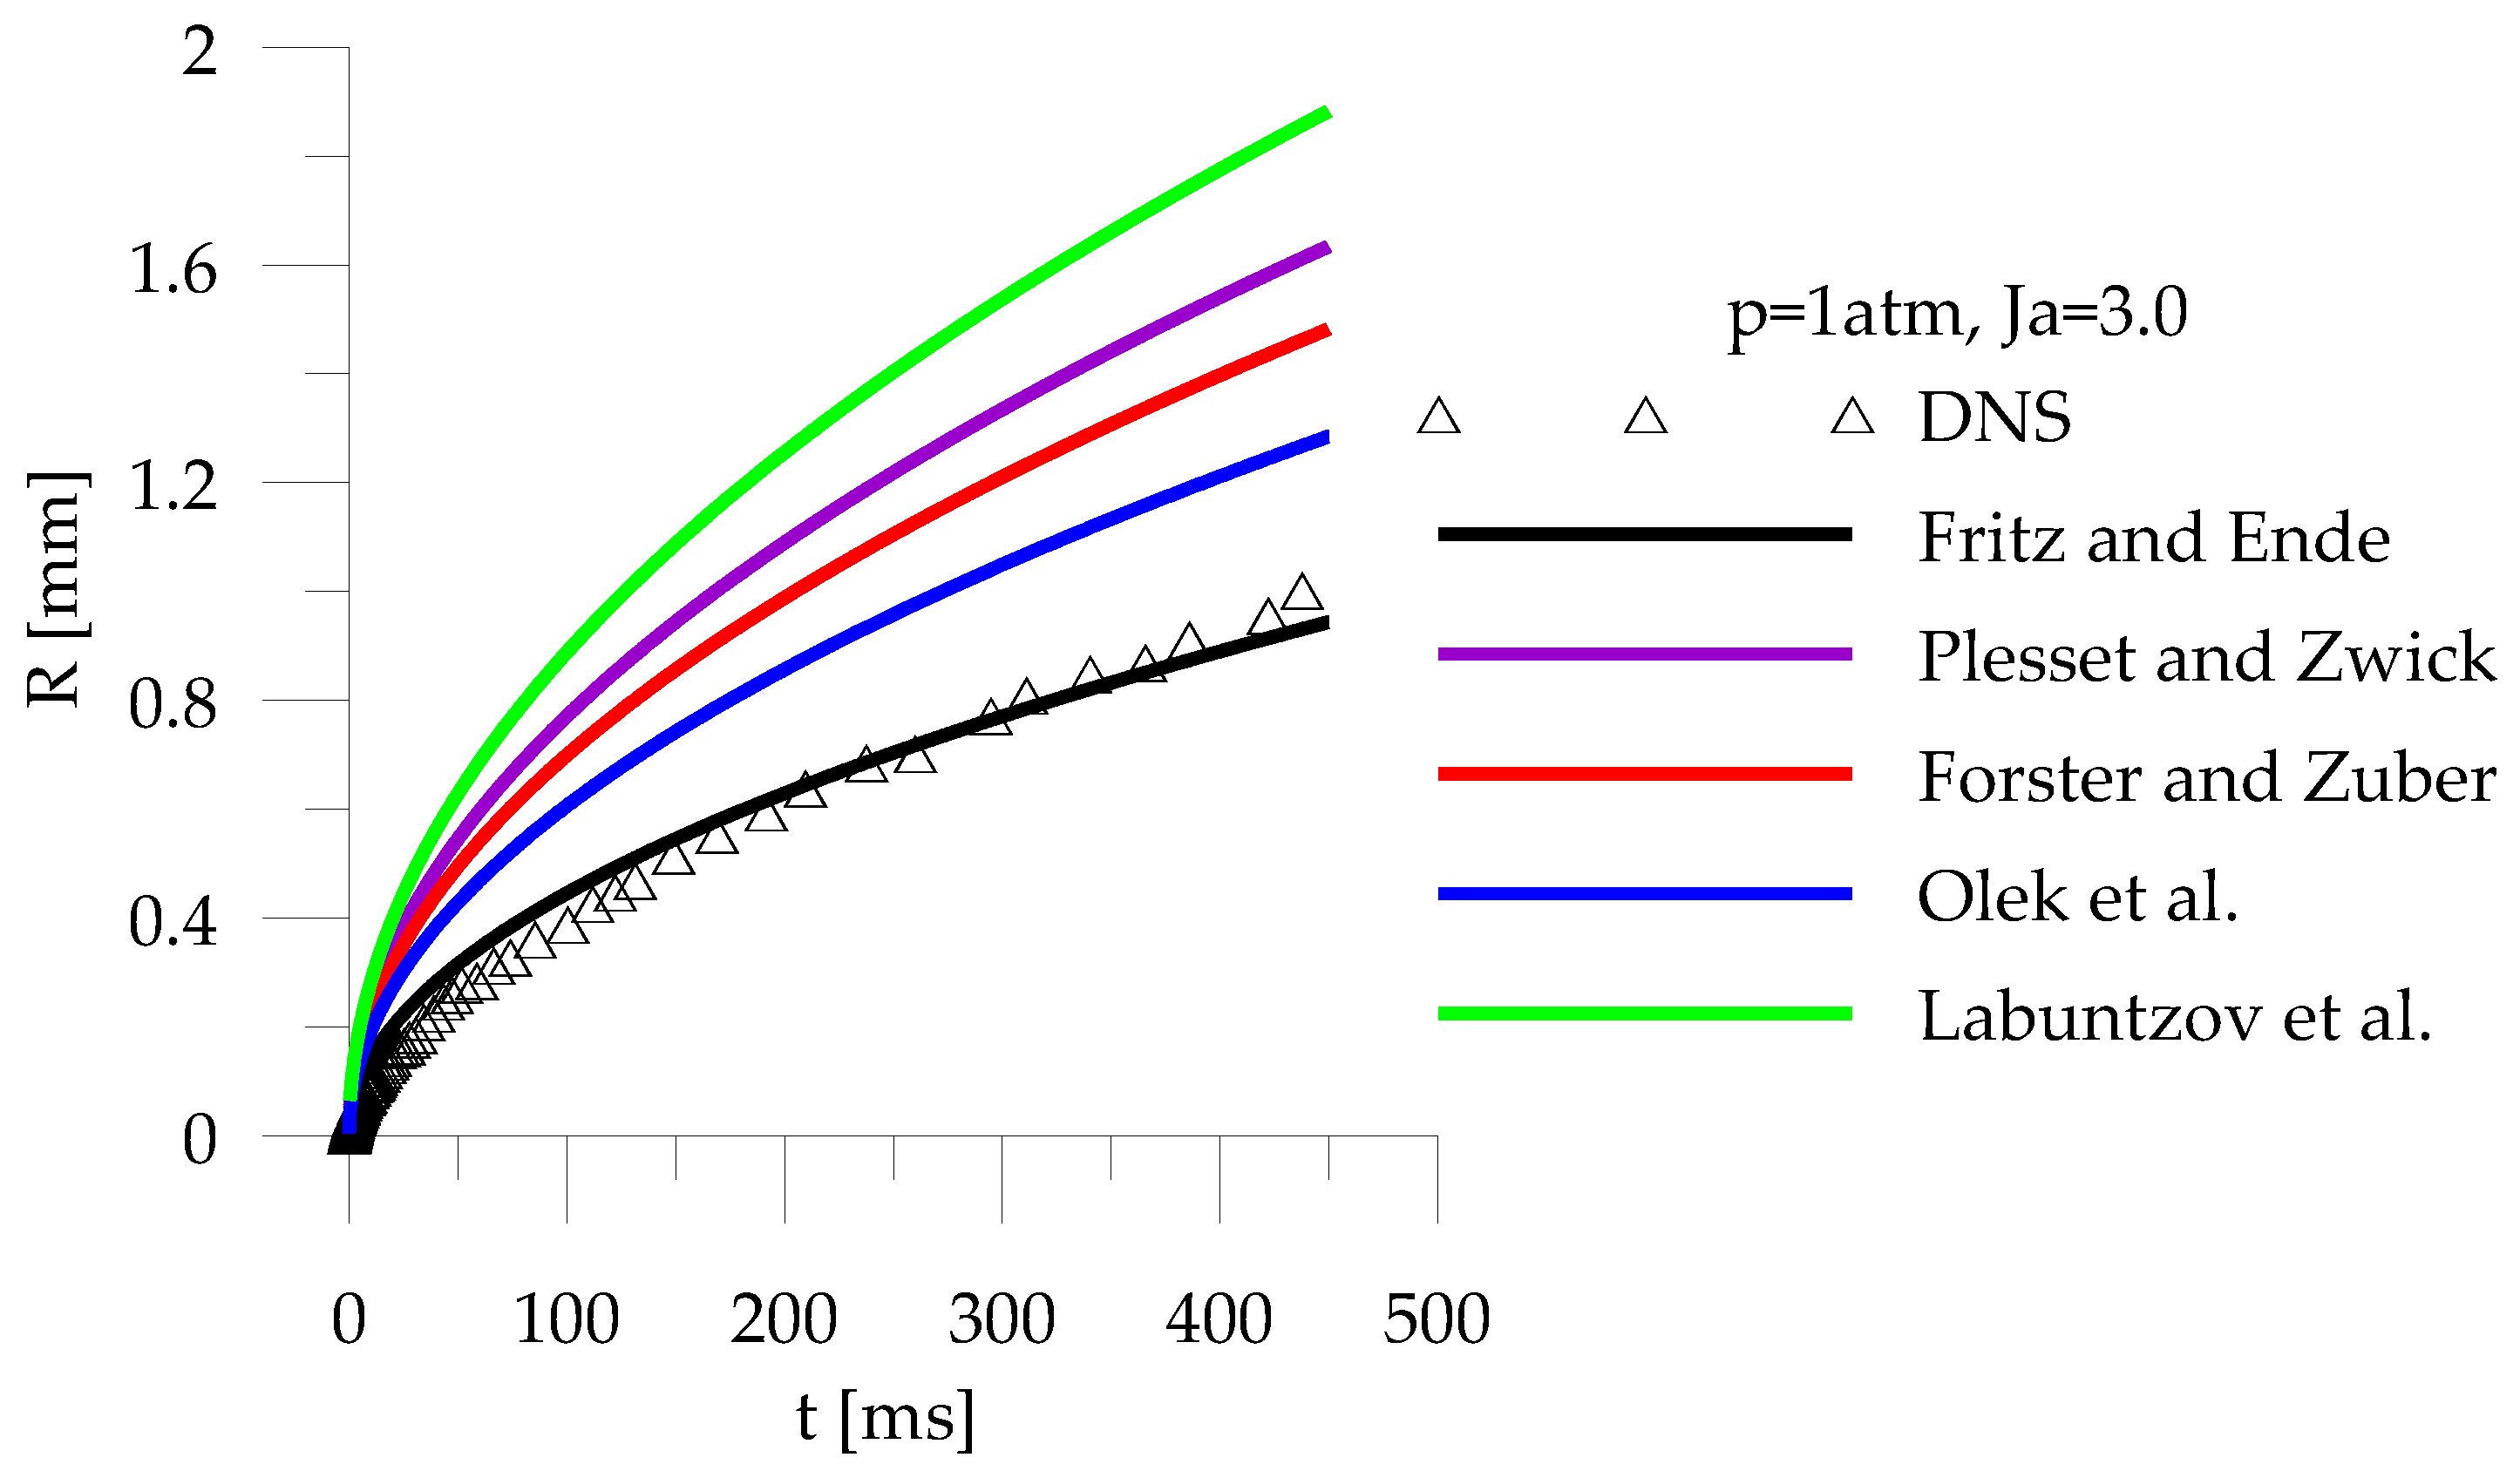
4.1. Stationary Bubble Growth
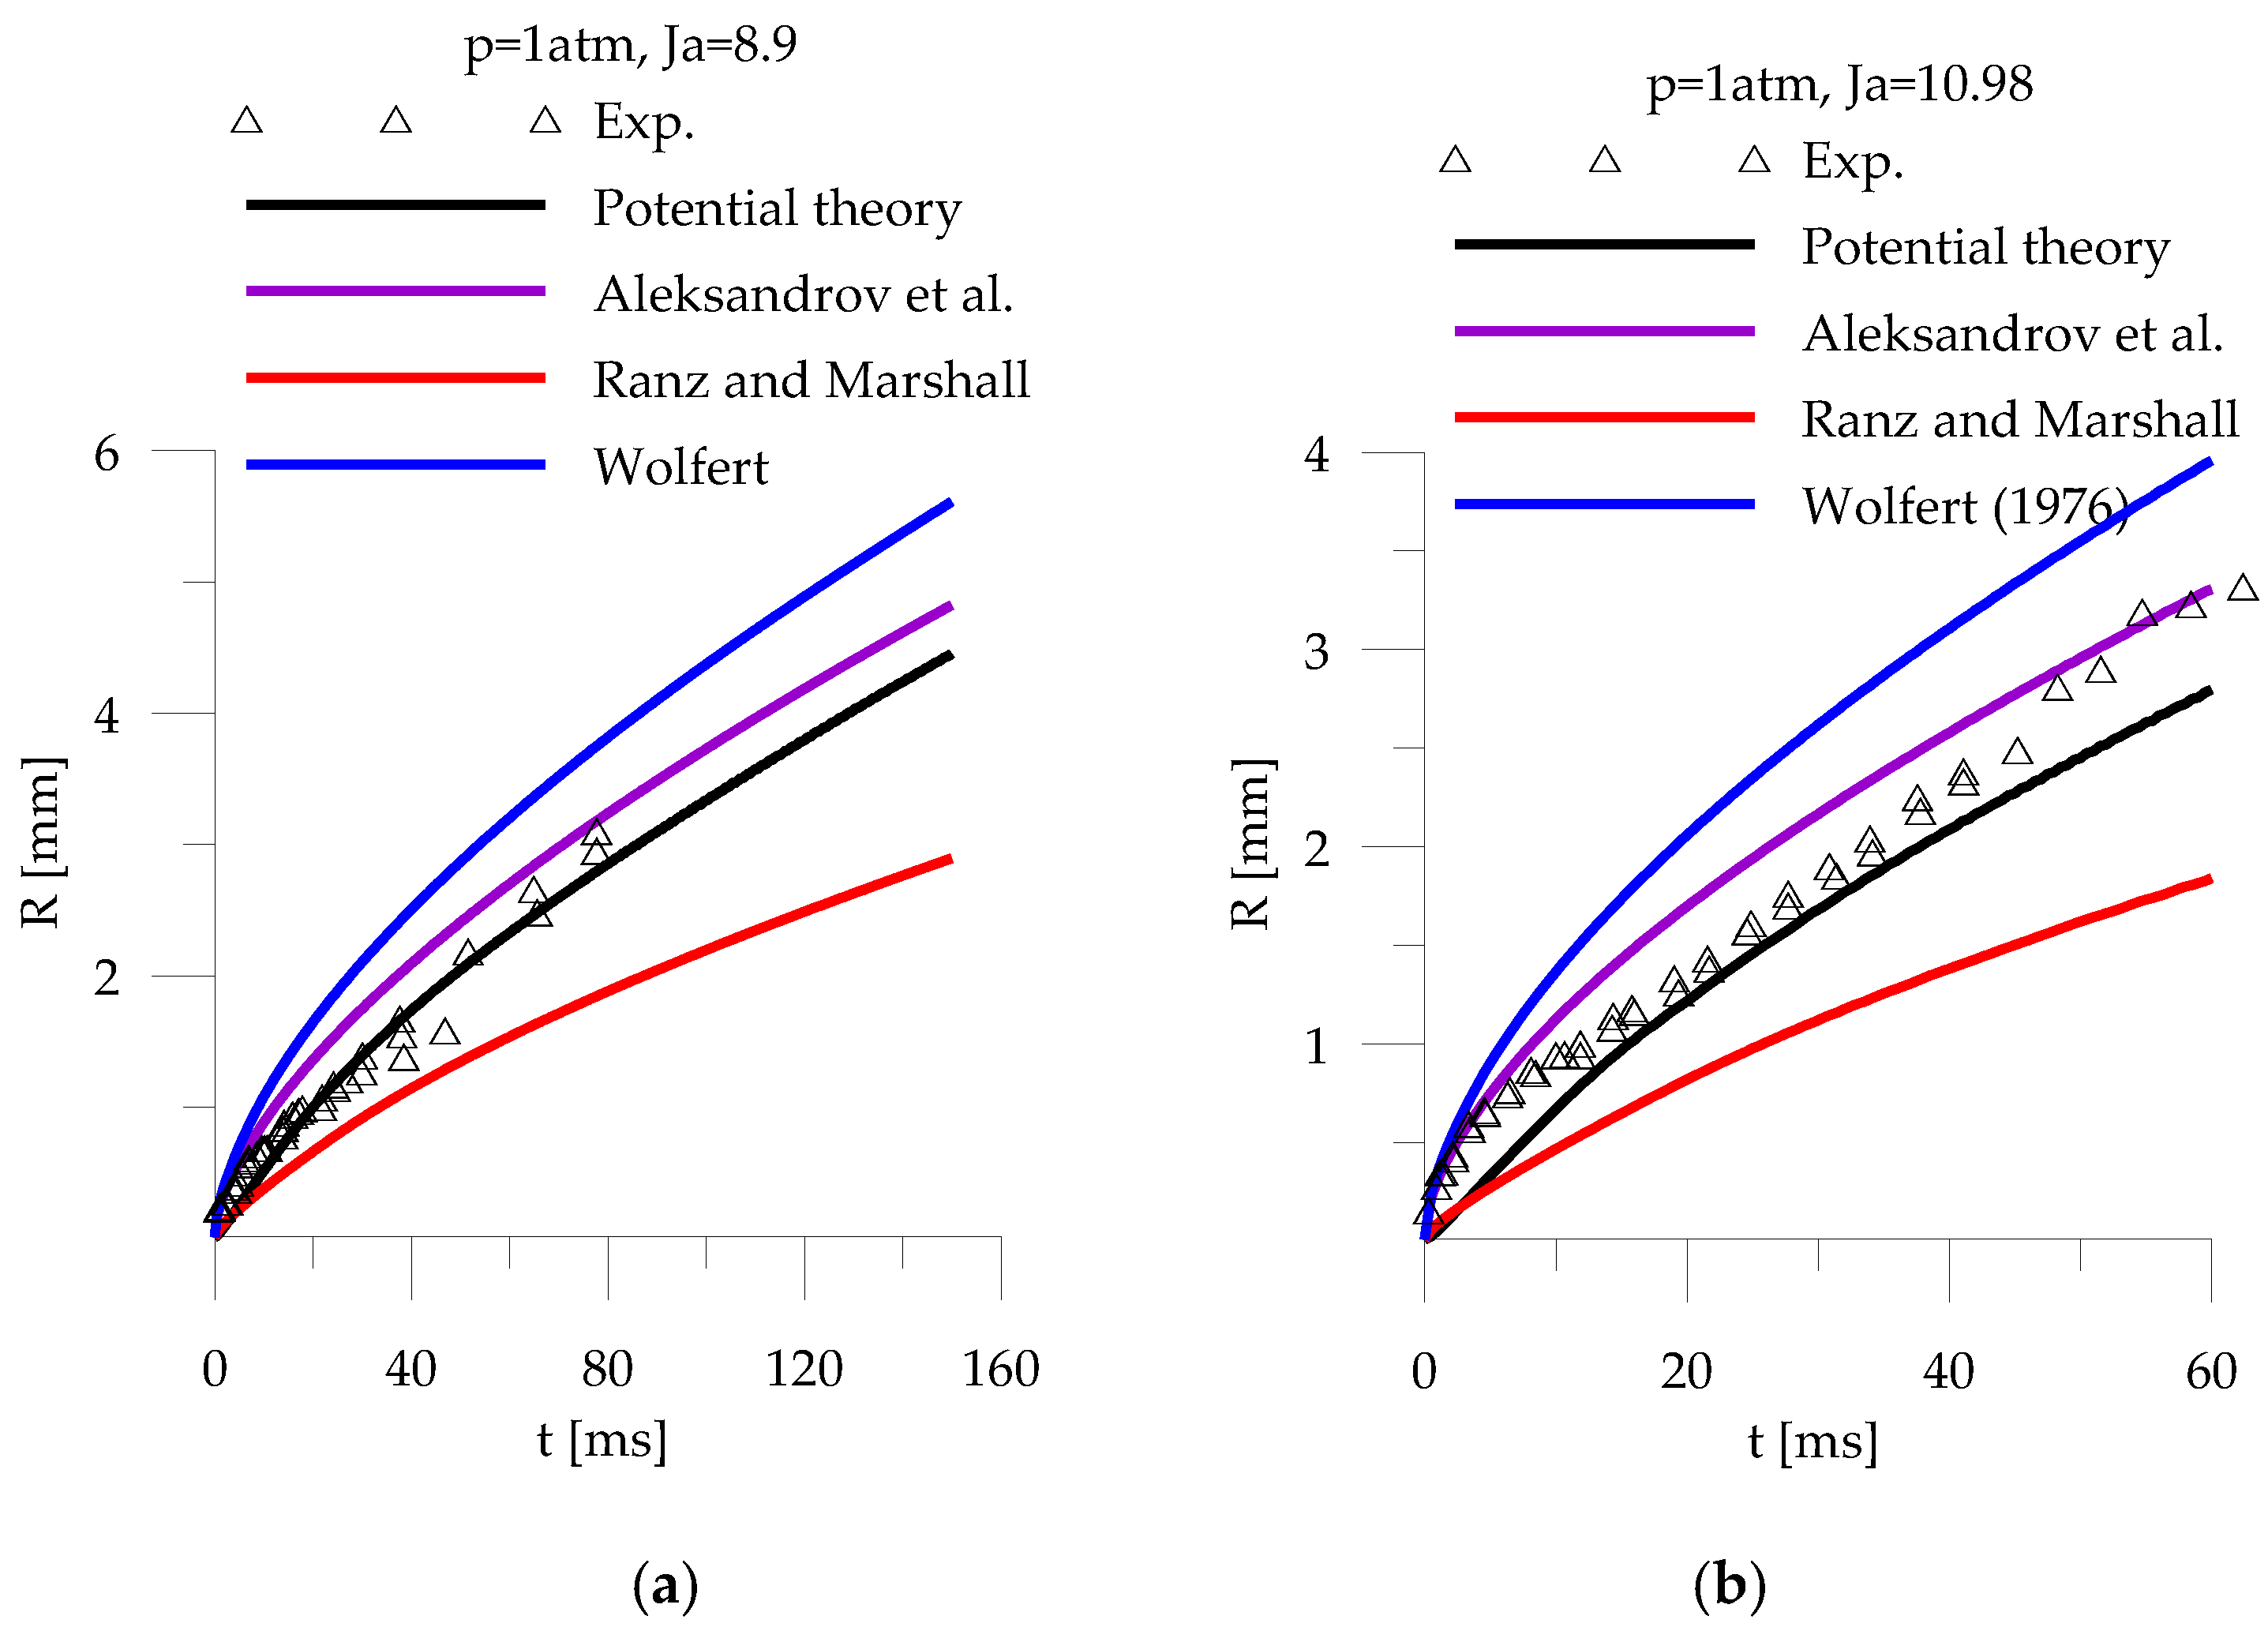
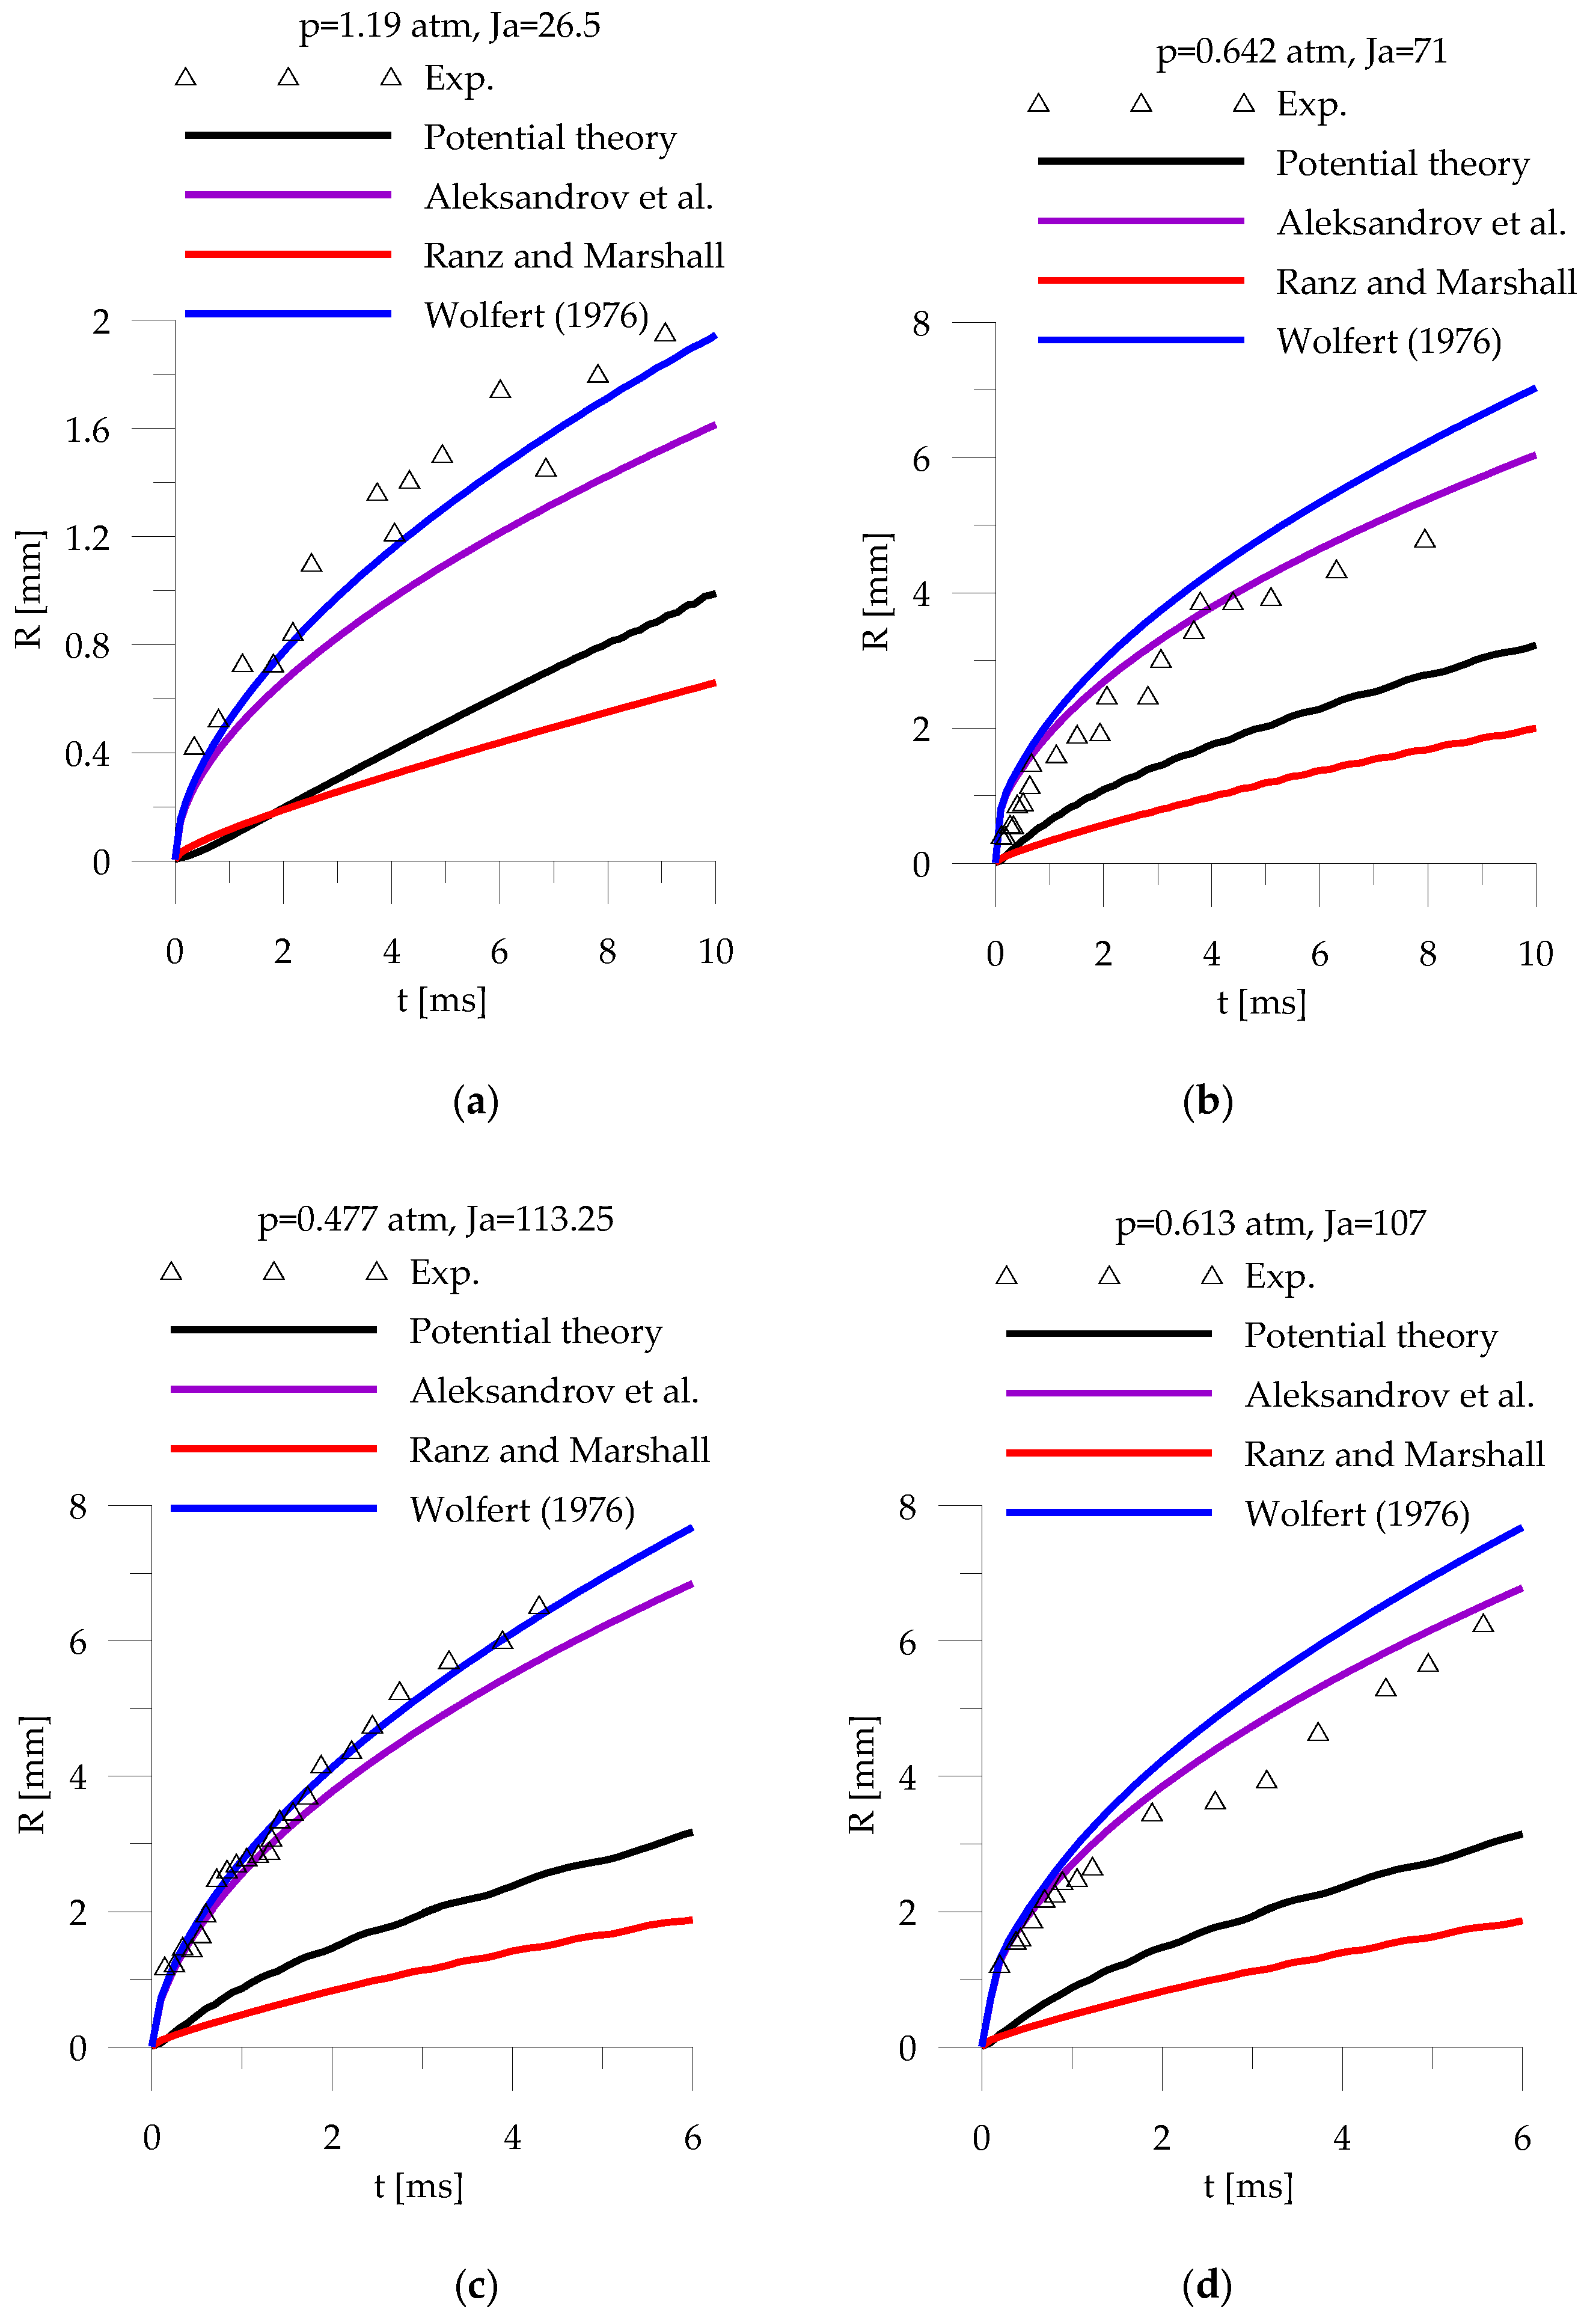
4.2. Translating Bubble Growth
4.2.1. Florschuetz et al. Cases
4.2.2. Kosky Cases
4.3. Bubble Growth in a Flowing Liquid
5. Conclusions
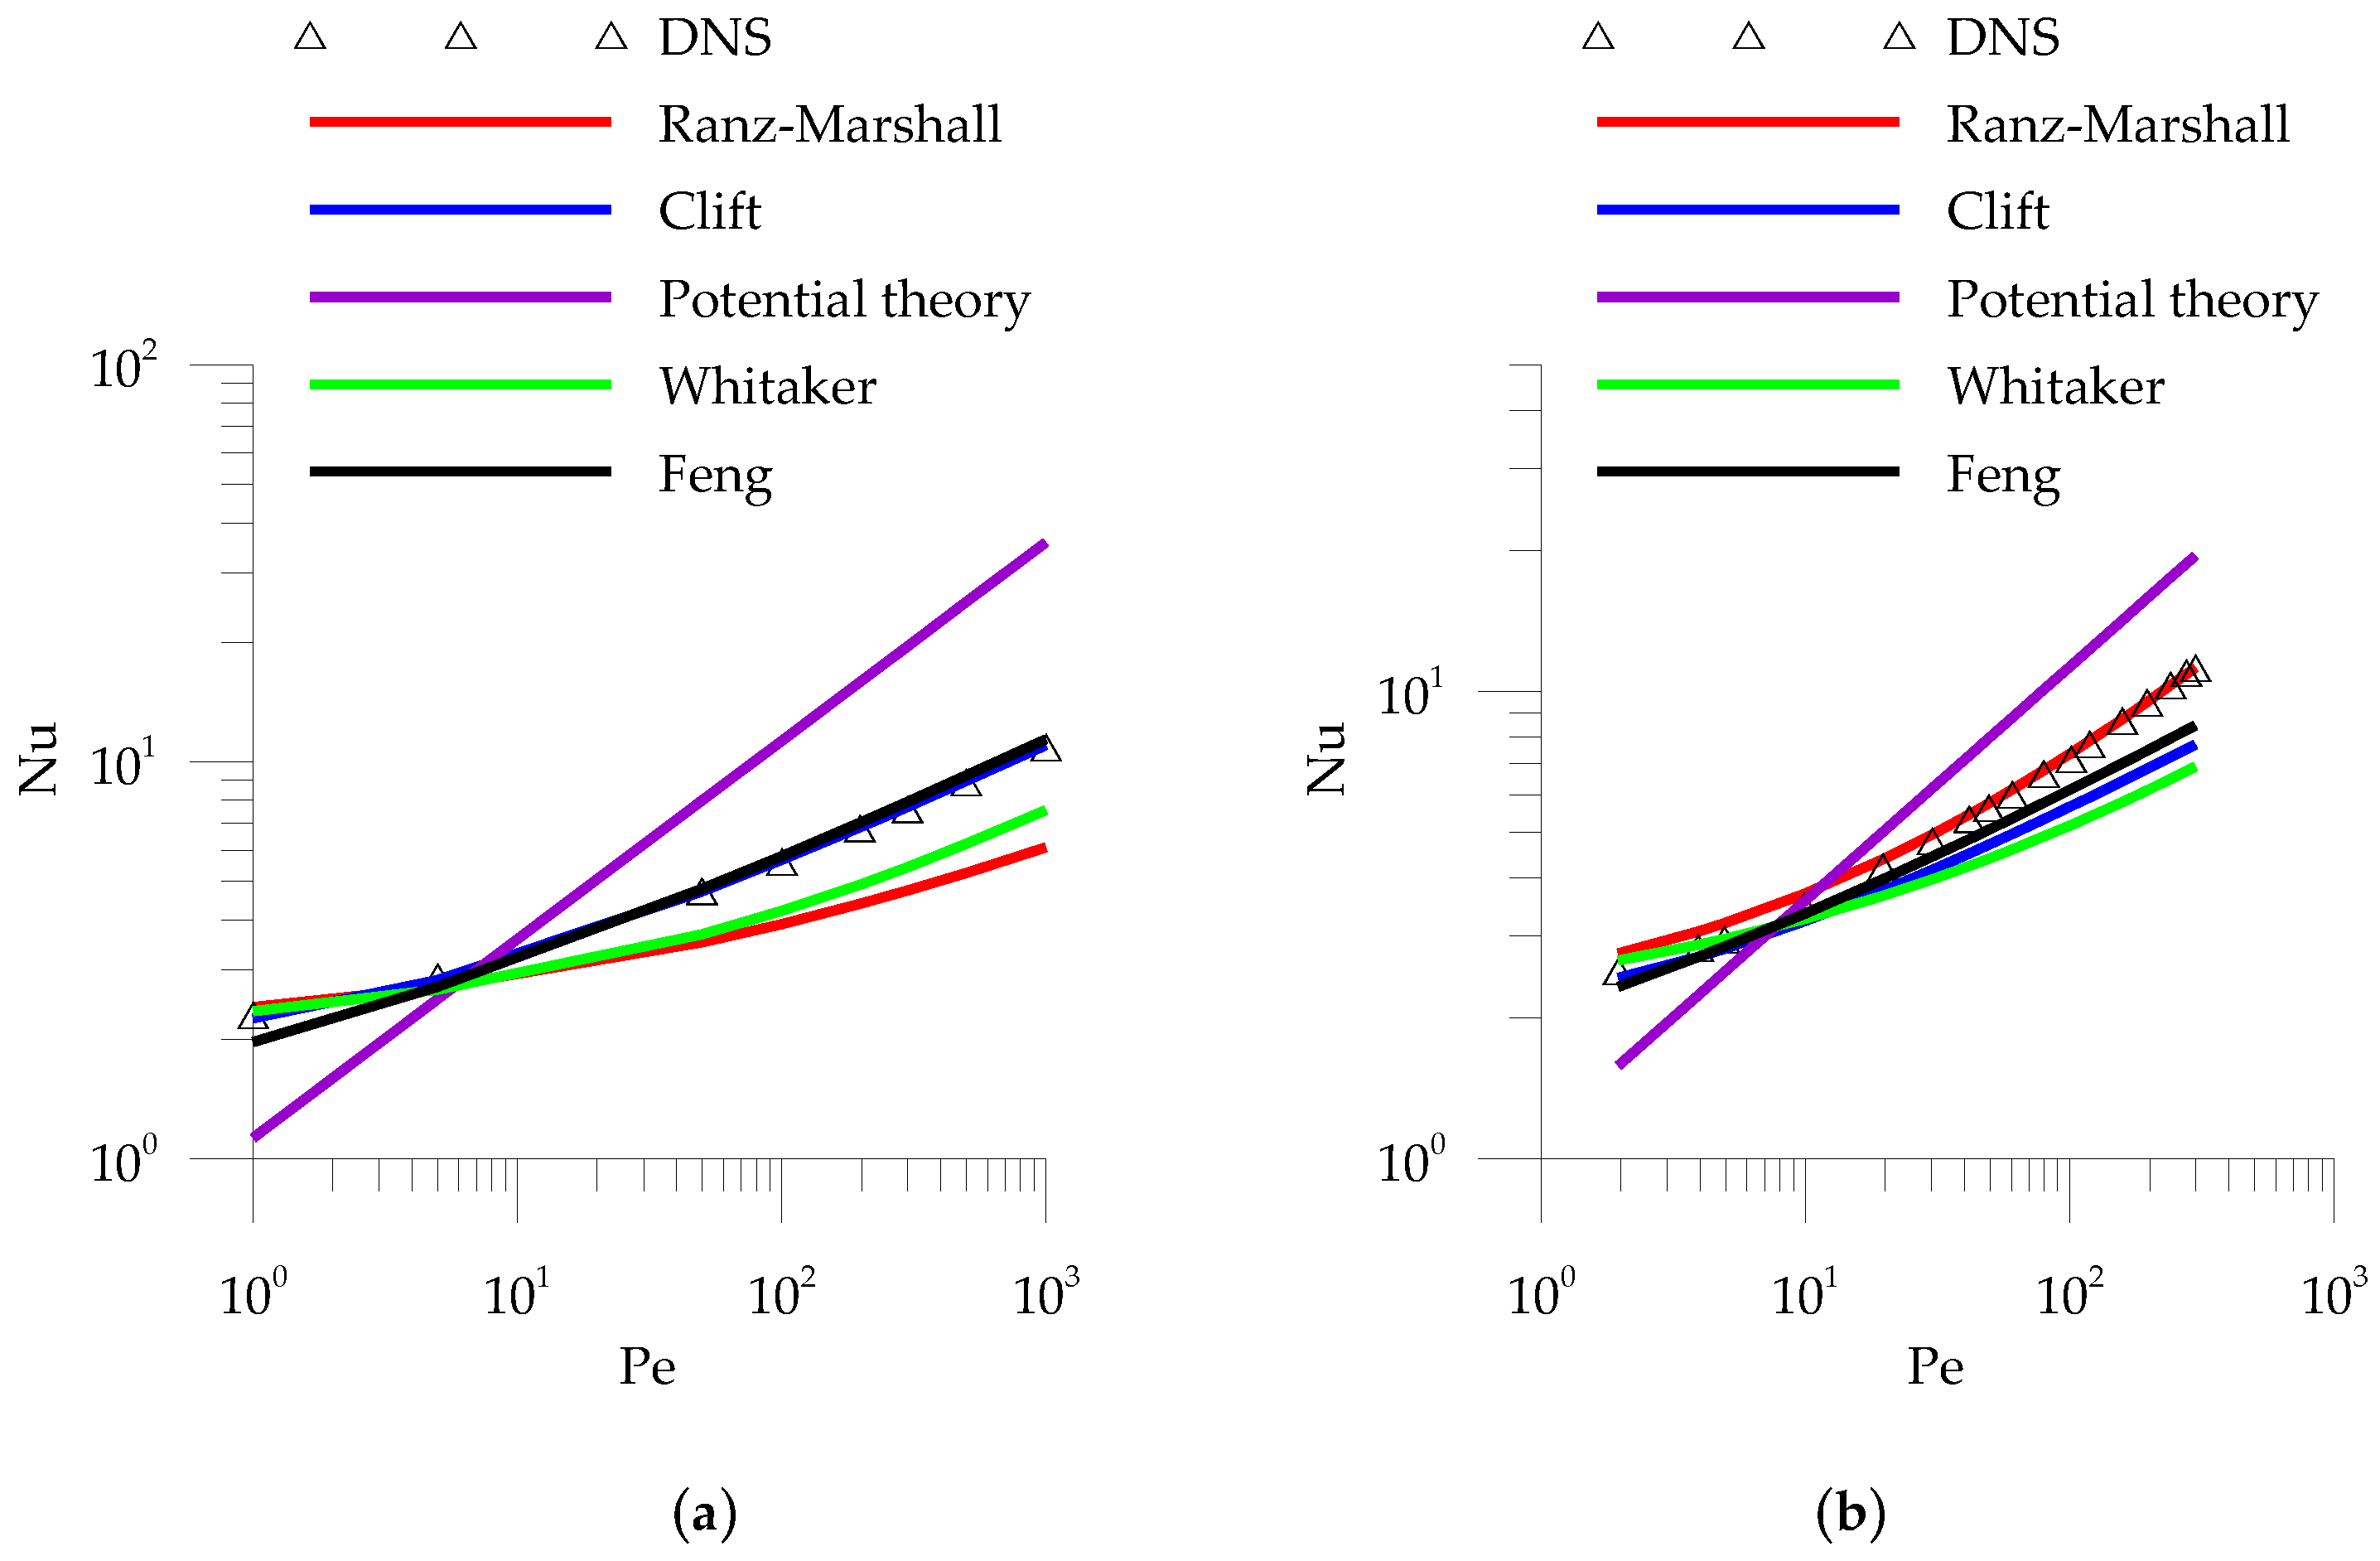
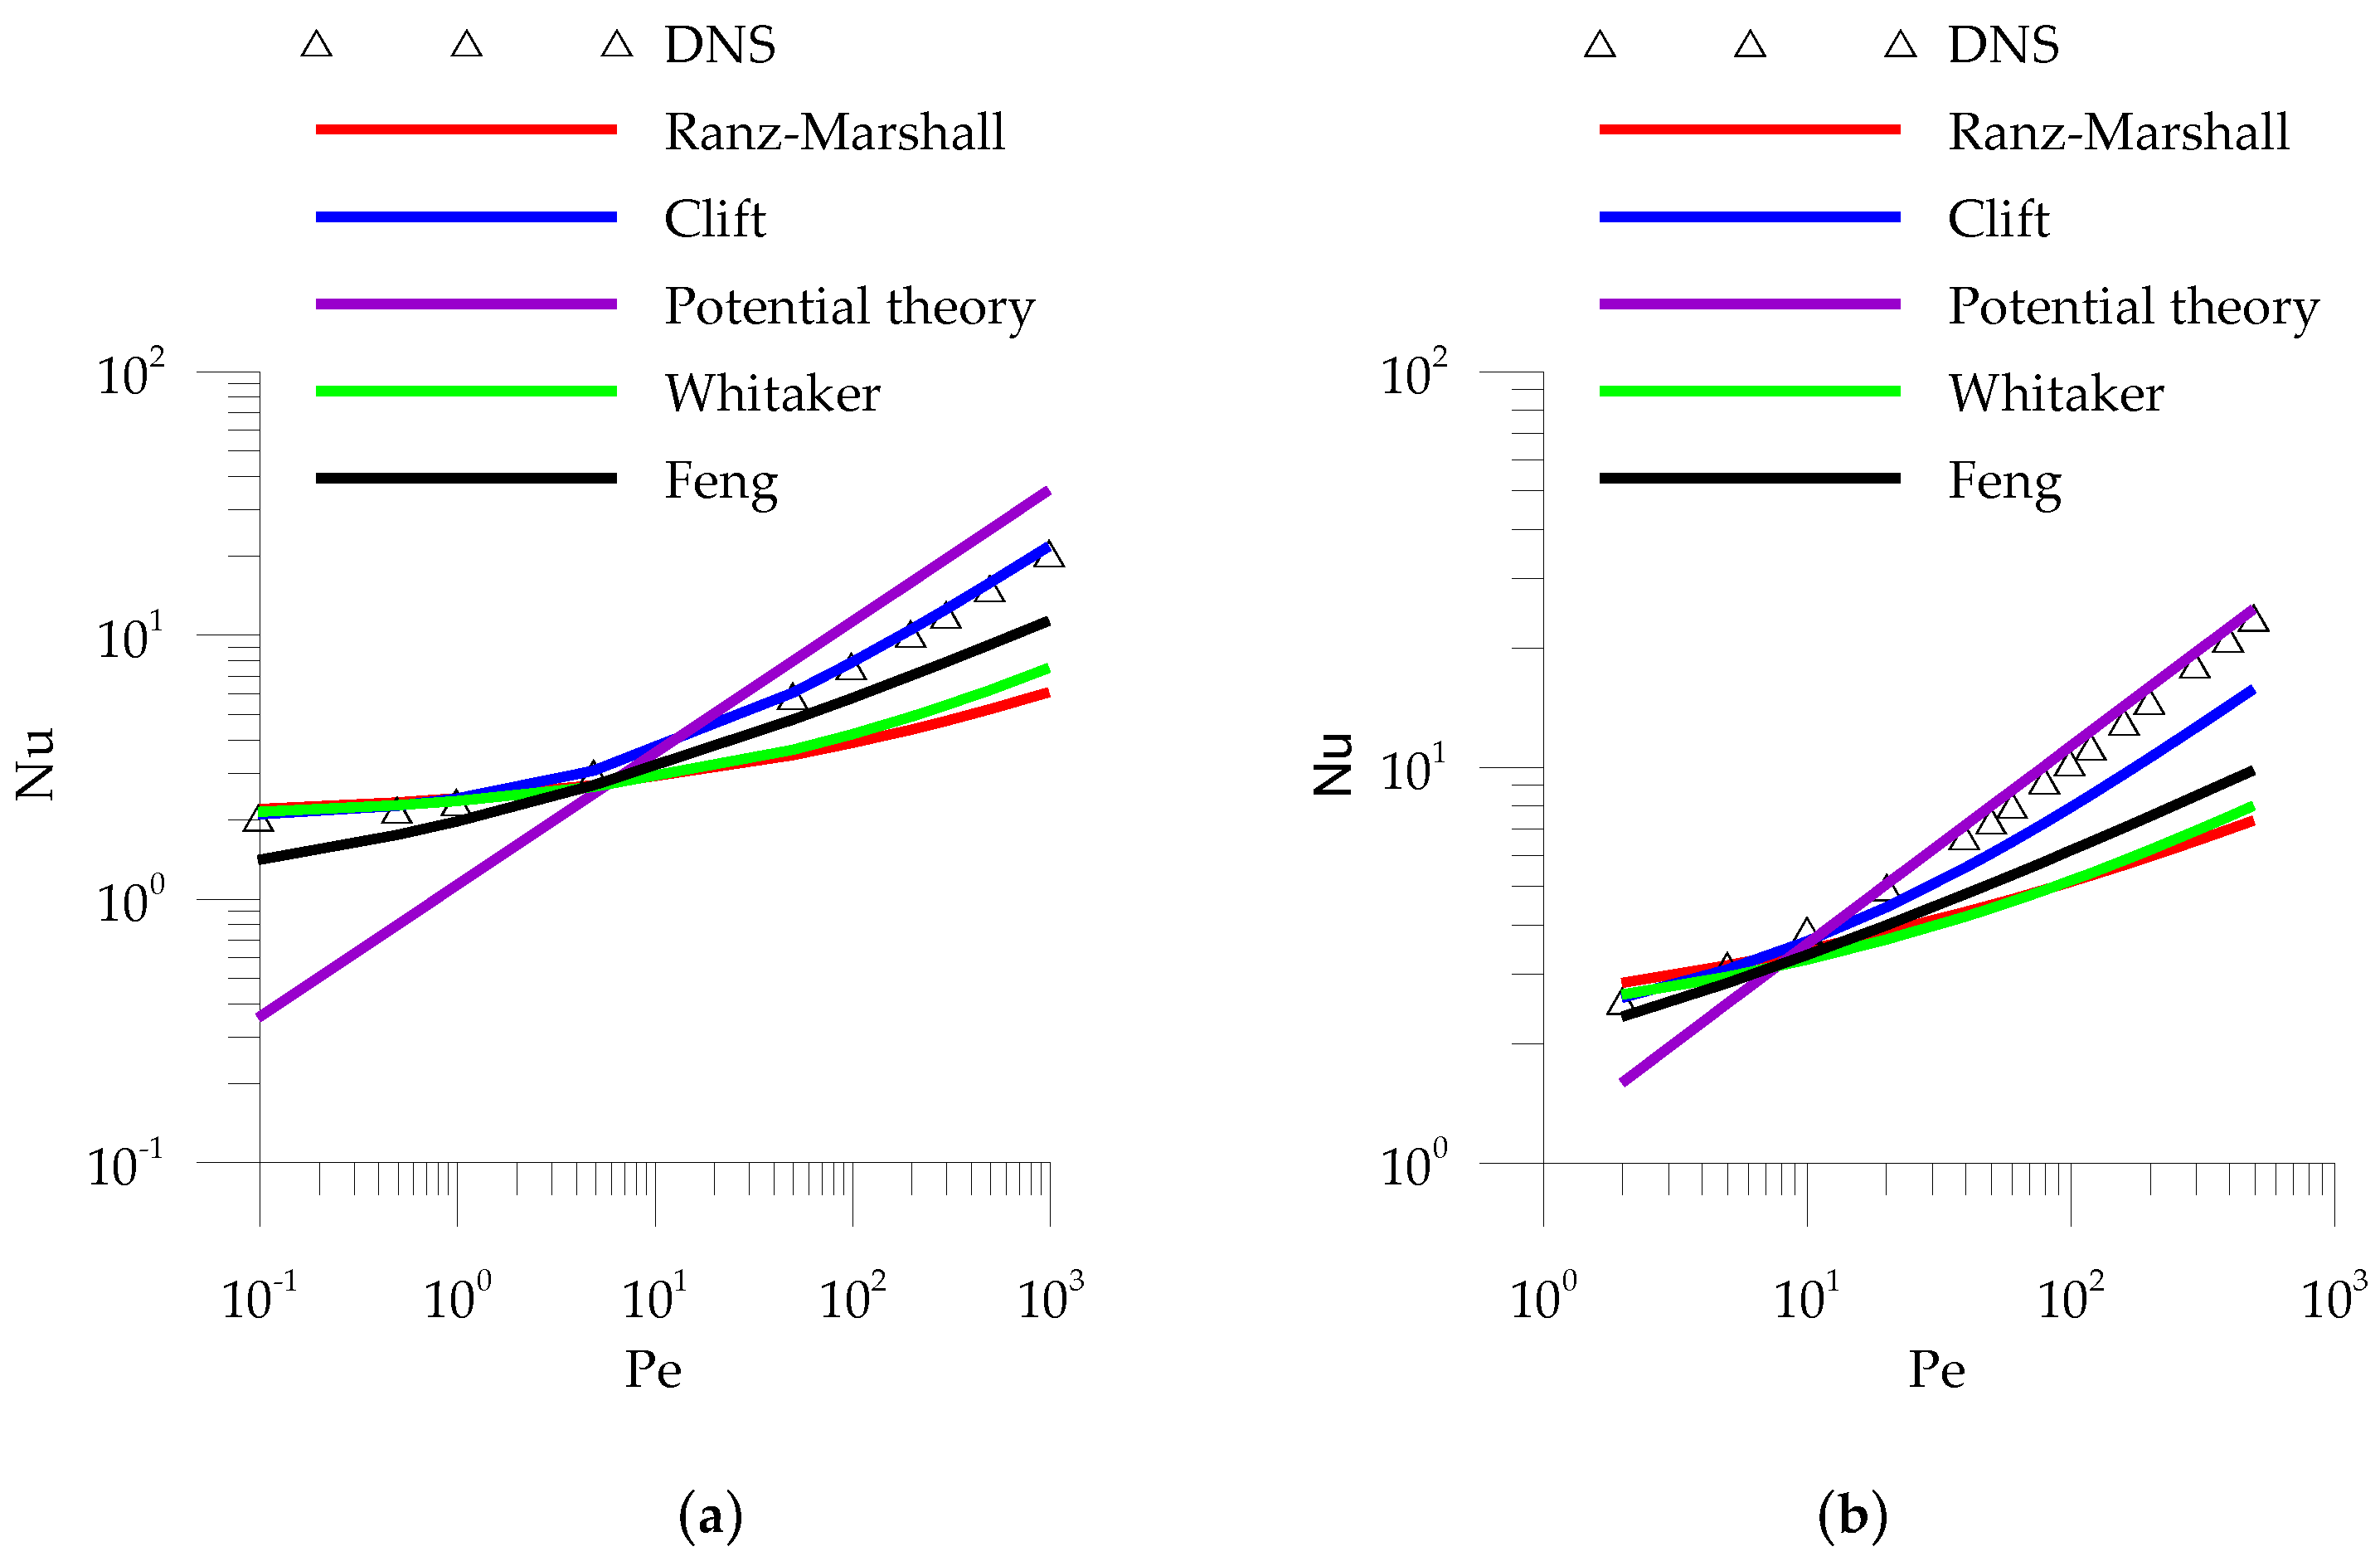
- For creeping flows the two correlations presented by Clift [64] provide excellent agreement for immobile (contaminated bubbles) and fully mobile (clean bubbles) interfaces, respectively.
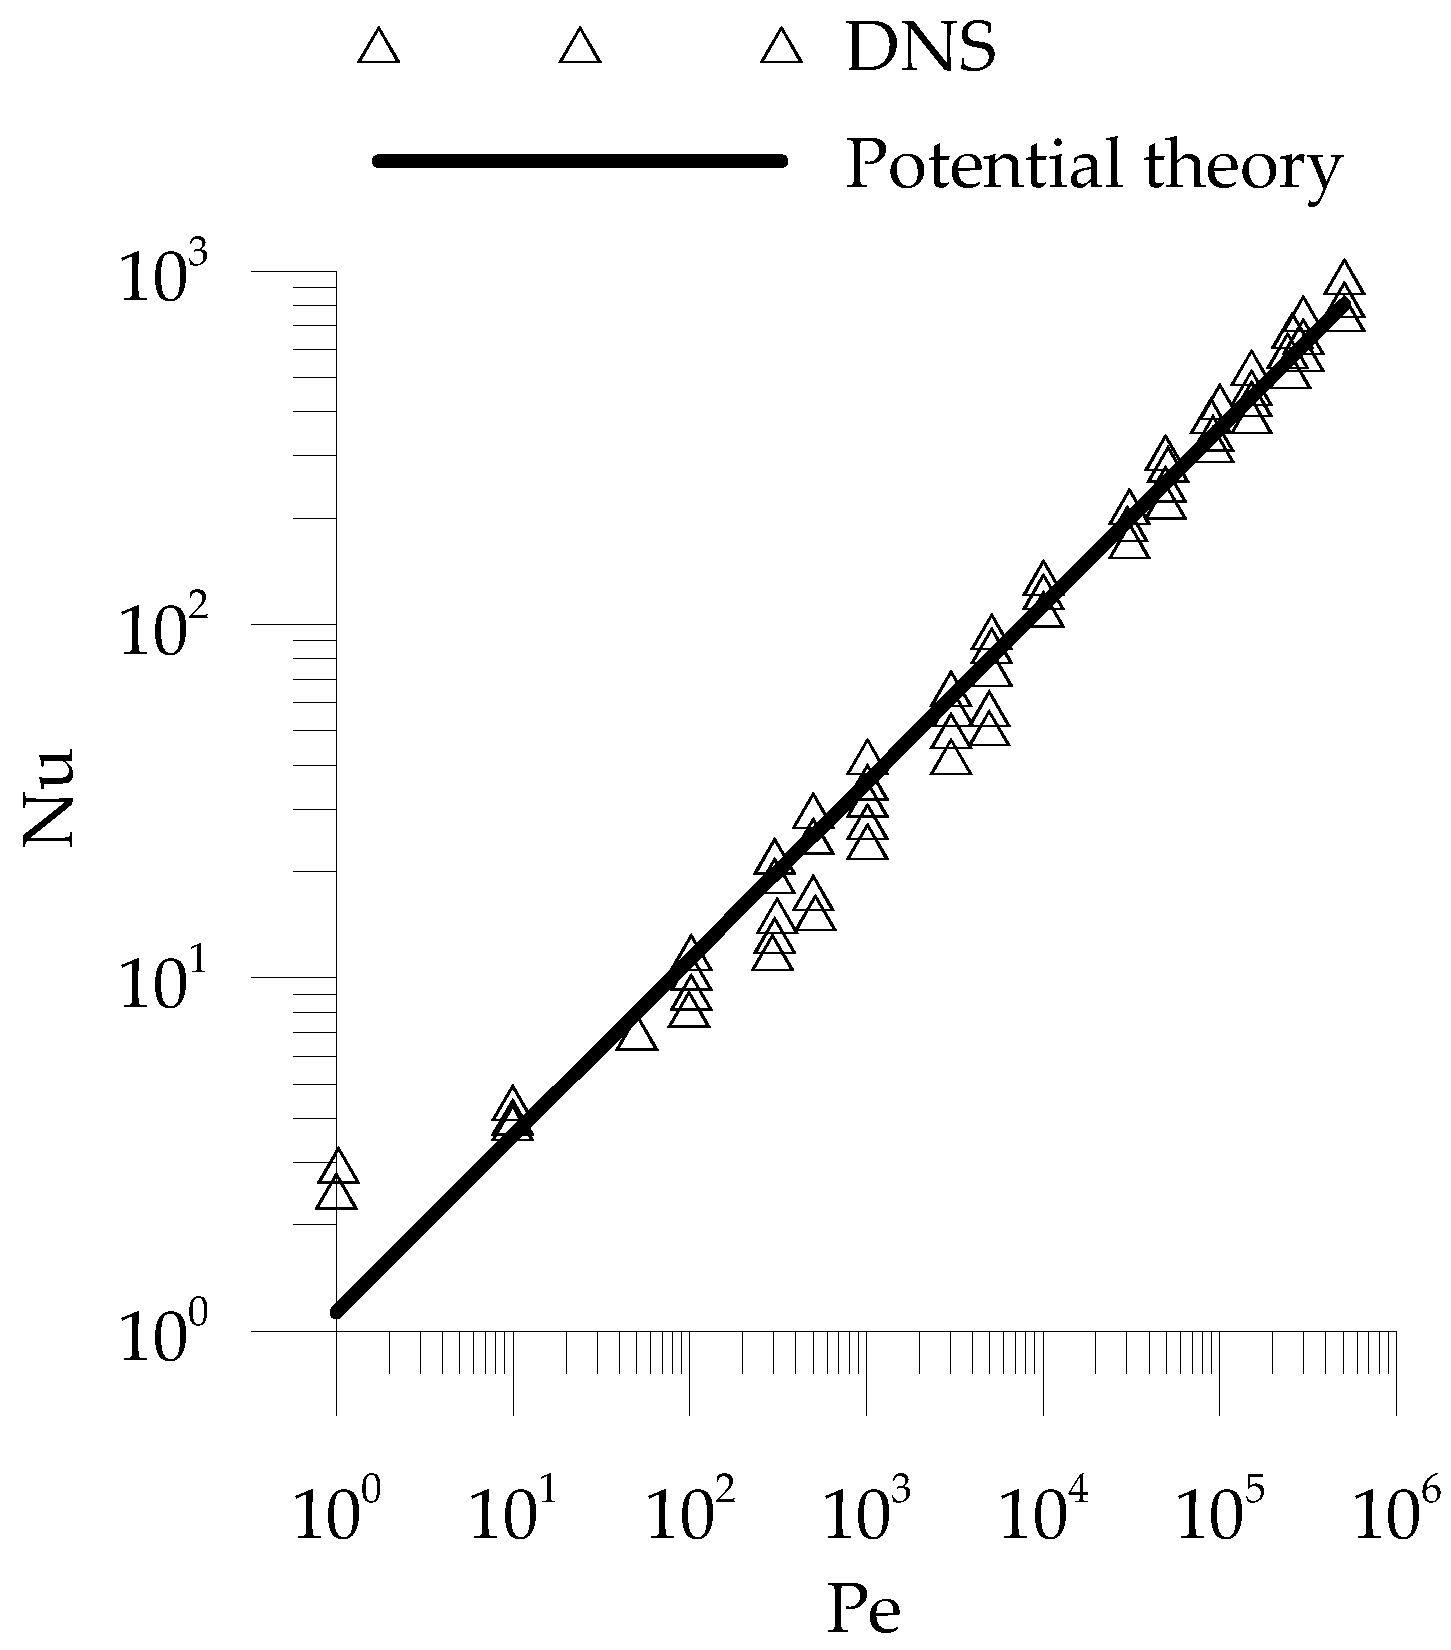
- For high Reynolds number, the Ranz & Marshall [42] correlation reproduces well the transfer rate from (to) solid spheres, droplets and contaminated bubbles, while it gives under-predictions in the case of clean bubbles, for which the potential theory is more suitable at least for .
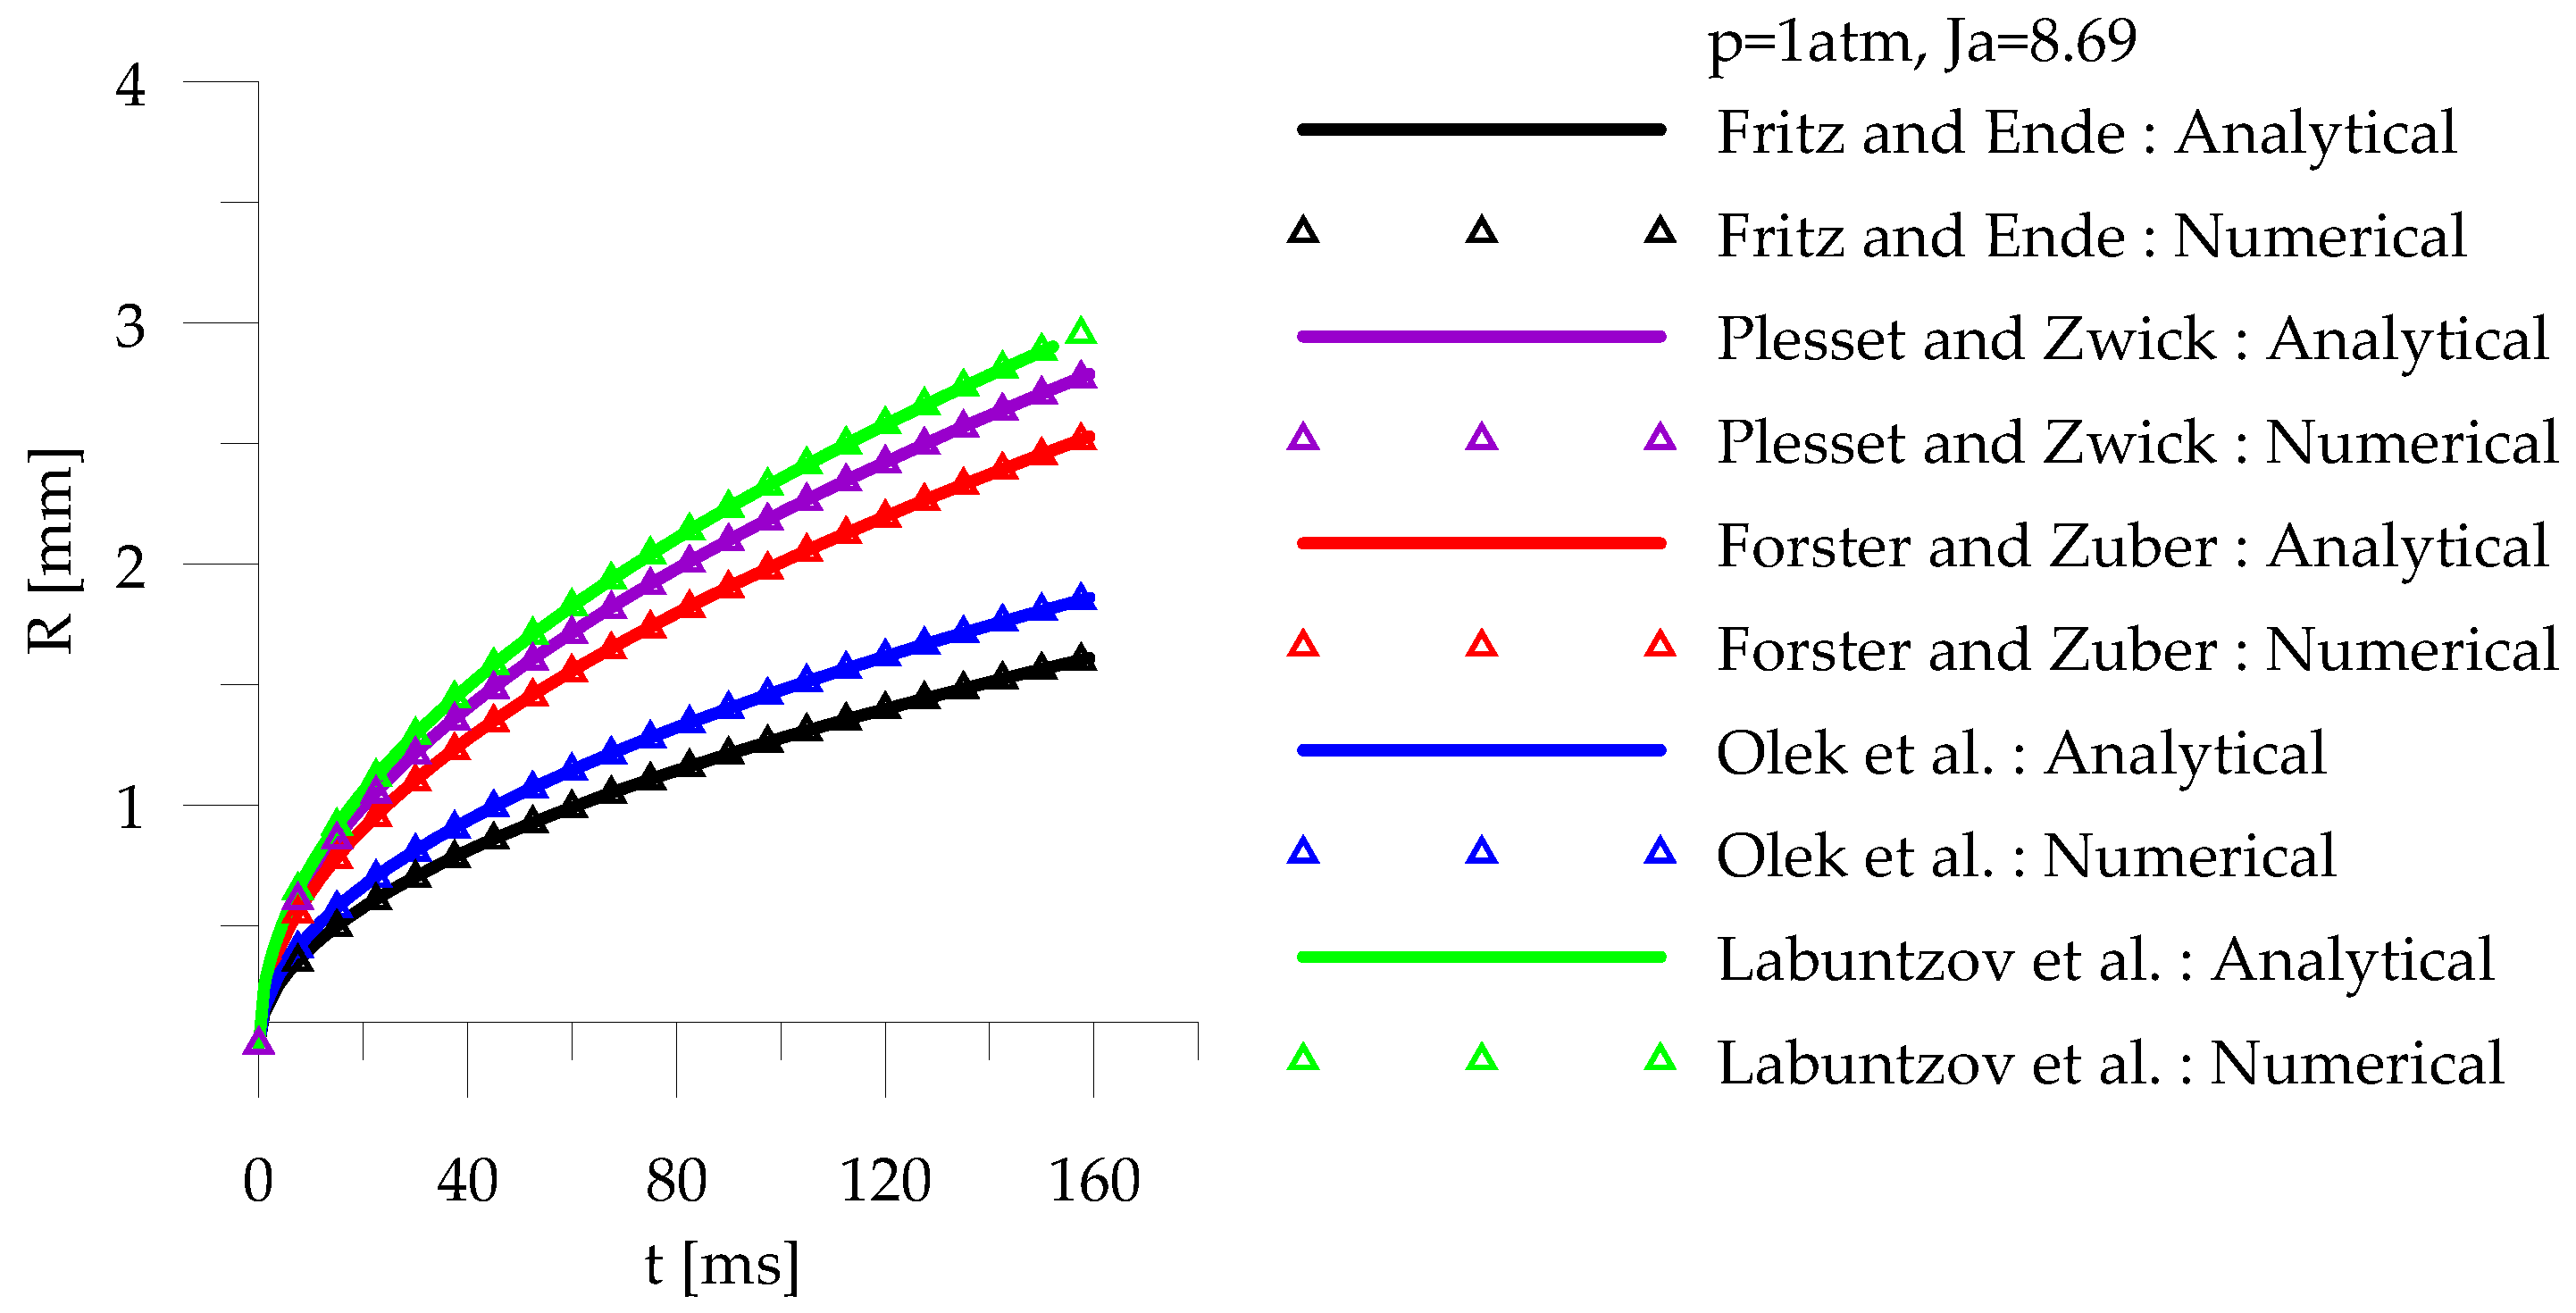
- Stationary bubble growth follows the theoretical relation for heat conduction, i.e., . The numerical results are consistent with the analytical ones. The performance of the correlations is found to be dependent on the Jakob number. The correlation of Fritz & Ende [16] reproduces the bubble growth rate very well at low Jakob numbers, while those of Plesset & Zwick [17] and Forster & Zuber [13] give better predictions at moderate Jakob numbers. As the Jakob number increases further, the results of Olek et al. [18] get closer to the experimental data.
- For a reliable prediction of translating bubble growth, it is important to account for both heat conduction and convection. The conduction effect is evident in the initial stage even at moderate Jakob numbers. In cases with high Jakob numbers, the potential theory and the Ranz & Marshall [42] correlation under-predict the bubble size significantly, while the Wolfert [58] and Aleksandrov et al. [56] correlations, which account for both conduction and convection, deliver satisfying results.
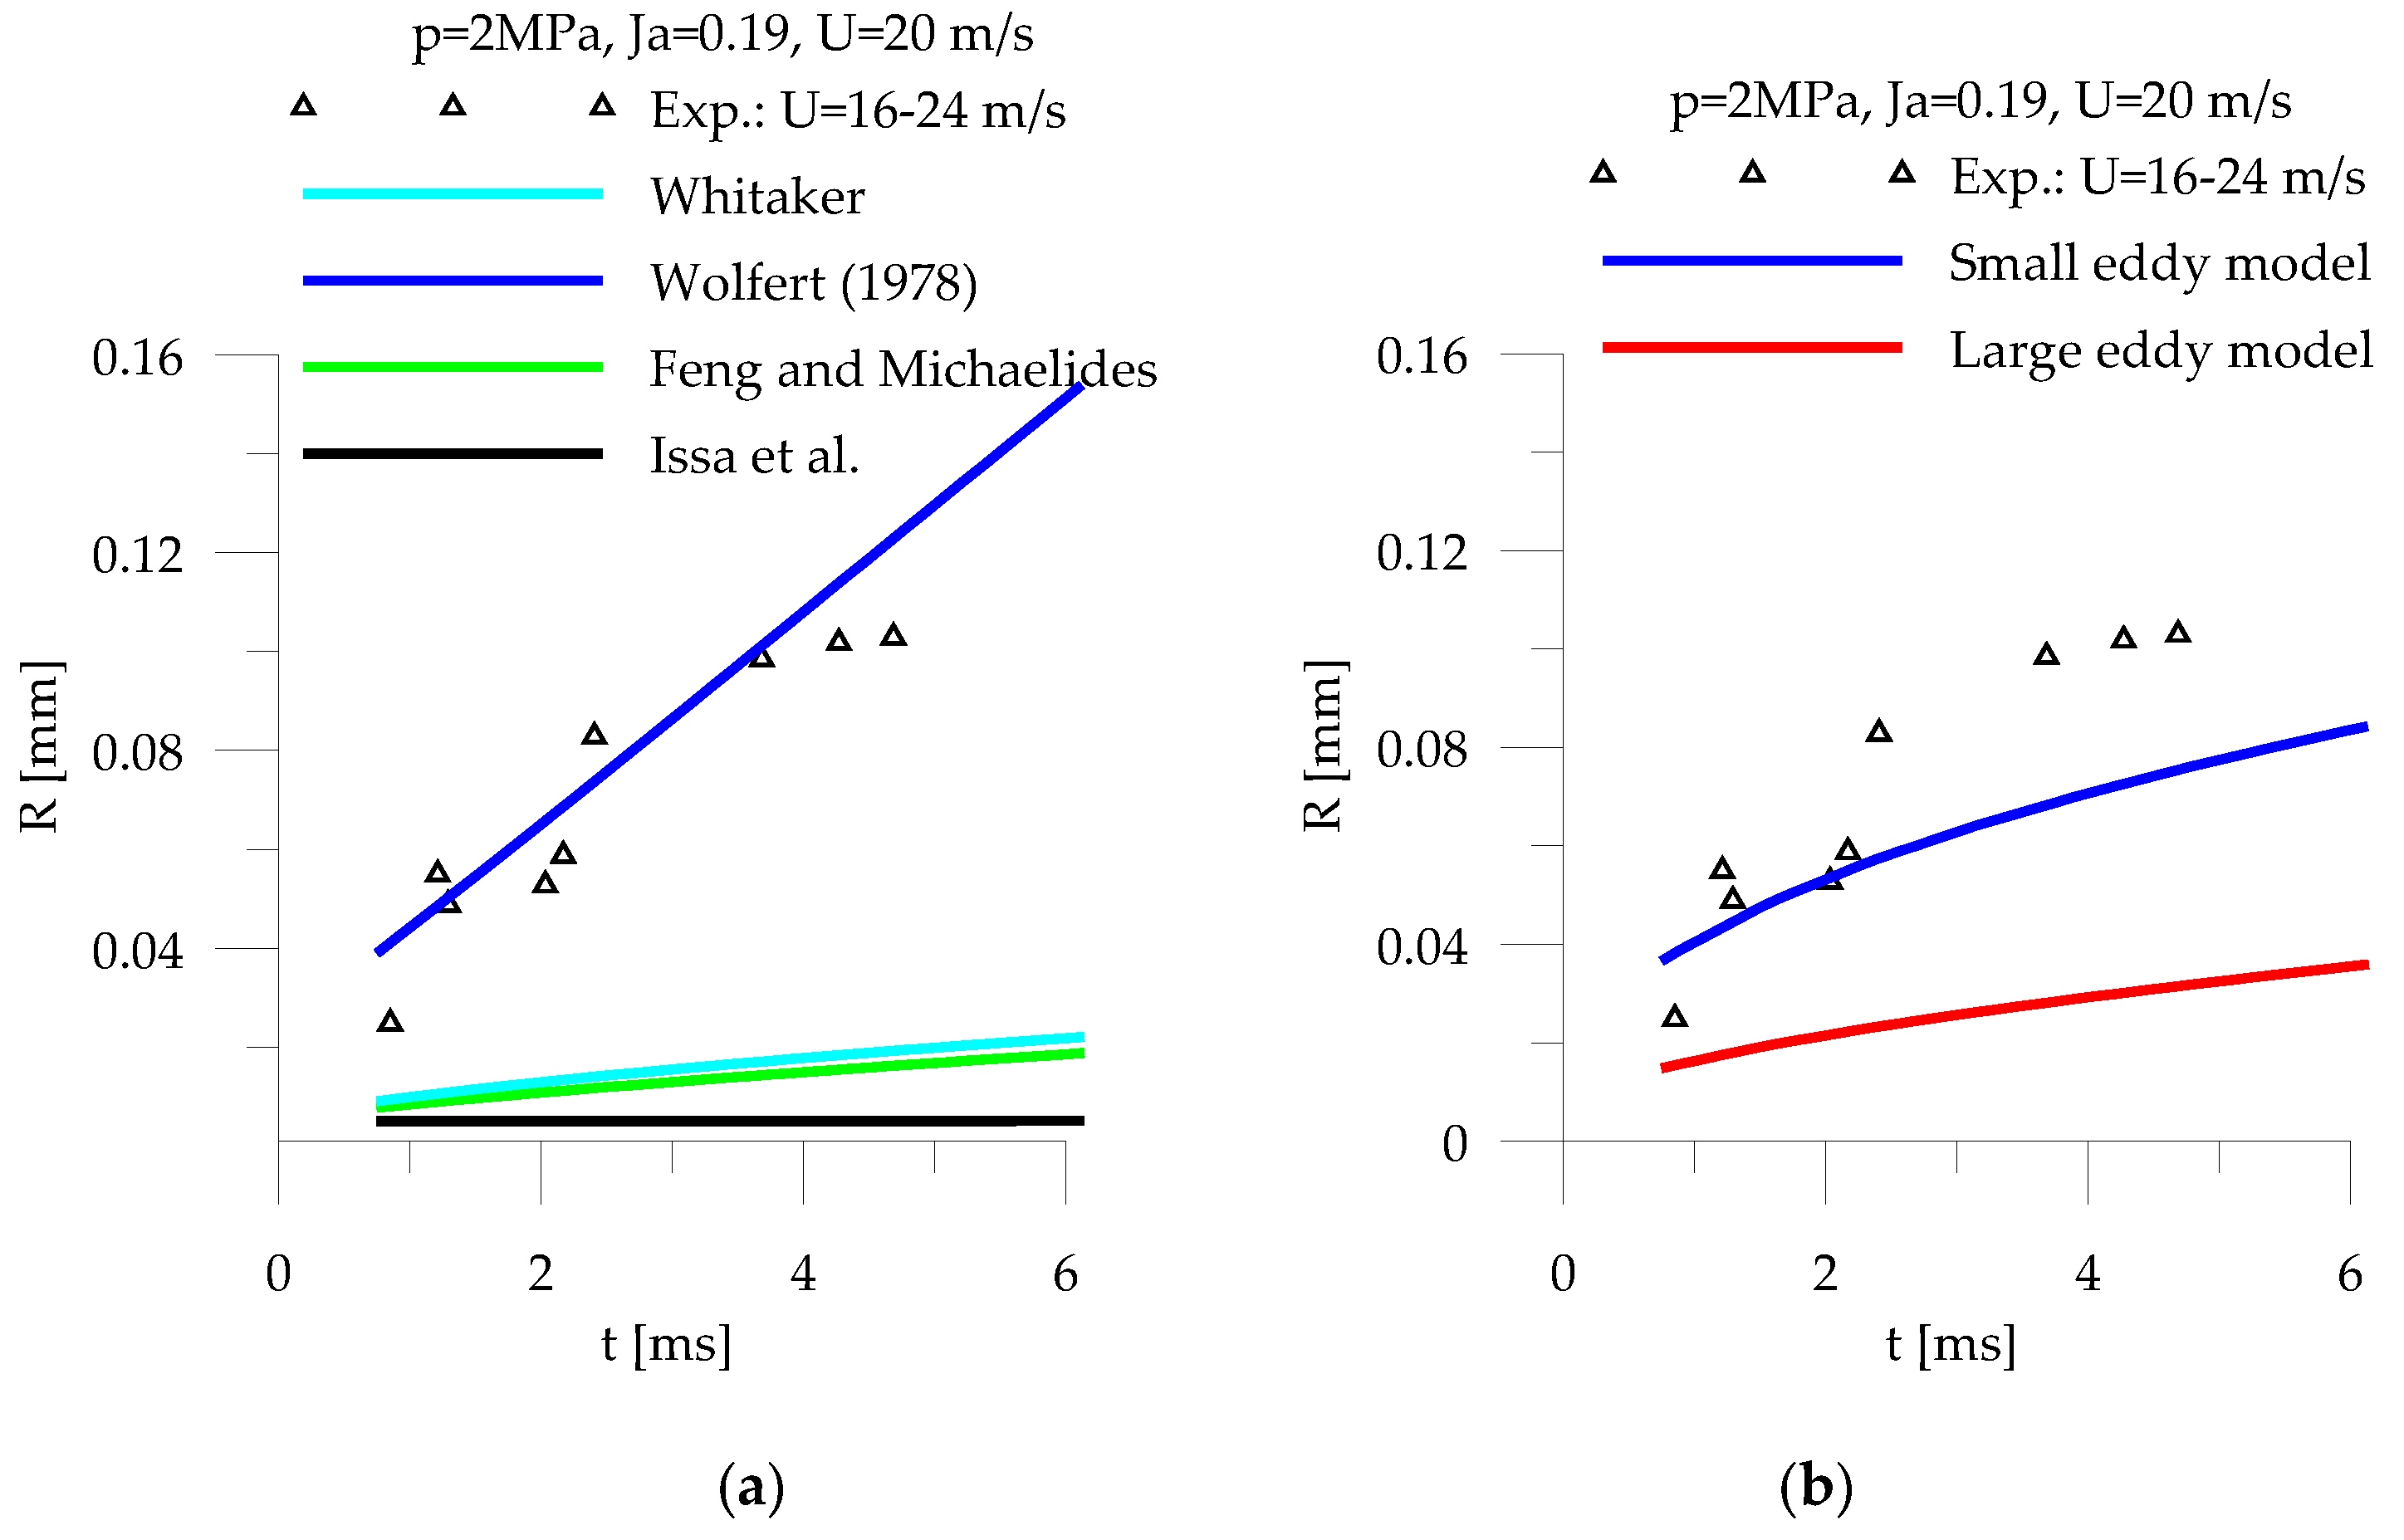
- Wolfert et al. [59] is capable of reproducing the bubble growth rate in turbulent high-velocity flows by introducing an eddy conductivity, while significant under-prediction is given by other empirical correlations. The situation is improved by using the cumulative model proposed by Wolfert [58] supplemented with the surface renewal theory for turbulence. The time scale of small eddies is found to more suitable for the characterization of interfacial transfer than that of the large eddies. Nevertheless, acquisition of more detailed data is necessary for the quantitation of the turbulence effect.
Author Contributions
Conflicts of Interest
Abbreviations
| CFD | Computational fluid dynamics |
| DNS | Direct numerical simulation |
References
- Gopalakrishnan, S. Modeling of Thermal Non-Equilibrium in Superheated Injector Flows. Ph.D. Thesis, University of Massachusetts Amherst, Amherst, MA, USA, 2010. [Google Scholar]
- Edwards, A.R.; O’Brien, T.P. Studies of phenomena connected with the depressurization of water reactors. J. Br. Nucl. Energy Soc. 1970, 9, 125–135. [Google Scholar]
- Pinhasi, G. Modeling of flashing two-phase flow. Rev. Chem. Eng. 2005, 21, 133–264. [Google Scholar] [CrossRef]
- De Luca, L.; Mongibello, L. Critical discharge in actively cooled wing leading edge of a reentry vehicle. J. Thermophys. Heat Transf. 2008, 22, 677–684. [Google Scholar] [CrossRef]
- Zhou, T.; Duan, J.; Hong, D.; Liu, P.; Sheng, C.; Huang, Y. Characteristics of a single bubble in subcooled boiling region of a narrow rectangular channel under natural circulation. Ann. Nucl. Energy 2013, 57, 22–31. [Google Scholar] [CrossRef]
- Liao, Y.; Lucas, D. Computational modelling of flash boiling flows: A literature survey. Int. J. Heat Mass Transf. 2017, 111, 246–265. [Google Scholar] [CrossRef]
- Bilicki, Z.; Kestin, J. Physical Aspects of the Relaxation Model in Two-Phase Flow. Proc. R. Soc. A Math. Phys. Eng. Sci. 1990, 428, 379–397. [Google Scholar] [CrossRef]
- Downar-Zapolski, P.; Bilicki, Z.; Bolle, L.; Franco, J. The non-equilibrium relaxation model for one-dimensional flashing liquid flow. Int. J. Multiph. Flow 1996, 22, 473–483. [Google Scholar] [CrossRef]
- Gopalakrishnan, S. Multidimensional simulation of flash-boiling fuels in injector nozzles. In Proceedings of the 21st Annual Conference on Liquid Atomization and Spray Systems, Orlando, FL, USA, 18–21 May 2008. [Google Scholar]
- Neroorkar, K.D. Modeling of Flash Boiling Flows in Injectors with Gasoline-Ethanol Fuel Blends. Ph.D. Thesis, University of Massachusetts Amherst, Amherst, MA, USA, 2011. [Google Scholar]
- Banerjee, S. A surface renewal model for interfacial heat and mass transfer in transient two-phase flow. Int. J. Multiph. Flow 1978, 4, 571–573. [Google Scholar] [CrossRef]
- Miyatake, O.; Tanaka, I.; Lior, N. A simple universal equation for bubble growth in pure liquids and binary solutions with a nonvolatile solute. Int. J. Heat Mass Transf. 1997, 40, 1577–1584. [Google Scholar] [CrossRef]
- Forster, H.K.; Zuber, N. Growth of a Vapor Bubble in a Superheated Liquid. J. Appl. Phys. 1954, 25, 474–478. [Google Scholar] [CrossRef]
- Birkhoff, G.; Margulies, R.S.; Horning, W.A. Spherical Bubble Growth. Phys. Fluids 1958, 1, 201–204. [Google Scholar] [CrossRef]
- Mathpati, C.S.; Joshi, J.B. Insight into Theories of Heat and Mass Transfer at the Solid-Fluid Interface Using Direct Numerical Simulation and Large Eddy Simulation. Ind. Eng. Chem. Res. 2007, 46, 8525–8557. [Google Scholar] [CrossRef]
- Fritz, W.; Ende, W. Über den Verdampfungsvorgang nach kinematographischen Aufnahmen an Dampfblasen. Phys. Z. 1936, XXXVII, 391–401. [Google Scholar]
- Plesset, M.S.; Zwick, S.A. The Growth of Vapor Bubbles in Superheated Liquids. J. Appl. Phys. 1954, 25, 493–500. [Google Scholar] [CrossRef]
- Olek, S.; Zvirin, Y.; Elias, E. Beschreibung des Blasenwachstums durch Wärmeleitungs-Gleichungen von hyperbolischer und parabolischer Form. Wärme- und Stoffübertragung 1990, 25, 17–26. [Google Scholar] [CrossRef]
- Plesset, M.S.; Zwick, S.A. A Nonsteady Heat Diffusion Problem with Spherical Symmetry. J. Appl. Phys. 1952, 23, 95–98. [Google Scholar] [CrossRef]
- Florschuetz, L.W.; Henry, C.L.; Khan, A.R. Growth rates of free vapor bubbles in liquids at uniform superheats under normal and zero gravity conditions. Int. J. Heat Mass Transf. 1969, 12, 1465–1489. [Google Scholar] [CrossRef]
- Ivashnyov, O.E.; Smirnov, N.N. Thermal growth of a vapor bubble moving in superheated liquid. Phys. Fluids 2004, 16, 809–823. [Google Scholar] [CrossRef]
- Ruckenstein, E. On heat transfer between vapour bubbles in motion and the boiling liquid from which they are generated. Chem. Eng. Sci. 1959, 10, 22–30. [Google Scholar] [CrossRef]
- Sideman, S. The Equivalence of the Penetration and Potential Flow Theories. Ind. Eng. Chem. 1966, 58, 54–58. [Google Scholar] [CrossRef]
- Higbie, R. The rate of absorption of a pure gas into a still liquid during short periods of exposure. Trans. Am. Inst. Chem. Eng. 1935, 31, 365–389. [Google Scholar]
- Lavender, W.J.; Pei, D.C.T. The effect of fluid turbulence on the rate of heat transfer from spheres. Int. J. Heat Mass Transf. 1967, 10, 529–539. [Google Scholar] [CrossRef]
- Raithby, G.D.; Eckert, E.R.G. The effect of turbulence parameters and support position on the heat transfer from spheres. Int. J. Heat Mass Transf. 1968, 11, 1233–1252. [Google Scholar] [CrossRef]
- Yearling, P.R.; Gould, R.D. Convective heat and mass transfer from a single evaporating water, methanol, and ethanol droplet. ASME FED 1995, 233, 33–38. [Google Scholar]
- Buchanan, C.D. The measurement of droplet evaporation rates at low Reynolds number in a turbulent flow. In Proceedings of the NHTC’00 34th National Heat Transfer Conference, Pittsburgh, PA, USA, 20–22 August 2000; pp. 1–8. [Google Scholar]
- Danckwerts, P.V. Significance of Liquid-Film Coefficients in Gas Absorption. Ind. Eng. Chem. 1951, 43, 1460–1467. [Google Scholar] [CrossRef]
- Banerjee, S.; Scott, D.S.; Rhodes, E. Mass Transfer to Falling Wavy Liquid Films in Turbulent Flow. Ind. Eng. Chem. Fundam. 1968, 7, 22–27. [Google Scholar] [CrossRef]
- Deckwer, W.D. On the mechanism of heat transfer in bubble column reactors. Chem. Eng. Sci. 1980, 35, 1341–1346. [Google Scholar] [CrossRef]
- Garcia-Ochoa, F.; Gomez, E. Theoretical prediction of gas–liquid mass transfer coefficient, specific area and hold-up in sparged stirred tanks. Chem. Eng. Sci. 2004, 59, 2489–2501. [Google Scholar] [CrossRef]
- Fortescue, G.E.; Pearson, J.R.A. On gas absorption into a turbulent liquid. Chem. Eng. Sci. 1967, 22, 1163–1176. [Google Scholar] [CrossRef]
- Sideman, S.; Barsky, Z. Turbulence effect on direct-contact heat transfer with change of phase: Effect of mixing on heat transfer between an evaporating volatile liquid in direct contact with an immiscible liquid medium. AIChE J. 1965, 11, 539–545. [Google Scholar] [CrossRef]
- Figueroa-Espinoza, B.; Legendre, D. Mass or heat transfer from spheroidal gas bubbles rising through a stationary liquid. Chem. Eng. Sci. 2010, 65. [Google Scholar] [CrossRef]
- Bagchi, P.; Kottam, K. Effect of freestream isotropic turbulence on heat transfer from a sphere. Phys. Fluids 2008, 20, 073305. [Google Scholar] [CrossRef]
- Labuntzov, D.A.; Kolchugin, B.A.; Zakharova, E.A.; Vladimirova, L.N. High speed camera investigation of bubble growth for saturated water boiling in a wide range of pressure variations. Thermophys. High Temp. 1964, 2, 446–453. [Google Scholar]
- Blinkov, V.N.; Jones, O.C.; Nigmatulin, B.I. Nucleation and flashing in nozzles—2. Comparison with experiments using a five-equation model for vapor void development. Int. J. Multiph. Flow 1993, 19, 965–986. [Google Scholar] [CrossRef]
- Maksic, S. CFD-calculation of the flashing flow in pipes and nozzles. In Proceedings of the 2002 ASME Joint U.S.-European Fluids Engineering Conference, Montreal, QC, Canada, 14–18 July 2002. [Google Scholar]
- Marsh, C. Three-dimensional modelling of industrial flashing flows. Prog. Comput. Fluid Dyn. 2009, 9, 393–398. [Google Scholar] [CrossRef]
- Valero, E.; Parra, I.E. The role of thermal disequilibrium in critical two-phase flow. Int. J. Multiph. Flow 2002, 28, 21–50. [Google Scholar] [CrossRef]
- Ranz, W.E.; Marshall, W.R.J. Evaporation from drops Part I. Chem. Eng. Prog. 1952, 48, 141–146. [Google Scholar]
- Richter, H.J. Separated two-phase flow model: Application to critical two-phase flow. Int. J. Multiph. Flow 1983, 9, 511–530. [Google Scholar] [CrossRef]
- Bird, R.B.; Stewart, W.E.; Lightfoot, E.N. Transport Phenomena, 1st ed.; John Wiley and Sons: New York, NY, USA, 1960. [Google Scholar]
- Dobran, F. Nonequilibrium Modeling of Two-Phase Critical Flows in Tubes. J. Heat Transf. 1987, 109, 731–738. [Google Scholar] [CrossRef]
- Giese, T. Experimental and Numerical Investigation of Gravity-Driven Pipe Flow with Cavitation. In Proceedings of the 10th International Conference on Nuclear Engineering, Arlington, VA, USA, 14–18 April 2002. [Google Scholar]
- Laurien, E. Influence of the model bubble diameter on three-dimensional numerical simulations of thermal cavitation in pipe elbows. In Proceedings of the 3rd International Symposium on Two-Phase Flow Modelling and Experimentation, Pisa, Italy, 22–25 September 2004. [Google Scholar]
- Frank, T. Simulation of flashing and steam condensation in subcooled liquid using ANSYS CFX. In Proceedings of the 5th Joint FZR & ANSYS Workshop “Multiphase Flows: Simulation, Experiment and Application”, Dresden, Germany, 26–27 April 2007. [Google Scholar]
- Hughmark, G.A. Mass and Heat Transfer from Rigid Spheres. AlChE J. 1967, 13, 1219. [Google Scholar] [CrossRef]
- Schwellnus, C.F.; Shoukri, M. A two-fluid model for non-equilibrium two-phase critical discharge. Can. J. Chem. Eng. 1991, 69, 188–197. [Google Scholar] [CrossRef]
- AL-Sahan, M.A. On the Development of the Flow Regimes and the Formulation of a Mechanistic Non-Equilibrium Model for Critical Two-Phase Flow. Ph.D. Thesis, University of Toronto, Toronto, ON, Canada, 1988. [Google Scholar]
- McAdams, W.H. Heat Transmission; McGraw-Hill: New York, NY, USA, 1954. [Google Scholar]
- Lee, K.; Ryley, D.J. The Evaporation of Water Droplets in Superheated Steam. J. Heat Transf. 1968, 90, 445–451. [Google Scholar] [CrossRef]
- Nigmatulin, R.I.; Khabeev, N.S.; Nagiev, F.B. Dynamics, heat and mass transfer of vapour-gas bubbles in a liquid. Int. J. Heat Mass Transf. 1981, 24, 1033–1044. [Google Scholar] [CrossRef]
- Mahulkar, A.V.; Bapat, P.S.; Pandit, A.B.; Lewis, F.M. Steam bubble cavitation. AIChE J. 2008, 54, 1711–1724. [Google Scholar] [CrossRef]
- Aleksandrov, Y.A.; Voronov, G.S.; Gorbunkov, V.M.; Delone, N.B.; Nechayev, Y.I. Bubble Chambers; Indiana University Press: Bloomington, IN, USA, 1967. [Google Scholar]
- Saha, P.; Abuaf, N.; Wu, B.J.C. A Nonequilibrium Vapor Generation Model for Flashing Flows. J. Heat Transf. 1984, 106, 198–203. [Google Scholar] [CrossRef]
- Wolfert, K. The simulation of blowdown processes with consideration of thermodynamic nonequilibrium phenomena. In Proceedings of the Specialists Meeting of Transient Two-Phase Flow, OECD/Nuclear Energy Agency, Toronto, ON, Canada, 3–4 August 1976. [Google Scholar]
- Wolfert, K.; Burwell, M.J.; Enix, D. Non-equilibrium mass transfer between liquid and vapour phases during depressurization process in transient two-phase flow. In Proceedings of the 2nd CSNI Specialists Meeting, Paris, France, 12–14 June 1978. [Google Scholar]
- Whitaker, S. Forced convection heat transfer correlations for flow in pipes, past flat plates, single cylinders, single spheres, and for flow in packed beds and tube bundles. AIChE J. 1972, 18, 361–371. [Google Scholar] [CrossRef]
- Issa, S.A.; Weisensee, P.; Macian, R.J. Experimental investigation of steam bubble condensation in vertical large diameter geometry under atmospheric pressure and different flow conditions. Int. J. Heat Mass Transf. 2014, 70, 918–929. [Google Scholar] [CrossRef]
- Feng, Z.G.; Michaelides, E.E. A numerical study on the transient heat transfer from a sphere at high Reynolds and Peclet numbers. Int. J. Heat Mass Transf. 2000, 43, 219–229. [Google Scholar] [CrossRef]
- Dani, A.; Cockx, A.; Guiraud, P. Direct Numerical Simulation of Mass Transfer from Spherical Bubbles: The Effect of Interface Contamination at Low Reynolds Numbers. Int. J. Chem. React. Eng. 2006, 4. [Google Scholar] [CrossRef]
- Clift, R. Bubbles, Drops, and Particles; Acadaenuc Press: New York, NY, USA, 1978. [Google Scholar]
- Dergarabedian, P. The rate of growth of vapor bubbles in superheated water. J. Appl. Mech. 1953, 20, 537–545. [Google Scholar]
- Hooper, F.C. The flashing of liquids at higher superheats. In Proceedings of the Third International Heat Transfer Conference, Chicago, IL, USA, 7–12 August 1966; pp. 44–50. [Google Scholar]
- Kosky, P.G. Bubble growth measurements in uniformly superheated liquids. Chem. Eng. Sci. 1968, 23, 695–706. [Google Scholar] [CrossRef]
- Prosperetti, A.; Plesset, M.S. Vapour-bubble growth in a superheated liquid. J. Fluid Mech. 1978, 85, 349–368. [Google Scholar] [CrossRef]
- Liao, Y.; Lucas, D.; Krepper, E.; Rzehak, R. Flashing evaporation under different pressure levels. Nucl. Eng. Des. 2013, 265, 801–813. [Google Scholar] [CrossRef]
- Liao, Y.; Lucas, D. 3D CFD simulation of flashing flows in a converging-diverging nozzle. Nucl. Eng. Des. 2015, 292, 149–163. [Google Scholar] [CrossRef]
- Ye, T. Direct Numerical Simulation of a Translating Vapor Bubble with Phase Change. Ph.D. Thesis, University of Florida Digital Collections, Gainesville, FL, USA, 2001. [Google Scholar]
- Ishii, M.; Zuber, N. Drag coefficient and relative velocity in bubbly, droplet or particulate flows. AIChE J. 1979, 25, 843–855. [Google Scholar] [CrossRef]
- Walton, D.E. The evaporation of water droplets: A single droplet drying experiment. Dry. Technol. 2004, 22, 431–456. [Google Scholar] [CrossRef]
- Avdeev, A.A. Bubble Systems; Springer: Berlin, Germany, 2016. [Google Scholar]
- Lutovinov, S.Z. Investigation of Hot Water Discharge at Tube Rupture in Application to the Accident Sitation at Nuclear Power Plant. Ph.D. Thesis, Krzhizhanovsky Power Engineering Institute, Moscow, Russia, 1985. [Google Scholar]


| Conduction | ||
| Reference | Correlation | Note |
| [16] | analytical | |
| [17] | analytical | |
| [13] | analytical | |
| [18] | analytical | |
| [37] | empirical | |
| Convection | ||
| [22] | potential theory | |
| [56] | heuristic | |
| [58] | heuristic | |
| [42] | empirical | |
| Turbulence | ||
| [29] | surface renew theory | |
| [60] | empirical | |
| [59] | empirical | |
| [62] | empirical | |
| [61] | empirical |
| Case No. | error | |||
|---|---|---|---|---|
| 1 | ||||
| 2 | ||||
| 3 | ||||
| 4 | ||||
| 5 | ||||
| 6 | ||||
| 7 | ||||
| 8 | ||||
| 9 |
© 2018 by the authors. Licensee MDPI, Basel, Switzerland. This article is an open access article distributed under the terms and conditions of the Creative Commons Attribution (CC BY) license (http://creativecommons.org/licenses/by/4.0/).
Share and Cite
Liao, Y.; Lucas, D. Evaluation of Interfacial Heat Transfer Models for Flashing Flow with Two-Fluid CFD. Fluids 2018, 3, 38. https://doi.org/10.3390/fluids3020038
Liao Y, Lucas D. Evaluation of Interfacial Heat Transfer Models for Flashing Flow with Two-Fluid CFD. Fluids. 2018; 3(2):38. https://doi.org/10.3390/fluids3020038
Chicago/Turabian StyleLiao, Yixiang, and Dirk Lucas. 2018. "Evaluation of Interfacial Heat Transfer Models for Flashing Flow with Two-Fluid CFD" Fluids 3, no. 2: 38. https://doi.org/10.3390/fluids3020038