CO2 Injection Effect on Geomechanical and Flow Properties of Calcite-Rich Reservoirs

1
Department of Civil and Environmental Engineering, University of Illinois at Urbana-Champaign, Urbana, IL 61801, USA
2
Institute of Environmental Assessment and Water Research, Spanish National Research Council (IDAEA-CSIC), 08034 Barcelona, Spain
3
Associated Unit: Hydrogeology Group (UPC-CSIC), 08034 Barcelona, Spain
*
Author to whom correspondence should be addressed.
Fluids 2018, 3(3), 66; https://doi.org/10.3390/fluids3030066
Submission received: 1 August 2018
/
Revised: 27 August 2018
/
Accepted: 5 September 2018
/
Published: 14 September 2018
(This article belongs to the Special Issue Fundamentals of CO2 Storage in Geological Formations)
Abstract
:Geologic carbon storage is considered as a requisite to effectively mitigate climate change, so large amounts of carbon dioxide (CO2) are expected to be injected in sedimentary saline formations. CO2 injection leads to the creation of acidic solution when it dissolves into the resident brine, which can react with reservoir rock, especially carbonates. We numerically investigated the behavior of reservoir-caprock system where CO2 injection-induced changes in the hydraulic and geomechanical properties of Apulian limestone were measured in the laboratory. We found that porosity of the limestone slightly decreases after CO2 treatment, which lead to a permeability reduction by a factor of two. In the treated specimens, calcite dissolution was observed at the inlet, but carbonate precipitation occurred at the outlet, which was closed during the reaction time of three days. Additionally, the relative permeability curves were modified after CO2–rock interaction, especially the one for water, which evolved from a quadratic to a quasi-linear function of the water saturation degree. Geomechanically, the limestone became softer and it was weakened after being altered by CO2. Simulation results showed that the property changes occurring within the CO2 plume caused a stress redistribution because CO2 treated limestone became softer and tended to deform more in response to pressure buildup than the pristine rock. The reduction in strength induced by geochemical reactions may eventually cause shear failure within the CO2 plume affected rock. This combination of laboratory experiments with numerical simulations leads to a better understanding of the implications of coupled chemo-mechanical interactions in geologic carbon storage.
1. Introduction
Geologic carbon storage is deemed as a necessary action to reach the Paris Agreement goal of limiting temperature increase to 1.5 °C [1]. To this end, widespread deployment of carbon dioxide (CO2) capture and storage (CCS) projects will have to take place in the next decade. CCS projects can keep down the overall cost of mitigation options to achieve large reductions in CO2 emissions [2]. The Intergovernmental Panel on Climate Change (IPCC) report [3] states that CO2 storage in deep geological formations is one of the most promising techniques because gigatons of CO2 can be potentially injected and trapped underground. The most suitable storage reservoirs are permeable sedimentary formations, which can be either siliciclastic or carbonate and saturated with saline water [2]. While siliciclastic formations are seen to be quite stable to CO2 injection [4], carbonate formations could be highly reactive [5].
Recent laboratory studies show that the greatest changes in the mechanical response of reservoir formations are expected for carbonate-rich rock or rock with carbonate cement [6]. High-pressure CO2 injection induces CO2-brine-rock interactions in which geochemical reactions potentially lead to changes in hydraulic properties, i.e., porosity and permeability, and geomechanical properties, i.e., stiffness and strength of rock [7]. Bemer and Lombard [8] reported 1–2% increase in porosity for carbonate-rich wackestone from Lavoux formation altered in the presence of CO2. This resulted in a decrease in strength and elastic moduli of up to 20–30%. Similarly, Alam et al. [9] observed 2–3% increase in porosity in North Sea chalk treated with supercritical CO2 (scCO2), leading to a 2% increase in Biot coefficient, and hence a decrease in elastic rock stiffness. Vialle and Vanorio [10] measured the changes in elastic properties of both saturated and dry limestones and observed a gradual loss of strength upon injection, as testified by the continuous decrease in the dry P- and S-wave velocity (20–25%). The decrease was also accompanied by a relative increase in permeability (up to 500%) and porosity (up to 19%), while the change in microstructure was monitored over time via scanning electron microscopy. Grombacher et al. [11] explained the ultrasonic velocities reduction in different carbonate rocks subjected to CO2-rich water injection by the decrease in stiffness at grain contacts caused by dissolution that was observed through microimaging. However, the reduction rates of the bulk and shear moduli with injected pore volume decrease with increasing effective mean stress, which reduces the porosity and the reactive surfaces through compaction, so the effect of dissolution becomes less important [12].
Some other studies do not support the observations of significant decrease in strength and elastic properties of carbonates caused by CO2 injection. Sterpenich et al. [13] showed that for brine-saturated Lavoux limestone, scCO2 injection at 80 °C had a minor effect on microstructure (less than 1% calcite dissolution) and ultrasonic velocities. Liteanu et al. [14] observed the effect of water-weakening on Maastrichtian chalk, but the effect of scCO2 on rock deformation was negligible. This minor effect was also reported by Grgic [15]. Saaltink et al. [16] found through numerical simulations that calcite dissolution at the field scale within the CO2 plume is low. This weak interaction may be explained by the carbonate buffering effect on pH: The increase of pore fluid acidity due to CO2 dissolution into water causes dissolution of calcite, which consumes protons, leading to pH stabilization.
Relative permeability and retention curves are used to describe the multi-phase flow induced by CO2 injection in deep saline aquifers [17]. Specifically, the dissolution or precipitation of calcite may influence the pore structure and wetting and non-wetting procedures that occur in multi-phase flow. Bennion and Bachu [18] conducted comparative tests on relative permeability in various rocks including carbonates and provided a valuable data set to assess the fluid flow and distribution in two-phase flow. Zekri et al. [19] measured the relative permeability of limestones to evaluate the change in wettability of the porous media. The results showed that the scCO2 flooding tends to change the wettability of saturated limestones to a more water-wet condition. Additionally, relative permeability was used as a fitting parameter for the numerical model to simulate CO2 injection into a carbonate reservoir [20]. The simulation compared CO2 saturated water injection and pure scCO2 injection, concluding that the CO2 saturated water tends to affect the reservoir structure more actively than pure scCO2.
This paper aims to investigate how CO2 injection affects the properties of porous carbonate reservoirs. We first present the geometry of the considered problem and explain the numerical model that includes the changes in hydro-mechanical properties of a limestone when it is altered with CO2. Then, we describe the experimental techniques applied to saturate water-filled limestone with liquid CO2 and measure its hydraulic and mechanical response. Subsequently, we present the results of laboratory tests performed on a number of pristine and CO2 treated limestone specimens. Additionally, the numerical model that utilizes the laboratory data is used to evaluate the stability of carbonate reservoir and predict its long-term behavior. Finally, we discuss the findings and implications of this study and draw the conclusions.
2. Numerical Model
We modeled CO2 injection into a carbonate reservoir and investigated the effect of the changes in rock properties induced by geochemical reactions on the geomechanical response of the system. To this end, we considered the coupled hydro-mechanical problem, which implied solving simultaneously mass conservation of each phase and momentum balance. Mass conservation of each phase, neglecting the diffusive component, is expressed as [21]:
where φ is porosity, Sα is saturation of the α -phase, ρα is the density of the α -phase, t is time, qα is the volumetric flux, rα is the phase change term, and α is either CO2 rich phase, c, or aqueous phase, w. Here, evaporation of water into CO2 is neglected, i.e., rw = 0. Fluid properties, i.e., density and viscosity, are functions of both pressure and temperature.
The volumetric flux is given by Darcy’s law.
where k is intrinsic permeability, krα is the α -phase relative permeability, μα is its viscosity, pα is its pressure, g is gravity, and z is the vertical coordinate, which is positive upwards.
The saturation degree is a function of the capillary pressure. We adopt the van Genuchten model [22], which reads:
where pc is capillary pressure, p0 is entry pressure, and m is the shape parameter and
where Sl is liquid saturation, Srl is residual liquid saturation, and Smax is the maximum liquid saturation.
For the mechanical problem, assuming that inertial terms are negligible, the momentum balance of the porous media reduces to the equilibrium of stresses.
where σ is the total stress tensor and b is the body forces vector. A complete description of the hydro-mechanical formulation is provided in Appendix A in Reference [23].
We assume that the medium behaves in a brittle manner and assess its stability by adopting the Mohr-Coulomb failure criterion
where τ is the shear stress, σn′ is the normal effective stress, c′ is cohesion, and ϕ′ is the friction angle.
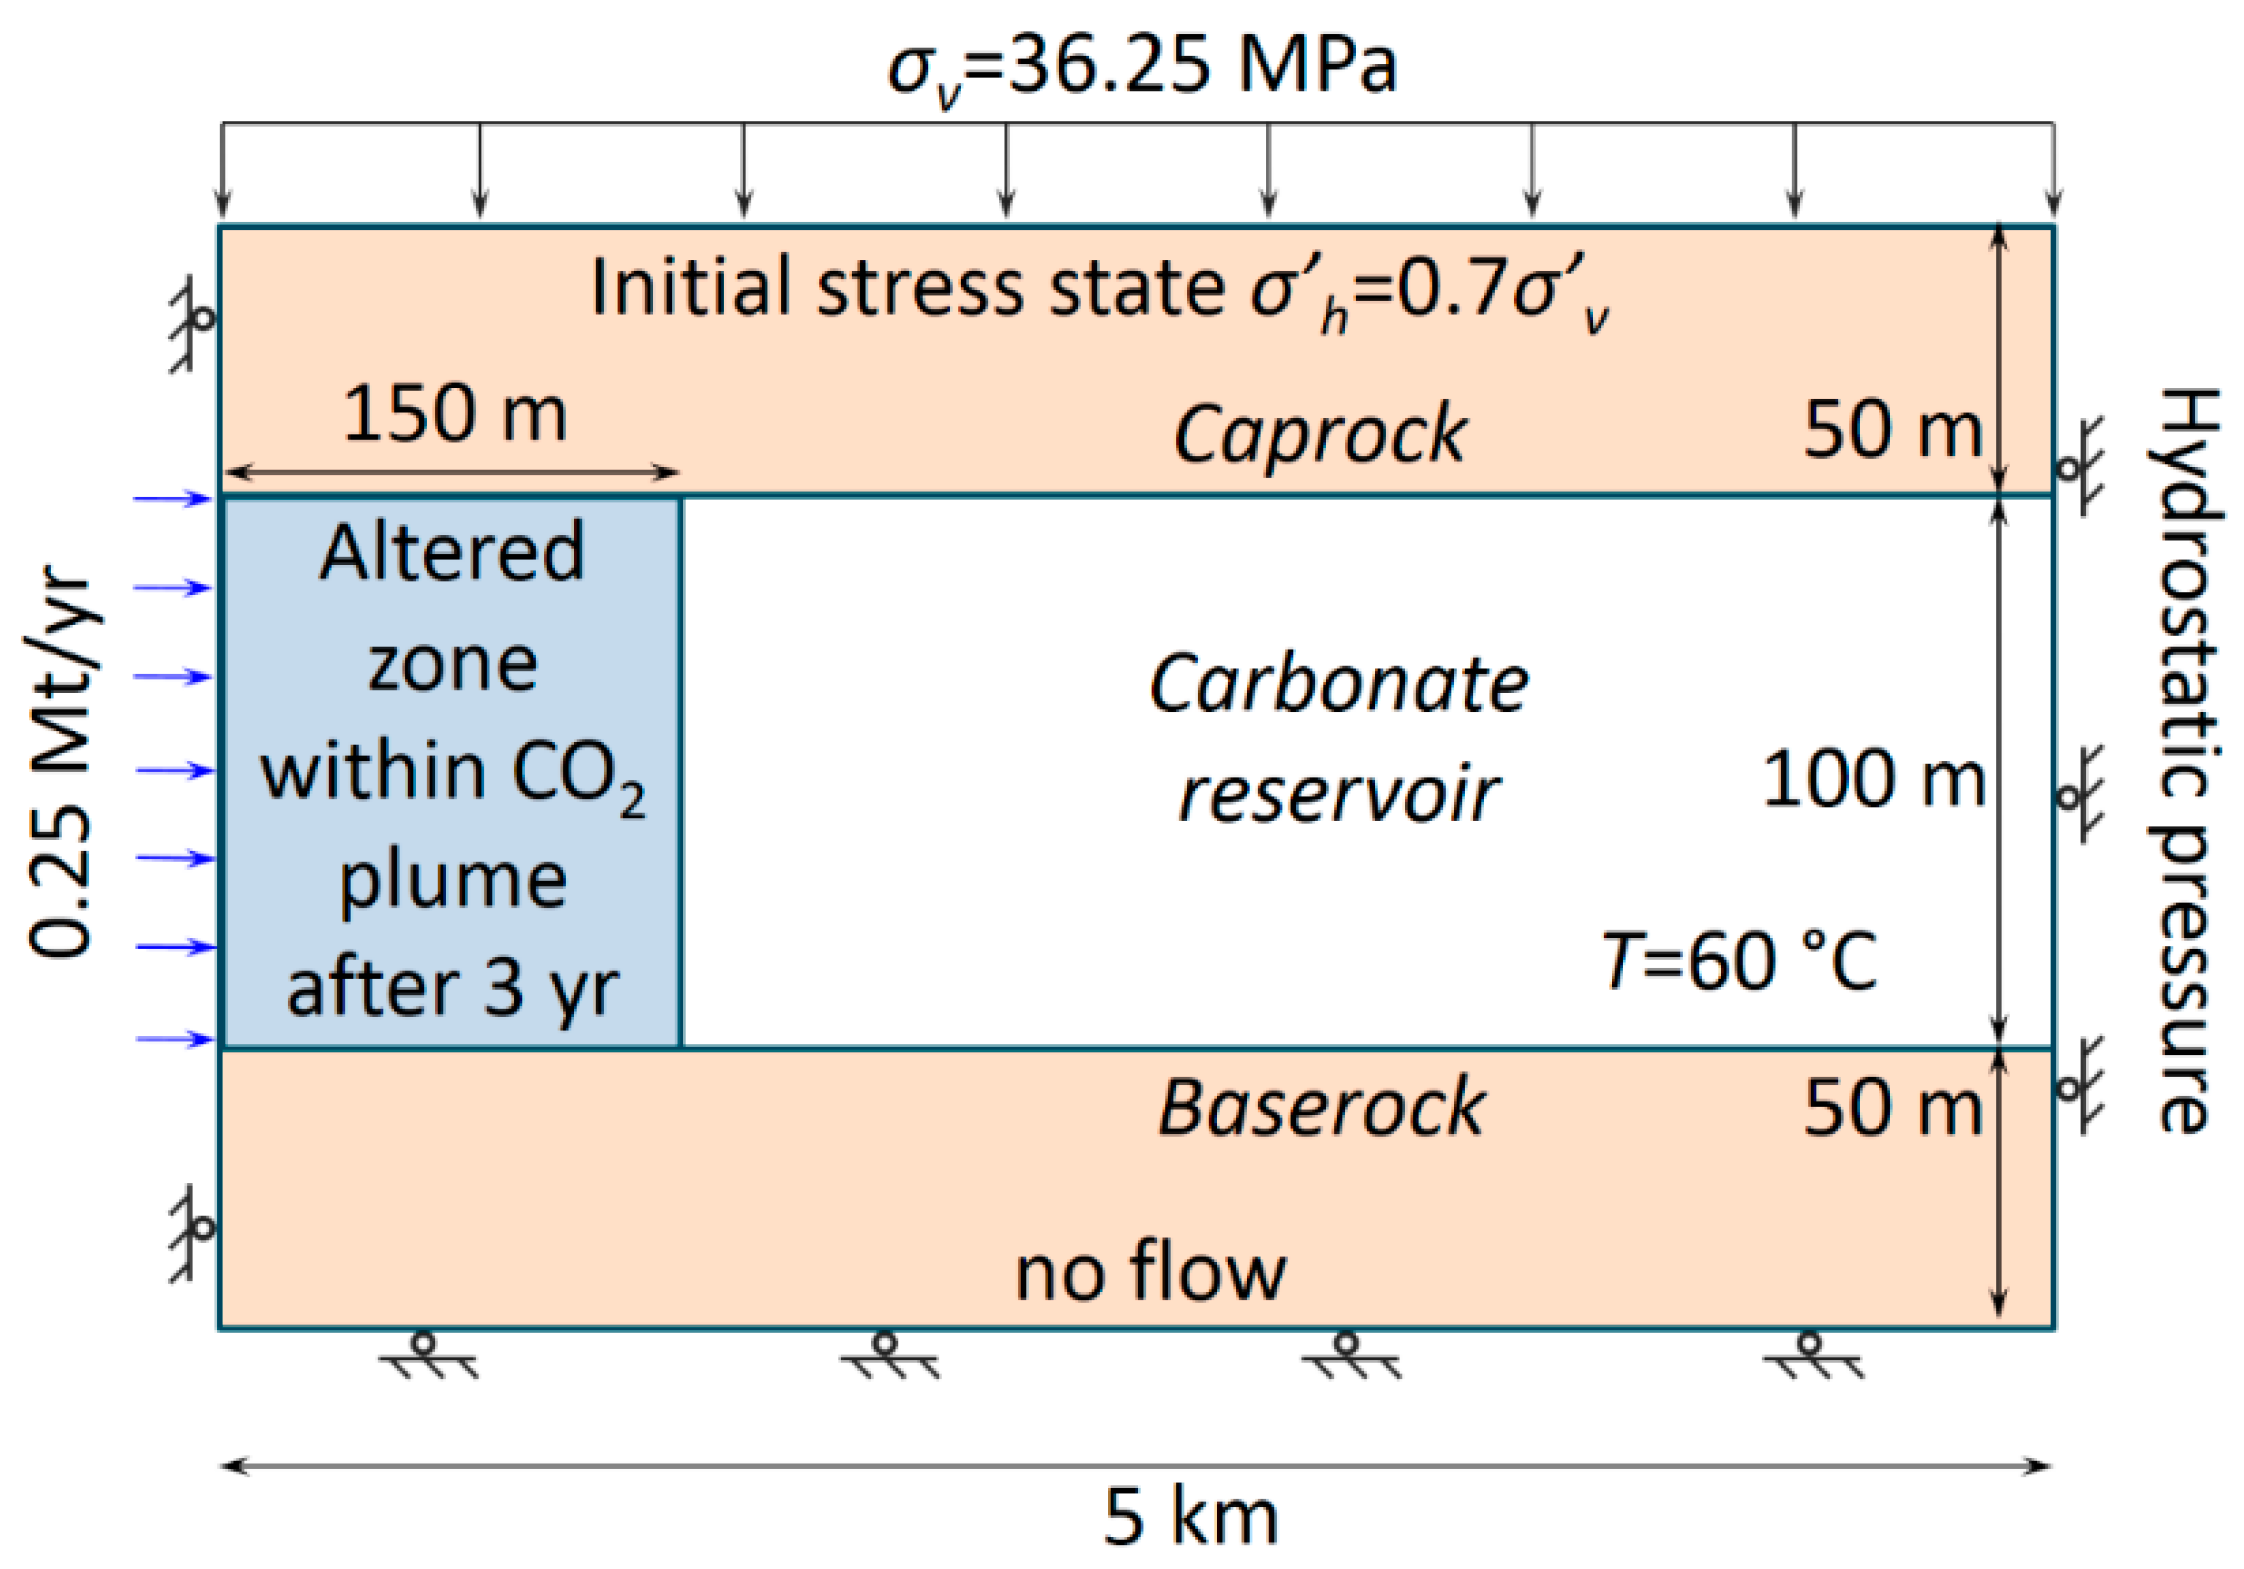
We considered a 100 m-thick carbonate reservoir that is overlaid and underlain by a 50 m-thick low-permeable formation (Figure 1). The top of the reservoir is placed at 1500 m. CO2 is injected through a vertical well, and, thus, the model is axisymmetric. The injection rate is of 0.25 Mt/year and injection is performed during 3 years. The model extends radially for 5 km. A constant pressure equal to hydrostatic is imposed in the outer boundary. No displacement perpendicular to the boundary is imposed on the lateral and lower boundaries, and a constant overburden equal to 36.25 MPa is imposed on the top boundary. We considered a normal faulting stress regime, with the vertical stress following a lithostatic stress of 25 MPa/km and the horizontal total stresses equal to 0.65 times the vertical total stress. The model is assumed isothermal, with a temperature of 60 °C, which corresponds to a surface temperature of 10.5 °C and a geothermal gradient of 33 °C/km.
The material properties were measured in the laboratory (see Section 3). While the properties of the reservoir (Apulian limestone) are measured in this study (see Section 4 for results), the properties of the caprock (Opalinus clay—Jurassic shale from Switzerland) have been measured in previous studies and are reported in Table 1. Due to nanoDarcy scale permeability, the response of the caprock is assumed to be undrained during the time of injection [24,25]. Given the relatively low permeability of the reservoir (~10−15 m2, see Section 4), viscous forces dominate during the injection phase, which leads to a plug-like advance of the CO2 plume [26,27]. After a 3-year injection period, the CO2 plume reached a radius of 150 m. To assess the effect of the property changes on the geomechanical response of the rock, we ran two models, one in which the whole reservoir had the properties of the pristine material and another one in which the cylinder of 150 m in radius around the injection well had the properties of the altered material as a result of its interaction with CO2. We simulated this hydro-mechanical problem using the fully coupled finite element numerical code CODE_BRIGHT [28], which was extended to be applied to CO2 injection [29].
3. Experimental Methods
3.1. Material
Apulian limestone (or Calcarenite) was selected for the laboratory study of CO2 injection in carbonate reservoirs because of the reported effect of aqueous fluids on its mechanical behavior [30] and weak stress-dependence of its properties [31]. It is a glauconitic fossiliferous limestone, showing a pale orange to grayish color, composed of mostly calcite (95–98%), with quartz, plagioclase, glauconite, and iron oxide. The rock matrix is supported with allochems, which chiefly comprises fragmental calcitic foraminifera that range from approximately 0.05 mm to 1 mm (rare) in maximum dimension and are cemented with calcitic mud (micrite). The P-wave velocity varies just by 2% in different directions (from 2.52 km/s to 2.57 km/s), meaning that the limestone is almost isotropic [31].
Rock interconnected porosity was measured by vacuum saturation technique and was found to be 0.35. This measurement was confirmed by mercury intrusion porosimetry test that provided not only the volume of the accessible pores but also the retention (or capillary pressure) curve shown in Figure 2. Suction was the difference between non-wetting and wetting fluid pressures. Supercritical CO2 retention curve for water-saturated Apulian limestone was calculated from its pore size distribution by taking CO2–water contact angle in calcite to be 40° and interfacial tension of 0.032 N/m [32]. This allowed for the evaluation of CO2 entry pressure (0.02 MPa) and van Genuchten [22] parameter m = 0.42. We assumed that this parameter did not change after CO2 treatment.
3.2. Hydraulic Properties
The permeability was measured on limestone cores (50 mm in diameter and 100 mm long) installed inside a core flooding device that was connected to three syringe pumps: one syringe pump (70 MPa, SANCHEZ, Frépillon, France) for confining pressure applied with hydraulic oil and two other syringe pumps (25 MPa, Teledyne ISCO, Lincoln, NE, USA) for upstream and downstream pore water pressure control (Figure 3a). The confining pressure pump could be operated in three different regimes: pressure control (50 kPa accuracy), volume control (0.2 mL accuracy), and flow control (0.1% of setpoint). The pore water pressure pumps could be controlled in two regimes: pressure control (25 kPa accuracy) and flow control (0.5% of setpoint). The lateral stress (confining pressure) was the major principal stress in this setup, while the axial stress was provided through a passive restraint (fixed platens) and calculated from generalized Hooke’s law, σax = 2ν σlat with ν = Poisson’s ratio of rock. A steady-state flow was implemented by assigning different pressures for upstream and downstream syringe pumps. Pure deionized water with viscosity of 0.001 Pa∙s was used in these experiments. Assuming that the viscosity of pore fluid was constant (all tests were performed at T ≈ 22 °C), and measuring the inflow and outflow fluid pressure difference Δp, inflow and outflow fluid volumes (ΔV in steady-state flow) during time step Δt, the intrinsic permeability (k) was calculated as:
where L and A are the length and cross-section area of the specimen, respectively. The flow occurs in the horizontal direction, so the effect of gravity is disregarded.
To induce a two-phase flow in the specimen, another syringe pump (50 MPa, Teledyne ISCO, USA) was connected in parallel with the upstream pore pressure pump. CO2 was injected in liquid state (7 MPa, 22 °C, 7.7 × 10⁻⁵ Pa∙s viscosity), just 1 MPa above the transition pressure between liquid and gaseous phases. Liquid CO2 injection conditions are favorable to minimize the injection cost and are usually encountered in CO2 injection wells within the first 1–2 km depth [29]. The mean stress was preserved at 12 MPa, and the pore pressure was 6.7 MPa (effective mean stress P’ = 5.3 MPa). The injected CO2 initially dissolved in water, and additional CO2 was subsequently injected. This procedure was repeated until saturation of water with CO2 was reached and the latter one started flowing as a separate fluid. The CO2 pump and the upstream water pump were operated by flow control, and the fraction of the two fluids in the two-phase flow could be represented by the ratio of the two flow rates of the two pumps. The flow rates of the two pumps (upstream water–CO2) were controlled as 5–0 mL/min, 4–1 mL/min, 2.5–2.5 mL/min, 1–4 mL/min, and 0–5 mL/min, where the sum of the two flow rates were always constant and equal to 5 mL/min. Each pair of the flow rates represented the ratio of the volume of two fluids in the two-phase flow (water: CO2), such as 100:0%, 80:20%, 50:50%, 20:80%, and 0:100%. The flow rates 5–0 mL/min and 0–5 mL/min were related to one-phase flow and measurements of permeability (k) for water (α = w) and CO2 (α = c), respectively.
Here ΔVα is the change of the volume of α-phase in the syringe pump, and Δpα is the pressure difference between the α-phase and the downstream pressure. Δpα is changing at the beginning of injection and then reaches a constant value, so the relative permeability is reported for steady flow. For this study, the intrinsic permeability and relative permeability curves of water and CO2 were measured for pristine and CO2 treated specimens. For the pristine specimens, the conducted tests should be short term (a couple of hours), such that the influence of the acidic CO2–water mixture on limestone does not affect the results of relative and absolute permeability tests.
3.3. CO2 Saturation and Treatment
Proper assessment of relative permeability required evaluation of the degree of saturation of two fluids, water and CO2, during the relative permeability tests. Recent studies on relative CO2 permeability are based on the calculation of water and CO2 saturation using X-ray computed tomography (CT) scanning [18,33,34,35]. Here, we propose a method to calculate the saturation of water and CO2 from the changes in (undrained) mechanical response of the rock during the injection of the second fluid.
During the relative permeability tests, two fluids were continuously injected at a constant flow rate until their pressures reached equilibrium. After measuring relative permeability, the valves on the upstream and downstream channels were closed simultaneously, setting the specimen in an undrained (no flow) condition. For the core flooding device, the increment in confining pressure was not equal to the mean stress like it would be in a conventional triaxial apparatus. Specimen deformation was limited in the axial direction (εax = 0), and from generalized Hooke’s law, the change in the mean stress could be expressed as ΔP = (2 + 2νu)Δσlat/3, where νu is the undrained Poisson’s ratio of rock, since the specimen was deforming under the undrained condition. The Skempton’s B coefficient [36] was then measured by recording the change in pore pressure (Δp) caused by the increase in the mean stress (ΔP).
The effect of pore water lines that connect pressure transducers to the specimen (Figure 3a) was taken into account through the correction factor Ccor [37], which appeared to be very small for core flooding device (0.5 × 10⁻²), so the applied correction was within the accuracy of our B measurements (±0.005). As shown in Equation (9), Skempton’s B coefficient can also be expressed through poroelastic parameters [38], where K is the drained bulk modulus, Ks′ is the unjacketed bulk modulus, Ks′′ is the unjacketed pore modulus, and Kf is the bulk modulus of the saturating fluid (Kw ≈ 2.3 GPa for water). Since the fluid in the pores consists of water and CO2, its bulk modulus Kf depends on the degree of saturation. For each test stage that involved differential flows of water and CO2, a sufficient amount of fluid (a few pore volumes) needed to be flushed through the specimen to guarantee that the outflow fluid had the same ratio of fluid phases. Subsequently, the residual degree of saturation of water and CO2 could be measured. If all poromechanical parameters and correction factors are known, Kf can be calculated for the mixture of two fluids (Kmix). The bulk modulus of liquid CO2, Kc is calculated from the knowledge of its density and P-wave velocity (ρc = 769.3 kg/m3, Vpc = 302.1 m/s) at testing conditions, T = 22 °C and p = 7 MPa [39].
At each stage of relative permeability test, the bulk modulus of the mixed fluid Kmix (=Kf) can be calculated from Equation (9). Then, knowing the bulk modulus of water and CO2, the corresponding degree of water saturation Sw can be obtained from Wood’s formula [40].
Carbonate reservoirs are reported to react with the injected CO2 when it mixes with the aqueous pore fluid. In this study, after measuring the properties of pristine specimen, such as porosity, intrinsic permeability, relative permeability, and Skempton’s B coefficient, we injected CO2 in the specimen and treated it for three days (72 h). High porous, weakly-bonded Apulian limestone seemed to be quickly affected by acidic water-CO2 mixture when left under the condition of no outward flow. It was observed that the pressure of the mixture of CO2 and water had a tendency to decrease towards the boundary of the liquid state with gas state (~6 MPa at 22 °C). Therefore, the upstream CO2 pressure was controlled by the CO2 pump to preserve it at 7 MPa. After CO2 treatment, we flushed the specimen with water and periodically emptied the downstream pump until no CO2 was left in the downstream fluid. Additionally, we released the pore pressure in the specimen to get rid of the trapped CO2 and then fully saturated the specimen with only water. After that, we repeated the relative permeability tests for the CO2 treated specimen for comparison.
3.4. Geomechanical Properties
The elastic and strength properties of Apulian limestone were measured within 3.5 MPa Global Digital Systems (GDS) triaxial cell that allowed testing of 50 mm in diameter and 90–110 mm long soil and rock cores. Three 3.5 MPa pressure pumps provided the control of the confining pressure and input and output pore pressures. The pumps could work in either pressure (1 kPa accuracy) or volume control (1 mm3 accuracy) regimes. The triaxial cell was fixed on the bottom piston inside the 50 kN load frame and axial load was applied by the passive restraint on the top of the frame through the movement of the piston (Figure 3b). Two additional pore pressure transducers were installed at the input and output pore pressure lines to provide measurements of the upstream and downstream pore pressure in flow and undrained mechanical tests. Measurements of axial and lateral specimen deformation were conducted by attaching the set of three Linear Variable Differential Transformers (LVDTs), two axial and one lateral, to the rubber membrane (1 mm thick) around the specimen (Figure 3b).
Constant Terzaghi effective mean stress, P’ = P − p = 1 MPa, was applied by preserving the same difference between the mean stress (=confining pressure) and pore pressure. For all geomechanical experiments, the specimens were fully saturated with water. Water saturation was achieved by a back pressure saturation technique. Initially, water was flushed through the specimen until the outlet fluid volume equalized with the injected (inlet) volume. The outlet valve was then closed and pore (back) pressure was gradually increased while preserving the effective mean stress constant. At each stage of injection, Skempton’s B coefficient was measured. The back pressure saturation procedure was stopped when the measured B-value became constant [41]. After that, the permeability of the specimen was measured from Equation (7) when the steady-state flow through the specimen was established.
The drained condition was developed by imposing a constant pressure on the pressure controllers connected to the specimen. The elastic parameters, such as Young’s modulus (E) and Poisson’s ratio (ν), were measured during the application of axial load with the axial strain rate equal to 10−5/s. The LVDTs attached to the specimen provide the calculation of axial and lateral strains. The slope of the linear (elastic) part of axial stress—axial strain curve provided the value of Young’s modulus (E). The relationship between the axial and (negative) lateral strains allowed for the calculation of Poisson’s ratio (ν). If the axial loading was continued until reaching the peak load, the strength characteristics of the rock were evaluated. Performing strength tests at different effective lateral stresses and obtaining a few data points for axial stress at failure, provided the evaluation of the strength characteristics of rock, e.g., cohesion c′ and friction angle φ′ if Mohr-Coulomb failure criterion is adopted (Equation (6)) with τ = (σax − σlat)/2 and σn′ = (σax + σlat)/2. After the strength test, every specimen was trimmed to a cylindrical shape with a known volume and vacuum saturation method was applied to measure the porosity of treated rock.
4. Results
We measured the intrinsic and relative permeability, poroelastic properties, and strength properties of Apulian limestone on six pristine and four CO2 treated specimens. The elastic properties and permeability of the pristine specimens were consistent between all the specimens and have little stress dependence, so we reported them only for one test (Calc-0). CO2 treated specimens (Calc-1 to Calc-4) have some variation in their properties (Table 2).
4.1. Permeability and Porosity
Permeability and porosity were measured for pristine and CO2 treated Apulian limestone. While pristine specimens had an intrinsic permeability of 9 × 10⁻¹⁵ m2 at P’ = 1 MPa, the CO2 treated rock showed a decrease in permeability to 5–6 × 10⁻¹⁵ m2. This decrease in permeability may be related to the observed porosity variation, which was reduced from 0.35 to 0.34 when specimens were treated with CO2. Additionally, porosity measurements on 10 mm thick discs cuts from the upstream and downstream ends of the specimen were performed for specimens Calc-3 and Calc-4. The results showed that the porosity for the upstream part was 0.37–0.38, whereas the downstream part porosity was 0.28–0.30.
4.2. Relative Permeability and Saturation
Results of the relative permeability tests were plotted as a function of the degree of saturation evaluated from compressibility of pore fluid Kf (Equation (11)). Kf is calculated from the measurements of Skempton’s B coefficient and knowledge of poroelastic properties from Equation (9) (see Section 4.3). For 100% water saturation, Skempton’s B coefficient is equal to 0.55. As the portion of CO2 in the two-phase flow increased, the B coefficient decreased significantly, giving values of 0.18 (water: CO2 = 80:20), 0.13 (water: CO2 = 50:50), 0.10 (water: CO2 = 20:80), and decreasing down to 0.06 (water: CO2 = 0:100) for pure CO2 flow. These tests were performed under Terzaghi effective mean stress equal to P’ = 5 MPa. For pristine Apulian limestone, the relative permeability of water decreased from 1 to 0 for a reduction in the water saturation from 1.0 to 0.39 (Figure 4a). The relative permeability of CO2 increased with the decrease in water saturation, but the increase rate of the relative permeability to CO2 was much smaller, reaching only a value of approximately 0.1. For CO2 treated limestone, the change in relative CO2 permeability was insignificant (Figure 4b). However, the relative water permeability turned from a quadratic to a quasi-linear function of water saturation degree. Additionally, the maximum degree of CO2 saturation increased from 0.61 to 0.66 in CO2-treated limestone. We acknowledge that an even higher degree of CO2 saturation could be achieved if the controllers with higher maximum flow rates are used.
The obtained relative permeability curves are fitted as power-law functions of the degree of saturation, similarly to the Brooks–Corey model [42].
where, Se is the saturation parameter from Equation (4), and Nw and Nc are the exponent coefficients for water and CO2, respectively. Note that Nw value for Apulian limestone changes from 2.1 to 1.2 after CO2 treatment (Figure 4).
4.3. Geomechanical Properties
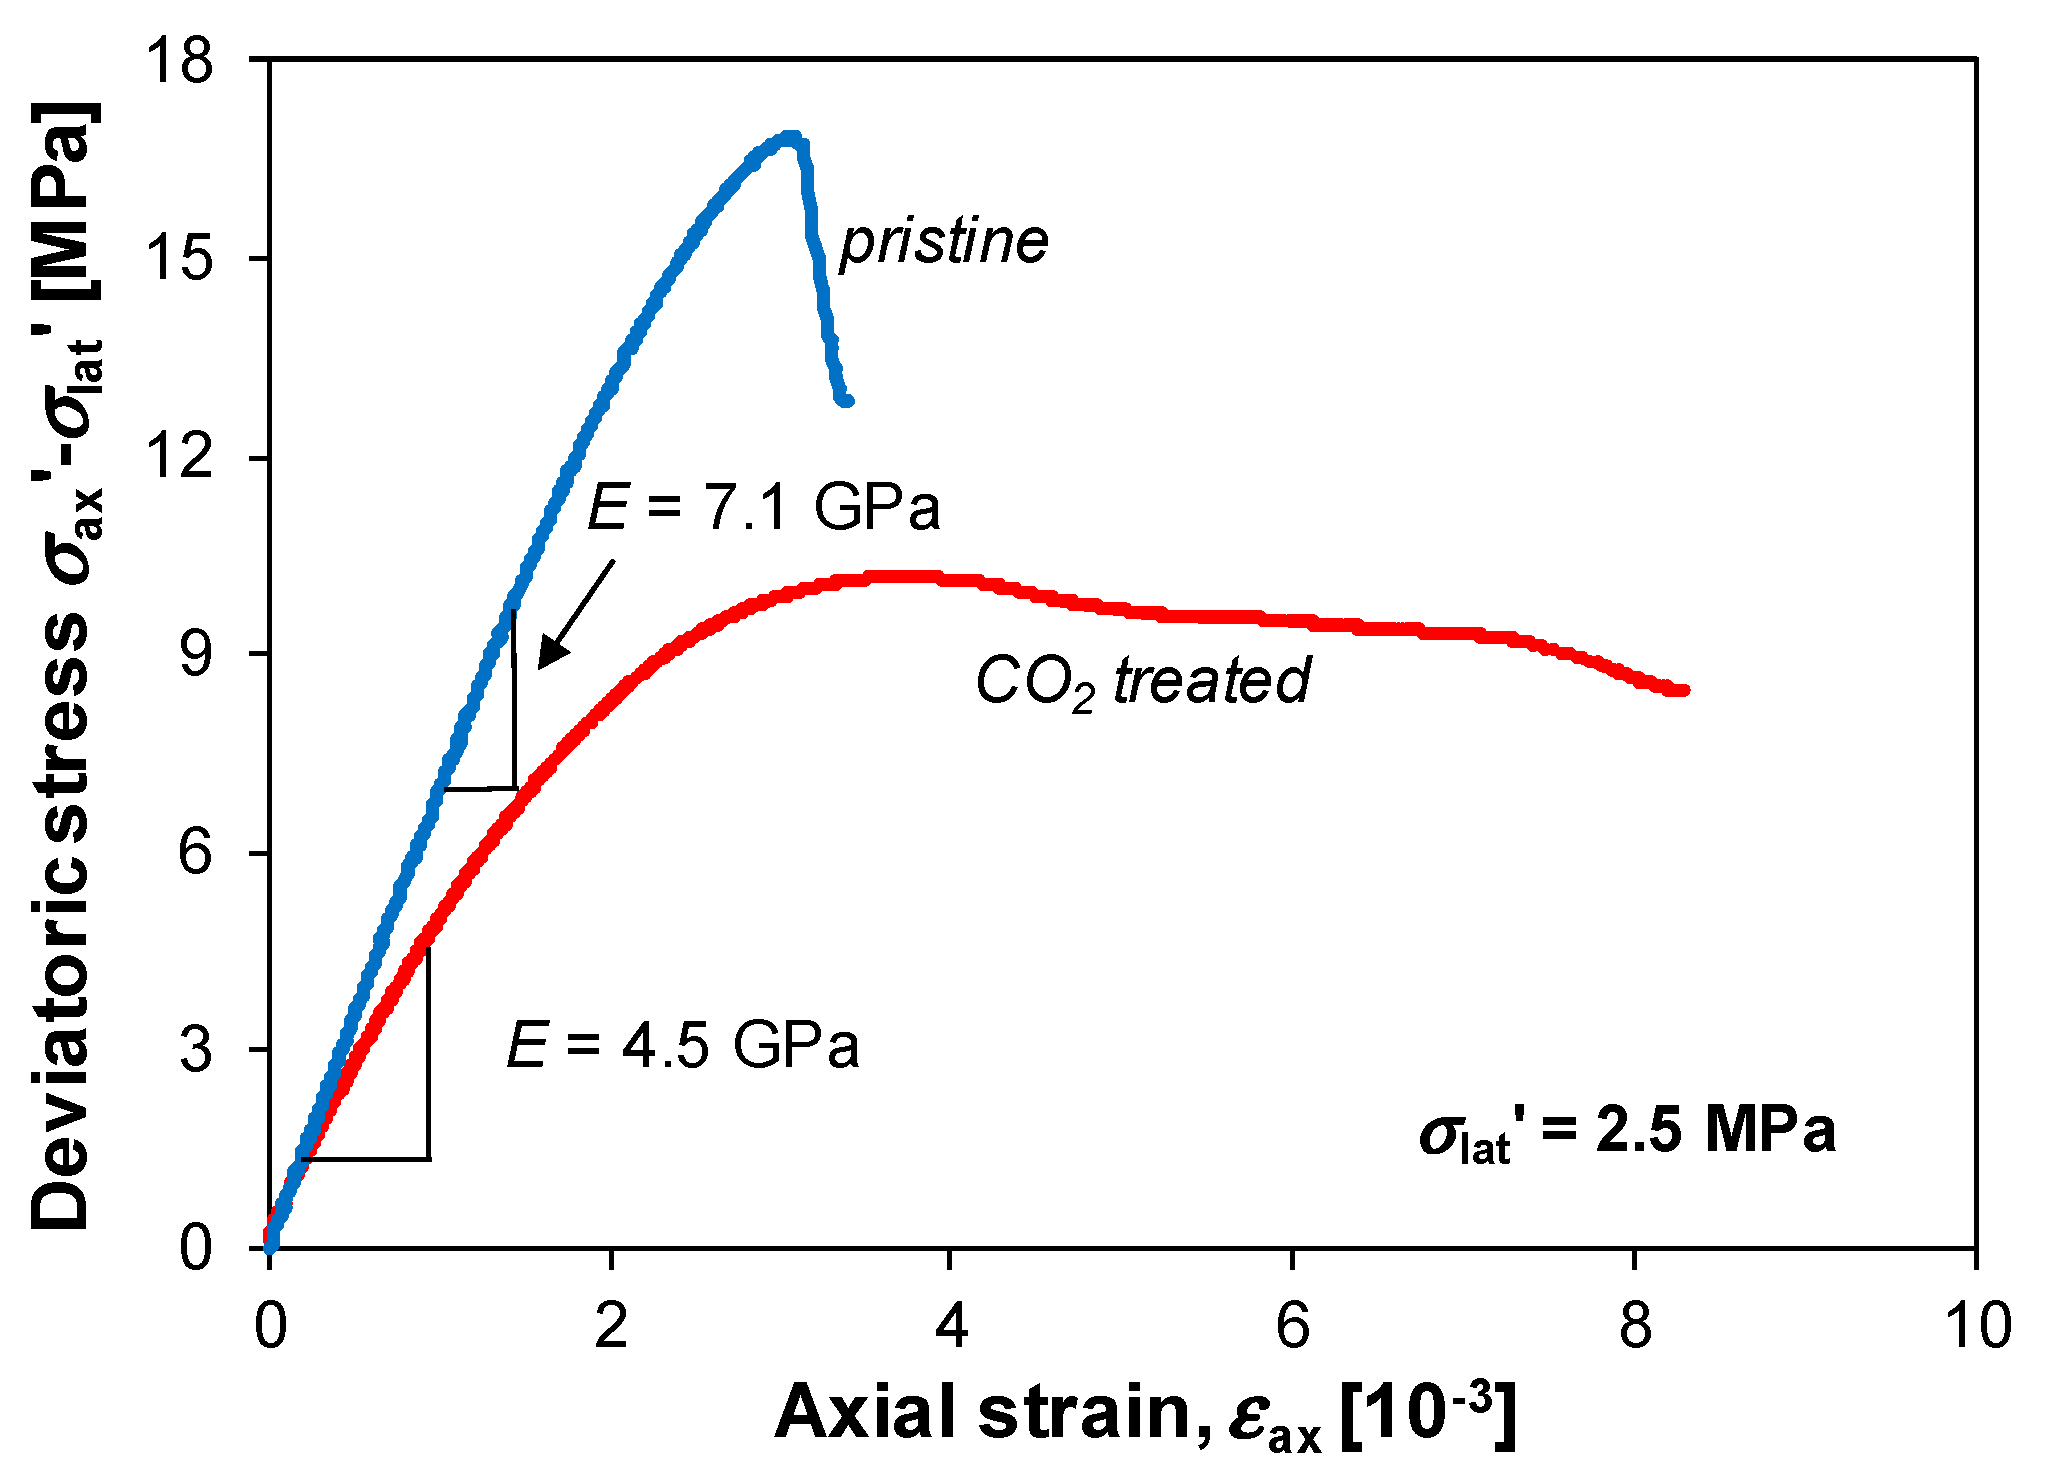
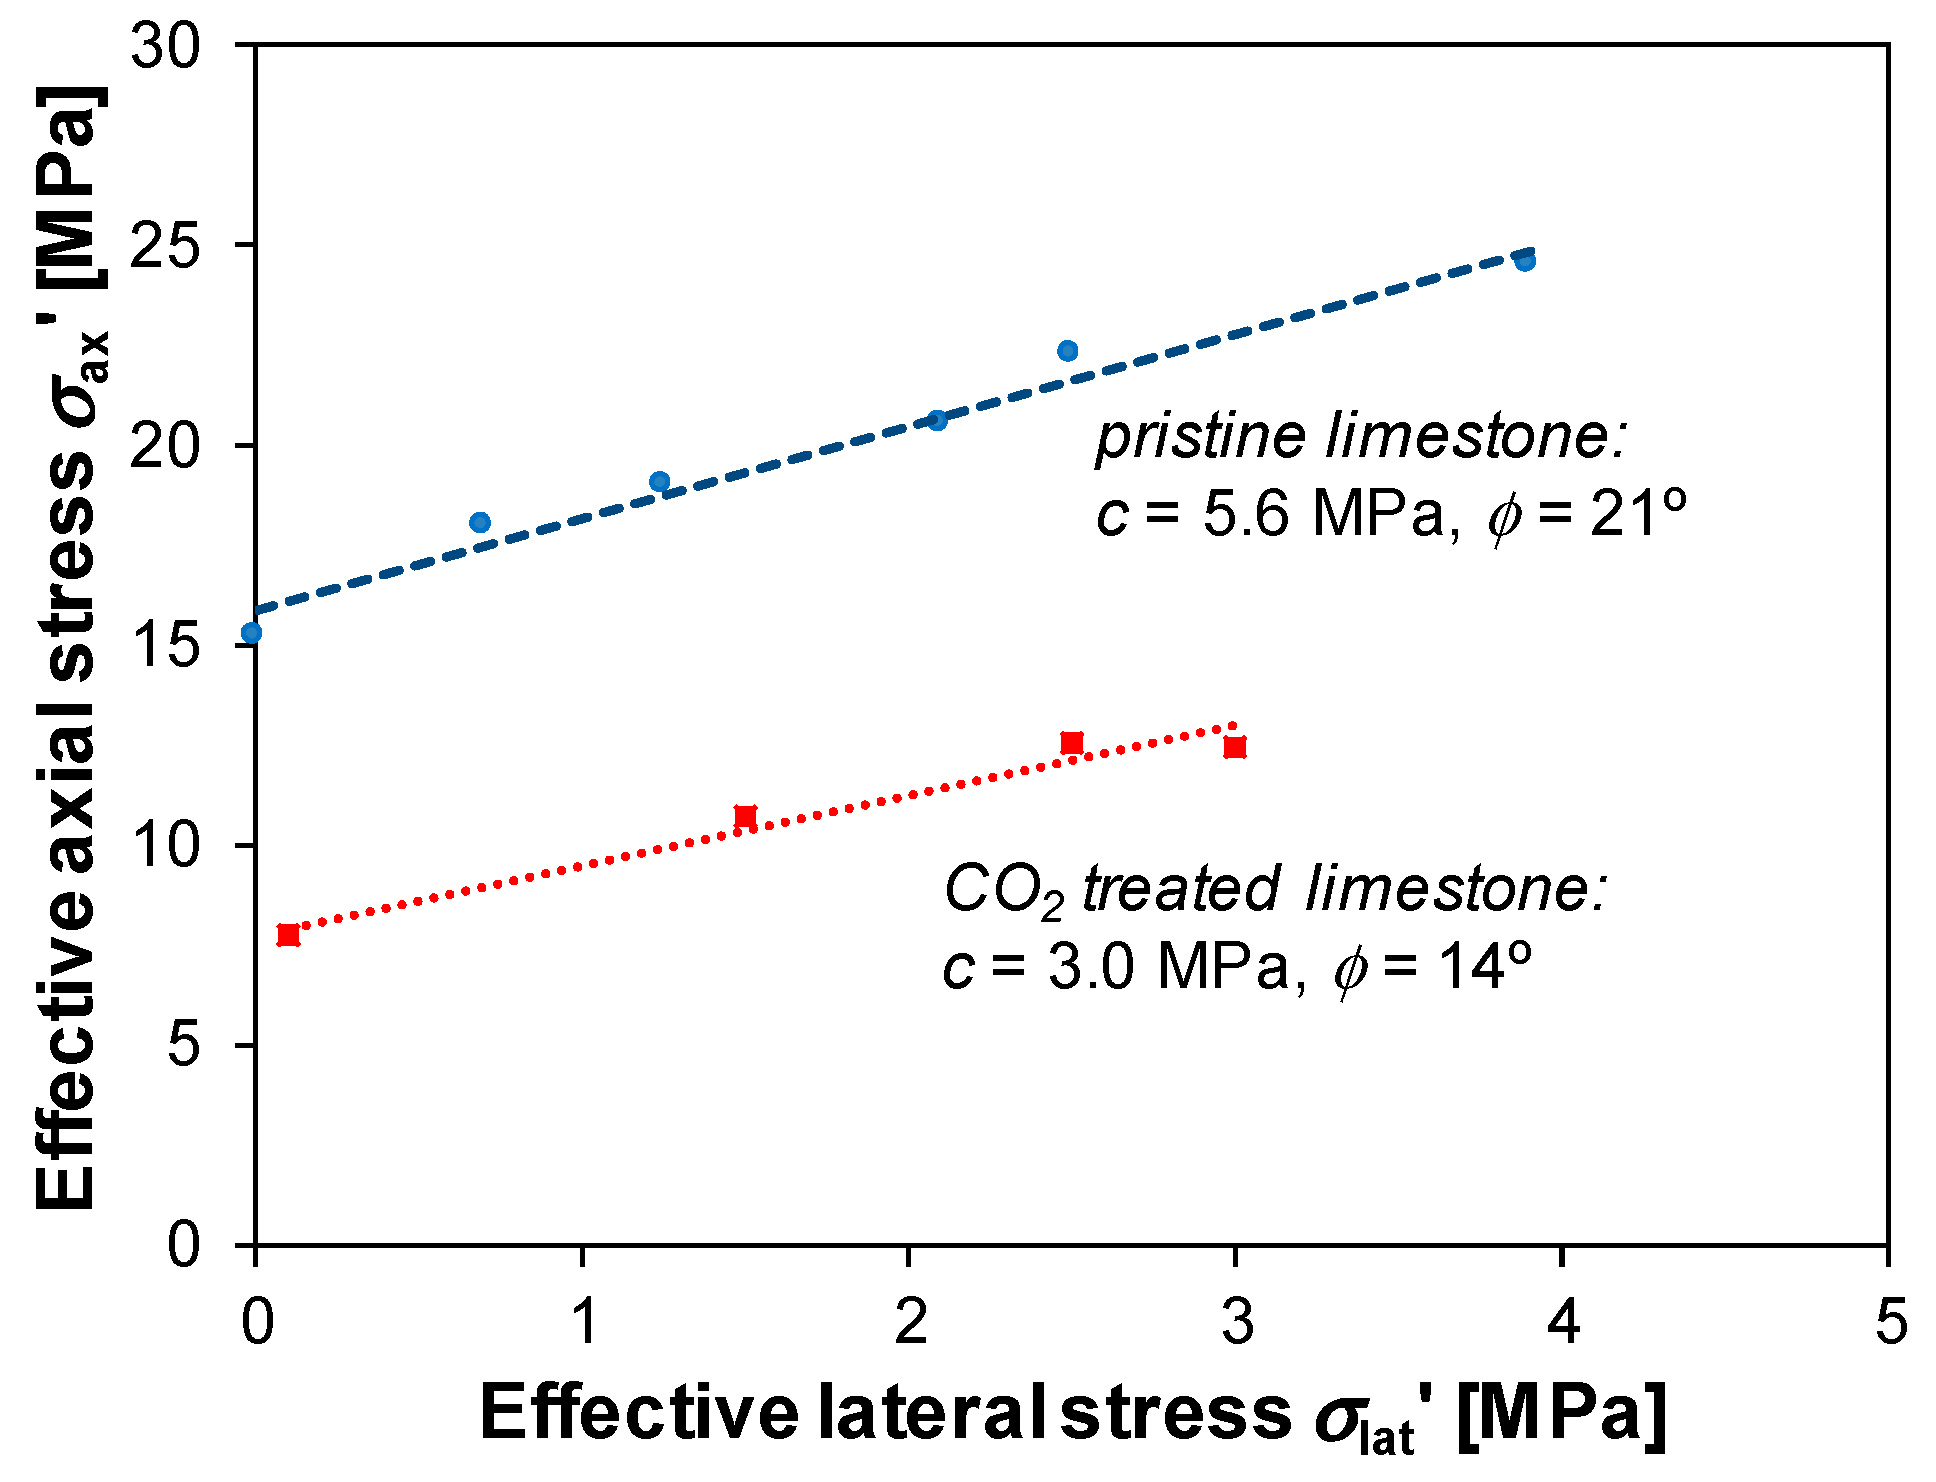
Conventional triaxial tests were conducted on both pristine and CO2 treated Apulian limestone and the results of the experiments conducted at σlat′ = 2.5 MPa are shown in Figure 5. Young’s modulus E decreased from 7.1 GPa to 4.5 GPa and also the deviatoric stress (=axial stress–lateral stress) at failure decreased from 17.1 MPa to 9.2 MPa after CO2 treatment. Measurements of Poisson’s ratio with lateral LVDT displacement were not successful on treated specimens, so it was evaluated for specimens Calc-3 and Calc-4 from the ultrasonic wave velocity (“dynamic”) measurements. P- and S-wave velocities (cp, cs) measured before (2.55 km/s, 1.46 km/s) and after (2.38 km/s, 1.40 km/s) treatment show that Young’s modulus decreased by 20%, but Poisson’s ratio presents little changes due to CO2 injection, so the constant value, ν = 0.25, was used in the numerical model (Table 3). Obviously, the inhomogeneity of pore space distribution caused by injection may produce local changes in Poisson’s ratio that need to be assessed from local strain measurements. Undrained Poisson’s ratio νu was calculated from poroelastic relationship [38] to be 0.36. The bulk modulus K = 4.7 GPa for pristine rock and 3.0 GPa for treated limestone. Ks′ of pristine rock was measured to be 42.9 GPa [31]. Here, we assumed that the solid bulk properties of the rock did not change after treatment, so Ks′ remains the same. Additionally, since Apulian limestone is a monomineralic rock, it is assumed that Ks′ = Ks′′. The strength tests provided the cohesion of pristine rock as c′ = 5.6 MPa and the friction angle as φ′ = 21°. After CO2 treatment, both the cohesion and friction angle decreased to c′ = 3.0 MPa and φ′ = 14°, respectively (Figure 6).
4.4. Numerical Results
The changes in Apulian limestone properties as a result of interaction with CO2 affect the hydro-mechanical response of the reservoir-caprock system. Even though laboratory measurements were not performed at representative conditions, they still can be used for the demonstration of CO2 injection effect on carbonate reservoirs, especially considering weak stress-dependence of Apulian limestone properties [31].
On the one hand, the CO2 plume dynamics and pore pressure evolution were slightly affected by the skin effect that results from the local reduction in permeability occuring within the CO2 plume. This permeability reduction around the injection well caused a higher pressure buildup that lead to a slightly steeper CO2-brine interface at early times of injection (during the first few months). Nevertheless, since the permeability reduction was local, the effective permeability of the reservoir became equal to that of the intact rock in the long term [43]. Thus, pressure buildup eventually became the same as if there were no local permeability reduction around the injection well [44,45], leading to a practically identical CO2 plume shape after 3 years of injection (Figure 7). The long-term pressure buildup at the injection well was 4.3 MPa. On the other hand, contrary to the transient effect of the change in the hydraulic properties of the reservoir within the CO2 plume, the effect of the changes in the geomechanical properties is permanent.
Figure 8 shows the changes in reservoir and caprock stability, in terms of mobilized friction angle, with distance to the injection well. The mobilized friction angle is the angle of the tangent to the Mohr’s circle, considering that there is no cohesion. Rock stability was clearly affected by the changes in Apulian limestone stiffness within the CO2 plume, which extended laterally for 150 m after 3 years of injection. These changes were caused by the limestone becoming softer while interacting with CO2. As a result, the rock within the CO2 plume expanded more in response to pressure buildup, than the rock outside the plume. However, the expansion of the rock within the CO2 plume was highly constrained laterally by the stiffer rock around it. This constraint on deformation lead to a higher increase in the horizontal total stresses than in the case where the reservoir was homogeneous. Additionally, to satisfy equilibrium of stresses, an increase in the vertical stress occurred within the zone affected by CO2 plume, especially at the CO2-brine interface, where shear stresses concentrate as a result of the stiffness contrast between the altered and intact rock. These stress changes caused a slight rotation of the stress tensor in the vicinity of the CO2-brine interface. As for the effect on the stability within the reservoir, the stress changes that occurred within the altered rock inside the CO2 plume caused a lower decrease in stability than when no changes in the geomechanical properties were accounted for.
The situation in the caprock was reversed, leading to a higher decrease in stability above the CO2 plume when the changes in the geomechanical properties were accounted for. This is a consequence of the stress redistribution that occurred as a result of the increase in the vertical stress within the CO2 plume to satisfy stress equilibrium. Since the overburden is constant, the increase in the vertical stress inside the CO2 plume caused a decrease in the horizontal stresses outside it. This geomechanical response is analogous to the one that takes place when cooling occurs around the injection well, but with the opposite sign [29].
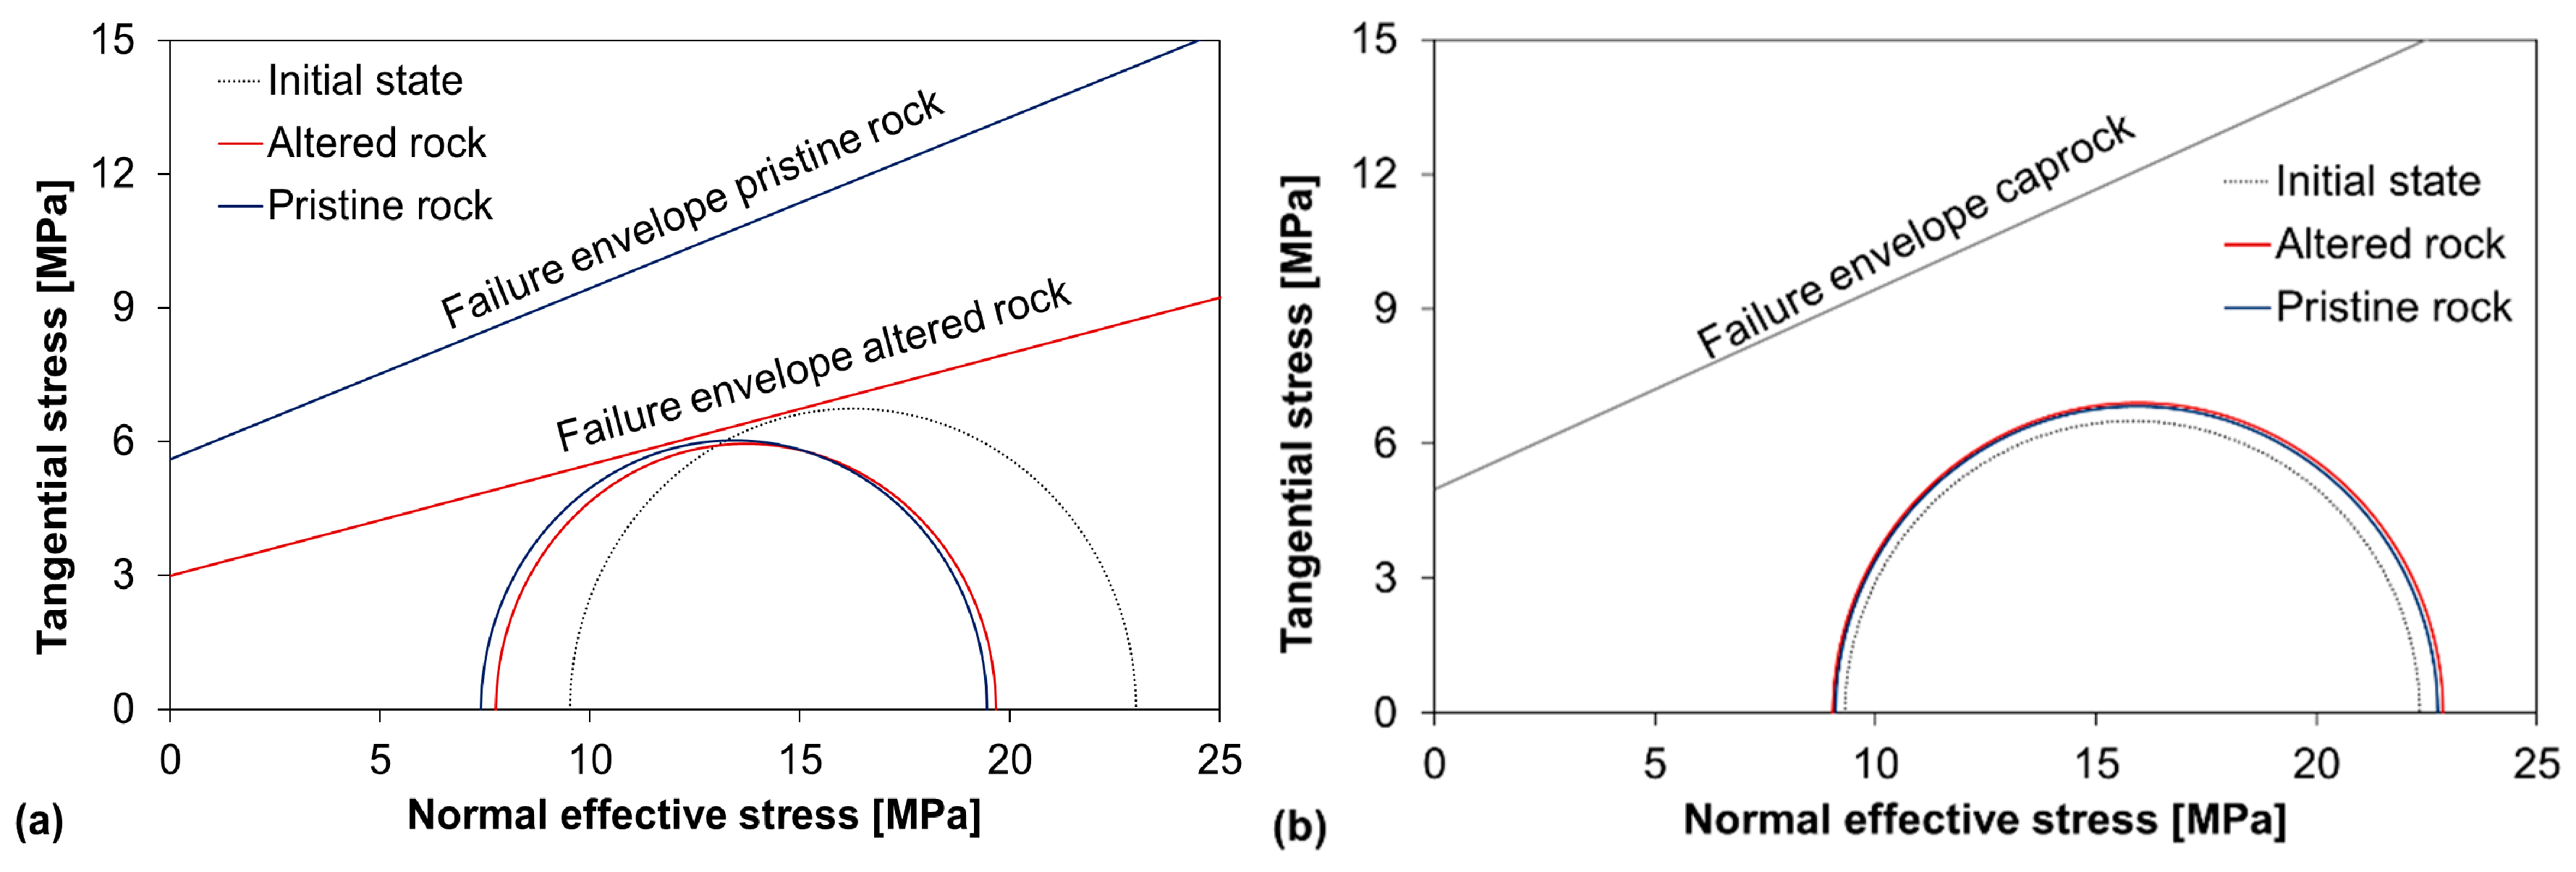
The described stress changes can be represented by Mohr’s circles (Figure 9). In the reservoir (Figure 9a), the initial stress state is far from failure conditions. This state of stress is displaced towards the left during injection as a result of pressure buildup. However, the Mohr’s circle also experiences a decrease in its size because of the poromechanical response of the rock (pore pressure increase), which induces an increase in the horizontal total stress. If the changes in Apulian limestone properties due interaction with CO2 are also accounted for, the horizontal total stresses undergo a higher increase and the vertical total stress also increases. These changes slightly shift the Mohr’s circle to the right and reduce its size, leading to a lower decrease in stability. However, interaction with CO2 also decreases the strength of the limestone. As a result, the failure envelope of the altered limestone approaches the Mohr’s circle, which may lead to failure conditions depending on the initial stress state and induced pressure buildup.
Considering the caprock (Figure 9b), the pore pressure slightly dropped as a result of the caprock deformation induced by the expansion of the reservoir, displacing the Mohr’s circle to the right. The expansion of the reservoir caused an increase in the volumetric strain of the caprock, and since the caprock permeability was extremely low and fluid flow was negligible, the fluid within the pores of the caprock was accommodated in a larger volume, which resulted in a slight pressure drop [46]. This phenomenon is known as the reverse-water level fluctuation [47]. Additionally, the horizontal total stresses decreased in the caprock, leading to an increase in the size of the Mohr’s circle. As a result, caprock stability slightly decreased but not dramatically, since the strength of the caprock is not affected due to the inability of CO2 to penetrate into it at considered overpressures [25].
5. Discussion
In this study, comprehensive experimental testing was conducted to assess hydraulic, poroelastic, and failure properties of Apulian limestone (calcarenite). In particular, relative permeability considering two-phase flow of water and CO2 was measured. For all these measurements, the experimental procedures were performed for both pristine and CO2 treated limestone to evaluate the influence of CO2 injection on mechanical and hydraulic properties. Given the low strength of the material, it is less likely to be chosen as the host formation for deep geological storage. This study can be seen, though, as a demonstration of a strong effect of CO2 injection on carbonate-rich rock. Low shear strength, almost pure calcite framework, and large specific surface area of the pores allow for quick (within a few days) observations of the deterioration in rock properties. The choice of boundary conditions for the tests was dictated by linearity of material response within the elastic range, so high pressures were avoided.
Pure deionized water was used to saturate the specimens and, in general, its use can trigger chemical reactions and affect measurements of permeability and drained properties [48]. Here, the saturation of specimens with water was performed for at least 2–3 days and this period of time has been observed to be enough to establish chemical equilibrium between the pore fluid and carbonate rock [48]. This observation is confirmed by the constant values of rock permeability obtained during the repetitive measurements. Saline water that would represent the in-situ fluid for deep carbonate aquifers was not used because possible effects of salt precipitation and evaporation are involved and could not be captured by the model, even though we recognize that these effects may influence the evolution of rock’s petrophysical properties.
CO2 injection produced change in mean porosity within 1%, indicating that the mass balance was fairly followed in the experiment. Some dissolved calcite may remain in an aqueous state [49], and may have induced 1% error to the total porosity. Therefore, mean porosity of the specimens can be considered to be practically constant after CO2 treatment, but permeability decreased by a factor of two as a result of CO2–rock interaction. Luquot and Gouze [5] observed that CO2-rich brine reacts with calcite, dissolving it and leading to an increase in permeability, especially near an injection well, while the macroscopic porosity was just moderately affected. It should be noted that in this study, the CO2 treatment procedure was conducted by establishing an undrained condition, whereas Luquot and Gouze [5] continuously injected brine with dissolved CO2. This means that here, CO2 was injected through the upstream, but during the CO2 treatment process, it did not flow throughout to the downstream pump basically being trapped in the specimen. Porosity measurements for the upstream and downstream part of the specimen differed, showing a porosity increase upstream and decrease downstream. This difference suggests that calcite dissolution occurred upstream, and precipitation of carbonates took place downstream, where it was undrained. In addition to this qualitative analysis, a further detailed study will be conducted in the future to identify the dissolution/precipitation patterns.
CO2 treatment of Apulian limestone causes changes in the relative permeability. The main change is that the exponent of the relative permeability to water varies from quadratic to quasi-linear after CO2 treatment. This implies that for a given saturation degree, the relative permeability to water becomes higher after CO2 treatment. This effect is considered to have implications for long-term CO2 injection [48] and highlights that predictive simulations of industrial-scale CO2 storage should incorporate the change in relative permeability.
Drained conventional triaxial compression tests showed that CO2 treatment tends to decrease the strength of Apulian limestone. The strength parameters decrease significantly (cohesion by a factor of 2, friction angle by a factor of 1.5), highlighting the importance of considering these chemo-mechanical changes when evaluating the stability of the reservoir. In addition, changes in the stress–strain curve indicate that the CO2 treatment makes carbonate rock a more ductile material compared to pristine limestone. Therefore, for low-stress conditions, more deformation may be expected for post-treated rock.
These changes in hydro-mechanical properties induced by geochemical reactions affect the response of the reservoir-caprock system to CO2 injection. Simulation results show that the portion of the reservoir that has been affected by CO2–rock interactions alter both the two-phase flow dynamics and the geomechanical response of the rock. While the changes in the hydraulic properties are transient, the geomechanical response is permanent. The stiffness contrast between the pristine and CO2 treated portion of the reservoir causes differential deformation that results in stress redistribution that improves stability in the reservoir, but worsens it in the caprock, in comparison with the case in which no changes in the geomechanical properties are considered. Nevertheless, the changes in stability are minor and limited to a few degrees in the mobilized friction coefficient. What may really compromise reservoir stability is the reduction in the limestone strength after being exposed to CO2. Geochemical reactions bring the failure envelope close to the effective stress state, which could induce shear failure depending on the initial stress state and injection conditions, i.e., injection pressure and temperature. If shear failure occurs, shear slip of fractures or creation of new fractures may occur, inducing microseismic events. If failure is local, around the injection well, sheared fractures will enhance injectivity. Such enhancement would be beneficial for storage operations, especially if caprock stability is not compromised, as it is the case of the modeled scenario. These simulation results show the importance of accounting for chemo-mechanical couplings to assess caprock integrity and the geomechanical response of carbonate storage formations to CO2 injection.
6. Conclusions
We have measured in the laboratory the effect of geochemical reactions induced by CO2 injection on hydraulic and geomechanical properties of water-saturated Apulian limestone (calcarenite) and evaluated the implications of these property changes at the field scale through numerical simulations. CO2–rock interactions cause calcite dissolution where CO2 injection occurs, i.e., upstream of the specimens, but leads to carbonate precipitation downstream, which has been set as undrained. This dissolution/precipitation pattern resulted in a slight porosity decrease, but a permeability reduction by a factor of two. The relative permeability curves were also affected, especially the one of water, which changed from being quadratic to being quasi-linear with the water saturation degree. CO2 treatment induced a reduction in the stiffness and strength of the limestone. Accounting for these property changes in numerical simulations at the industrial scale leads to stress redistribution within the CO2 plume altered rock. This stress redistribution reduces caprock stability comparing with the case in which rock properties are considered to remain unaltered by CO2–rock interaction.
Author Contributions
Conceptualization, V.V. and R.Y.M.; Data curation, K.K. and V.V.; Formal analysis, K.K.; Funding acquisition, V.V. and R.Y.M.; Investigation, K.K.; Methodology, K.K.; Software, V.V.; Supervision, R.Y.M.; Writing—original draft, K.K., V.V. and R.Y.M.; Writing—review & editing, K.K., V.V. and R.Y.M.
Funding
Research by K. Kim and R. Makhnenko was funded as part of the Center for Geologic Storage of CO2, an Energy Frontier Research Center funded by the U.S. Department of Energy (DOE), Office of Science, Basic Energy Sciences (BES), under Award #DE-SC0C12504. Financial support for V. Vilarrasa was from the “ZoDrEx” project, which has been subsidized through the ERANET Cofund GEOTHERMICA (Project No. 731117), from the European Commission and the Spanish Ministry of Economy, Industry and Competitiveness (MINECO).
Conflicts of Interest
The authors declare no conflicts of interest.
References
- Anderson, K.; Peters, G. The trouble with negative emissions. Science 2016, 354, 182–183. [Google Scholar] [CrossRef] [PubMed]
- Nordbotten, J.M.; Celia, M.A. Geological Storage of CO2; John Wiley and Sons: Hoboken, NJ, USA, 2012. [Google Scholar]
- IPCC. Special Report on Carbon Dioxide Capture and Storage; Cambridge University Press: Cambridge, UK, 2005. [Google Scholar]
- Zhang, W.; Li, Y.; Xu, T.; Cheng, H.; Zheng, Y.; Xiong, P. Long-term variations of CO2 trapped in different mechanisms in deep saline formations: A case study of the Songliao Basin, China. Int. J. Greenh. Gas Control 2009, 3, 161–180. [Google Scholar] [CrossRef]
- Luquot, L.; Gouze, P. Experimental determination of porosity and permeability changes induced by injection of CO2 into carbonate rocks. Chem. Geol. 2009, 265, 148–159. [Google Scholar] [CrossRef]
- Rohmer, J.; Pluymakers, A.; Renard, F. Mechano-chemical interactions in sedimentary rocks in the context of CO2 storage: Weak acid, weak effects? Earth-Sci. Rev. 2016, 157, 86–110. [Google Scholar] [CrossRef]
- Vilarrasa, V.; Makhnenko, R.Y.; Rutqvist, J. Field and laboratory studies of geomechanical response to the injection of CO2. In Science of Carbon Storage in Deep Saline Formations: Process Coupling across Time and Spatial Scales; Elsevier: New York, NY, USA, 2018. [Google Scholar]
- Bemer, E.; Lombard, J.M. From Injectivity to Integrity Studies of CO2 Geological Storage: Chemical Alteration Effects on Carbonates Petrophysical and Geomechanical Properties. Oil Gas Sci. Technol.—Rev. Inst. Fr. Pétrol. 2010, 65, 445–459. [Google Scholar] [CrossRef]
- Alam, M.M.; Hjuler, M.L.; Foged, H.; Lykke, I.; Christensen, H.F.; Fabricius, I.L. Petrophysical and rock-mechanics effects of CO2 injection for Enhanced oil recovery: Experimental study on chalk from south Arne field, North Sea. J. Pet. Sci. Eng. 2014, 122, 468–487. [Google Scholar] [CrossRef]
- Vialle, S.; Vanorio, T. Laboratory measurements of elastic properties of carbonate rocks during injection of reactive CO2-saturated water. Geophys. Res. Lett. 2011, 38, 1–5. [Google Scholar] [CrossRef]
- Grombacher, D.; Vanorio, T.; Ebert, Y. Time-lapse acoustic, transport, and NMR measurements to characterize microstructural changes of carbonate rocks during injection of CO2-rich water. Geophysics 2012, 77, WA169–WA179. [Google Scholar] [CrossRef]
- Vanorio, T.; Nur, A.; Ebert, Y. Rock physics analysis and time-lapse rock imaging of geochemical effects due to the injection of CO2 into reservoir rocks. Geophysics 2011, 76, O23–O33. [Google Scholar] [CrossRef]
- Sterpenich, J.; Sausse, J.; Pironon, J.; Géhin, A.; Hubert, G.; Perfetti, E.; Grgic, D. Experimental ageing of oolitic limestones under CO2 storage conditions. Petrographical and chemical evidence. Chem. Geol. 2009, 265, 99–112. [Google Scholar] [CrossRef]
- Liteanu, E.; Spiers, C.J.; De Bresser, J.H.P. The influence of water and supercritical CO2 on the failure behavior of chalk. Tectonophysics 2013, 599, 157–169. [Google Scholar] [CrossRef]
- Grgic, D. Influence of CO2 on the long-term chemomechanical behavior of an oolitic limestone. J. Geophys. Res. Solid Earth 2011, 116, B07201. [Google Scholar] [CrossRef]
- Saaltink, M.W.; Vilarrasa, V.; De Gaspari, F.; Silva, O.; Carrera, J.; Rötting, T.S. A method for incorporating equilibrium chemical reactions into multiphase flow models for CO2 storage. Adv. Water Resour. 2013, 62, 431–441. [Google Scholar] [CrossRef]
- Juanes, R.; Spiteri, E.J.; Orr, F.M., Jr.; Blunt, M.J. Impact of relative permeability hysteresis on geological CO2 storage. Water Resour. Res. 2006, 42, W12418. [Google Scholar] [CrossRef]
- Bennion, D.B.; Bachu, S. Drainage and Imbibition Relative Permeability Relationships for Supercritical CO2/Brine and H2S/Brine Systems in Intergranular Sandstone, Carbonate, Shale, and Anhydrite Rocks. Soc. Pet. Eng. 2008, 11. [Google Scholar] [CrossRef]
- Zekri, A.Y.; Shedid, S.A.; Almehaideb, R.A. Possible Alteration of Tight Limestone Rocks Properties and the Effect of Water Shelding on the Performance of SC CO2 Flooding for Carbonate Formation; Society of Petroleum Engineers: Richardson, TX, USA, 2007. [Google Scholar]
- André, L.; Audigane, P.; Azaroual, M.; Menjoz, A. Numerical modeling of fluid-rock chemical interactions at the supercritical CO2-liquid interface during CO2 injection into a carbonate reservoir, the Dogger aquifer (Paris Basin, France). Energy Convers. Manag. 2007, 48, 1782–1797. [Google Scholar] [CrossRef]
- Bear, J. Dynamics of Fluids in Porous Media; Elsevier: New York, NY, USA, 1972. [Google Scholar]
- Van Genuchten, M.T. A closed-form equation for predicting the hydraulic conductivity of unsaturated soils. Soil Sci. Soc. Am. J. 1980, 44, 892–898. [Google Scholar] [CrossRef]
- Vilarrasa, V.; Bolster, D.; Olivella, S.; Carrera, J. Coupled hydromechanical modeling of CO2 sequestration in deep saline aquifers. Int. J. Greenh. Gas Control 2010, 4, 910–919. [Google Scholar] [CrossRef] [Green Version]
- Vilarrasa, V.; Makhnenko, R.; Gheibi, S. Geomechanical analysis of the influence of CO2 injection location on fault stability. J. Rock Mech. Geotech. Eng. 2016, 8, 805–818. [Google Scholar] [CrossRef]
- Vilarrasa, V.; Makhnenko, R.Y. Caprock integrity and induced seismicity from laboratory and numerical experiments. Energy Procedia 2017, 125, 494–503. [Google Scholar] [CrossRef]
- Dentz, M.; Tartakovsky, D.M. Abrupt-interface solution for carbon dioxide injection into porous media. Transp. Porous Media 2009, 79, 15. [Google Scholar] [CrossRef]
- Vilarrasa, V.; Bolster, D.; Dentz, M.; Olivella, S.; Carrera, J. Effects of CO2 compressibility on CO2 storage in deep saline aquifers. Transp. Porous Media 2010, 85, 619–639. [Google Scholar] [CrossRef] [Green Version]
- Olivella, S.; Gens, A.; Carrera, J.; Alonso, E.E. Numerical formulation for a simulator (CODE_BRIGHT) for the coupled analysis of saline media. Eng. Comput. 1996, 13, 87–112. [Google Scholar] [CrossRef] [Green Version]
- Vilarrasa, V.; Silva, O.; Carrera, J.; Olivella, S. Liquid CO2 injection for geological storage in deep saline aquifers. Int. J. Greenh. Gas Control 2013, 14, 84–96. [Google Scholar] [CrossRef] [Green Version]
- Ciantia, M.O.; Hueckel, T. Weathering of submerged stressed calcarenites: Chemo-mechanical coupling mechanisms. Geotechnique 2013, 63, 768–785. [Google Scholar] [CrossRef]
- Makhnenko, R.Y.; Labuz, J. Calcarenite as a possible host rock for geologic CO2. In Proceedings of the 48th U.S. Rock Mechanics/Geomechanics Symposium, Minneapolis, MN, USA, 1–4 June 2014. No. 7559. [Google Scholar]
- Espinoza, D.N.; Santamarina, J.C. Water-CO2-mineral systems: Interfacial tension, contact angle, and diffusion—Implications to CO2 geological storage. Water Resour. Res. 2010, 46, W07537. [Google Scholar] [CrossRef]
- Krevor, S.C.M.; Pini, R.; Zuo, L.; Benson, S.M. Relative permeability and trapping of CO2 and water in sandstone rocks at reservoir conditions. Water Resour. Res. 2012, 48, W02532. [Google Scholar] [CrossRef]
- Andrew, M.; Bijeljic, B.; Blunt, M.J. Pore-scale imaging of trapped supercritical carbon dioxide in sandstones and carbonates. Int. J. Greenh. Gas Control 2014, 22, 1–14. [Google Scholar] [CrossRef] [Green Version]
- Huo, D.; Benson, S.M. Experimental Investigation of Stress-Dependency of Relative Permeability in Rock Fractures. Transp. Porous Media 2016, 113, 567–590. [Google Scholar] [CrossRef]
- Skempton, A.W. The pore-pressure coefficients A and B. Geotechnique 1954, 4, 143–147. [Google Scholar] [CrossRef]
- Bishop, A.W. The influence of an undrained change in stress on the pore pressure in porous media of low compressibility. Géotechnique 1976, 26, 371–375. [Google Scholar] [CrossRef]
- Detournay, E.; Cheng, A.H.-D. Fundamentals of Poroelasticity. In Comprehensive Rock Engineering: Principles, Practice and Projects, Vol. II, Analysis and Design Methods; Fairhurst, C., Ed.; Pergamon Press: Oxford, UK, 1993; Chapter 5. [Google Scholar]
- Achenbach, J.D. Wave Propagation in Elastic Solids; North-Holland Publishing Co.: Amsterdam, The Netherlands, 1984. [Google Scholar]
- Wood, A.W. A Textbook of Sound; McMillan Co.: New York, NY, USA, 1955. [Google Scholar]
- Makhnenko, R.Y.; Labuz, J.F. Elastic and inelastic deformation of fluid-saturated rock. Philos. Trans. R. Soc. A 2016, 374, 20150422. [Google Scholar] [CrossRef] [PubMed] [Green Version]
- Brooks, R.H.; Corey, A.T. Hydraulic Properties of Porous Media and Their Relation to Drainage Design. Trans. ASAE 1964, 7, 26–28. [Google Scholar]
- Meier, P.M.; Carrera, J.; Sánchez-Vila, X. An evaluation of Jacob’s method for the interpretation of pumping tests in heterogeneous formations. Water Resour. Res. 1998, 34, 1011–1025. [Google Scholar] [CrossRef]
- Butler, J.J., Jr. Pumping tests in nonuniform aquifers—The radially symmetric case. J. Hydrol. 1988, 101, 15–30. [Google Scholar] [CrossRef]
- Vilarrasa, V.; Carrera, J.; Jurado, A.; Pujades, E.; Vázquez-Suné, E. A methodology for characterizing the hydraulic effectiveness of an annular low-permeability barrier. Eng. Geol. 2011, 120, 68–80. [Google Scholar] [CrossRef]
- Vilarrasa, V.; Carrera, J.; Olivella, S. Hydromechanical characterization of CO2 injection sites. Int. J. Greenh. Gas Control 2013, 19, 665–677. [Google Scholar] [CrossRef]
- Hsieh, P.A. Deformation-induced changes in hydraulic head during ground-water withdrawal. Groundwater 1996, 34, 1082–1089. [Google Scholar] [CrossRef]
- Gouze, P.; Edlmann, K.; McDermott, C.I.; Luquot, L. Laboratory Experiments. In Geological Storage of CO2 in Deep Saline Formations; Niemi, A., Bear, J., Bensabat, J., Eds.; Theory and Applications of Transport in Porous Media, Vol. 29; Springer: Dordrecht, The Netherlands, 2017; Chapter 6. [Google Scholar]
- Ciantia, M.O.; Castellanza, R.; di Prisco, C. Experimental Study on the Water-Induced Weakening of Calcarenites. Rock Mech Rock Eng. 2015, 48, 441–461. [Google Scholar] [CrossRef]
Figure 1.
Schematic representation of the model geometry and boundary and initial conditions.

Figure 2.
Retention curves obtained from mercury intrusion porosimetry and calculated curve that considers capillary properties of carbon dioxide (CO2) in water-saturated carbonate rock.
Figure 2.
Retention curves obtained from mercury intrusion porosimetry and calculated curve that considers capillary properties of carbon dioxide (CO2) in water-saturated carbonate rock.

Figure 3.
Experimental setup: (a) core flooding device for CO2 treatment and permeability measurements on cylindrical (50 mm in diameter and 100 mm long) specimens and (b) cylindrical specimen (50 × 100 mm) with instrumented Linear Variable Differential Transformers (LVDTs) and pore pressure lines that is tested in 3.5 MPa GDS triaxial cell.

Figure 4.
Relative permeability curves and fitting with the Brooks–Corey model for Apulian limestone: (a) pristine specimen and (b) CO2 treated specimen.
Figure 4.
Relative permeability curves and fitting with the Brooks–Corey model for Apulian limestone: (a) pristine specimen and (b) CO2 treated specimen.

Figure 5.
Effect of CO2 injection on the geomechanical response of Apulian limestone tested in conventional triaxial compression at σ3′ = 2.5 MPa.
Figure 5.
Effect of CO2 injection on the geomechanical response of Apulian limestone tested in conventional triaxial compression at σ3′ = 2.5 MPa.

Figure 6.
Failure envelopes for pristine and CO2 treated Apulian limestone.

Figure 7.
CO2 plume after 3 years of injection presenting a subvertical CO2-brine boundary 150 m away from the injection well.
Figure 7.
CO2 plume after 3 years of injection presenting a subvertical CO2-brine boundary 150 m away from the injection well.

Figure 8.
Changes in mobilized friction angle along the radial distance in the middle of the reservoir (continuous lines) and in the caprock, 10 m above the reservoir-caprock interface (dashed lines) for pristine and altered rock after 3 years of CO2 injection.
Figure 8.
Changes in mobilized friction angle along the radial distance in the middle of the reservoir (continuous lines) and in the caprock, 10 m above the reservoir-caprock interface (dashed lines) for pristine and altered rock after 3 years of CO2 injection.

Figure 9.
Mohr’s circles 50 m away from the injection well (a) in the middle of the reservoir and (b) 10 m above the reservoir-caprock interface, showing the initial stress of state and the resulting stress of state after 3 years of injection when considering (altered rock) and not considering (pristine rock) changes in the reservoir properties as a result of geochemical reactions.


| Property | Pristine Rock |
|---|---|
| Permeability, k [m2] | 4 × 10⁻²¹ |
| Porosity, φ [−] | 0.12 |
| Relative water permeability, krw [−] | Sw6 |
| Relative CO2 permeability, krc [−] | Sc6 |
| Gas entry pressure, p0 [MPa] | 6.0 |
| van Genuchten shape parameter m [−] | 0.3 |
| Undrained Young’s modulus, E [GPa] | 2.8 |
| Undrained Poisson’s ratio, νu [−] | 0.40 |
| Cohesion, c′ [MPa] | 5.0 |
| Friction angle, ϕ [°] | 24 |
Table 2.
Properties of pristine and carbon dioxide (CO2) treated Apulian limestone.
| Pristine | CO2-Treated | ||||
|---|---|---|---|---|---|
| Calc-0 | Calc-1 | Calc-2 | Calc-3 | Calc-4 | |
| Min. principal stress, σlat [MPa] | 2.0 | 3.5 | 3.5 | 3.5 | 3.5 |
| Pore pressure p, [MPa] | 1.8 | 3.4 | 2.0 | 0.5 | 1.0 |
| Permeability, k [m2] (at P’ = 1 MPa) | 9 × 10⁻¹⁵ | 3.5 × 10⁻¹⁵ | 5.1 × 10⁻¹⁵ | 5.6 × 10⁻¹⁵ | 5.8 × 10⁻¹⁵ |
| Porosity, φ [−] | 0.35 | 0.34 | 0.34 | 0.32 | 0.34 |
| Young’s modulus, E [GPa] | 7.1 | 3.4 | 4.4 | 4.7 | 4.5 |
| Poisson’s ratio, ν [−] | 0.25 | - | - | 0.25 | 0.25 |
| Max. principal stress at failure, σax [MPa] | 15.6 | 7.7 | 10.7 | 12.5 | 12.6 |
Table 3.
Properties of pristine and CO2 treated Apulian limestone.
| Property | Pristine Rock | CO2-Treated Rock |
|---|---|---|
| Permeability, k [m2] | 9 × 10⁻¹⁵ | 5–6 × 10⁻¹⁵ |
| Porosity, φ [−] | 0.35 | 0.34 |
| Relative water permeability, krw [−] | Sw2.1 | Sw1.2 |
| Relative CO2 permeability, krc [−] | Sc6 | Sc5.5 |
| Gas entry pressure, p0 [MPa] | 0.02 | 0.02 |
| van Genuchten shape parameter m [−] | 0.42 | 0.42 |
| Young’s modulus, E [GPa] | 7.1 | 4.4 |
| Poisson ratio, ν [−] | 0.25 | 0.25 |
| Cohesion, c′ [MPa] | 5.6 | 3.0 |
| Friction angle, ϕ′ [°] | 21 | 14 |
© 2018 by the authors. Licensee MDPI, Basel, Switzerland. This article is an open access article distributed under the terms and conditions of the Creative Commons Attribution (CC BY) license (http://creativecommons.org/licenses/by/4.0/).
Share and Cite
MDPI and ACS Style
Kim, K.; Vilarrasa, V.; Makhnenko, R.Y. CO2 Injection Effect on Geomechanical and Flow Properties of Calcite-Rich Reservoirs. Fluids 2018, 3, 66. https://doi.org/10.3390/fluids3030066
AMA Style
Kim K, Vilarrasa V, Makhnenko RY. CO2 Injection Effect on Geomechanical and Flow Properties of Calcite-Rich Reservoirs. Fluids. 2018; 3(3):66. https://doi.org/10.3390/fluids3030066
Chicago/Turabian StyleKim, Kiseok, Victor Vilarrasa, and Roman Y. Makhnenko. 2018. "CO2 Injection Effect on Geomechanical and Flow Properties of Calcite-Rich Reservoirs" Fluids 3, no. 3: 66. https://doi.org/10.3390/fluids3030066