Article

Energy Modelling and Indoor Air Quality Analysis of Cooling Systems for Buildings in Hot Climates

by
Zohaib Shaikh
and
Hassam Nasarullah Chaudhry
*
Department of Architectural Engineering, School of Energy, Geoscience, Infrastructure and Society, Heriot-Watt University, P. O. Box 294 345, Dubai, UAE
*
Author to whom correspondence should be addressed.
Fluids 2018, 3(4), 77; https://doi.org/10.3390/fluids3040077
Submission received: 8 August 2018 / Revised: 27 September 2018 / Accepted: 18 October 2018 / Published: 22 October 2018
(This article belongs to the Special Issue Ventilation and Passive Cooling for Healthy and Comfortable Buildings)

Abstract

:
Energy consumption due to cooling and ventilation of buildings has grown significantly within the last two decades, and therefore advancement in cooling technologies has become imperative to maximise energy savings. This work numerically investigates the performance of vapour-compression unitary and centralised cooling systems for high rise buildings using an office case-study in the United Arab Emirates (UAE). Energy modelling, thermal comfort and indoor air quality analyses have been carried out using the Integrated Environmental Simulation Virtual Environment (IES-VE). Using the benchmark system based on fan-coil units, the findings have indicated that attaching a Variable Speed Drive (VSD) fan can reduce the overall energy consumption of the building by 8%, with 20% reduction in the cooling loads. The unitary cooling system operating on variable refrigerant flow principle achieved an energy reduction of approximately 30%; however, this system is not recommended in high-rise buildings as the CO2 concentration obtained is in excess of 3000 ppm, which is considerably higher than ASHRAE standards. It is essential for buildings running in hot climates to incorporate hybrid cooling techniques to relieve the load on conventional active cooling systems.

Graphical Abstract

1. Introduction

1.1. Background

Active cooling systems are responsible for consuming 80–85% of the building’s total electricity because of the extremely hot climatic conditions where outdoor temperatures reach up to 50 °C with relative humidity up to 60% during peak summer months [1]. Intensive use of air-conditioning system emits greenhouse gases like carbon dioxide, methane, nitrous oxide, chlorofluoro carbon into the atmosphere causing ozone depletion. In areas of extreme climates, users spend most of the time indoors, which makes it compulsory to maintain an optimum level of thermal comfort and indoor air quality. However, at the same time, these cooling systems have to be resilient against the effects of climate change. There is a growing interest among the local community to adapt towards more energy efficient cooling technology and sustainability is also the main theme for the United Arab Emirates (UAE) Expo 2020 [2]. The ducted split and packaged air conditioning systems mostly dominate the local market by having 30% of the local market share in UAE. The centralised air conditioning systems also account for 25% of the local market share. While district cooling and split units/window AC have similar market share of about 18%. The variable refrigerant flow systems only accounts for 2% of the market share since they are not very common in the local market [3].
Office buildings usually have higher energy consumption because the cooling systems have to compensate for the continuous internal heat gains produced by office occupancy and equipment. In this research, energy modelling of a high-rise office case-study building was performed using Integrated Environmental Simulation Virtual Environment software (IES-VE). The impact of different cooling systems based upon the energy consumption, carbon emission, thermal comfort and indoor air quality was investigated. Fan Coil Unit (FCU) with a Variable Speed Drive (VSD) fan, Variable Air Volume (VAV), Variable Refrigerant Flow (VRF) and Cool Phase Hybrid cooling system were some of the cooling systems evaluated on the baseline office model.
The aim of this study is to investigate a range of hybrid and active building cooling systems for buildings in hot climates in order to recommend the most appropriate cooling technique for reducing the energy consumption, carbon emission and improve the thermal comfort and indoor air quality. The analyses will include dynamic modelling of the VAV, VRF and hybrid cooling systems using a case-study office building located in hot climates such as the UAE.

1.2. Previous Related Works

Numerous research works have highlighted the significance of adopting active retrofits in order to enhance the building performance. The impact of various cooling technologies had been studied individually to find the most optimum solution to improvise the energy efficiency, thermal comfort and indoor air quality.
AlAwadhi et al. [4] examined the energy saving potential by retrofitting federal public housing villas by using Integrated Environmental Simulation Virtual Environment (IES-VE). The retrofits were based upon the Estidama 1 Pearl standard being limited to insulation and glazing. While Estidama 2 Pearl standard was only based upon window wall ratio (WWR). An overall energy reduction of 30% was attained using Estidama 1 and additional 1% reduction was achieved by applying the Estidama 2 standard. This research proved the capability of IES-VE software to analyse the retrofits performance and also highlighted the UAE government’s ambition to control the buildings energy consumption by bringing it under certain limit by implementing Estidama Pearl Rating to go according to 2021 vision.
Alkhateeb and Hijleh (2016) [5] had performed the energy modelling of federal government building with an aim to reduce the energy demand by adopting different retrofit techniques. Integrated Environmental Simulation Virtual Environment (IES-VE) was used for assessing the effectiveness of passive and active retrofit strategies to reduce the energy-consumption for Ministry of Infrastructure development building (MOID) in Ras Al Khaimah (RAK). The study revealed that the active retrofits such as improving the Coefficient of Performance (COP) and changing set point were more ideal as it provided 64% of electricity saving. While passive retrofits like shading, insulation and glazing provided 14.5% of electricity saving proving that the energy saving potential is far greater when adopting active retrofits such as energy efficient cooling systems or variable speed drive fans (VSD) as they are directly associated with building services.
Hartungi and Jiang [6] conducted a research to find the most appropriate energy conservation retrofitting solution in order to make the office building comply with the UK Part L regulation. Integrated Environmental Simulation Virtual Environment (IES-VE) was used for modelling to determine the carbon emission rates. A combination of retrofits such as insulation, heat recovery system, automatic blind system and energy efficient artificial lighting components like lamps, ballast, luminaires and control gear were adopted. The Target Emission Rates (TER) had reduced by 28% making it compliant with Part L building regulation. This research proved that how IES-VE can be used as an energy modelling tool to make buildings compliant with latest government regulations.
Taleb [7] studied the impact of various passive retrofit techniques such as sunshade, external wall, glazing and green roof for a hospital case-study building to enhance the building skin performance. Integrated Environmental Simulation Virtual Environment (IES-VE) and Computational Fluid Dynamics (CFD) were utilized to evaluate the performance of the hospital building before and after retrofitting. The results indicated heat gain reduction of 1.5% from sunshade and 24.7% from green roof, proving that the green roof was one of the most suitable solutions in reducing the heat gains and energy consumption. This research proved that green-roof is a viable option for roofing because it will help to improve the building fabric performance and creates more habitable space to support the health and well-being of building users.
The influence of occupancy pattern on energy consumption was studied by Pan et al. [8] using IES-VE to model the building and set the occupancy profiles replicating an actual operation throughout the year in different seasons. The aim of this study was to identify occupant’s behavior, which leads to energy-wastage. Room-occupancy, window operation, indoor and outdoor air-temperature were some of the parameters that were monitored. Switching off the Heating, Ventilation and Air-Conditioning (HVAC) system when the office was unoccupied proved to provide the most-savings. The findings showed that the way in which the occupants use the building had a major impact on its performance; educating occupants about energy conservation is a great solution and is more beneficial in terms of cost, implementation and knowledge. This research demonstrated capability of IES-VE simulation to assume the occupancy behavior pattern for predicting the energy saving potential.
A feasibility study was led by Stansbury and Mittelsdorf [9] to analyse the economic and environmental benefits by adopting energy efficient lighting. This study mainly wanted to prove how retrofitting of lighting system can make a drastic impact in reducing the overall emissions of SO2, NO2, CO2 and CO from power plants by reducing the energy-consumption. Audit was carried out to know the exact lighting requirements, occupancy patterns, room dimension before retrofitting the office and the annual energy data for the office was obtained from general service administration. The results showed an annual energy saving of 53% by implementation of an energy efficient lighting system.
Hammad and Abu-Hijleh [10] examined the impact of integrating dynamic louvers on building’s external façade to reduce the energy consumption in office building by using an Integrated Environmental Simulation Virtual Environment (IES-VE) to predict the energy consumption. The results showed energy saving potential of 34% at south, 28.5% in east and 30.31% from the west direction of the building. This research study gave an imprint about how IES-VE could be utilized to analyse the performance of the dynamic facades to reduce the energy consumption and improve the productivity of employees within the work environment as these facades will also help to control the glare.
A research study was conducted by Khatami and Hashemi [11] to find the most appropriate retrofitting strategy to improve the energy consumption, thermal comfort and indoor air quality (IAQ) of the office environment by performing dynamic modelling in integrated Environmental Simulation Virtual Environment (IES-VE). Energy efficient lighting system, automatic thermostat and automated window controls were some of the adopted retrofitting strategies. The results revealed that the IAQ improved by 90% and reduced the energy consumption by 2.1%. This research gave an impression about how thermal comfort and IAQ could be analyzed using IES simulation.
A comparative research was led by Yu et al. [12] to investigate the energy consumption between Variable Refrigerant Flow (VRF) and Variable Air Volume (VAV) in typical office buildings. Site surveys, electricity bills and design simulation toolkit (DeST) were used to evaluate the performance of the cooling systems. Simulations revealed that VRF systems had 48% less cooling load in contrast to a typical VAV system, which was mainly due to the flexibility of the VRF system to have a part-time part-space operation mode, which allowed the user to turn on as per occupancy and had individual controls for occupants in different spaces. This research gave a general overview about the benefits of Variable Refrigerant Flow (VRF) with regards to the potential savings and design flexibility for retrofitting VRF systems in existing office buildings.
Aynur et al. [13] performed an experimental study between Variable Air Volume (VAV) and Variable Refrigerant Flow (VRF) air conditioning with energy recovery ventilator (ERV) module using energy plus to determine the energy consumption and meet the ventilation criteria set by ASHRAE. The results from the simulation concluded that the VRF system was 27.1–57.9% more energy efficient than the VAV system. The findings also proved that there was a trade-off between temperature control and energy consumption in the VAV system because the VAV box had to be utilised in order to maintain the temperature precisely and it was also energy demanding because it increased the energy consumption by 65.8%. This research highlighted major drawbacks of VRF and VAV systems with solutions to overcome the challenges and also emphasized the fact that having a greater number of components on the air side and water side will lead to greater energy demand.
There is a lot of literature that has successfully performed energy modelling, but failed to realise the significance of carbon emission because none of it extensively provides carbon data comparison before and after modelling. It is also worth mentioning that adoption of an energy efficient cooling technique in the existing building stock shall play a significant role in reducing the energy consumption of the built environment as cooling accounts for more than 70% of the buildings electrical load in UAE. This research will therefore investigate the most optimum solution to meet the heavy cooling demands in the most energy efficient manner with comprehensive analysis of energy consumption, carbon emission, thermal comfort and indoor air quality. Designing, comparing and recommending mechanical cooling systems assisting with the hot climatic condition will be of great interest to the building community as cooling is requisite for most of the year.

2. Numerical Methodology

2.1. Governing Equations

The dynamic building simulation was carried out using IES-VE’s module ApacheSim, where the conduction of each building element was presumed to be unidirectional. A different set of equations was utilised to calculate the boundaries, heat differentiation and heat transfer by air movement. Furthermore, the thermo-physical properties λ , ρ , and c of each layer of element were assumed to be uniform within the layer:
2 T x 2 =   ρ c λ   T / t ,
where λ was the conductivity of solid element (W/(m2·K)), ρ was the density of solid in kg/m3 and c was the specific heat capacity of the solid in J/(kg·K).
IES adopts a finite difference approach to the solution of the heat differentiation equation, which involves replacing the element with a finite number of discrete nodes at which the temperature is calculated:
T n 1 2 T n + T n + 1 δ n 2 = ( ρ c / λ ) T t   ,
where T n is the temperature (°C) at node n and δ n is the local node spacing in m. Nodes are distributed within the layers in such a way as to ensure accurate modelling of the heat transfer and storage characteristics for a chosen time-step. This choice is based on constraint imposed on the Fourier number:
F = ( λ ρ c ) Δ / δ n 2   ,
where Δ is the simulation timestep in seconds:
T ˙ n j = ( T n j + 1 T n j ) / Δ ,
where T n j is the temperature (°C) at node n and time-step j, T ˙ n j is the time derivative of temperature (K/s) at node n and time-step j.
The rate of heat transfer associated with a stream of air entering calculated was using:
Q = m C p ( T i T a ) ,
where m is the air mass flow rate in kg/s, C p is the specific heat capacity of the air at constant pressure in J/kg/K, T i is the air supply temperature and T a room mean air temperature:
m = ρ r e f a V / 3600 ,
where ρ r e f is 1.2 kg/m3 as the reference air density, V is the room volume in m3 and a is the air change rate in ach:
w = m ( g i g ) .
Carbon dioxide gain is treated in a similar way, where c is the carbon dioxide gain in kg/s, k i is the carbon dioxide concentration of the supply air in kg/kg and k is the carbon dioxide concentration of the room air in kg/kg [14].

2.2. Physical Domain

IES-VE (Integrated Environmental Simulation Virtual Environment) was used for performing the Dynamic Thermal Simulation in this study. The mixed-use building occupied an area of 2731 m2, the height of the tower was 235 meters and consisted of 59 floors including commercial and residential spaces. The site has a level terrain with scarce vegetation as most of the nearby sites have been constructed with high-rise towers. The UAE is well known for dry arid climatic conditions as it lies on the tropic of cancer with extremely hot temperatures during summer months and low temperatures with less rainfall in winter months. Summer seasons last for almost nine months being followed by winter for three months. June, July and August are the hottest months in the year when the temperature can reach up to 50 °C with 90% humidity and 11.5 h of average maximum sunshine. The office is served by a Fan Coil Unit (FCU) air conditioning system that was created in the Apache HVAC tool for a detailed analysis of systems and energy consumption.
The modelled office space had an area of 687.18 m2. The office had an open floor plan that was replicated in the model by replacing the walls with holes for accurate simulation purposes. Some of the inaccessible spaces under the control of building management were considered as voids and have been highlighted in red in Figure 1.

2.3. Indoor Design Criteria

The indoor design criteria (Table 1) were set to replicate the actual functioning of the building in accordance with the local standards and regulation for office environment. The indoor temperature was set to 24 °C and for server room it was kept at 18 °C.
High performance construction materials have been used for modelling the office. A green patterned curtain wall has been replicated in IES-VE by adding 100% glazing. The buildings core structure has been assigned with external walls (U value = 0.56 W/(m2·K)) and glazing (U value = 1 W/(m2·K)) taken in line with Dubai Municipality green building standards. Zone templates were created to imitate the 12-h operation with a one-hour break (Table 2).
Table 3 shows the operational profile for the office and pantry equipment. Computers were some of the most commonly used equipment’s in the office. Most of the pantry equipment’s were expected to have peak usage at break time during 12:30 p.m. to 2:00 p.m. Lighting operational profile has been presented at Table 4.
The office systems were modelled to indicate the heat gains due to external equipment used in the building. Table 5 indicates the internal heat gains from the equipment, while Table 6 provides a summary of the office systems’ internal heat gain. Five individual cooling systems, namely the fan coil system, variable air volume, variable refrigerant flow, monodraught cool-phase and district cooling were modelled to study its effect on energy, IAQ and thermal comfort. Full details of the systems modelled are presented in Table 7, Table 8, Table 9, Table 10, Table 11 and Table 12.
Most of the design variables for different HVAC systems are very similar because the office had an open plan layout as most of the spatial footprint had been kept very repetitive and were also being served by the same Air Handling Unit (AHU) (central fan). The system was designed as per to the overall cooling capacity replicating the actual FCU layout of the office.
All of the modelled HVAC systems have totally different operating mechanism as the other systems are completely mechanical based, while the monodraught (Table 12) is a hybrid system. Hence, there is difference in power capacity and these figures are directly taken from the IES-VE database in response to the actual cooling load of the space.
For thermal comfort modelling input variables (Table 13), the default values from IES in comfort parameters were retained with a clothing level of 0.69, activity level 90 and nominal design air speed of 0.15 m/s.

3. Results and Discussion

3.1. Energy and Carbon

The annual energy consumption (
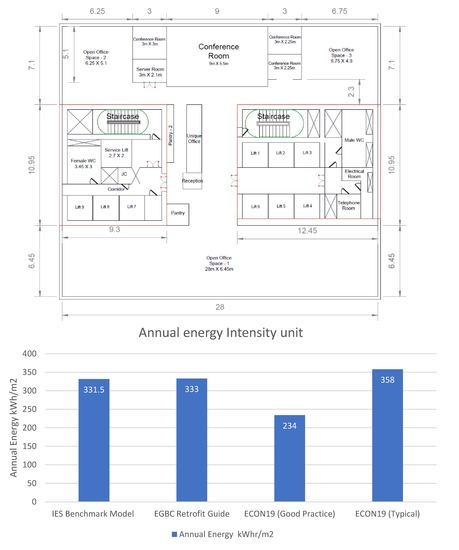
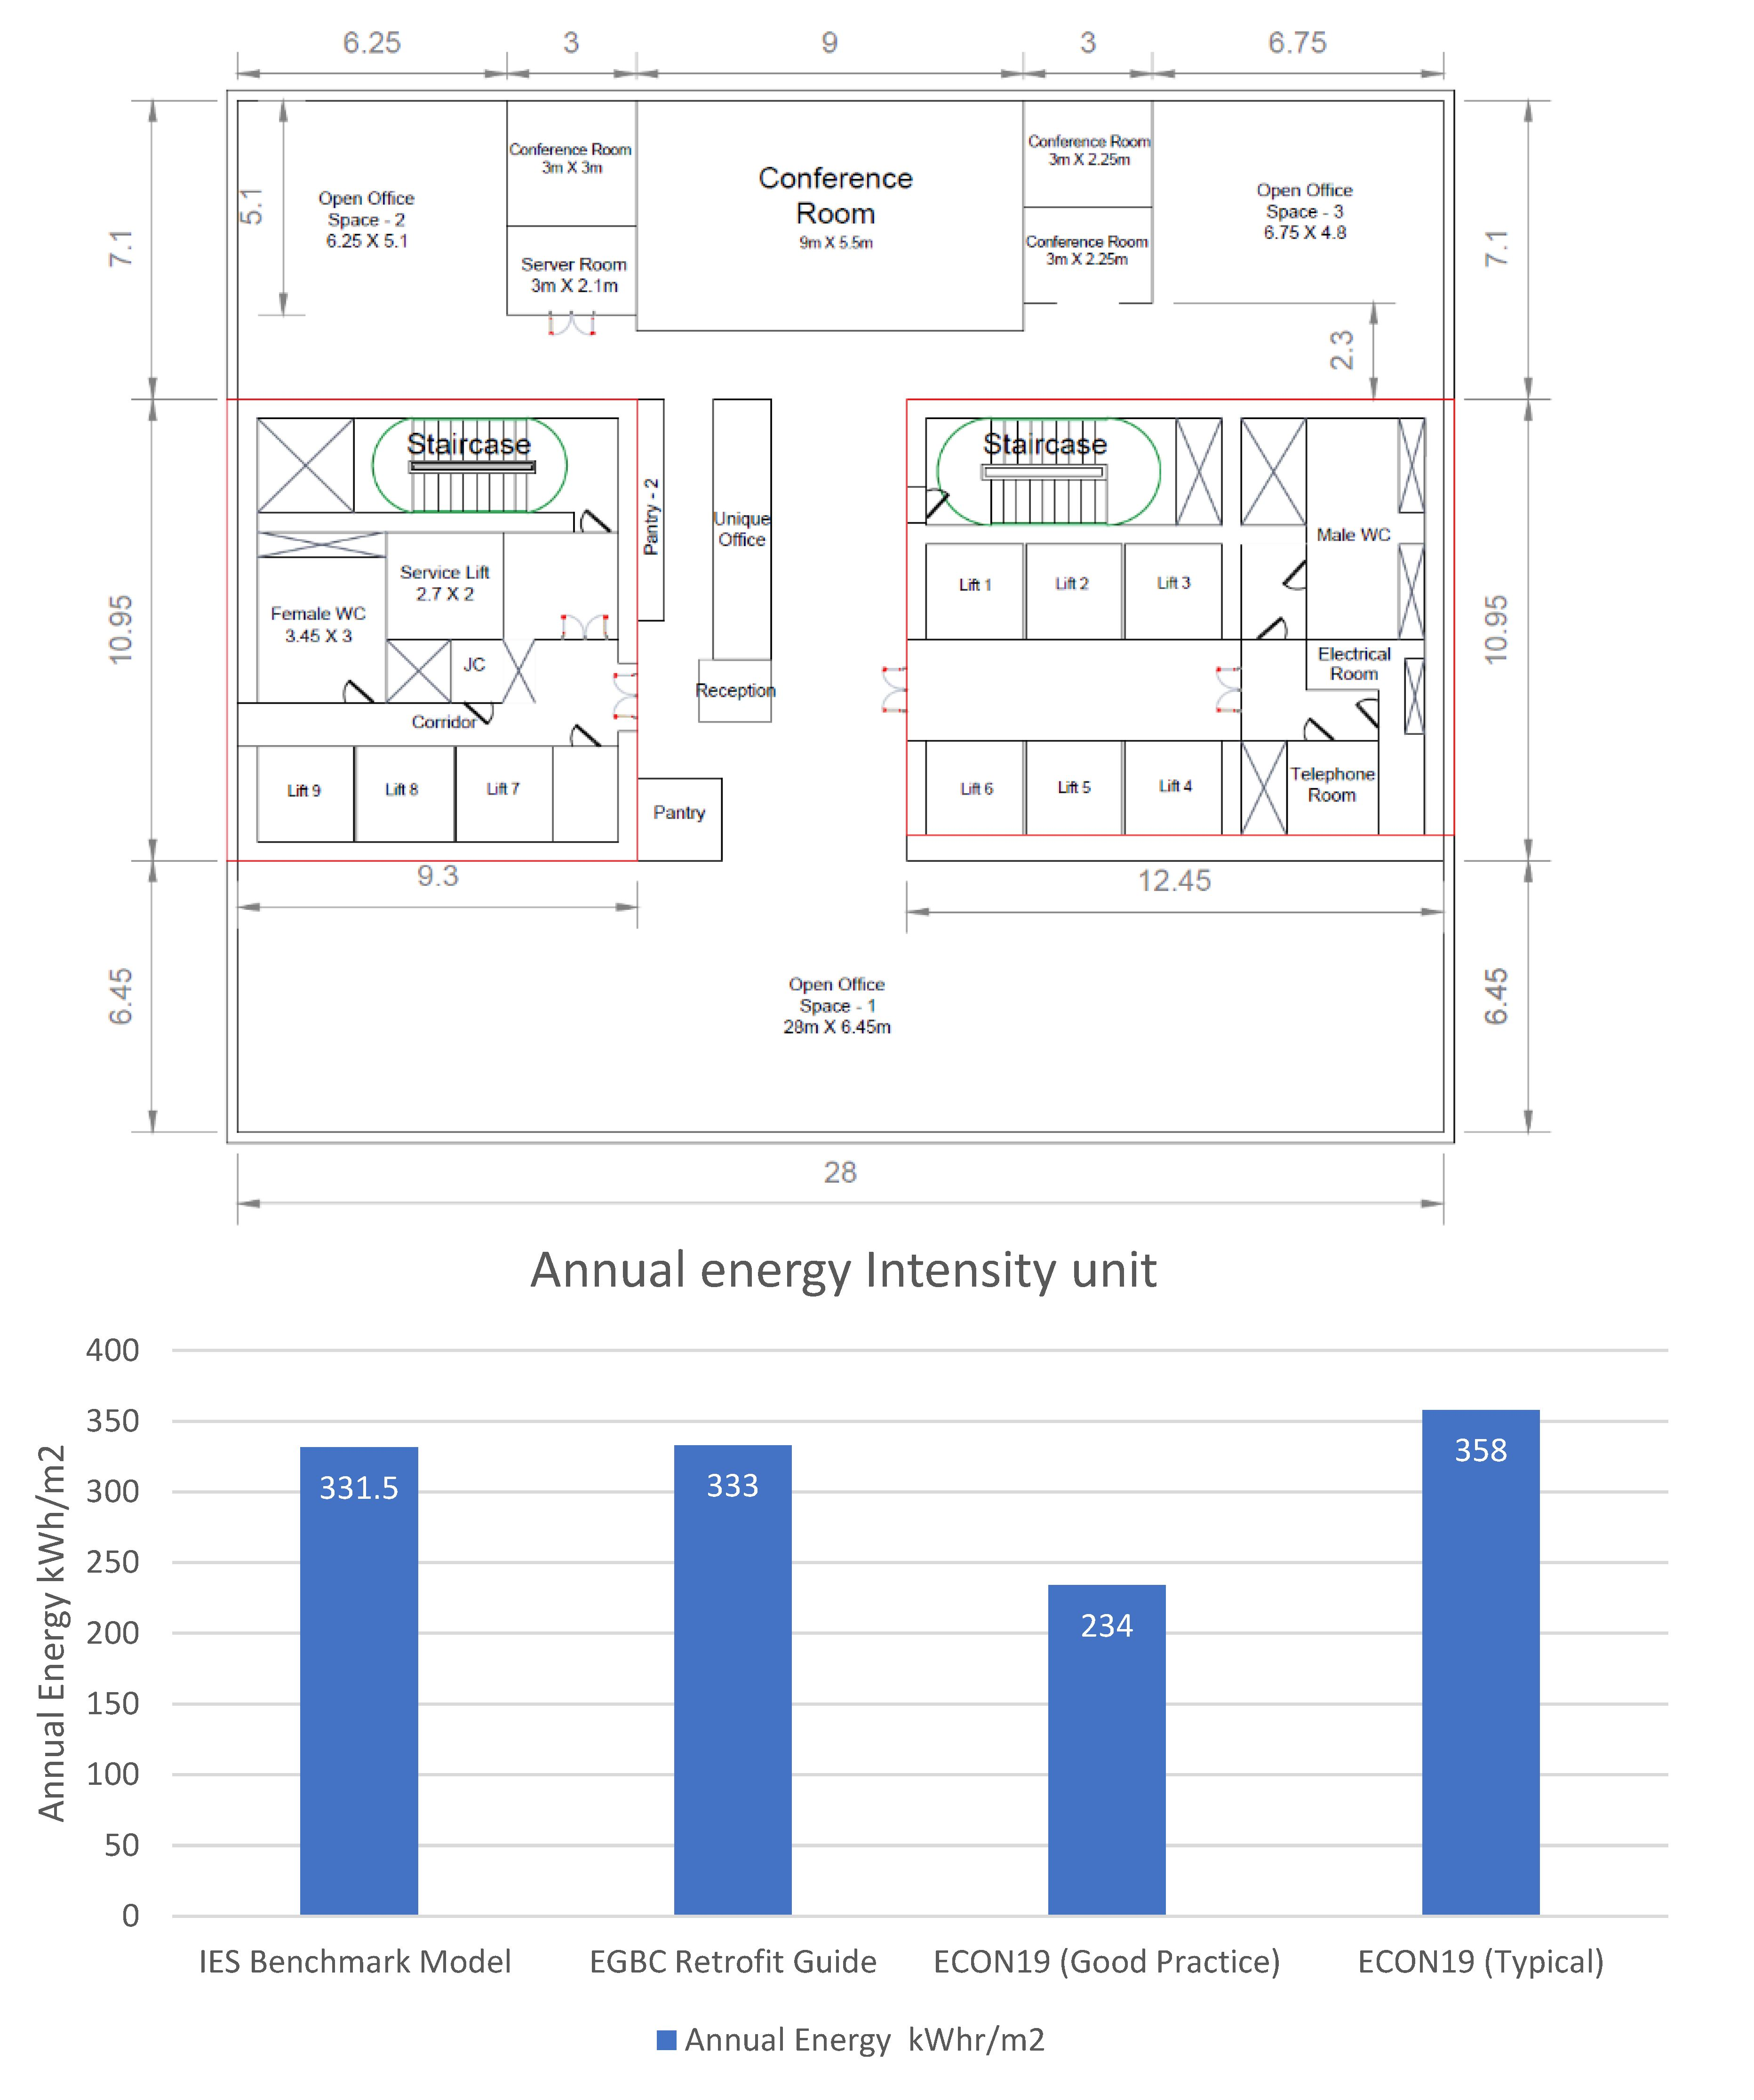
Table 14) for the baseline office model was 227.78 MWh with a breakdown of 59.7 MWh for district cooling and 168 MWh from office utility. Energy intensity unit (Figure 1) of 331.5 kWh/m2 was competitive with the industry benchmarks as it was 0.45% lower than the local Emirates Green Building Council (EGBC) guidelines. When compared with the Energy Consumption Guide 19 (ECON19) [15], it was 7.40% lower than the typical prestige air-conditioned office and 29.4% higher than a good practice benchmark. While the annual carbon emission for baseline office model was 118,219 KgCO2, which translated to a carbon intensity (Table 14) of 172 KgCO2/m2.
The comparison of carbon intensities with ECON19 showed a variation of 7.63% against the typical office benchmark. However, at the same time, the baseline office model was 29.4% higher than the good practice carbon benchmark from ECON19, which could only be because the ECON19 is a British standard which takes into account the climatic conditions of UK region over a longer period of time. The energy and carbon results proved that the baseline office model was very competitive as it was able to retain its performance even after eight years of operation.
The implementation of Variable Speed Drive (VSD) fan in a baseline FCU system was a practical retrofit option with a reduction of 8% in annual energy consumption and carbon emission by targeting cooling and fan energy with a significant reduction of 20% and 9.90% (Figure 2), which can be further seen from Table 5. Ease of installation in office environment causing less downtime at moderate cost can be regarded as some of the advantages. On the other hand, the adoption of VAV cooling system was not a practical solution as it increased the energy consumption and carbon emission by 42% because of the greater number of air side and water side components. The air side consisted of the filter, cooling coil, supply fan, exhaust fan and VAV box. However, for the water side, virtual district cooling performance curve set, and pumps had been utilised for modelling the VAV system.
The VRF system was one of the most energy efficient cooling systems, as it was able to cut down the annual energy consumption and carbon emission by 30% with 79.2% reduction directly from cooling because of the use of direct expansion cooling coil on the air side and scroll compressor on the water side to regulate the flow of refrigerant as per the cooling demand. It can also be observed that the number of components on the air side and water side were significantly less because the system was completely based upon the split system.
Monodraught cool-phase was the second most energy efficient cooling system which was able to reduce the annual energy consumption and carbon emission by 22% with specific cooling energy and central fan energy saving up to 18.5% and 70.6%. This cooling system took advantage of the intelligent AHU system and thermal batteries to absorb heat [16]. It also did not have any compressor or chiller on water side. While the air side only had sensors, actuators, VSD fan, controls and humidity monitoring systems.
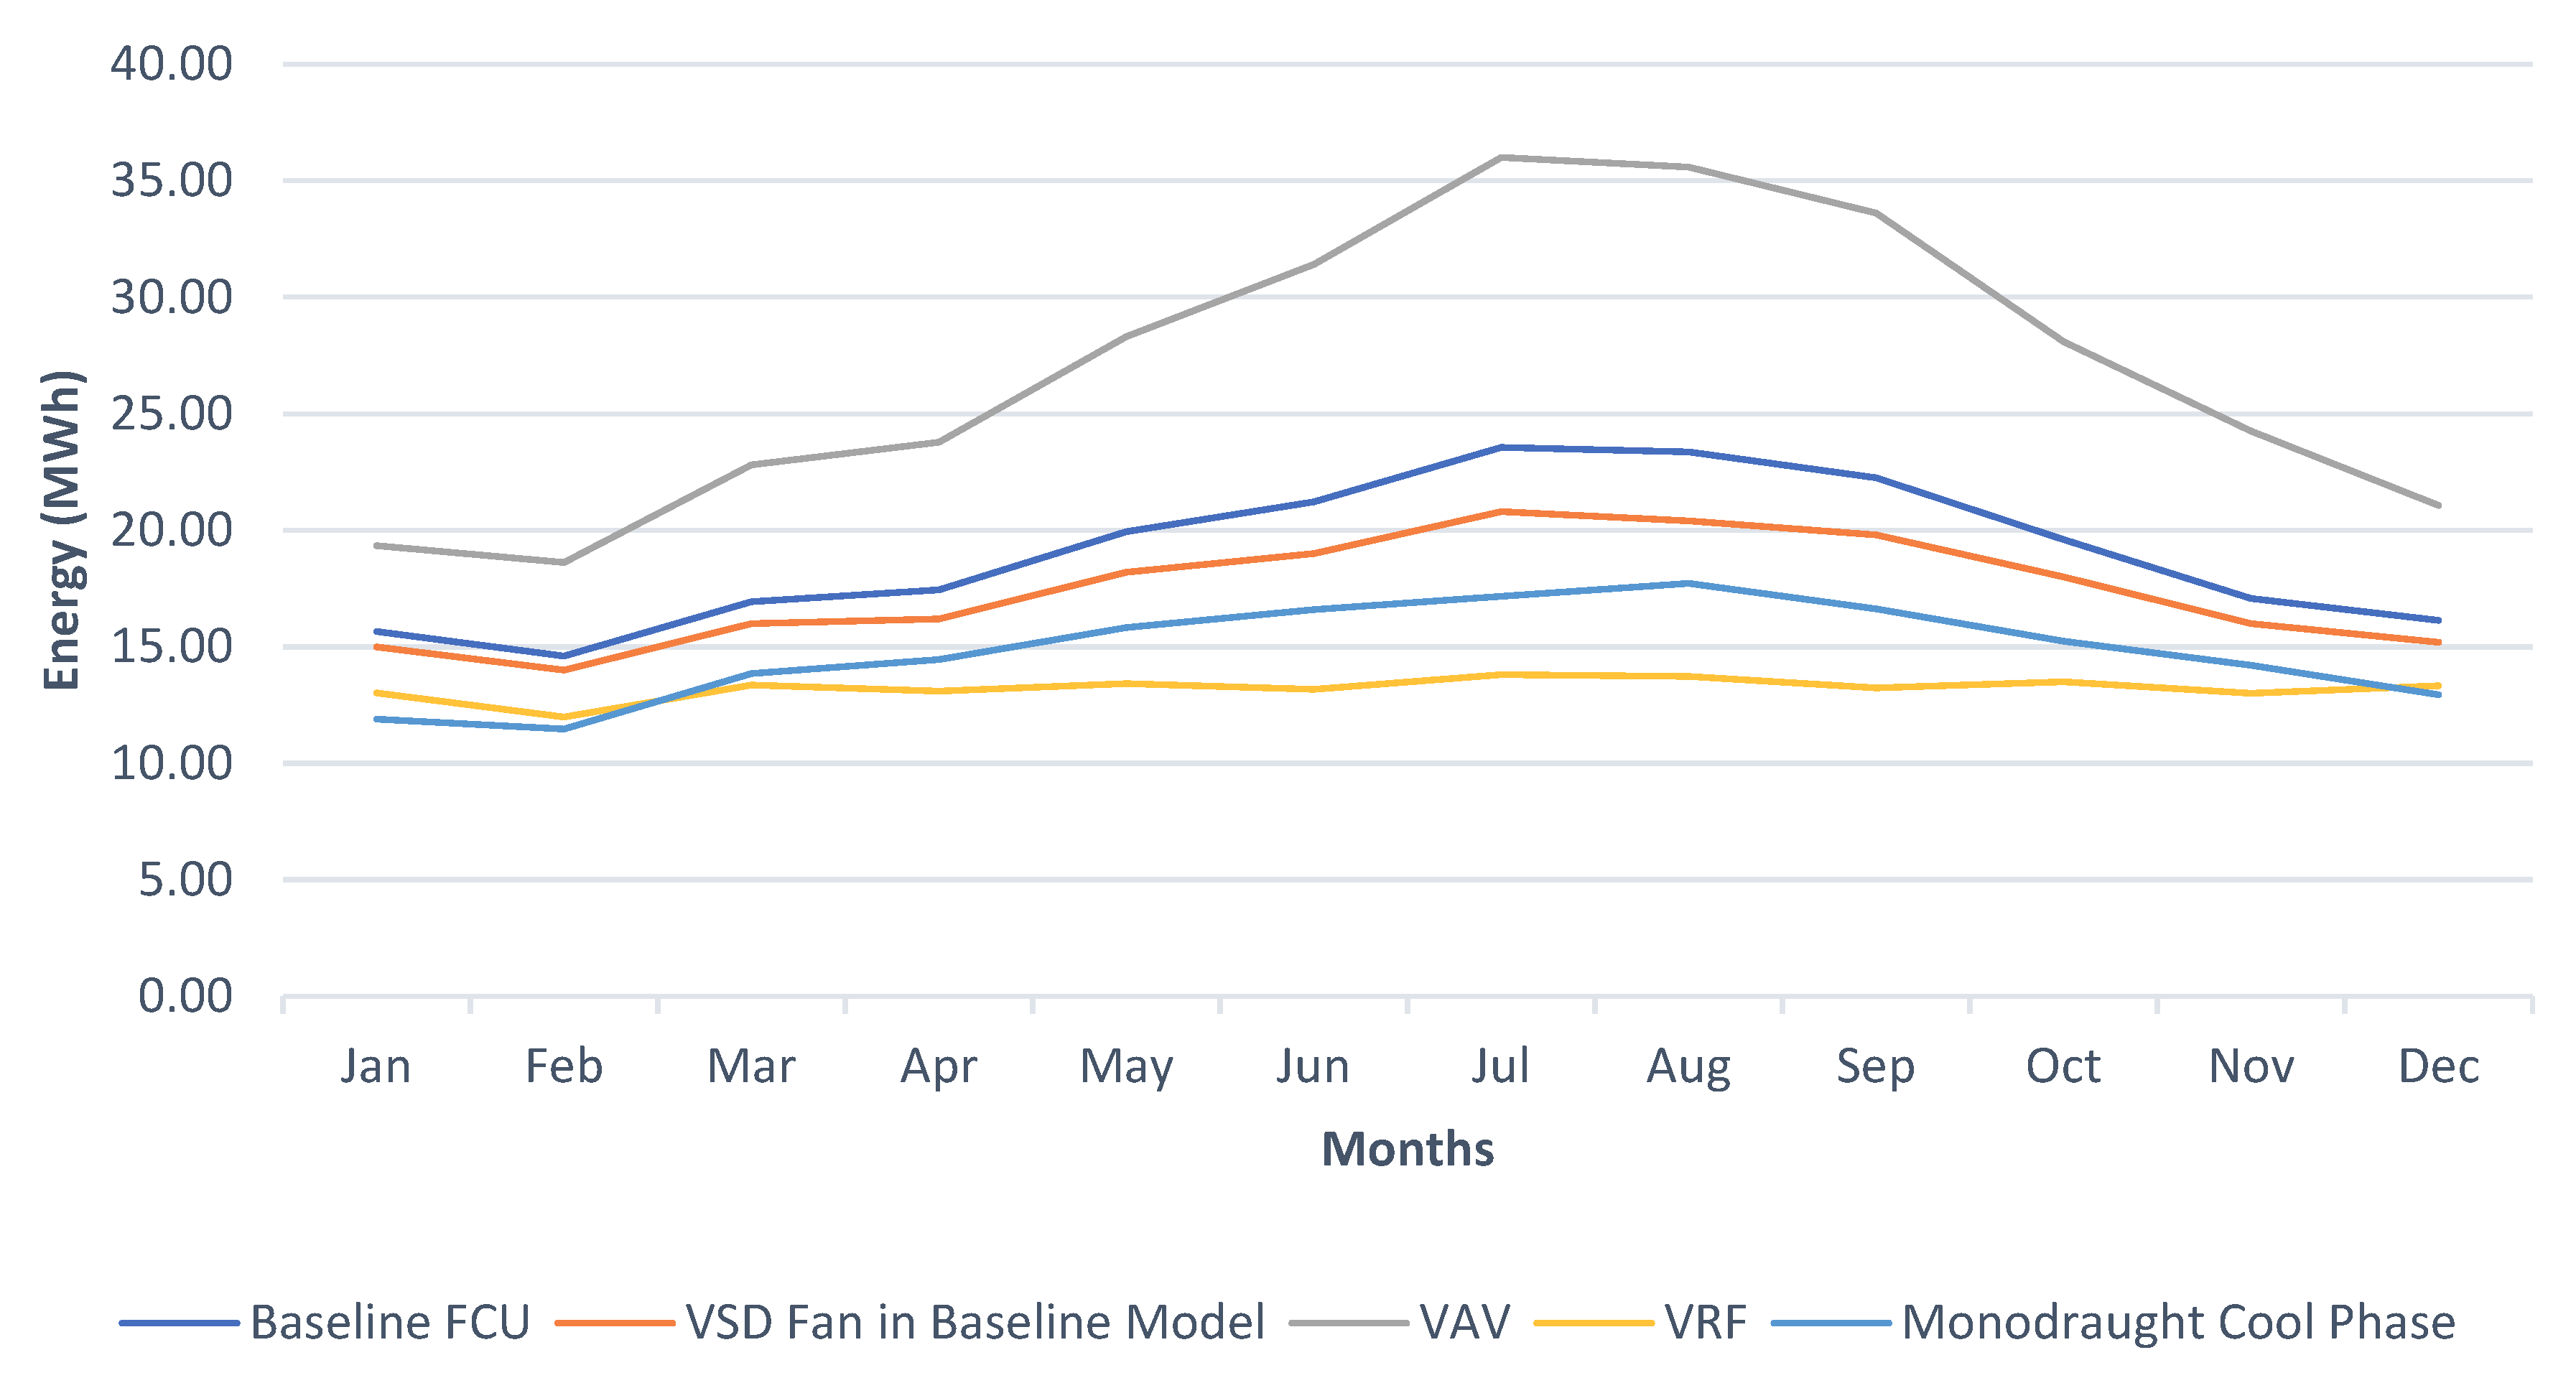
As observed from Figure 3, July had the highest electricity consumption because of the extremely high temperatures during peak summer months and February had the lowest energy consumption because of lower temperatures during winter months showing a strong correlation between the site microclimate and energy consumption. The energy trend had started to gradually increase from March onwards and came back to normal during mid-October. While the energy trend declined significantly between the months of November and February.
During the peak month of July, the VAV system had demonstrated 53% higher energy consumption in contrast to baseline office FCU system because of the greater number of components on the air side and water side. The energy trend showed a sharp variation throughout the different months of the year because of the external conditions. The VAV system is commonly known to occupy larger spatial footprint in any building because of the large sized components such as AHU, chillers, pumps and cooling towers, which are also very energy demanding.
Other cooling systems such as the VRF system had demonstrated an energy saving potential of 41% by eliminating AHU on the air side and chiller, pumps, cooling towers on water-side during peak month. The annual energy trend for VRF system was very steady throughout the months. The adoption of DX cooling coil in the split system was also very beneficial as it allowed the system to have indoor and outdoor units. The evaporator and fan were integrated in indoor units and the scroll compressor, condenser, expansion valve was located in an outdoor unit of the system.
The implementation of VSD in the FCU system had reduced the energy by 13.24% in comparison with the baseline office FCU as the variable speed drive fan matches the air supply to cooling requirement of space which helps to conserve energy and provided more tighter control. The annual energy trend was quite similar to the baseline FCU system with an average variation of 8%.
The energy trend for the Monodraught cool-phase was a bit different as the peak energy consumption was obtained during August with 27% energy reduction against the baseline office FCU as this system took advantage of intelligent AHU with CO2 sensors to match the cold-air supply with cooling demand, which represented August as the peak month and February as the base month. The annual energy trend for the cool-phase showed a slight increase throughout different months.
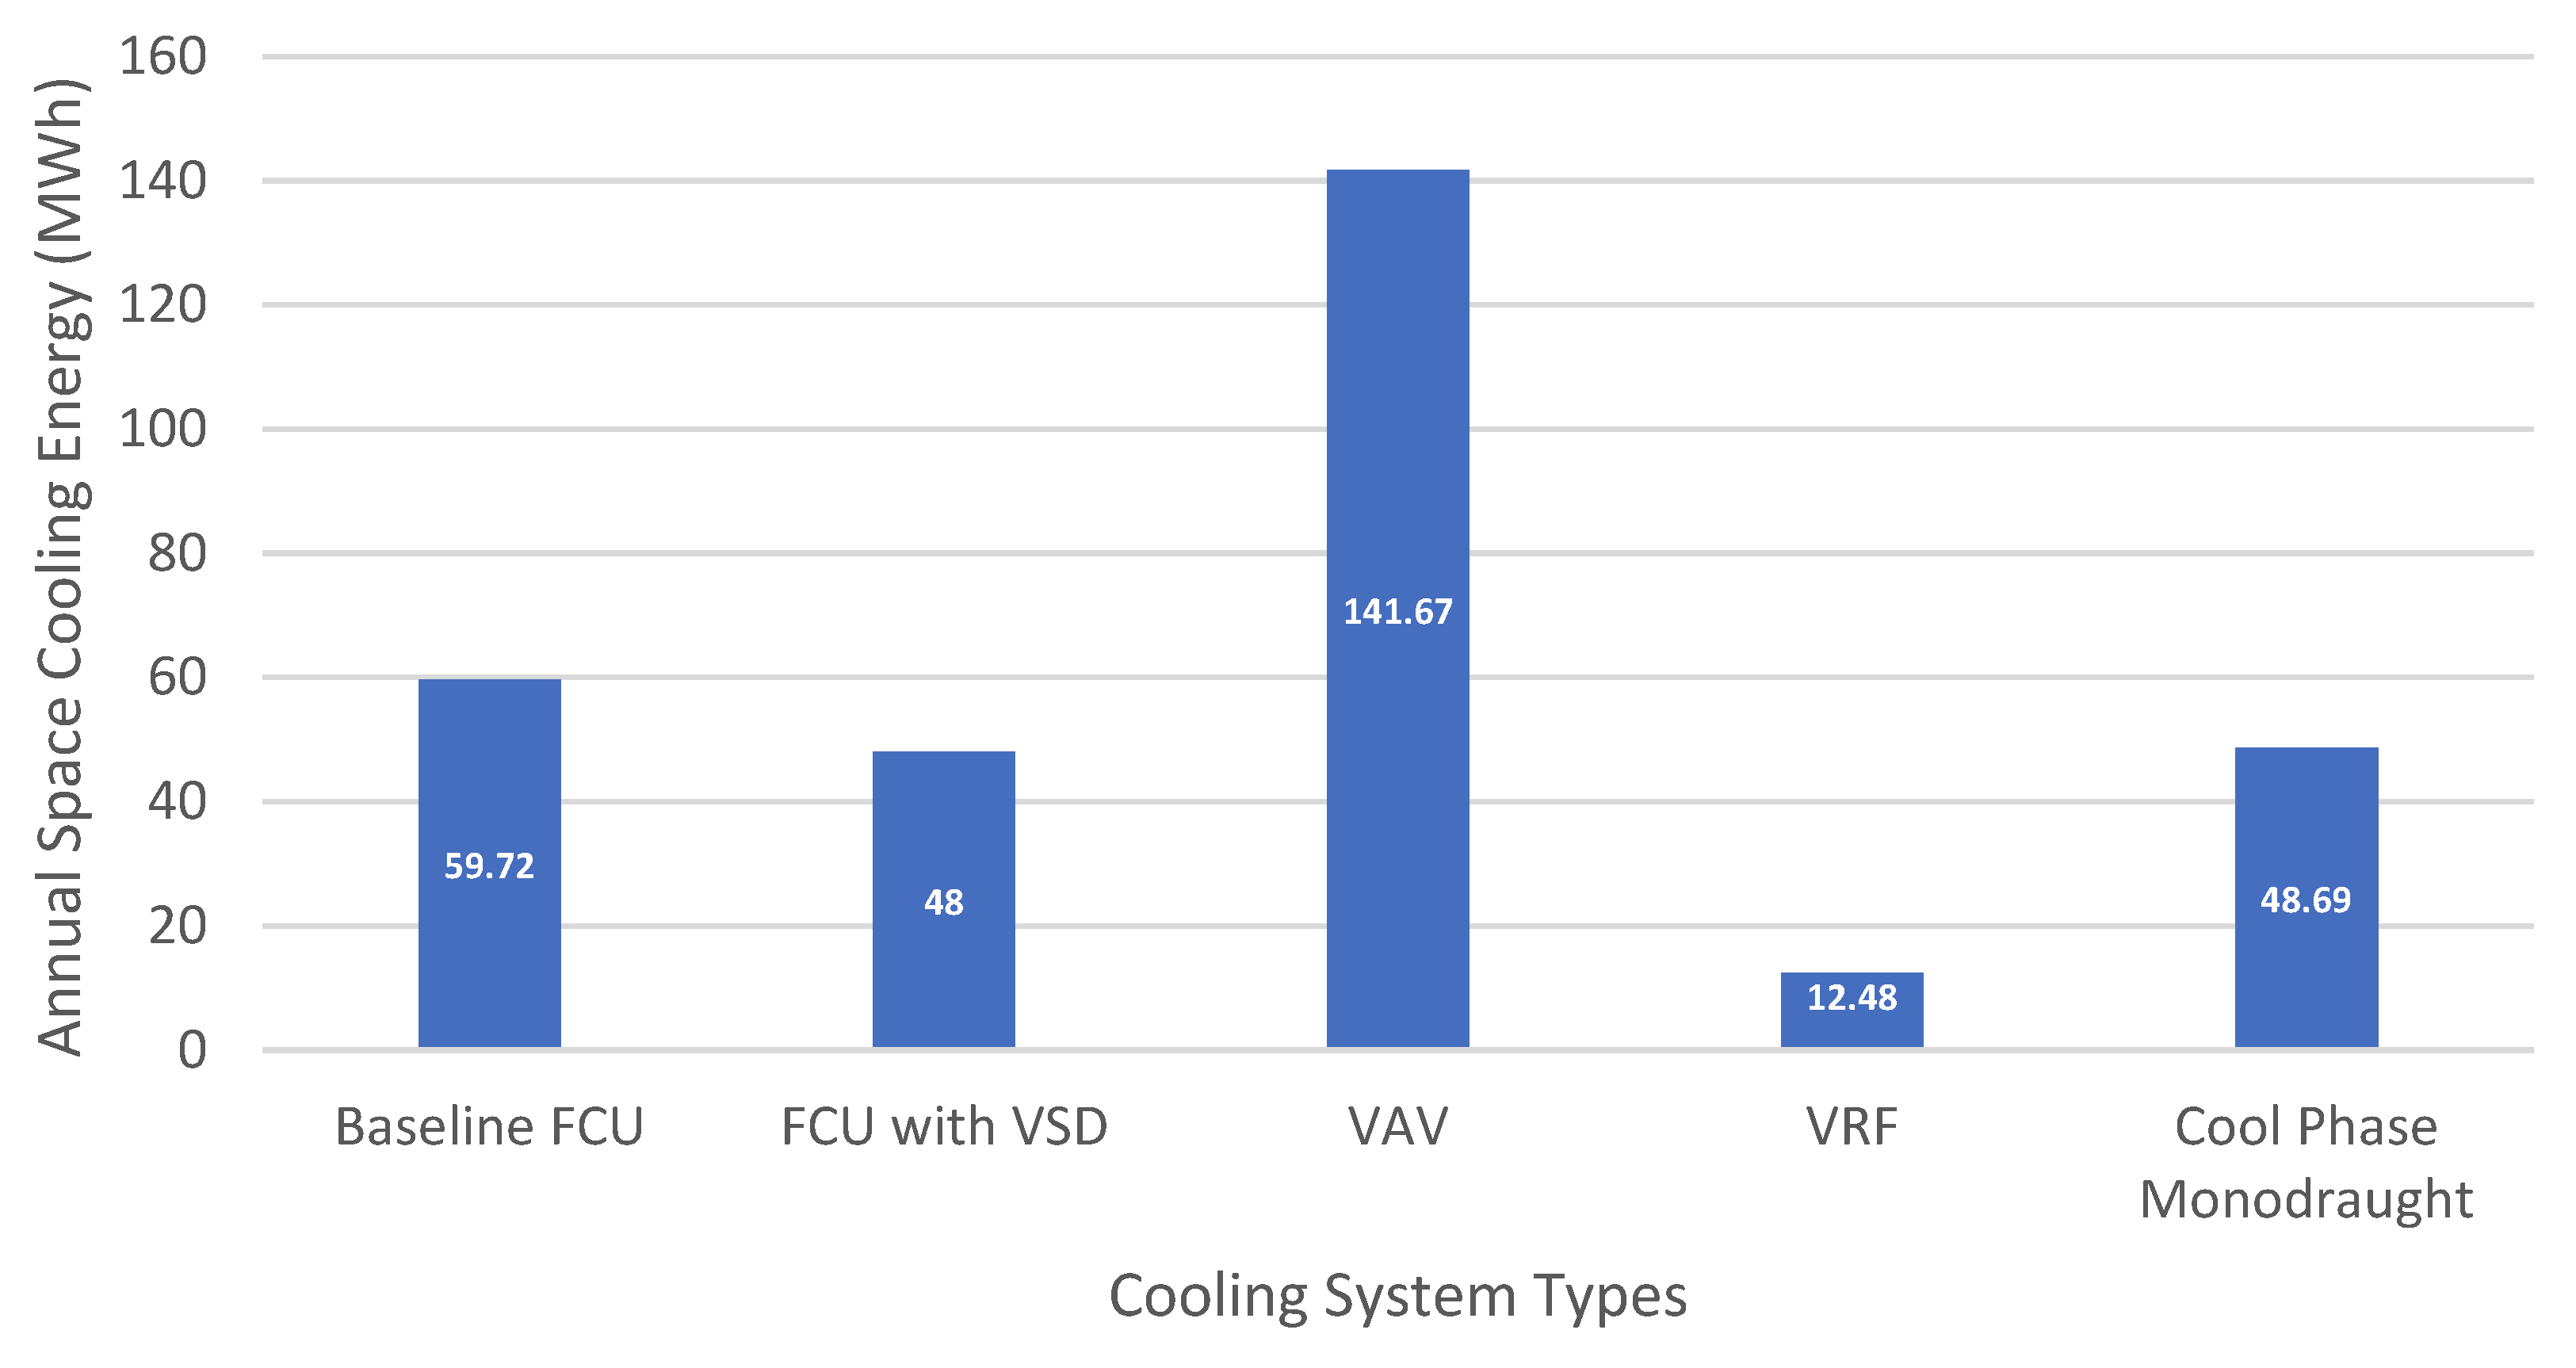
Further detailed analysis was performed by interpreting the space cooling energy and fan energy of different proposed cooling systems. The annual space cooling energy (Figure 4) was determined by integrating all the proposed cooling systems to the IES baseline office model. The VAV system possessed the highest space cooling energy, which even surpassed the baseline FCU. The VRF system had outperformed all the other cooling systems by showing a reduction of 79% against the baseline FCU, which proves it to be of the most energy efficient cooling systems in the industry. However, the space cooling energy from FCU with VSD and the monodraught cool phase was very close by 1.43% because both of the systems utilised VSD fans. Energy saving of 19.62% was achieved by implementing VSD fans in FCU, which proves it to be a very feasible option considering the aspect of effort, time and cost, as it is a plug and play application.
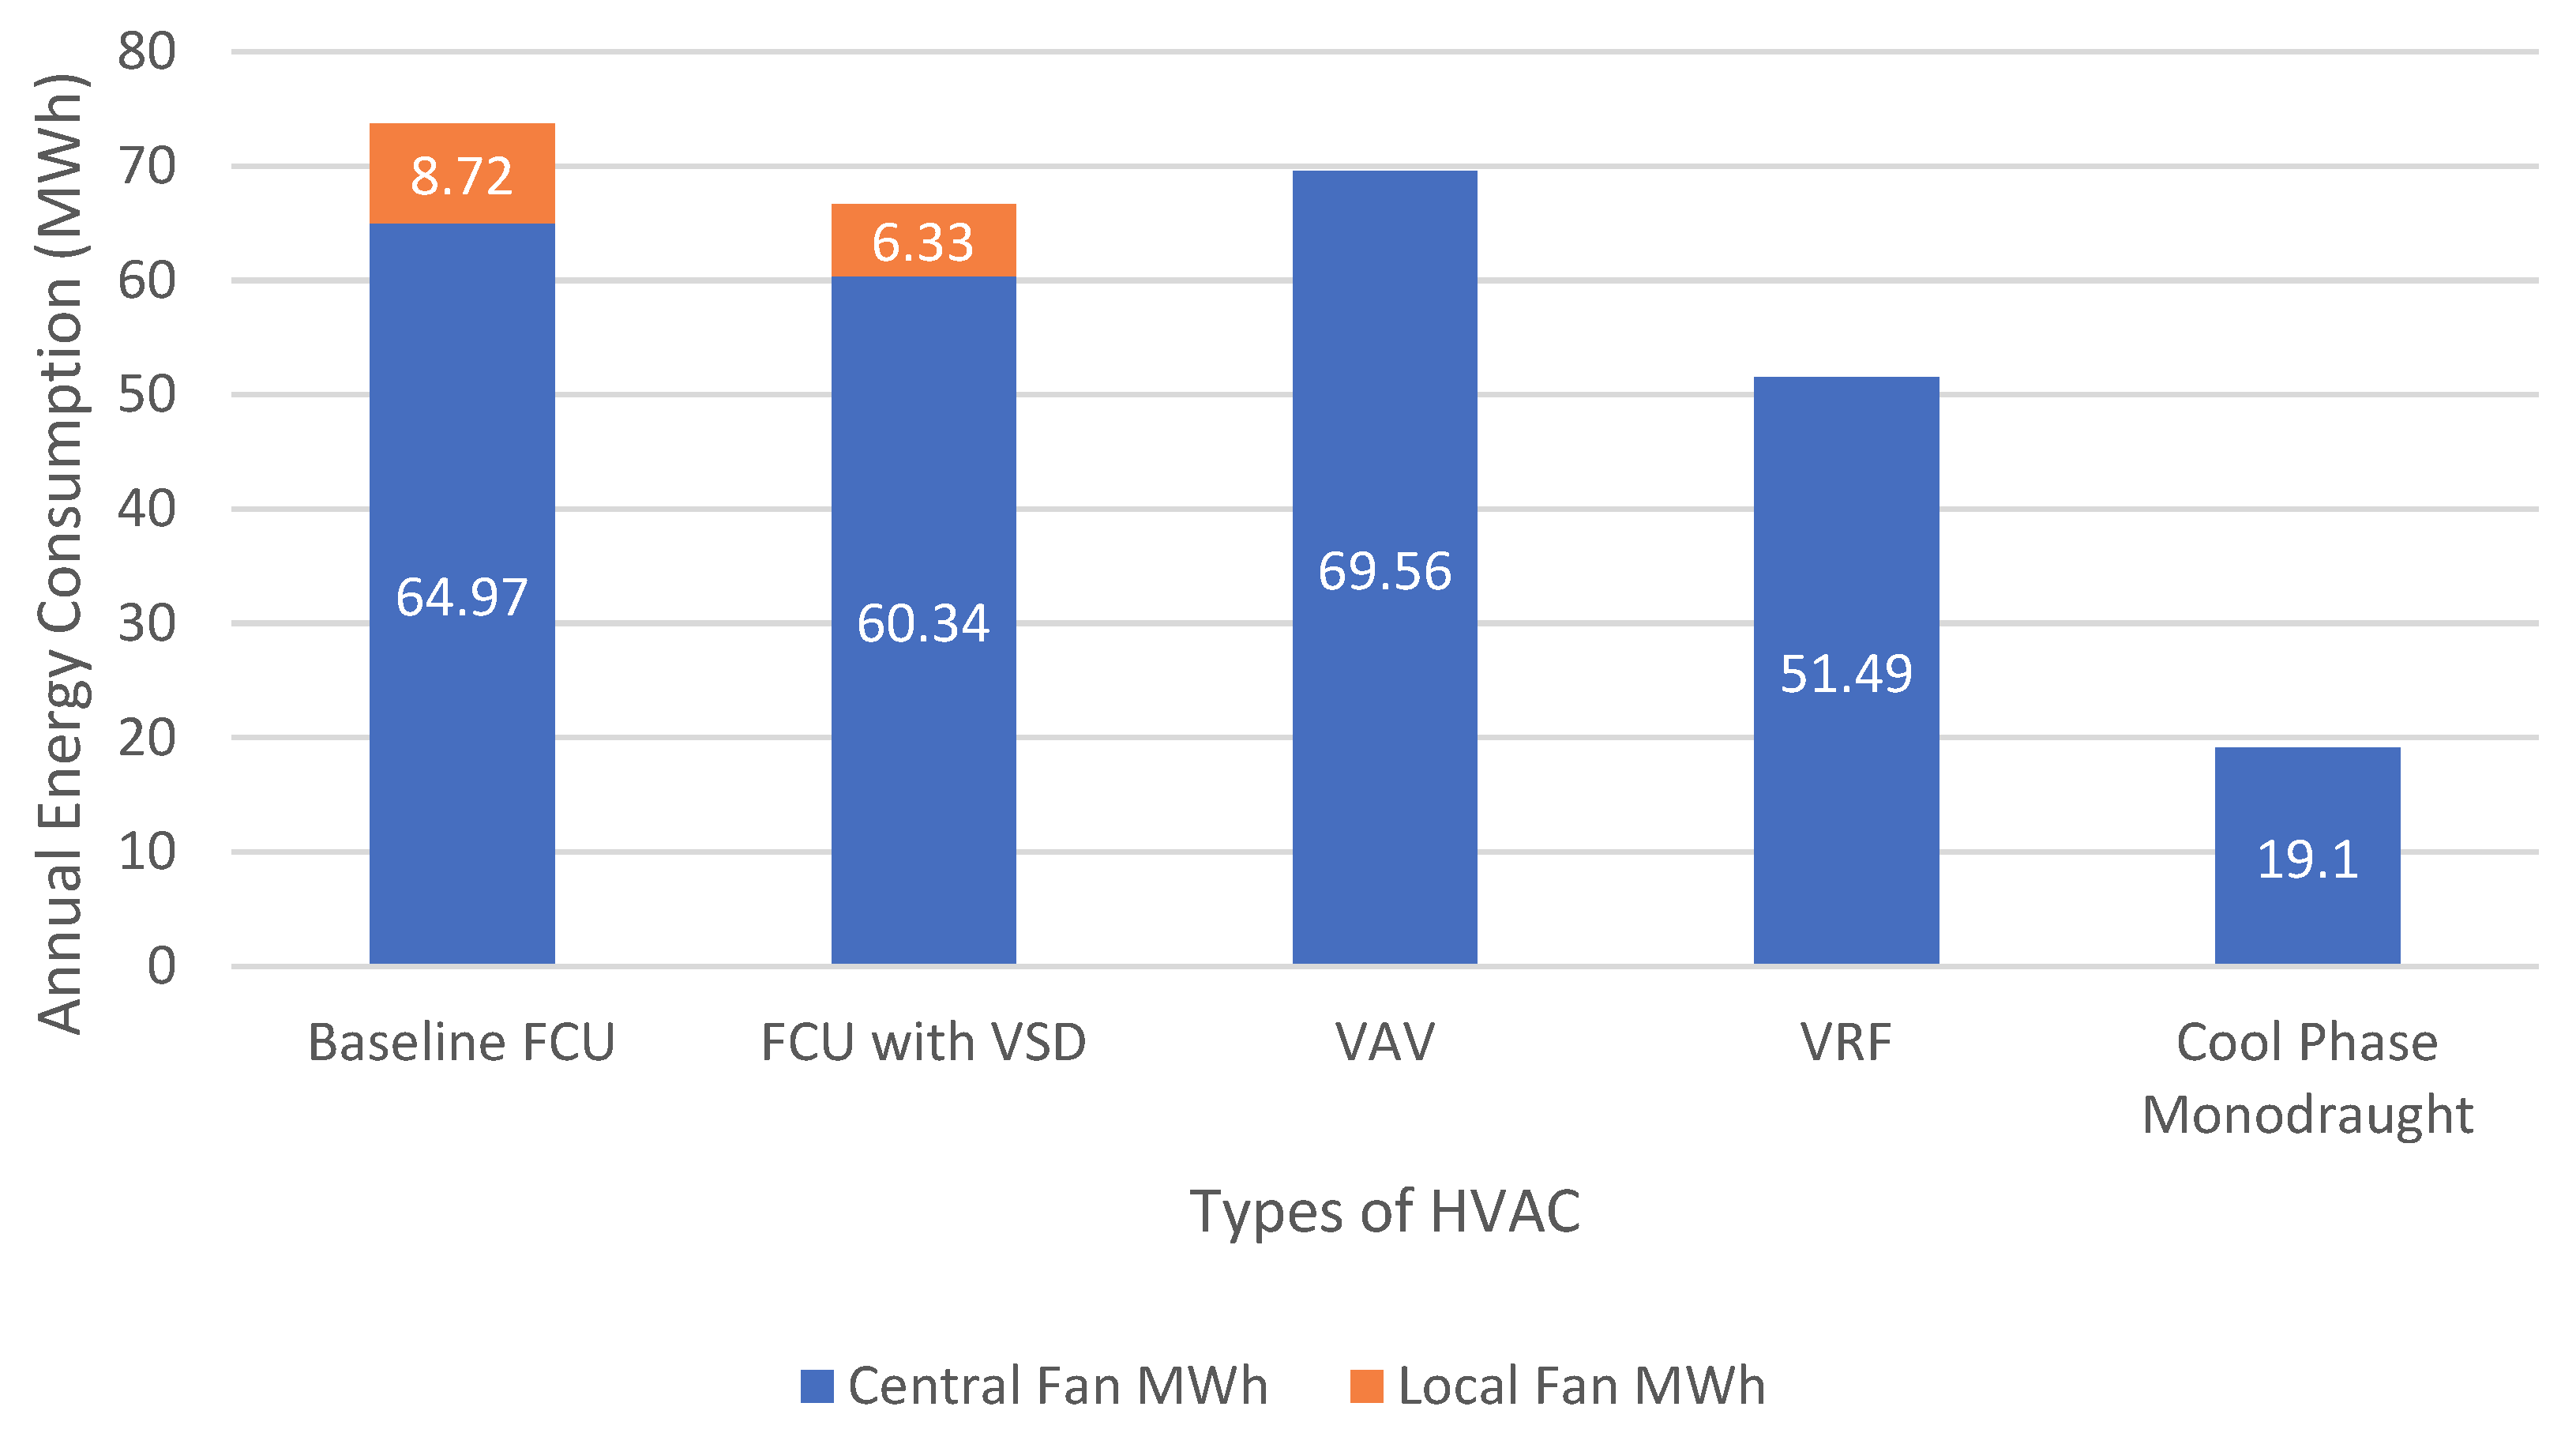
The annual fan energy consumption (Figure 5) was obtained from IES to determine the performance of different cooling systems. It can be observed that both of the fan coil unit (FCU) systems had central and local fans to provide a sufficient amount of airflow for cooling, while the VAV, VRF and Monodraught only relied on central fans. The baseline FCU had an annual fan energy consumption of 73.69 MWh as the highest. The source of energy for central and local fans is the office meter-1. Since different offices within the building have their own submeter. The central fan energy is higher because it is the primary fan inside the AHU. The fan for the monodraught cool-phase proved to be the most energy efficient as it had dropped the fan energy consumption by 74% since it had utilised a single VSD fan as a central fan. The VRF system and FCU with VSD had demonstrated a fan energy saving of 30% and 9.62%. The central fan in VAV system had the highest energy consumption because it heavily relied on traditional fan technology. This overall proved that the VRF and Monodraught cool phase are some of the most energy efficient cooling technologies. The central fan energy use was much higher than the joint FCU fan energy use because it was the assortment of the complete energy use of individual FCU units.

3.2. Indoor Air Quality (IAQ)

CO2 concentration was used as a parameter to examine the indoor air quality after the implementation of various cooling systems in office model because the health and well-being of office employees plays a crucial role towards utmost productivity of any organization. Numerous studies have indicated the significance of evaluating the indoor air quality because people spend more than 90% of their working hours in the office environment. Inadequate ventilation by HVAC systems could be identified as some of the major causes for poor indoor air quality.
The average CO2 concentration (Table 15) for the baseline office model was 624.2 PPM being fairly adequate as it was within the acceptable range of 600 PPM and 800 PPM [17]. The adoption of the VSD fan in the baseline fan coil unit (FCU) did not impact the indoor air quality as the CO2 concentration was fairly consistent because it was a part of medium retrofitting, which was being implemented by replacing the fan. The VAV system was able to enhance the indoor air quality by showing a reduction of 10.36% in CO2 concentration only because the system heavily relied on treating outdoor fresh air in AHU and the proportion of fresh air is always maintained at 30%. The VRF system had shown an average CO2 concentration of 3597 PPM, which meant that the indoor air quality was undesirable because of the lack of availability to supply fresh air as the cooling system was completely based upon unitary vapor compression with direct expansion technology [18]. On the other hand, the Monodraught Cool Phase system was also able to maintain an appropriate level of CO2 concentration being 6.1% lower than baseline FCU system because it utilised outdoor fresh air to supply the treated air into the space.
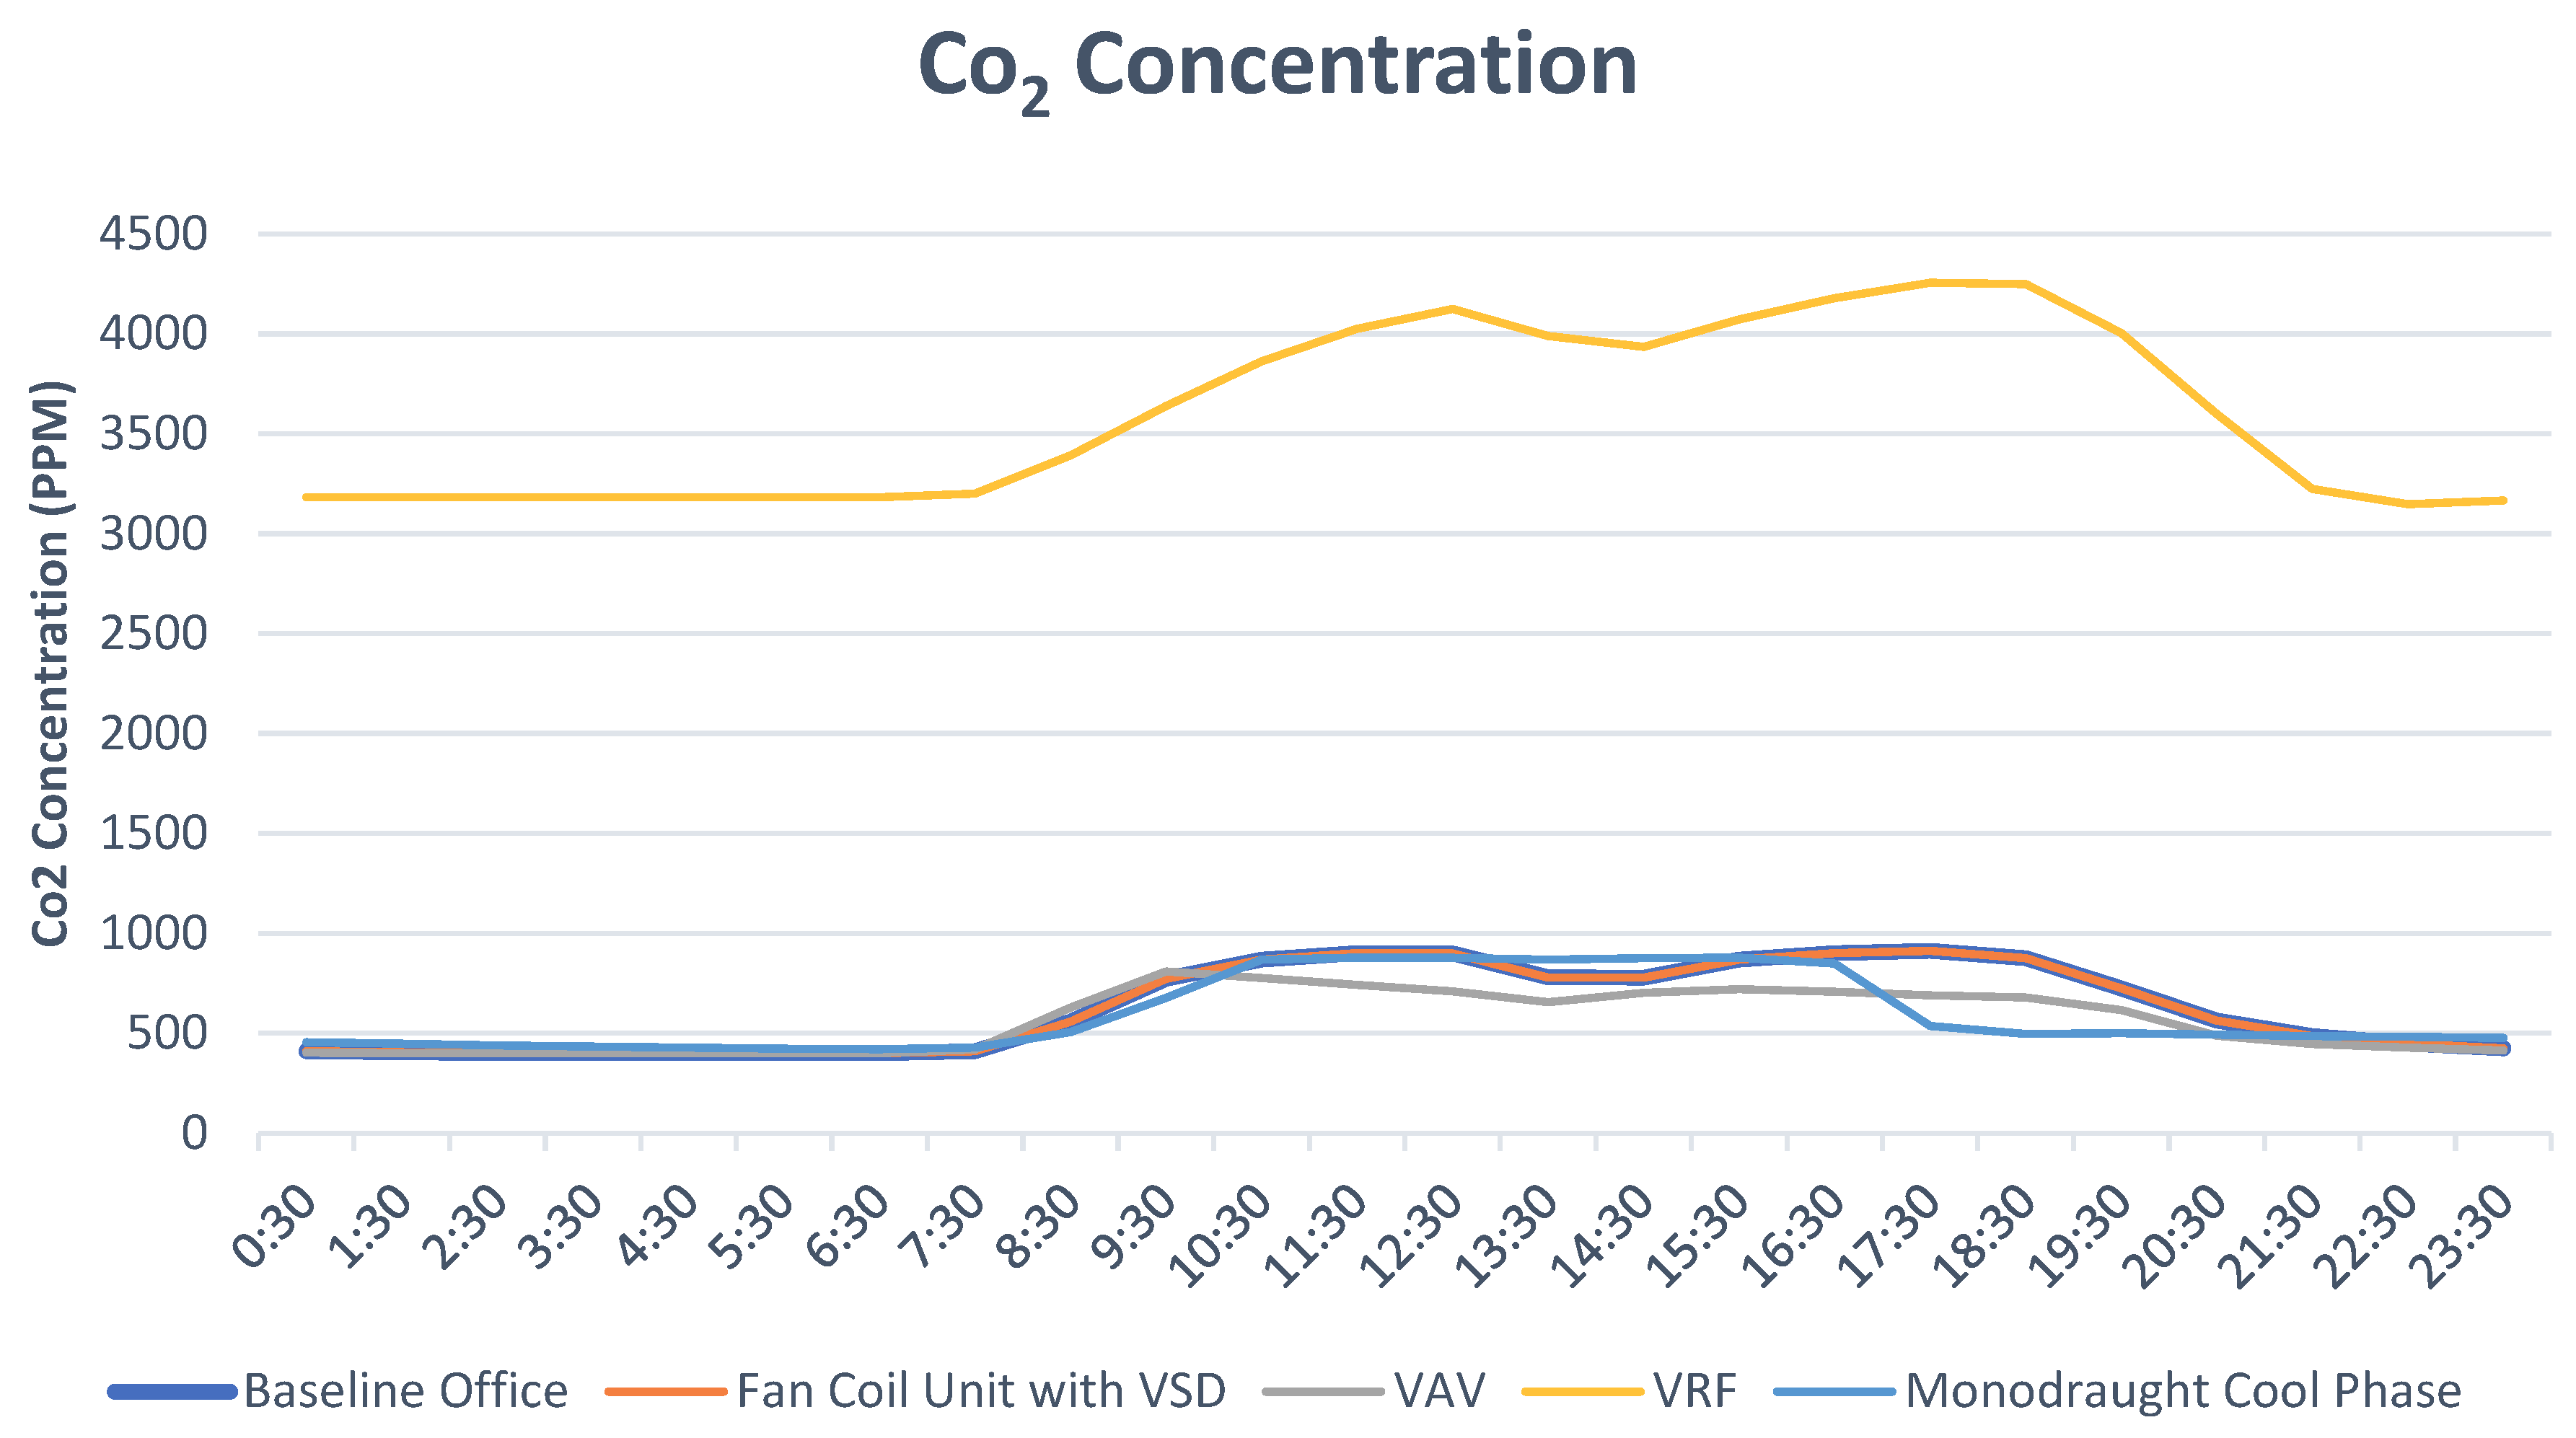
Figure 6 shows the CO2 concentration level maintained throughout 17th July by various cooling systems. The CO2 concentration trend started increasing once the occupants started entering the office from 8:30 a.m. onwards and persisted until 8:30 p.m. The peak CO2 concentration for baseline office model was at 5:30 p.m. due to greater occupancy. The VRF system had drastically failed to maintain an optimum level of CO2 concentration as it had surpassed the safety threshold causing sick building syndrome [17]. While the VAV system and Monodraught cool-phase were able to maintain an optimum level of CO2 concentration proving that the quality of indoor air was suitable for human occupancy in office environment. The cooling system’s ability to supply fresh air into the indoor spaces could be considered as the paramount to maintain a suitable level of CO2 concentration for creating a pleasant work environment. The trend for the VRF in Figure 6 somehow supports the average CO2 concentration level from Table 15 and justifies the incapability of VRF cooling systems to provide sufficient indoor air quality to meet the industry standards due to the lack of additional ventilation systems.

3.3. Thermal Comfort

Predicted Mean Vote (PMV) was used to perform the thermal comfort analysis using different cooling systems in the office model and the values had been obtained from IES-VE Vista-Pro. The PMV is based upon the Fangers scale, which is also referred to as ASHRAE thermal sensation scale and mostly ranges between −3 (Cold) to +3 (Hot).
The average PMV for the baseline office model was obtained for different cooling systems to analyse the performance of cooling system to achieve the desirable thermal comfort satisfaction for occupants. According to ASHRAE standard 55, the PMV values varying between −0.5 to +0.5 are within the acceptable human comfort range. As per Table 16 above, the baseline office with FCU had an average PMV of 0.53 being close to +0.5, which means that it was compliant with ASHRAE 55. While the adoption of VSD fans in FCU system had slightly increased the PMV by 16.5%, which was still within the acceptable range. However, the VAV system had outperformed other cooling systems as the PMV value was higher than the baseline FCU by 22.64%.
The degree of discomfort amongst occupants was greater with the use of VRF and Monodraught because the VRF system did not have any provision for fresh air supply, which somehow deteriorated the thermal comfort satisfaction for occupants, while in Monodraught the thermal battery (PCM) was not able to absorb the surrounding heat enough to meet the heavy cooling demand of the Middle East. The average PMV for the VRF system was 1.06, which was manageable as the values mostly ranged between 0.7 and 1.41.

3.3.1. Annual PMV Prediction

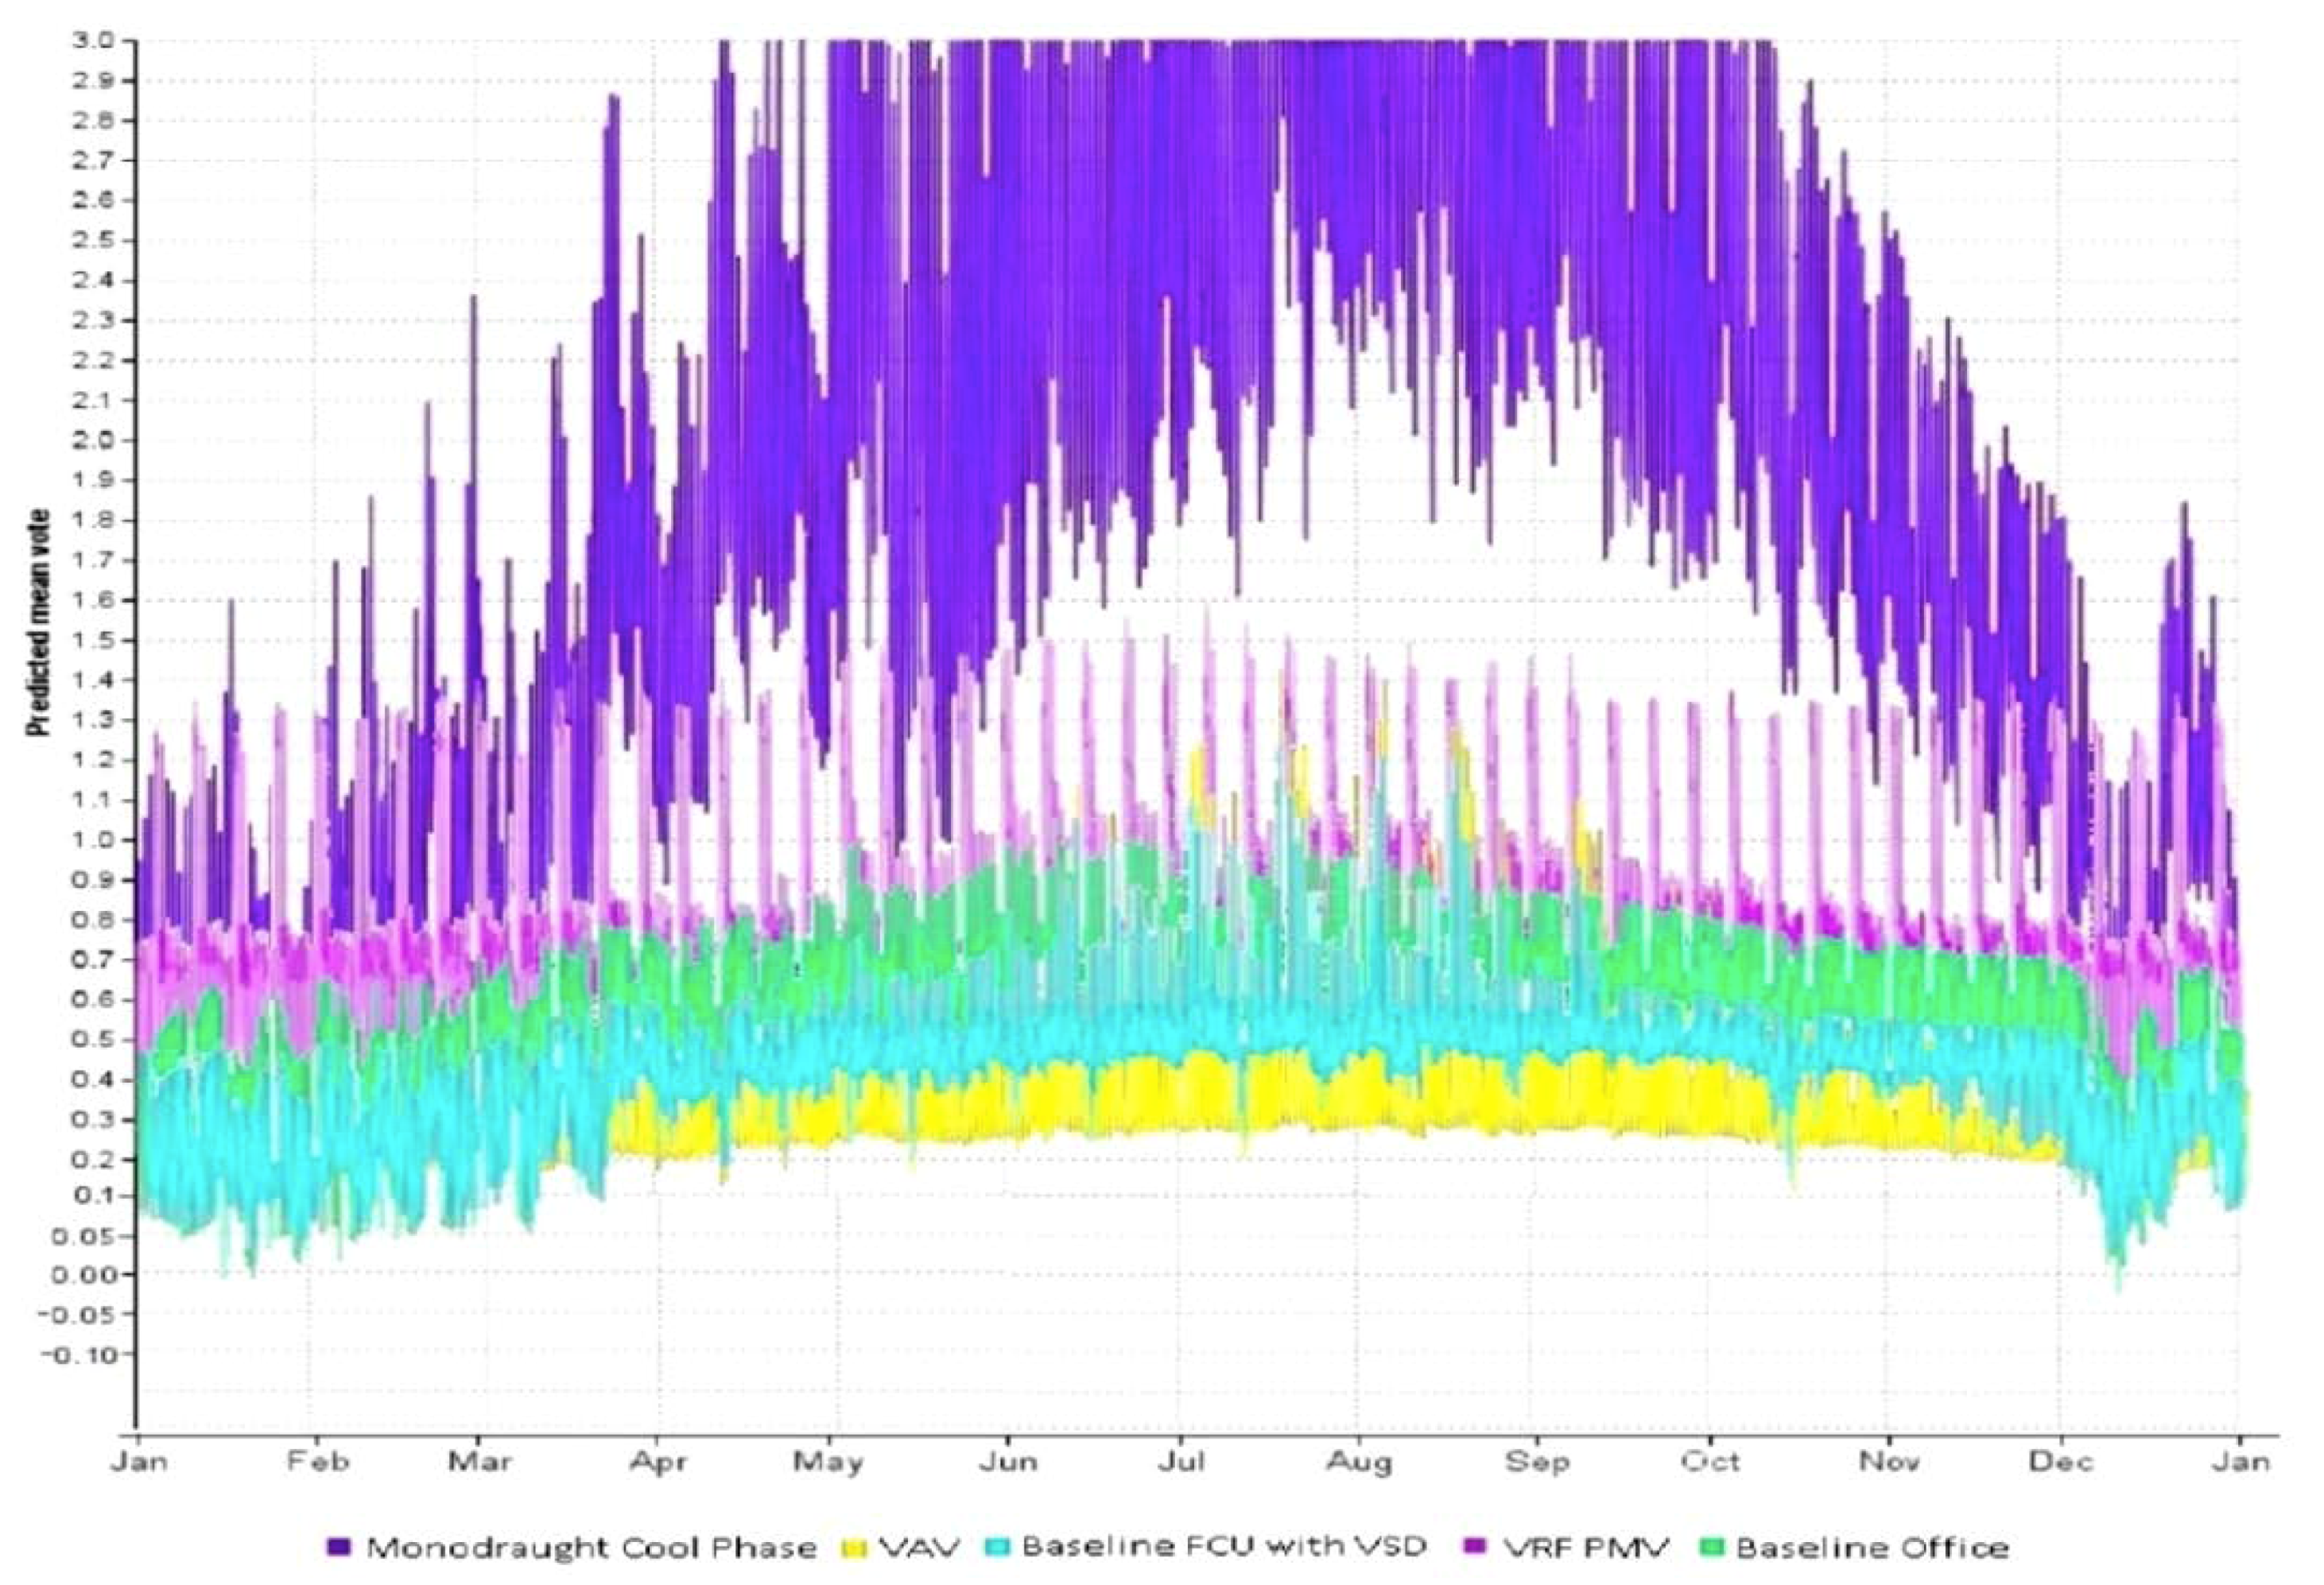
The annual PMV trend indicates long-term thermal comfort satisfaction for the occupants after adoption of different cooling techniques. From Figure 7, it can be observed that the level of thermal discomfort was mostly high between July and August because of the extremely high summer temperatures. A cumulative trend was observed as PMV started increasing from May onwards because of the summer outset and remained high until December when PMV started to get back to normal at 0.5 because of the winter.
The PMV values for the baseline office were mostly within the acceptable thermal comfort range of −0.5 to +0.5 (ASHRAE 55) because the values were within the range and only became higher by 43% during mid-July because of excessive heat. The adoption of VSD in baseline Fan coil unit had increased the PMV range, which had also led to an increase in the thermal discomfort level by 80% during the peak interval.
The VAV cooling system had increased the PMV range with values mostly between +1.5 and −0.05, indicating that the level of thermal discomfort had drastically increased during peak summer months. The PMV range in VRF system was a bit constrained as the upper limit was reduced by 7% and the level of thermal dissatisfaction was also very similar to baseline office Fan Coil Unit (FCU) because the VRF system used sophisticated controls maintain an optimum temperature for the office occupant. The monodraught cool-phase had drastically deteriorated the thermal comfort as the PMV range was significantly increased because the system used a hybrid cooling technology with a thermal battery, which was not able to absorb the surrounding heat because of the extreme hot climatic conditions of the Middle East.

3.3.2. Daily PMV Prediction

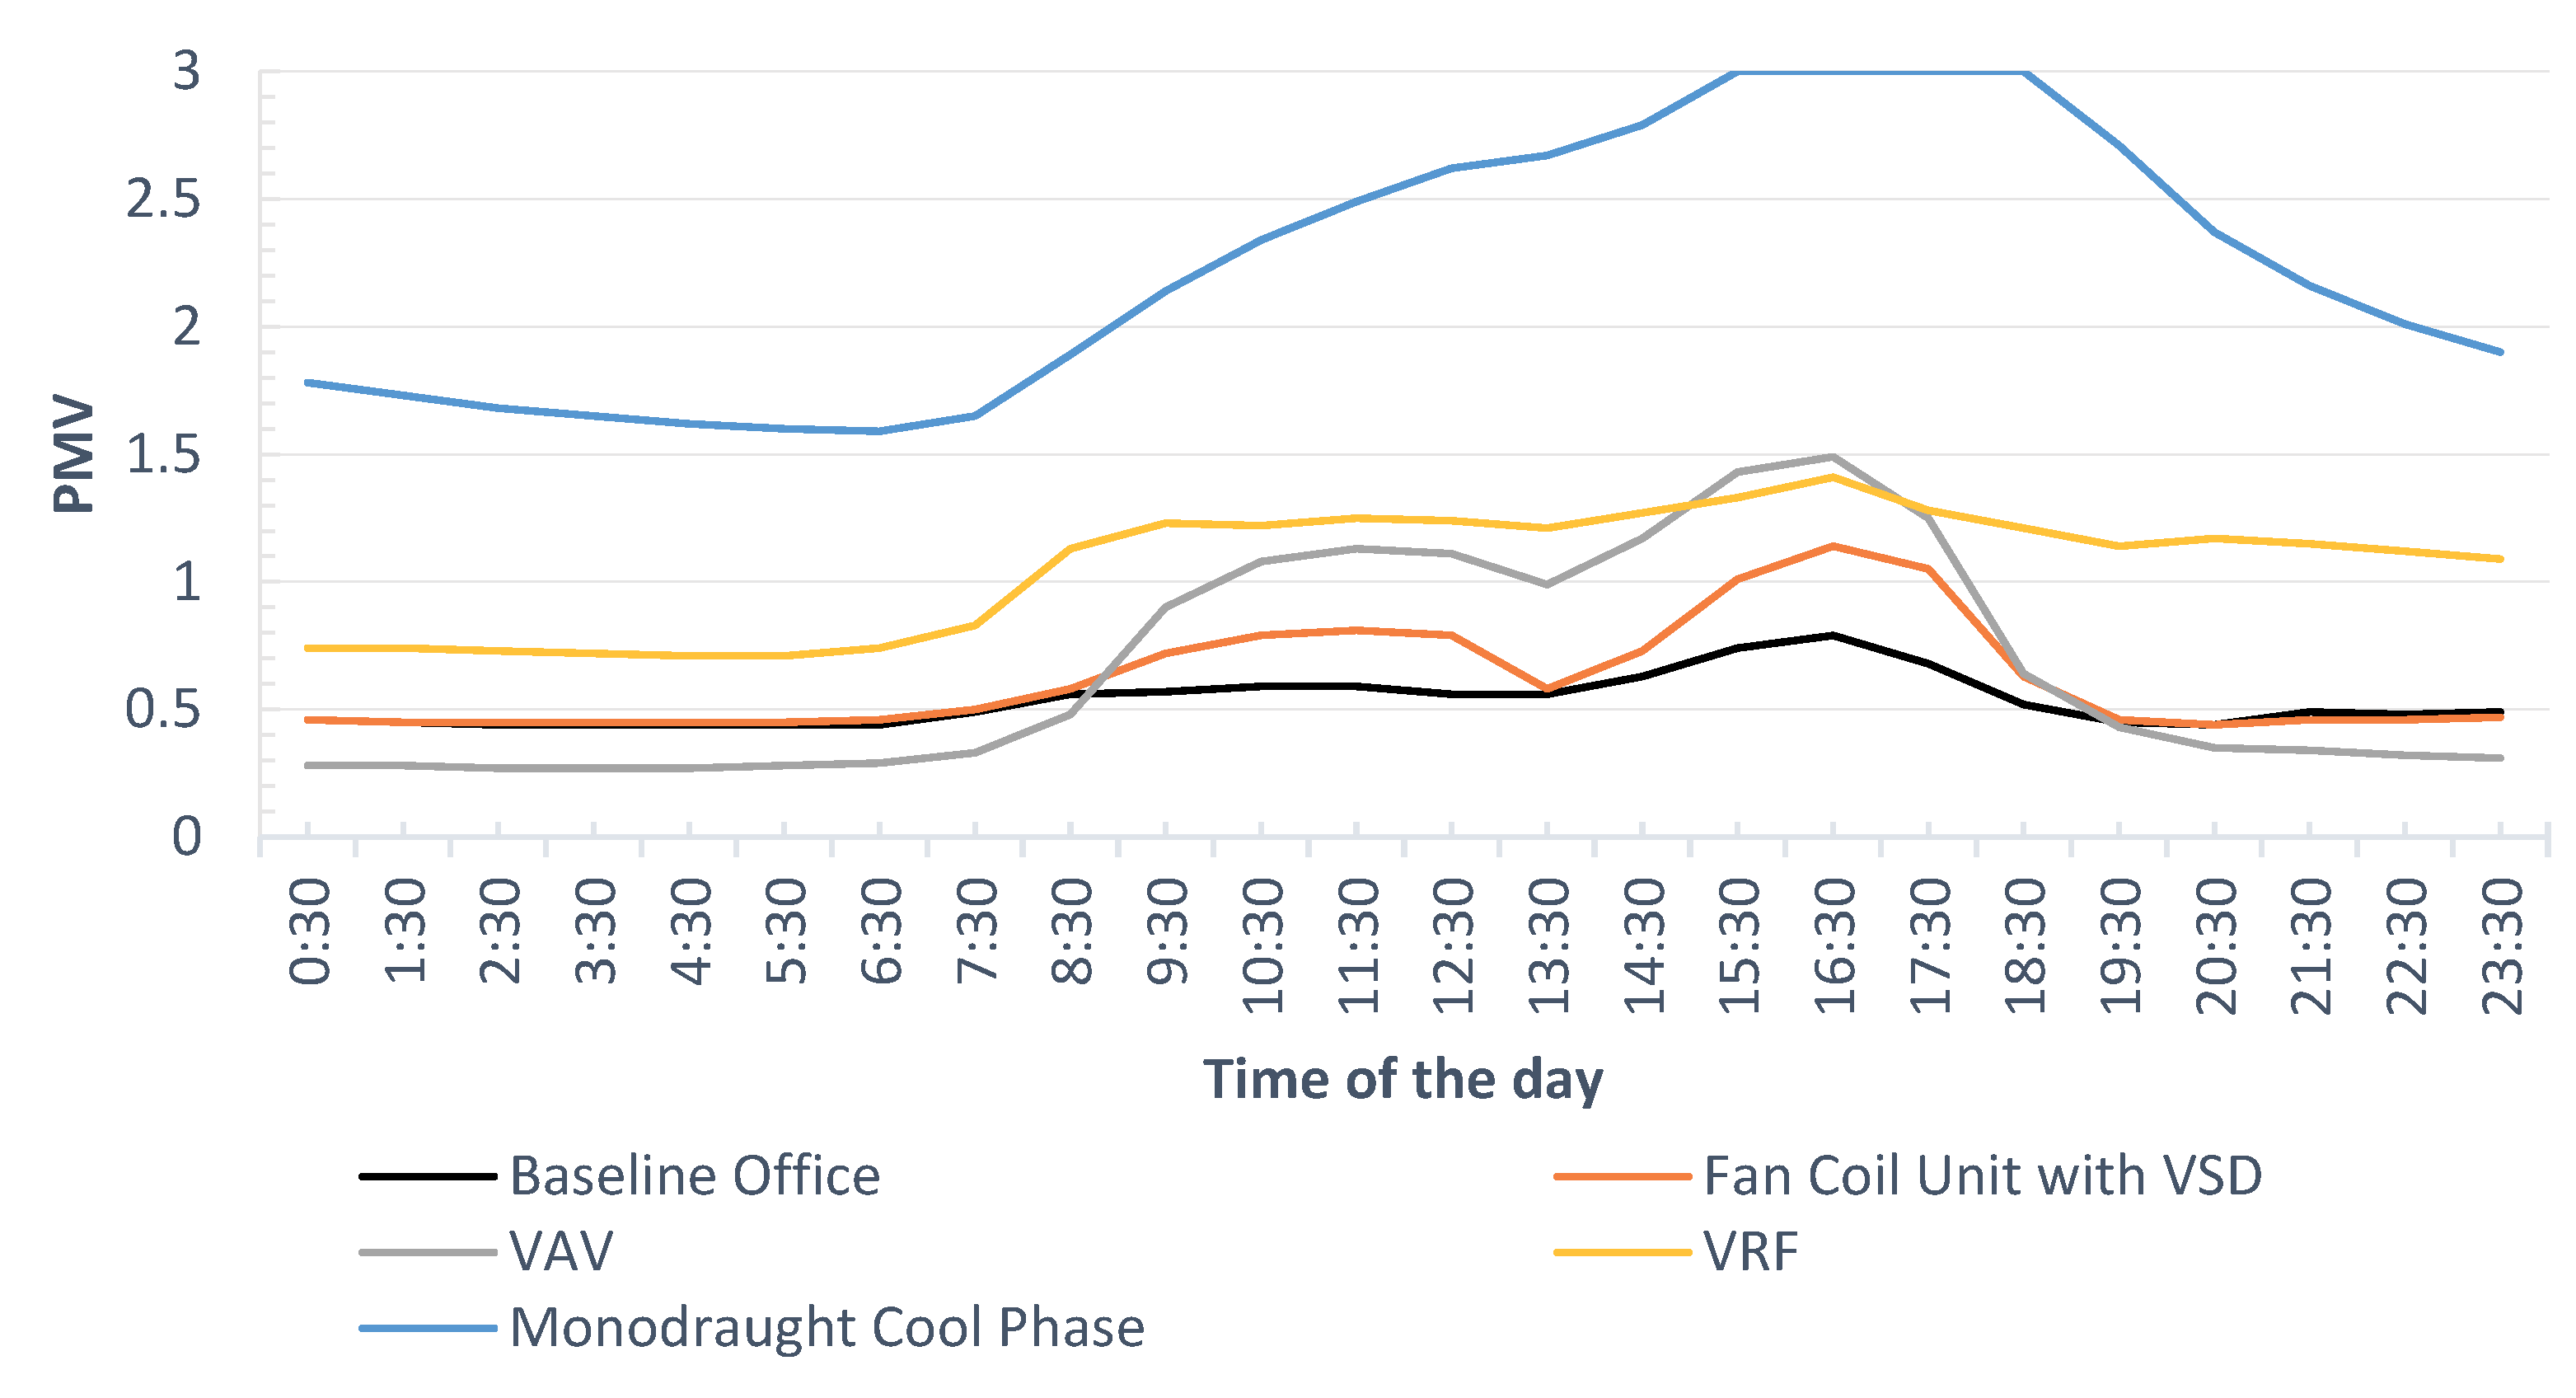
Figure 8 displays the PMV trend of the office model on 17th July with the adoption of different cooling techniques. The PMV trend was at peak between 3:30 p.m. and 5:30 p.m. because of the intense solar radiation during the peak summer month of July. The PMV trend for the baseline office model showed an acceptable level of thermal comfort as most of the values ranged between 0.44 and 0.79, which were somehow between 0 (Neutral) and 1 (Slightly Warm). The adoption of the Variable Speed Drive (VSD) Fan had slightly increased the thermal discomfort level by an average 17% because it gave the fan coil unit the ability to adjust the fan speed according to set point temperature. The PMV values mostly varied between 0.45 and 1.14 showing a rise in degree of discomfort in upper range by 44.30%.
The VAV system was able to maintain an optimum level of thermal comfort as the PMV values mostly fluctuated between 0.28 and 1.5 indicating that the level of discomfort had increased by 24.5% when compared against baseline FCU. The PMV trend for VAV system had started gradually increasing from 8:30 a.m. onwards and continued increasing until 5:30 a.m. The VRF system showed a steady rise in PMV from 8:30 a.m. and continued increasing until 6:30 p.m. However, in the Monodraught Cool Phase System, the PMV trend had significant variation as the PMV gradually increased from 9:30 a.m. and only declined from 7:30 p.m.
The overall thermal comfort analysis proves that the VRF and monodraught cool-phase systems were not able to comply with the ASHRAE 55 because of the design failure and climatic variation. The VRF cooling systems suffered with the problem of poor indoor air quality, which somehow also affected its thermal comfort performance, while the Monodraught cool-phase was a hybrid cooling system that heavily relied on the thermal batteries for space cooling. However, the thermal battery could not meet the sufficient cooling demands because of the heavy cooling demands as the thermal batteries require some time to get recharged.

4. Model Comparison with Literature

Actual office characteristics and FCU system had been modelled in the IES-VE software to replicate the baseline operation of the office building. The validation of the model was performed by comparing against industry benchmark standards and literature. IES-VE simulations are heavily reliant on the weather data of a particular location as this can have a direct impact on the performance of the building. There are two types of weather files test reference year (TRY) and design summer year (DSY) which include data sets of dry bulb and wet bulb temperature, solar radiation, wind speed, atmospheric pressure, and cloud cover [19].
Dynamic simulation results of the baseline office with the FCU system determined the annual energy consumption to be 227.78 MWh that translated to an energy intensity unit of 331.4 kWh/m2, which was validated against the local building standard as it was 0.45% lower than typical office buildings’ benchmarks from Emirates Green Building Council guidelines [20]. The average CO2 concentration was 624.2 PPM, being fairly appropriate as it could be confirmed from an experiment conducted by Ibrahim [21], showing that an average CO2 concentration of 538.5 PPM for office building is tolerable. The American Society of Heating Refrigeration and Air-Conditioning Engineers (ASHRAE) states that any CO2 concentration level below 1000 PPM is fairly acceptable. On the other hand, the baseline office model had an average PMV of 0.53 indicating a moderate satisfaction level (−0.5 < PMV < +0.5) of thermal comfort for occupants in office environments based on the thermal acceptability criteria of ISO 7730 [22].
The addition of VSD in a baseline FCU system had reduced the overall annual energy consumption by 8.24% by targeting space cooling with a significant reduction of 20%. The CO2 concentration was not affected as it remained constant similar to the baseline FCU system, while the PMV value for thermal comfort had slightly increased due to the adoption of a VSD fan that gave the FCU system the ability to control the air-flow with respect to thermostat setting, causing the thermal discomfort to increase because a constant set point temperature was maintained throughout the office [23,24].
The adoption of a VAV cooling system drastically increased the annual energy consumption by 42% due to the greater number of components, which can also be confirmed by a simulation study conducted by Kim et al. [25], showing that VAV consumes 15–42% greater energy than any other HVAC system. Meanwhile, the average CO2 concentration was 559.5 PPM, meaning that it was compliant with the ASHRAE and the average thermal comfort PMV was 0.65, indicating that it was meeting the least satisfaction level (−0.7 < PMV < +0.7) of thermal comfort criteria as per the ISO 7730 [22]. The CO2 concentration within the space can also be used as an indicator to recognize if the ventilation provided by the HVAC system is adequate.
A VRF system was proposed as a cooling system to reduce the overall energy consumption and improve the thermal comfort for occupants. The cooling system had successfully demonstrated an annual energy saving potential of 30%, which could also be validated with the help of research undertaken by Aynur et al. [13], showing that the overall energy savings potential mostly ranges between 27.1–57.9% in contrast to other conventional HVAC systems. The performance of the VRF cooling system in terms of indoor air quality and thermal comfort was unsatisfactory as the average CO2 concentration was 3957 PPM and PMV was 1.06, being fairly unacceptable, and this could also be validated with the research led by Bhatia [26] highlighting that one of the main challenges associated with the integrating of VRF systems is the failure to comply with the ASHRAE 62.1 to achieve a satisfactory level of indoor air quality. Another piece of literature by Goetzler [18] pointed out the necessity to integrate additional ventilation systems in conjunction with VRF systems to maintain an appropriate level of level of indoor air quality. Reiterating from the literature, an experimental study conducted by Aynur et al. [13], with the help of integrating an energy recovery ventilator, reflected that the VRF system had shown a vast improvement in the thermal comfort and indoor air quality.
The monodraught cool-phase was proposed as a natural cooling technique that helped to cut down the annual energy consumption of the office by 22%. This system was able to maintain an average CO2 concentration of 586 PPM, which is quite acceptable for the office environment in accordance with ASHRAE and could also be validated by a study conducted in the University of West England to integrate the monodraught cool-phase system, showing that an average CO2 concentration of 675 PPM is also adequate [16]. The PMV value of 2.22 was unacceptable as the level of thermal discomfort was significantly higher, which could mostly be due to the inability of the thermal battery to get recharged to absorb surrounding heat because of the extreme climatic conditions of UAE.

5. Conclusions

This research numerically investigated the most energy efficient cooling technique in order to reduce the energy consumption and carbon emission for office buildings by making sure that the thermal comfort and indoor air quality was appropriate for the office environment. The findings and conclusion of the study have been highlighted as follows. Energy modelling of the office with the FCU system proved that the energy consumption and carbon emission was 331.47 kWh/m2 and 172 KgCO2/m2 being fairly competitive with the typical industry benchmarks considering its age and the fan coil unit (FCU) system also played a crucial role in maintaining a higher level of energy efficiency. However, the CO2 concentration and thermal comfort were also in accordance with the ASHRAE standard. Adoption of variable speed drive (VSD) fans in FCU systems proved to be expedient in reducing the energy consumption and carbon emission by 8%. Its performance in terms of CO2 concentration and thermal comfort was acceptable to meet the occupant comfort satisfaction in office environment.
Implementation of VAV systems in the baseline office drastically increased the energy consumption and carbon emission by 42%. However, it had outperformed all the other HVAC systems in terms of thermal comfort satisfaction by having an average PMV of 0.66 and CO2 concentration of 559.5 PPM in accordance with the ASHRAE standards [27]. The VRF cooling technique was one of the most energy efficient systems as it had significantly dropped the energy consumption and carbon emission by 30%. Its overall performance with regards to CO2 concentration and thermal comfort was quite unsatisfactory due to the lack of ability to provide the sufficient ventilation within the office space. This means that having a supplementary ventilation system with the VRF system would be advisable, as it would help to maintain the required ventilation rates to achieve the thermal comfort standards of ASHRAE 55 [27].
On the other hand, the monodraught cool phase system was the second most energy efficient cooling technique as it had proved to reduce the energy consumption and carbon emission by 22%. Its average CO2 concentration was 586 PPM being acceptable with regards to ASHRAE and the PMV was 2.22 being extremely high for occupancy thermal comfort satisfaction because the thermal battery could absorb heat greater than its capacity and thus having an outdoor condenser unit would have been a good solution as it would provide chilled water for cooling coil to provide more effective cooling. Overall, the findings from this study have strongly verified that the cooling systems have a drastic effect on the energy consumption, thermal comfort and indoor air quality of the buildings. The limitation endured due to an excessively high CO2 concentration could be overcome by adding a supplementary ventilation with a VRF system (unitary cooling system) because it would help to provide fresh air supply.
In conclusion, finding the most appropriate cooling technique based upon energy efficiency and thermal comfort is challenging considering the local climatic conditions with excessive cooling requirements. The adoption of variable speed drive fans in the FCU system and VAV system can be regarded as one of the most suitable cooling techniques in consideration with the site microclimate. For future work, it would be beneficial to model the VRF system with an additional ventilation system to investigate its impact on thermal comfort and indoor air quality using carrier HAP software. Furthermore, using demand control ventilation in FCU systems will also be beneficial to reduce the energy consumption.

Author Contributions

Conceptualization, H.N.C.; Methodology, Software, Validation and Formal Analysis, Z.S.; Investigation, Z.S. and H.N.C.; Writing—review and editing, Z.S. and H.N.C.

Funding

This research received no external funding.

Acknowledgments

The authors would like to thank Heriot-Watt University for the use of computational facilities in conducting this research.

Conflicts of Interest

The authors declare no conflict of interest.

Nomenclature

VariableDescription
λ Conductivity of solid element (W/(m2·K))
ρDensity of solid element (kg/m3)
CSpecific heat capacity of the solid (J/kgK)
T n Temperature (°C) at node n
δ n Local node spacing (m)
T n j Temperature (°C) at node n and time-step j
T ˙ n j Time derivative of temperature (K/s) at node n and time-step j
mAir mass flow rate (kg/s)
C p Specific heat capacity of the air at constant pressure (J/kg/K)
T i Air supply temperature (°C)
T a Room mean air temperature (°C)
VRoom volume (m3)
aAir change rate (ach)
wWater vapour gain (kg/s)
giHumidity ratio of supply air (kg/kg)
gHumidity ratio of the room air (kg/kg)
k i Carbon dioxide concentration of the supply air (kg/kg)
kCarbon dioxide concentration of the room air (kg/kg)
AbbreviationDescription
IES-VEIntegrated Environmental Solution Virtual Environment
VAVVariable Air Volume System
AHUAir Handling Unit
VRFVariable Refrigerant Flow System
HVACHeating Ventilation and Air Conditioning
FCUFan Coil Unit
VSDVariable Speed Drive

References

  1. Kaul, N. The Bad Boys of Energy Consumption. Available online: https://gulfnews.com/business/property/the-bad-boys-of-energy-consumption-1.2120451 (accessed on 30 April 2018).
  2. Zakaria, S. Sustainability Talks as Expo 2020 Nears. 2017. Available online: https://www.khaleejtimes.com/nation/dubai/sustainability-talks-as-expo-2020-nears (accessed on 23 December 2017).
  3. Government of Dubai. Cooling in Dubai: A Market Share and Efficiency Study. 2017. Available online: https://www.rsbdubai.gov.ae/dubai-cooling-study/ (accessed on 28 December 2017).
  4. AlAwadhi, W.; AlNaqbi, A.; Manneh, A.; Kazim, A.; Abu-Hijleh, B. Energy Saving Potential Due to Refurbishment of Federal Public Housing in the UAE. Sci. Res. 2013, 5, 132–136. [Google Scholar] [CrossRef]
  5. Alkhateeb, E.; Abu Hijleh, B. Potential of Upgrading Federal Buildings in the United Arab Emirates to Reduce Energy Demand. Procedia Eng. 2017, 180, 61–70. [Google Scholar] [CrossRef]
  6. Hartungi, R.; Jiang, L. Energy efficiency and conservation in an office building: A case study. Int. J. Energy Sec. Manag. 2012, 6, 175–188. [Google Scholar] [CrossRef]
  7. Taleb, H.M. Enhancing the skin performance of the hopital building in the UAE. Hournal Build. Eng. 2016, 7, 300–311. [Google Scholar] [CrossRef]
  8. Pan, S.; Wang, X.; Wei, S.; Xu, C.; Zhang, X.; Xie, J.; Tindall, J.; de Wilde, P. Energy waste in buildings due to occupant behaviour. Energy Procedia 2017, 105, 2233–2238. [Google Scholar] [CrossRef]
  9. Stansbury, J.; Mittelsdorf, A.M. Economic and Environmental Analysis of Retrofitting a Large Office Building with Energy-Efficient Lighting Systems. Environ. Manag. 2001, 27, 909–918. [Google Scholar] [CrossRef]
  10. Hammad, F.; Abu-Hijleh, B. The Energy Saving Potential of Using dynamic external louvers in office building. Energy Build. 2010, 42, 1888–1895. [Google Scholar] [CrossRef]
  11. Khatami, N.; Hashemi, A. Improving thermal comfort and indoor air quality through minimal interventions in office buildings. Energy Procedia 2017, 111, 171–180. [Google Scholar] [CrossRef]
  12. Yu, X.; Yan, D.; Sun, K.; Hong, T.; Zhu, D. Comparative study of the cooling energy performance of variable refrigerant flow systems and variable air volume systems in office buildings. Appl. Energy 2016, 183, 725–736. [Google Scholar] [CrossRef] [Green Version]
  13. Aynur, T.; Hwang, Y.; Radermacher, R. Simulation of a VAV air conditioning system in an existing building. Energy Build. 2009, 41, 922–929. [Google Scholar] [CrossRef]
  14. IES-VE. IES-VE User Guide. 2011. Available online: http://www.iesve.com/downloads/help/Thermal/Reference/ApacheSimCalculationMethods.pdf (accessed on 16 October 2018).
  15. ECON19. Energy Consumption Guide 19. 2003. Available online: http://www.cibse.org/getmedia/7fb5616f-1ed7-4854-bf72-2dae1d8bde62/ECG19-Energy-Use-in-Offices-(formerly-ECON19 (accessed on 19 June 2018).
  16. Monodraught. Natural Cooling Case Studies. 2017. Available online: https://s3-eu-west-1.amazonaws.com/monodraught/downloads/literature/nat-cooling-case-studies-17.pdf?28/07/2018%2008:20:40 (accessed on 3 June 2018).
  17. Federal-Provincial Advisory Committee on Environmental and Occupational Health. Indoor Air Quality in Office Buildings: Technical Guidelines. 1997. Available online: http://publications.gc.ca/collections/Collection/H46-2-93-166Erev.pdf (accessed on 26 March 2018).
  18. Goetzler, W. Variable Refrigerant Flow Systems. ASHRAE J. 2007, 49, 24–31. [Google Scholar]
  19. CIBSE. CIBSE Weather Data Sets. 2017. Available online: https://www.cibse.org/weatherdata (accessed on 12 June 2018).
  20. EmiratesGBC. Technical Guidelines for Retrofitting Existing Building; EmiratesGBC: Dubai, UAE, 2015. [Google Scholar]
  21. Ibrahim, H.A. Indoor Air Quality in UAE Office Buildings and Their Effects on Occupants’ Health, Comfort, Productivity and Performance. 2015. Available online: https://bspace.buid.ac.ae/bitstream/1234/734/1/2013135130.pdf (accessed on 12 June 2018).
  22. Gilani, S.; Pao, W.; Khan, M. Thermal comfort analysis of PMV model Prediction in Air conditioned and Naturally Ventilated Buildings. Energy Procedia 2015, 75, 1373–1379. [Google Scholar] [CrossRef]
  23. ESKOM. Variable Speed Drives: Reducing the Energy Costs of Commercial HVAC Systems. 2015. Available online: http://www.eskom.co.za/sites/idm/EnergyAdvisory/Documents/ASVSDcommercialHVACsystemsfactsheet.pdf (accessed on 14 March 2018).
  24. Putz, C. Variable Speed Drives on Fan Coils Yield Savings. 2005. Available online: http://dms.hvacpartners.com/docs/1001/Public/01/AFE_FAC_ENGR_JAN_FEB_2006.pdf (accessed on 15 May 2018).
  25. Kim, D.; Cox, S.; Cho, H.; Im, P. Evaluation of energy savings potential of variable refrigerant flow (VRF) from variable air volume (VAV) in the U.S. climate. Energy Rep. 2017, 3, 85–93. [Google Scholar] [CrossRef]
  26. Bhatia, A. HVAC Variable Refrigerant Flow. 2013. Available online: http://www.seedengr.com/Variable%20Refrigerant%20Flow%20Systems.pdf (accessed on 1 March 2018).
  27. ASHRAE. Standard 55—Thermal Environmental Conditions for Human Occupancy. 2013. Available online: https://www.ashrae.org/technical-resources/bookstore/standard-55-thermal-environmental-conditions-for-human-occupancy (accessed on 12 May 2018).
Figure 1. Office floor plan (m).
Fluids 03 00077 g001
Figure 2. Annual energy intensity unit comparison.
Fluids 03 00077 g002
Figure 3. Trend in monthly energy consumption for different cooling systems.
Fluids 03 00077 g003
Figure 4. Annual space cooling energy for different cooling systems.
Fluids 03 00077 g004
Figure 5. Annual energy consumption for the compared cooling systems.
Fluids 03 00077 g005
Figure 6. Trend in CO2 Concentration for different cooling systems on 17th July (reference day).
Fluids 03 00077 g006
Figure 7. Trend in annual PMV for different cooling systems.
Fluids 03 00077 g007
Figure 8. Trend in PMV for different cooling systems on 17th July.
Fluids 03 00077 g008
Table 1. Indoor design criteria.
ZonesIndoor Summer TemperatureIndoor Winter TemperatureIlluminance LevelOccupantsInfiltration
Name°C°CLuxPeopleACH
Circulation242450050.167
Conference Rooms2424500180.167
Offices2424500560.167
Pantry242450000.167
Server Room181850000.167
Main Entrance Lift Lobby202050000.167
Adjacent Floors242450000.167
Table 2. Occupancy profiles for main spaces.
Occupancy ProfilesCorridorsConference RoomsOffices
Timing%%%
00:00–07:30000
07:30–08:005010100
08:00–09:005025100
09:00–12:305050100
12:30–14:001001050
14:00–18:005050100
18:00–20:005020100
20:00–22:000010
Table 3. Equipment operational profiles.
Equipment Operational ProfilesComputers + PhotocopierMicrowaveOpen Pantry Equipment (Coffee Machine + Water Filter)RefrigeratorConference Room Equipment
Timing%%%%%
00:00–07:3001501000
07:30–08:00100152010010
08:00–09:00100152510025
09:00–12:30100152510050
12:30–14:00501006010010
14:00–18:00100152510050
18:00–20:00100152510020
20:00–22:0010001000
Table 4. Lighting operational profiles.
Lighting Operational ProfilesOfficePantryCirculationServer Room
Timing%%%%
00:00–07:300000
07:30–08:0010025500
08:00–09:001005010050
09:00–12:30100501000
12:30–14:00501001000
14:00–18:001005010050
18:00–20:00100251000
20:00–22:00100100
Table 5. Equipment’s internal heat gains (W).
EquipmentHeat Gains (W)Number of Equipment’s
Computer5058
People14080
Photocopier5403
Microwave11411
Dishwasher2641
Refrigerator3101
Coffee Machine3522
Water Filter3522
Table 6. Office system internal heat gains (W/m2).
SystemsHeat Gains (W/m2)
Lighting12
Computer Rack200
Conference Equipment5
Table 7. Cooling systems modelled.
SchematicDescription
Fluids 03 00077 i001Fan Coil Unit with Variable Speed Drive Fan: The air side consisted of the cooling coil, heating coil, supply fan and extract fan. The fan coil cooler controller temperature was set to 24 °C. Similar air flow rates had been inputted in the simulation. The water side had district cooling performance curve. Apache Heating, Ventilation and Air-Conditioning (HVAC) did not allow the user to manually modify the imported HVAC systems components and henceforth they could not be removed, and the only option was to switch off the heating coil.
Fluids 03 00077 i002Variable Air Volume: This system had been modelled in Apache HVAC by importing a prototype Variable Air Volume (VAV) system from the library. The air side network consisted of the cooling coil, supply and extract fan, reheating coil in VAV box. Different spaces had been zoned separately to help maintain the spatial function using multiplexing. For the waterside the system had been connected from district cooling to supply chilled water.
Fluids 03 00077 i003Variable Refrigerant Flow: This system had been modelled in the Apache HVAC by importing a packaged terminal air-conditioning system (PTAC) from the library. Different spaces had been specified using multiplexing. Part-load-chiller-curve in chiller component was chosen to replicate the direct expansion cooling model that only consists of compressor, condenser and evaporator. The air side network comprised of PTAC fan, damper, cooling coil, heating coil, time switch, air flow rate controller. Other parameters such as chiller water pumps, condenser water pump and cooling tower had been set to zero. Then, this system was finally linked in Apache HVAC to simulate the results.
Fluids 03 00077 i004Monodraught Cool-Phase: Monodraught Cool-Phase was modelled using a navigator in IES-VE. Specific requirements for assigning zones, setting operation templates were further set in navigator. The cool-phase system was assigned to a zone followed by setting the operational parameters and profiles. Then this system had to be further applied to Apache HVAC for saving the set up. Room and system load calculations had been performed to size the system and finally the system was linked in Apache Simulation to simulate the results.
Fluids 03 00077 i005District Cooling: District Cooling had been integrated to replicate the actual scenario with the chilled water served from a district cooling plant located 4 KM away. Thus, a virtual district cooling had been added in the Apache HVAC water side by adding and modifying the default electric water-cooled chiller with part load curve in chiller set and setting zero watts for primary pump power, condenser pump and cooling tower fan on the cooling side.
Table 8. Design variables for Baseline Fan Coil Unit (FCU).
Base Model FCUOpen OfficesConference RoomServer RoomCorridors
Central Fan Airflow (L/s)800
Local Fan Airflow (L/s)300
Fan Energy SourceOffice Meter
Cooling Capacity (kW)30.97630.9763.882.99
ControlsTime Switch
Table 9. Design variables for FCU with Variable Speed Drive (VSD).
VSD FCUOpen OfficesConference RoomServer RoomCorridors
Central Fan Airflow (L/s)800
Local Fan Airflow (L/s)300
Fan Energy SourceOffice Meter
Fan CharacteristicVSD
Cooling Capacity (kW)30.97630.9763.882.99
ControlsTime Switch
Table 10. Design variables for the Variable Air Volume (VAV) system.
VAV SystemOpen OfficesConference RoomsConference Room + Server RoomCorridors
Central Fan Airflow (L/s) Air Handling Unit4719.47
Fan Energy SourceOffice Meter
Cooling Capacity (kW)100
ControlsTime Switch
Table 11. Design variables for the Variable Refrigerant Flow (VRF) system.
VRF SystemOpen OfficesConference RoomServer RoomCorridors
Packaged Terminal Fan Airflow (L/s)471.95
Fan Energy SourceOffice Meter
Cooling Capacity (kW)30303014
ControlsTime Switch, Independent controller with sensor
Table 12. Design variables for the Monodraught Cool Phase system.
Monodraught Cool Phase SystemOpen OfficesConference RoomServer RoomCorridors
Cool-Phase Fan Airflow (L/s)294
Fan Energy SourceOffice Meter
Fan CharacteristicVariable Volume
Cooling Capacity (kW)4.1
ControlsTime Switch, controller with CO2 Sensors, differential controllers
Table 13. Thermal comfort modelling input variables.
ActivityVariable
Clothing Level (clo) 0.69
Activity Level (W)90
Nominal Air Speed (m/s)0.15
Table 14. Energy and carbon variation due to implementation of different cooling systems.
Cooling System TypeAnnual Energy (MWh)Energy (kWh/m2)Annual Energy Reduction % Compared to BaselineAnnual Carbon (kgCO2)Carbon Emission (KgCO2/m2)Annual Carbon Reduction % Compared to Baseline
Fan Coil Unit (Baseline Office)227.78331.5-118,219172-
Fan Coil Unit with VSD209304.18%108,4941588%
VAV322.82469.8−42%167,547244−42%
VRF158.67230.930%82,35112030%
Monodraught Cool Phase178.01259.022%92,39113422%
Table 15. Average CO2 Concentration level for different cooling systems.
ModelBaseline FCUFan Coil Unit with VSDVAVVRFMonodraught Cool Phase
CO2 Concentration Levels (PPM) for Office Model624.2624.2559.53597.0586.0
Table 16. Average Predicted Mean Vote (PMV) for different cooling systems.
ModelBaseline FCUFan Coil Unit with VSDVAVVRFMonodraught Cool Phase
Average Predicted Mean Vote (PMV) for the Office Model0.530.620.651.062.22

