Article

Investigating the Impact of Reservoir Properties and Injection Parameters on Carbon Dioxide Dissolution in Saline Aquifers

by
Mohsen Abbaszadeh
* and
Seyed M. Shariatipour
Fluid and Complex Systems Research Center, Coventry University, Priory Street, Coventry CV1 5FB, UK
*
Author to whom correspondence should be addressed.
Fluids 2018, 3(4), 76; https://doi.org/10.3390/fluids3040076
Submission received: 3 August 2018 / Revised: 18 September 2018 / Accepted: 16 October 2018 / Published: 20 October 2018
(This article belongs to the Special Issue Fundamentals of CO2 Storage in Geological Formations)

Abstract

:
CO2 injection into geological formations is considered one way of mitigating the increasing levels of carbon dioxide concentrations in the atmosphere and its effect on and global warming. In regard to sequestering carbon underground, different countries have conducted projects at commercial scale or pilot scale and some have plans to develop potential storage geological formations for carbon dioxide storage. In this study, pure CO2 injection is examined on a model with the properties of bunter sandstone and then sensitivity analyses were conducted for some of the fluid, rock and injection parameters. The results of this study show that the extent to which CO2 has been convected in the porous media in the reservoir plays a vital role in improving the CO2 dissolution in brine and safety of its long term storage. We conclude that heterogeneous permeability plays a crucial role on the saturation distribution and can increase or decrease the amount of dissolved CO2 in water around ± 7% after the injection stops and up to 13% after 120 years. Furthermore, the value of absolute permeability controls the effect of the Kv/Kh ratio on the CO2 dissolution in brine. In other words, as the value of vertical and horizontal permeability decreases (i.e., tight reservoirs) the impact of Kv/Kh ratio on the dissolved CO2 in brine becomes more prominent. Additionally, reservoir engineering parameters, such as well location, injection rate and scenarios, also have a high impact on the amount of dissolved CO2 and can change the dissolution up to 26%, 100% and 5.5%, respectively.

1. Introduction

The global temperature over the last century shows a slight increase and predictions indicate an increase of up to 1.1–6.6 °C by the end of this century [1]. Carbon capture and storage (CCS), that comprises of the separation of CO2 from the gaseous exhaust of power plants and other heavy industries and safe and secure long-term storage in geological formations is considered to be the most applicable method for mitigation of CO2 concentration in the atmosphere [1,2,3]. Investigations show that there is the potential for nearly 2000 Gt of CO2 storage capacity within the different underground formations around the world [1]. Different geological formations considered as a sink for CO2 storage include depleted oil and gas reservoirs, un-mineable coal beds and saline aquifers [4]. Among these sites, deep saline aquifers show the highest storage potential [5]. The best storage sites are those that trap the CO2 as an immobile phase under the ultra-low permeability confining caprock where it subject to further gradual physical and chemical trapping mechanisms [1].
The trapping mechanisms active during CO2 injection into saline aquifers can be described as:
(1)
Structural trapping, which is the primary trapping mechanism for CO2 storage, as a result of capillary pressure of the low permeability caprock [6,7].
(2)
Residual trapping, which takes place at residual gas saturation where the CO2 becomes immobile due to the capillary forces and interfacial tension effects [2,8].
(3)
Solubility trapping, where CO2 dissolves in the formation brine over time during and after injection. The dissolution of CO2 in water creates carbonic acid that decreases the pH of the environment [9] and;
(4)
Mineral trapping, where the dissolved CO2 in the form of carbonates and bicarbonates reacts with the minerals of the rock leading to a precipitate as secondary carbonates [10]. Mineral trapping is considered to be the safest way of CO2 storage as it converts to solid precipitation. However this process is very slow.
At the initial stages of injection, the hydrodynamic and structural trapping mechanisms are active [8]. However in the long-term, other trapping mechanisms, such as solubility, residual gas and mineral trapping, will arise.
Many studies have been conducted on CO2 trapping mechanisms in the aquifers. Nghiem et al. presented a simulation and optimization method for the trapping mechanisms during CO2 storage in saline aquifers [11]. They adjust the location and the rate of injection and they realized that the amount of dissolved CO2 and residually trapped CO2 increases if brine injector is located above the CO2 injector. Shariatipour et al. proposed an engineering solution for increasing the efficiency of CO2 dissolution in formation brine [12]. In their method, brine extracted from the top of the aquifer is mixed by a downhole mixing tool with CO2 which is injected through the tubing. Then, the dissolved CO2 in brine is injected into the same formation through another lateral at the bottom of the aquifer. The advantage of their concept is that the high pressure of formation water will increase the solubility of CO2 in water and there is no energy penalty in lifting the brine to the surface for the surface mixing processes. In another study, Hassanzadeh et al. presented a method for accelerating CO2 dissolution in saline aquifers by injecting brine on top of the CO2 injection well [13]. They showed that without brine injection less than 8% of the injected CO2 is dissolved in the brine however, with brine injection CO2 dissolution will increase up to 50% within 200 years. A new dissolution technique was developed by Zirrahi et al. using a downhole mixing device to enhance the mass transfer of CO2 in brine [14]. Their results show that the energy required for the field scale application of this technique is only a small portion of the energy required for the CO2 injection. A perspective on the progress of convective mixing is presented by Emami-Meybodi et al. [15]. It is considered when the free phase CO2 is in contact with brine the density of the adjacent brine slightly increases and causes a gravitational instability which significantly increases the dissolution of CO2 in the aquifer. All these studies show the importance of the dissolution trapping mechanisms and investigating the impact of different parameters on it. Ide et al. studied the effect of the gravity and viscous forces on residual trapping—also known as capillary trapping—of CO2 [16]. Their results show that in cases in which the gravitational forces are weaker in comparison with viscous forces, more CO2 is trapped. Research was conducted by Li et al. to study the effect of capillary pressure on migration behavior of CO2 plume [17]. Their results show that the capillary pressure has only a minor impact during the injection phase, but will increase during the post-injection processes.
The Bunter sandstone is a reservoir rock which is more than 200 m thick and has a considerable storage potential for CO2 storage purposes [18,19,20]. The Bunter sandstone is comprised of several domes which are mostly saturated with brine while only a few formations are filled with natural gas [21,22]. Williams et al. created a precise geological model based on the core, seismic and well log data to estimate the storage capacity of domes in Bunter sandstone [20]. They calculated storage efficiencies between 4% (closed domes) to 33% (homogeneous model). Heinmann et al. studied the storage capacity based on a multi-well injection scenario and estimated that 3.8–7.8 Gt CO2 could be stored in the parts of the Bunter sandstone they studied [23]. It is well-known that the solubility of CO2 in water increases with pressure and decreases with an increase in temperature and salinity which also decreases the pH of the brine [24]. In contrast, in deeper aquifers both temperature and the salinity increase and thus the dissolution of CO2 in formation brine decreases. However, it should be noted that aquifers with greater depth are considered to be interesting sinks for CO2 storage because they are safer and the geothermal energy can be also used alongside the CCS [25,26,27]. One of the main objectives of this study is to determine the CO2 storage efficiency that is known to be dependent on different factors which can be categorized as: (1) Characteristics of the target aquifer for storage such as porosity, permeability, temperature, pressure, etc.; (2) Characteristics of CO2 storage operation such as injection rate, number of wells, etc.; (3) Constraints used in the injection process, such as maximum bottom hole pressure and the definitions used to calculate the volume of rock which is considered for CO2 storage [28]. Different researchers have proposed different methods for the estimating CO2 efficiency. A task force of the Carbon Sequestration Leadership Forum has presented methods for calculating storage efficiency in hydrocarbon reservoirs, coal beds and saline aquifers [8]. In another work, the US Department of Energy has developed a method for estimating CO2 storage capacity in the mentioned media [29]. Considering the limitations for pressure build up in the model, the storage efficiency is calculated by the formula used by Williams et al. [19] (Equation (1)). The volume of injected CO2 is calculated by the dynamic simulation.
E d = V o l u m e   o f   C O 2   I n j e c t e d   ( a t   r e s e r v o i r   c o n d i t i o n ) T o t a l   P o r e   V o l u m e
The impact of different parameters using the experimental design was examined by a numerical sensitivity analysis [30]. This study show that the horizontal permeability has the highest influence on CO2 solubility in aquifer and heterogeneous permeability is a major factor in both solubility and capillary trapping. Lengler et al investigated the impact of heterogeneity on CO2 distribution by simulating the Ketzin pilot [31]. They showed that with increasing the small-scale a greater volume of the reservoir is affected which results in a higher CO2 dissolution in brine. The effect of heterogeneity on the buoyancy driven flow of CO2 is investigated by [32] in a sand pack. Their results show that the heterogeneity decreases the uniformity of the plume movement and the presence of high permeability pathways decreases the trapping capability of the sand pack. Additionally, the consolidated sands trap more air compared to the unconsolidated ones. Issautier et al. conducted a sensitivity analysis on 3D model heterogeneity on fluvial reservoirs [33]. They realized that the increase in the order of heterogeneity increases the solubility and storage capacity.
Shariatipour et al. examined the accuracy of simulation of CO2 storage process with a black oil simulator in comparison to the compositional simulator by 2D, 3D and redial models [34]. They studied the impact of heterogeneity, temperature, salinity on the average pressure and saturation. They realized that the accuracy of the black oil model depends on the type of the grid which are the least accurate for radial ones.
In a recent work, Al-khdheeawi et al. investigated the impact of the injection well configuration and rock wettability on CO2 trapping capacity in heterogeneous reservoirs [35]. They concluded that the horizontal well enhances CO2 residual trapping subsequently reduces the plume migration. Zakrisson et al. investigated the well interference when injecting fluids with more than one well [36]. In their works they examined the impact of number of wells, formation permeability and well spacing on well interference with a numerical simulation and analytical calculations. They realized that the single well analytical model underestimates the number of wells in comparison to the multiwell analytical and numerical models. The impact of well locations on the pressure management of the reservoir and the brine extraction was investigated by [37]. Their results show that the heterogeneity and slope has a significant impact on extraction well location.
Although some former works have studied the impact of heterogeneous permeability on CO2 storage, our study extend our understanding and knowledge of the effect of heterogeneity of the storage formation on CO2 storage. In this study, we systematically investigate the impact of permeability distribution on CO2 dissolution in saline aquifers. The impact of other factors such as well locations, number of grid block connections to the well and local grid refinement in horizontal wells were also studied on CO2 solubility in brine.

2. Model Description

The three dimensional reservoir simulation model for studying CO2 injection in a saline aquifer was created by the ECLIPSE 300 through the CO2STORE option (Figure 1). The dimensions of the model are 1600 m long, 800 m wide and 140 m thick and the main input data (Table 1) were adopted from [23]. The Kv/Kh is assumed to be 0.1 in the base case and since the horizontal permeability is 250 mD, the vertical permeability is 25 mD. Given the lack of relative permeability and capillary pressure data for Bunter sandstone, the data presented by Bennion and Bachu have been used in this study [38].
The injection pressure should not exceed the fracture pressure of the formation rock and the caprock because increasing the pressure more than limit that will create fractures in the rock that will act as pathways for CO2 leakage to the surface. In this regard, the method presented by Brook et al. was used to calculate the fracture pressure of the formation [39]: the maximum allowable reservoir pressure is 1.35 times hydrostatic pressure for a depth to 1000 m and this factor will increase to 2.4 for the depth from 1000 to 5000 m. We considered the bottom hole pressure constraint as 90% of the fracture pressure of the formation [20]. If the pressure rises beyond this limit the injection well will be shut-in. In all the simulations only one injection well has been presented. In the base case, pure CO2 is injected at a rate of 1 Mt per year through the tubing to the bottom of the formation for 20 years. Injection then stops and the simulation progresses continue for a further 100 years while the flow of fluids is the result of density differences alone. Table 2 shows the properties of CO2 and brine used in this simulation.
The perforated section of the well is 20 m high from the bottom of the formation. The static model was considered to be completely saturated with brine and no free gas exists at the beginning of the simulation. Through the use of the Diffusion option, the CO2 is allowed to dissolve in the formation brine during and after injection. The model presented by Spycher and Pruess was used to calculate the CO2 dissolution in brine [10]. They studied the behavior of a mixture of H2O-CO2 at the temperatures between 12–100 °C and pressures up to 600 bar. They used the modified Redlich-Kowang equation of state (Equation (2)) to investigate the real gas behavior.
P = ( R T V b ) ( a T 0.5 V ( V + b ) )
where, P is the pressure, T is the temperature, V is the volume of compressed gas and R is the gas constant. Intermolecular interaction and repulsion are shown by a and b. In their method the fugacity coefficient is calculated by:
l n ( Φ k ) = l n ( V V b m i x ) + ( b k V b m i x ) ( 2 i = 1 n y i a k R T 1.5 b m i x ) l n ( V + b m i x V )       + ( a m i n b k R T 1.5 b m i x 2 ) [ l n ( V + B V ) ( b m i x V + b m i x ) ] l n ( P V R T )
Then the CO2 mole fraction in water phase (xCO2) and the water mole fraction (yH2O) in CO2 rich phase are as follow:
x C O 2 = Φ ( 1 y H 2 O ) P t o t 55.508 a C O 2 K C O 2 0 e x p ( ( P P 0 ) V C O 2 ¯ R T )
y H 2 O = a H 2 O K H 2 O 0 Φ H 2 O P t o t e x p ( ( P P 0 ) V C O 2 ¯ R T )
where, K0 is the thermodynamic equilibrium constant for each component at temperature T. In this study, in order to define the effect of different parameters on the CO2 storage in the Bunter sandstone, some sensitivity analysis were conducted on the model. To obtain the impact of one parameter, the simulation is run by changing the value of that parameter while all other parameters are kept constant. Understanding the change of several parameters at the same time will be considered in future studies. It should be noted that here we investigate the impact of each parameter on the amount of dissolved CO2 in the brine.

3. Results and Discussion

Figure 2 shows an injection scenario and compares the results of it with the base case. In this scenario, the CO2 is injected to the system for five years and then the injection stops for next five years. This interval continues for other three times until we have a total of 20 years of injection. Following the final five-year shut-in the simulation runs a further 85 years. This scenario can be applicable to the condition where we do not have a continuous access to the CO2 source. On the other hand since the dissolution of CO2 in brine is a very slow process, the appropriate time is given to this process after each shut-in, while at the same time the pressure of the reservoir stays low resulting in the ability to inject higher amounts of CO2 over longer time intervals. It should be noted that all the other parameters in the simulations remain constant in both scenarios. Results show the amount of dissolved CO2 in brine in this case is 5.5% higher than in the base case at the end of the injection period, although it happens in 15 years later (Figure 2). After the injection stops at late post-injection times the amount of dissolved CO2 proceeds towards a same plateau for both cases. It can be concluded from these two scenarios that Case 1 shows a reasonable performance in a situation where we do not have a continuous access to CO2 source. The storage efficiencies are 2.6% for both injection scenarios based on the equation presented by William et al. [20].
In this stage we investigate the effect of vertical to horizontal permeability in our study. To investigate the effect of vertical to horizontal permeability, first, we changed the value of vertical permeability to create different ratios and the results we achieved are different from the former approach. As can be seen in Figure 3, the amount of dissolved CO2 in brine is the highest for the ratio of 0.1 before and after shut-in. However, the amount of dissolved CO2 in brine for 0.01 is lower than the ratio of 1 before the injection stops and then increases after shut-in. For Kv/Kh ratio of 0.01 CO2 cannot move upwards due to very low value of Kv thus the movement of CO2 in the reservoir is defected during the injection. However, for the Kv/Kh ratio of 1 CO2 can move easily through the reservoir. On the other hand, after the injection stops CO2 will go upwards and accumulates at the top of the reservoir thus it will be less in contact with fresh brine. However, for the Kv/Kh of 0.01 CO2 moves slowly through the reservoir and it still stays in contact with fresh brine thus the dissolution will be more. Since the results we achieved are not in agreement with the results by former researchers for pre-shut-in duration [29], the effect of vertical to horizontal permeability on the amount of dissolved CO2 with different absolute permeability values is investigated.
In another approach, we change the value of horizontal permeability to achieve different ratios of vertical to horizontal permeability. Results show the amount of dissolved CO2 in the brine has increased as the vertical to horizontal permeability has decreased (Figure 4). This is because of the easier distribution of CO2 in the reservoir through the increase in horizontal permeability. The simulations show that the storage efficiency is 2.6% for all cases. These results show that although that the storage efficiencies are the same, the higher the Kh is, the more the reservoir is suitable for storage purposes by an increase in dissolved CO2.
As presented in Figure 5, the curve for the amount of dissolved CO2 in brine for Kv/Kh ratio of 0.01 shows a decreasing trend from the high permeability pairs to low permeability pairs and at the lowest value of absolute permeabilities it shows the least amount of dissolved CO2 either before and after shut-in. This is because when the value of absolute permeabilities decreases the effect of Kv/Kh ratio of 0.01 becomes more acute, since the CO2 plume propagation in the vertical direction decreases abruptly and the movement and contact of CO2 with water intensively decreases. On the other hand, from the plots in Figure 5 it can be concluded that as the value of vertical and horizontal permeability decreases (for instance in tight reservoirs) the impact of the Kv/Kh ratio on the amount of dissolved CO2 increases, as shown by the increasing space between the curves in each plot. However, it should be noted that more CO2 is dissolved by the ratio of 0.1 in all cases.
To investigate the impact of permeability heterogeneity, a model with the same geometry was developed, with the permeability being changed while maintaining the same mean with the homogeneous model. It should be noted that the permeability has changed initially. Here two different simulations have been conducted. One of them was a homogeneous model and the other one was a heterogeneous model. As is exhibited in Figure 6, by imposing the heterogeneity the amount of dissolved CO2 decreased during the injection period compared with the homogeneous model and then increased after the injection stops. This is because during the injection period in the homogeneous model the CO2 plume proceeds more easily in the porous media and is in contact with more fresh brine, thus the dissolution rate is higher. After the injection stops, since the CO2 plume has a non-uniform distribution in heterogeneous model, the surface area of CO2 plume in contact with brine is higher than the homogeneous model and dissolution increases. In addition, in the heterogeneous model, due to the slower movement of CO2 plume, there is enough time for dissolution trapping. In the homogeneous model the CO2 model very soon accumulates in the top of the formation and its contact with the formation brine decreases. The storage efficiency is 2.6% for both homogeneous and heterogeneous systems.
At this stage the impact of different cases of heterogeneity is investigated. Thus, different series of permeability heterogeneity data was generated in order to determine what the effect of different heterogeneity data will be on the model. Thus, at this stage, 20 different permeability heterogeneity data were generated having the same mean permeability as the homogeneous permeability (250 mD horizontal permeability and 25 mD vertical permeability). Since the amount of data is huge we only present 10 of the data for CO2 dissolution in brine at the end of the injection and at the end of the simulation (after 120 years). As can be seen in Figure 7, the amount of dissolved CO2 in brine varies significantly based on the permeability heterogeneity data and does not obey a rational rule, being either greater or less than the homogeneous model. The only result which is in agreement with the results from the first sensitivity analysis conducted on heterogeneity is that the amount of dissolved CO2 in the homogeneous model is less than that of all the heterogeneous models in the long term. It should be noted that in all these cases the range that the horizontal permeabilities are generated is between 5 mD to 600 mD and the standard deviation is 200, while the range of vertical permeability is between 0.5 mD to 55 mD and the standard deviation is 20. All the percentages are in comparison to the homogeneous model.
The variation in the amount of dissolved CO2 in brine in the heterogeneous cases is due to the different saturation distribution of the gas phase in the porous medium which creates different contact areas between the brine and CO2. As presented in Figure 8, while the mean permeability remains the same in all cases, the saturation distribution varies considerably from case to case. Here only 6 cases are shown.
To investigate the effect of the range in which the permeability data are generated we first only changed the maximum of the ranges while all the other parameters are kept constant. In another sequence, we tested different minimum and maximum values for the range in which the permeability data is supposed to be generated. In all these cases no rational trend was observed and the dissolution data is seen to be different in each case. The data for each case is presented in Table 3 and Table 4, respectively.
In another approach, we change the value of the standard deviation while keeping the minimum and maximum of the range constant. In this approach we find that in Cases 20 and 21 when that the standard deviation is low the values are closer to the mean (which is 25 mD and 250 mD) but are still random values as in the first 10 cases. Thus, there is no rational trend in the amount of dissolved CO2 in brine. However, as the standard deviation increases (more than 30), the random numbers generated are getting closer to the value of minimums and maximums and the amount of dissolved CO2 in brine decreases. This observation is attributed to the phenomenon that the very small values of permeability does not enable the CO2 phase to distribute within the porous medium and is therefore not in contact with the brine. Thus, the dissolution of CO2 in brine decreases (Table 5).
It is worth mentioning that in considering the maximum and minimum value of the amount of dissolved CO2 in brine for 36 different permeability heterogeneity cases with the same mean the following observation identified. We observed that the maximum value of dissolved CO2 at the time of shut-in is 39.2% more than the minimum value and the maximum value 100 years after shut-in is 19.41% more than the minimum. This considerable difference in the solubility proves the importance of permeability heterogeneity in the amount of dissolved CO2 and the saturation distribution which must be created based on the precise and real data of the target formation for CO2 storage.
We further expanded our study to investigate the effect of different heterogeneity distribution in the reservoir by dividing the reservoir into two layers by imposing two different sets of permeability heterogeneity data created by a high and a low standard deviation. In our first case the permeability heterogeneity data that has been created by higher standard deviation was located in the upper layer. We conducted this simulation twice with two different sets of heterogeneity data (Plot A and B). The results show that in the both sets of permeability heterogeneity data when the layer with the higher standard deviation is located down the amount of dissolved CO2 in the water is higher (Figure 9). A slower upward movement of the CO2 plume is due to the reason explained in the section investigating the effect of standard deviation and appropriate time to stay in contact with brine is considered to be the reason for this observation.
In another attempt to cover the different aspects of permeability heterogeneity we changed the well location while the same permeability data is used in the model. In this regard, we considered four different well locations in the model. The results show that even by changing the well location in the same model the amount of dissolved CO2 is changed (Table 6).
Since in the base case the well is located in a corner of the model, the abrupt increase observed in the well locations other than the corners (Cases 2, 3 and 4) is due to the lack of boundary effects which decrease wellbore contact with fresh brine. However, the difference is still sensible between the symmetry cases.
Then, some sensitivity analysis is performed on the impact of number of grid block connections of the wellbore and the reservoir. The connections are considered from grid block No. 15 to 70 to the grid block No. 69 to 70 in the vertical direction. As Figure 10 demonstrates the connections with the highest numbers of grid blocks (i.e., 15–70 and 30–70) does not have the highest dissolution of CO2 in brine. Because with the high number of grid block connections CO2 will move upwards quickly and creates a plume under the top of the reservoir; therefore, does not have enough time to be in contact with fresh brine and the dissolution decreases. Thus, there is a maximum number of grid block connections that creates the highest dissolution value and the dissolution decreases for higher numbers of cells.
Now the impact of horizontal well is investigated in the CO2 dissolution in brine. In this regard, CO2 is injected through a horizontal well with the same number of connection cells to the reservoir. The saturation distribution is shown in Figure 11.
To compare the impact of vertical and horizontal wells, first CO2 is injected through a vertical well completed from grid No. 60 to grid No. 70 which creates a 20 m perforation section. On the other hand, since the grid size in the X direction is 20 m first CO2 is injected through only one grid in the X direction. Then by the use of Local Grid Refinement (LGR) option one grid in the X direction is refined to 10 grids which are 2 m each and all ten grids are allowed to flow. The simulation results presented in Figure 12 shows that injecting CO2 with the same rate by horizontal and vertical wells does not make a considerable difference in the amount of dissolved CO2 in brine in a homogeneous system.

4. Conclusions

In this study, we presented a model to predict the consequences of the injection of pure CO2 in the Bunter sandstone and conducted some sensitivity analysis on different reservoir and injection parameters. In general, the results from this study show that:
  • When CO2 is injected with a same rate in a reservoir with a lower pressure, the amount of CO2 dissolved and in general, the storage efficiency is higher. For instance, the storage efficiency for the lowest pressure is 3.4% and for the highest pressure is 2.3%. In other words, in developing a field for CO2 storage, injecting CO2 to the part of the field which has a lower pressure will increase the storage efficiency of the project in addition to operational advantages of working with lower pressures.
  • Based on the results of this simulation, when the thermodynamic conditions of the reservoir remain constant, the value of the storage efficiency remains constant. However, to what extent a reservoir is suitable for storage purposes and can efficiently store CO2 also depends on other factors such as heterogeneity, Kv/Kh ratio, injection rate, etc. Thus, this equation must be revised and the effect of these parameters must be included in storage efficiency calculation. This will be investigated in the future work.
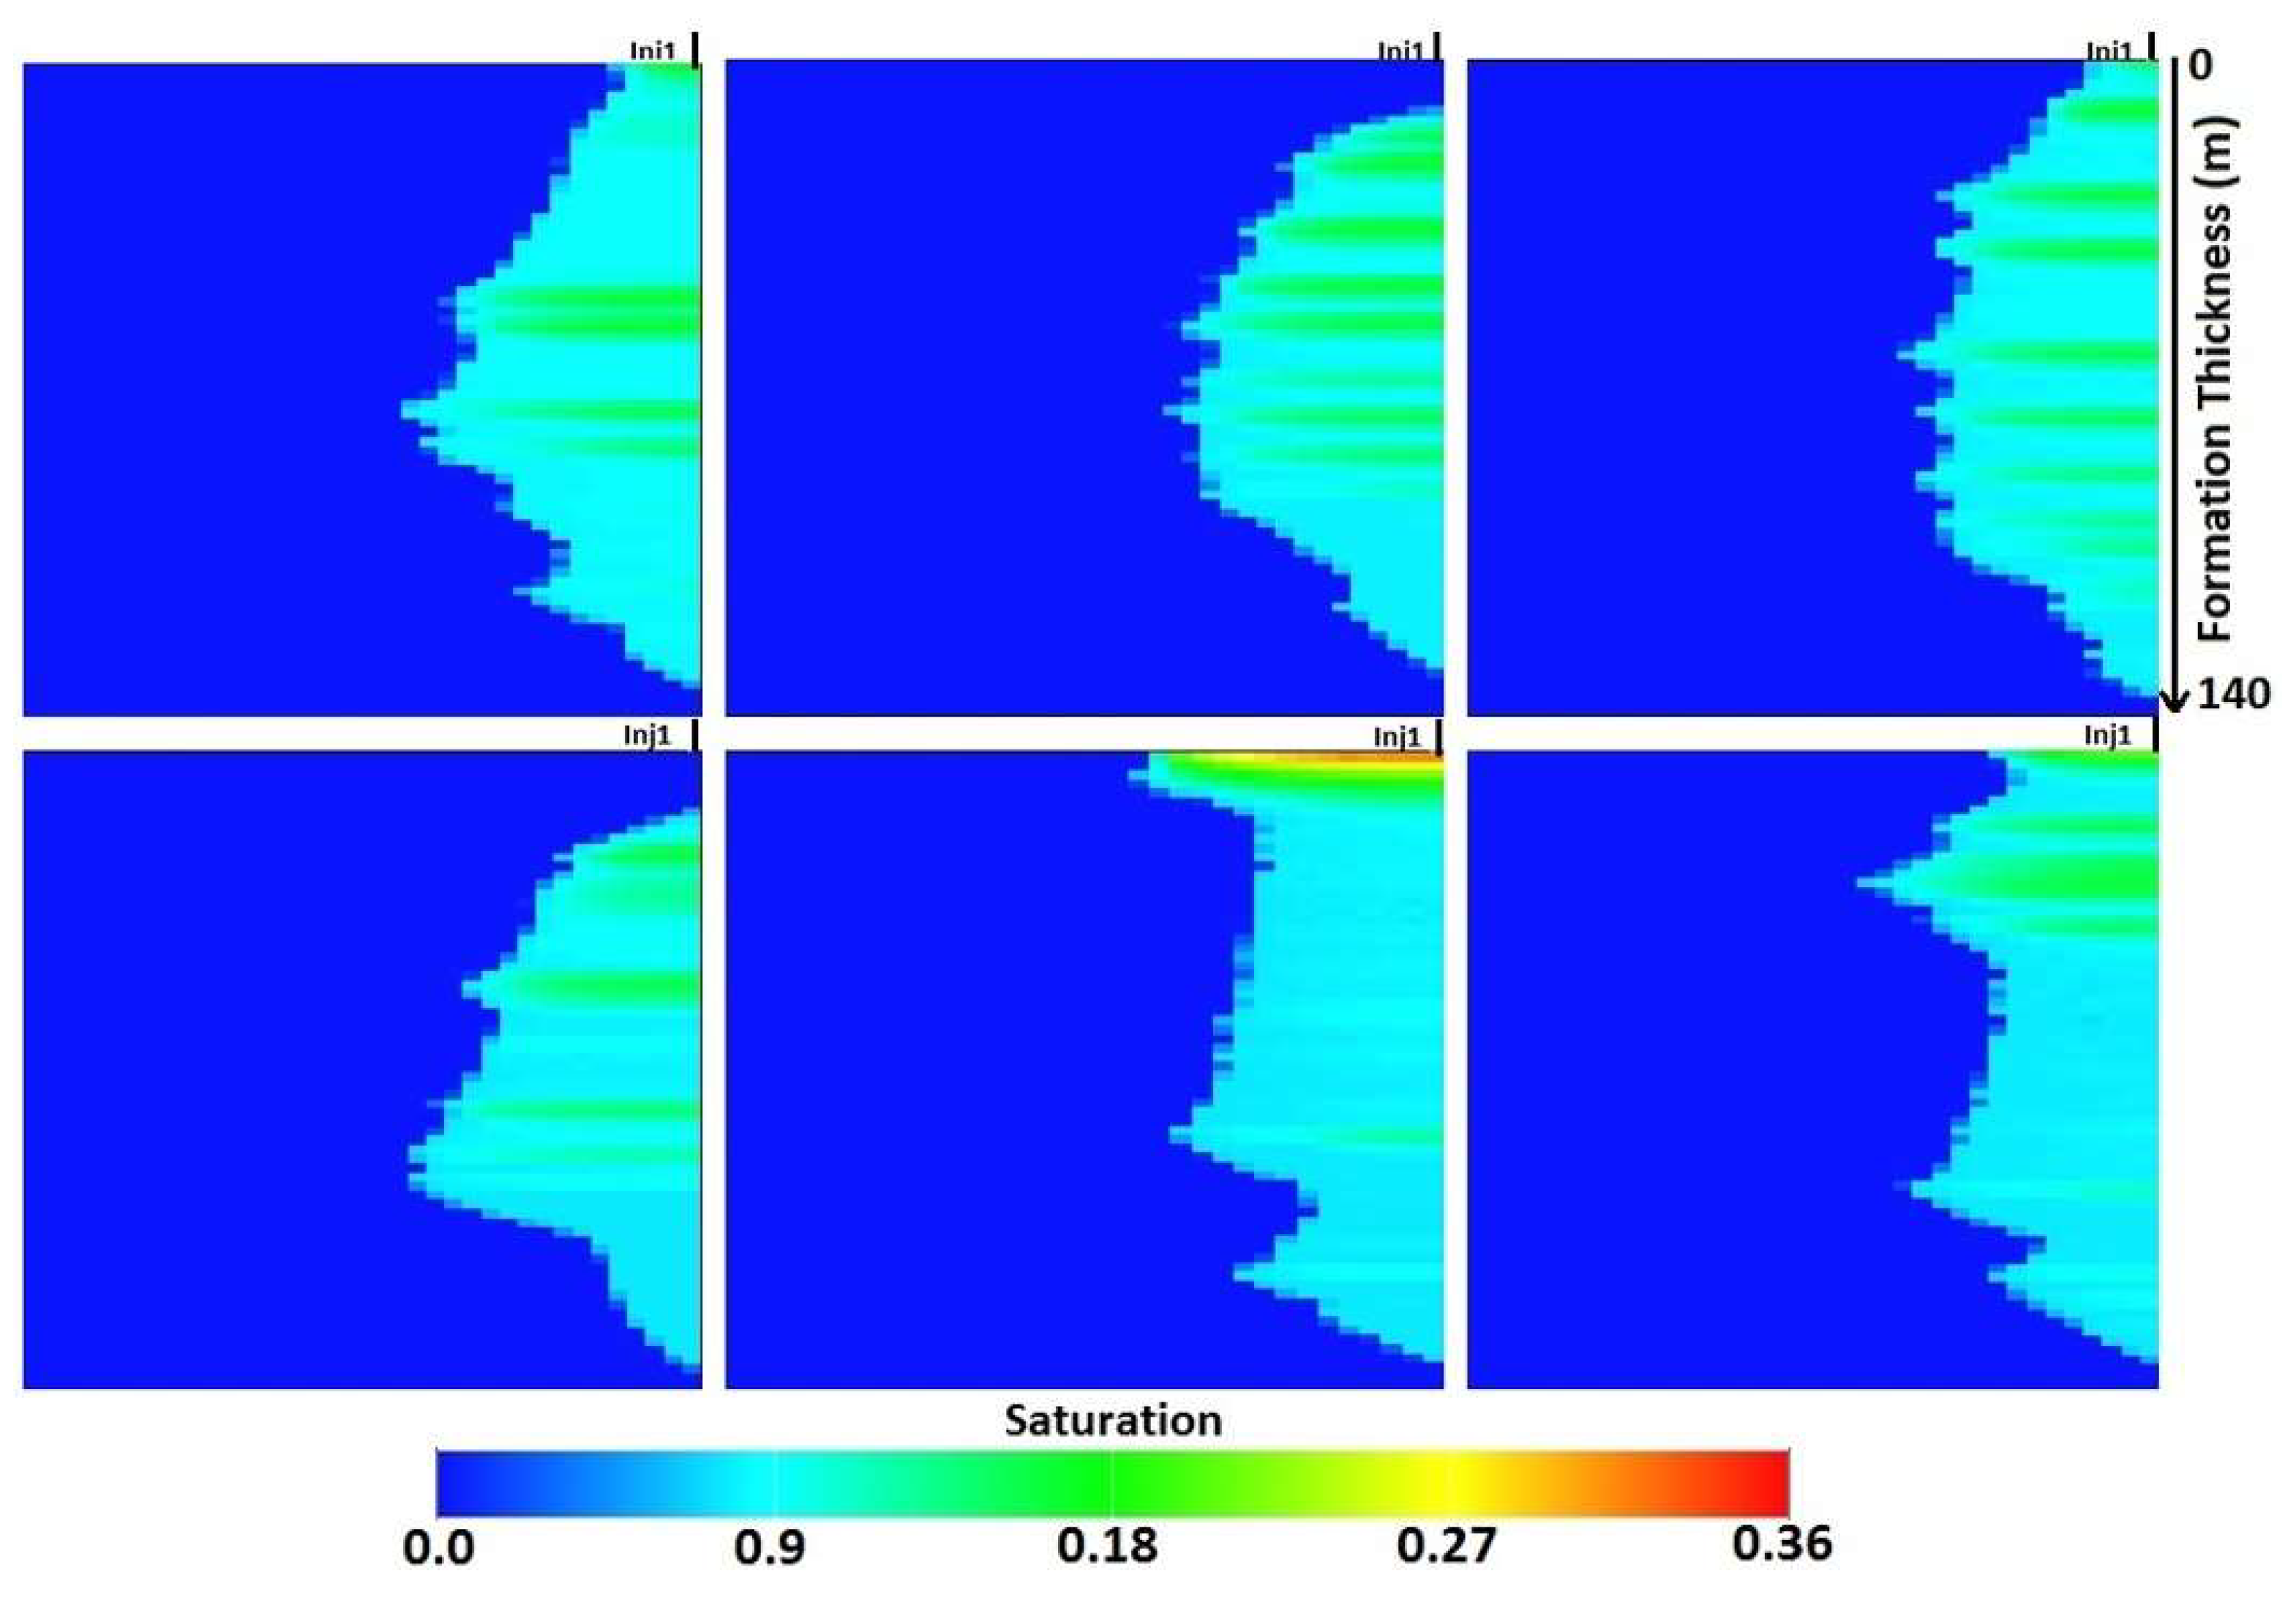
  • One of the most important concepts in evaluating the efficiency and safety of storage is how the CO2 plume is distributed within the reservoir. In other words, we should consider how much and how easily CO2 can be distributed within the reservoir when deciding on developing a field and the subsequent location of wells in the reservoir.
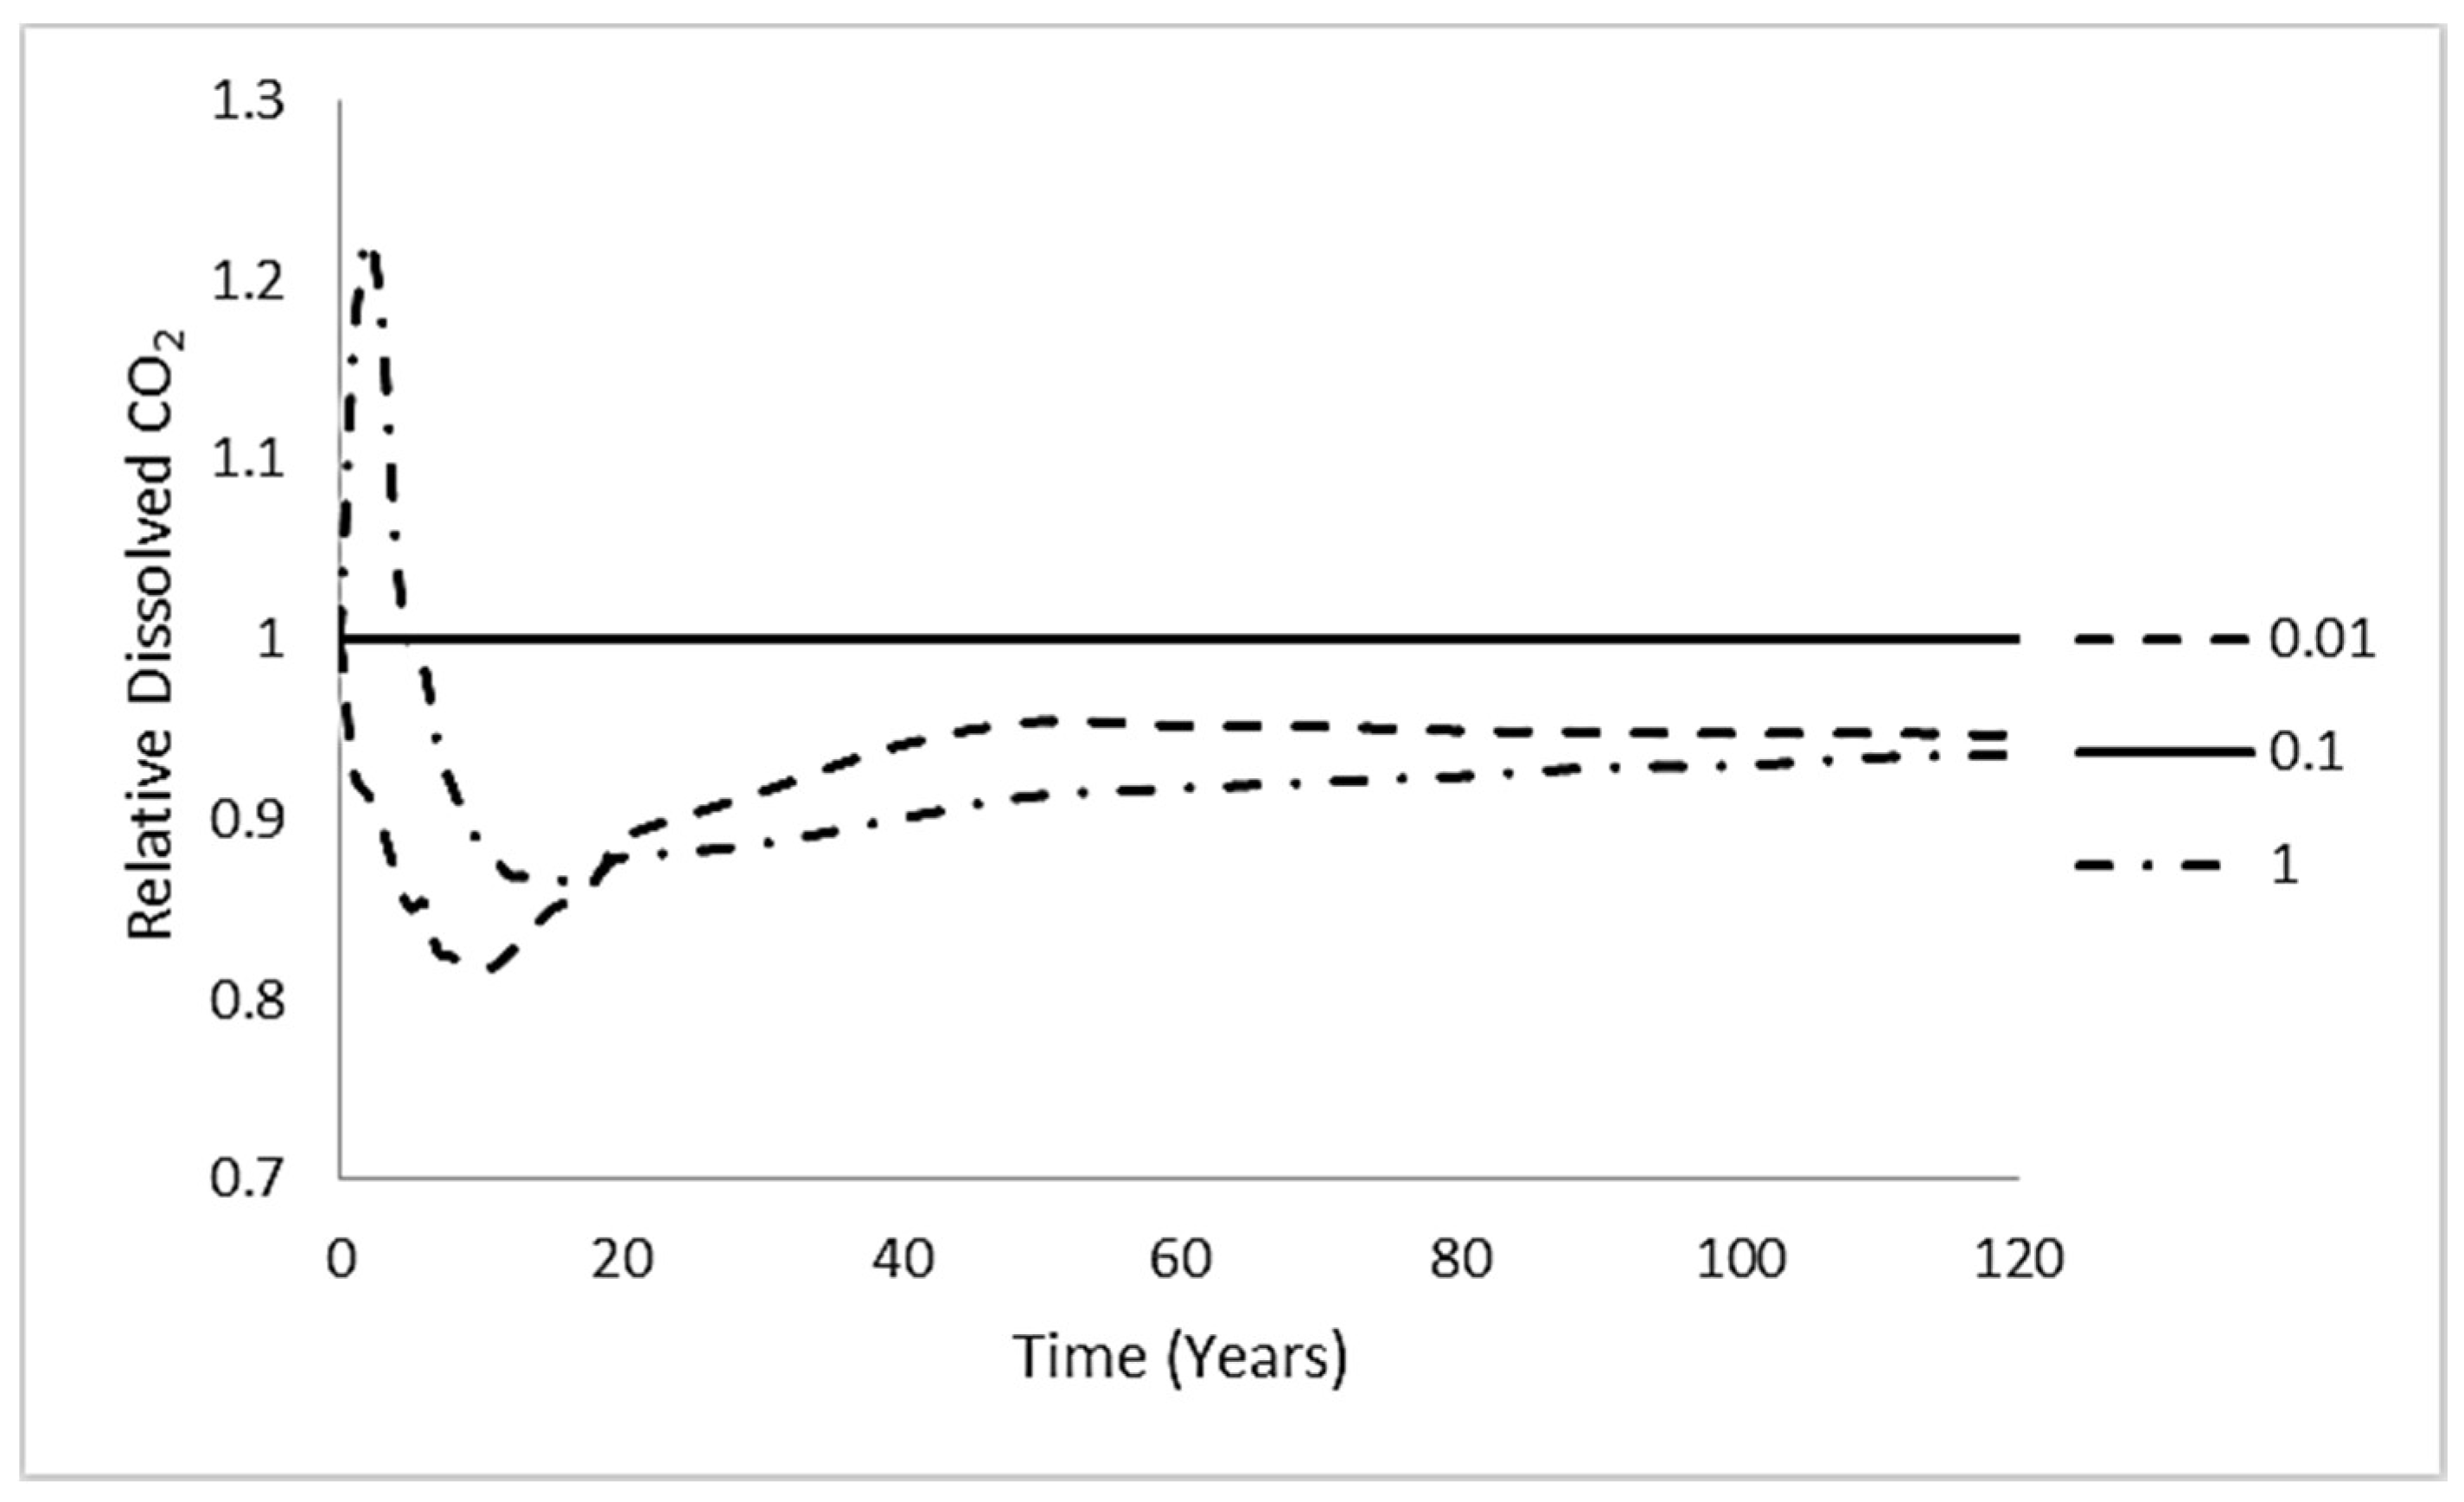
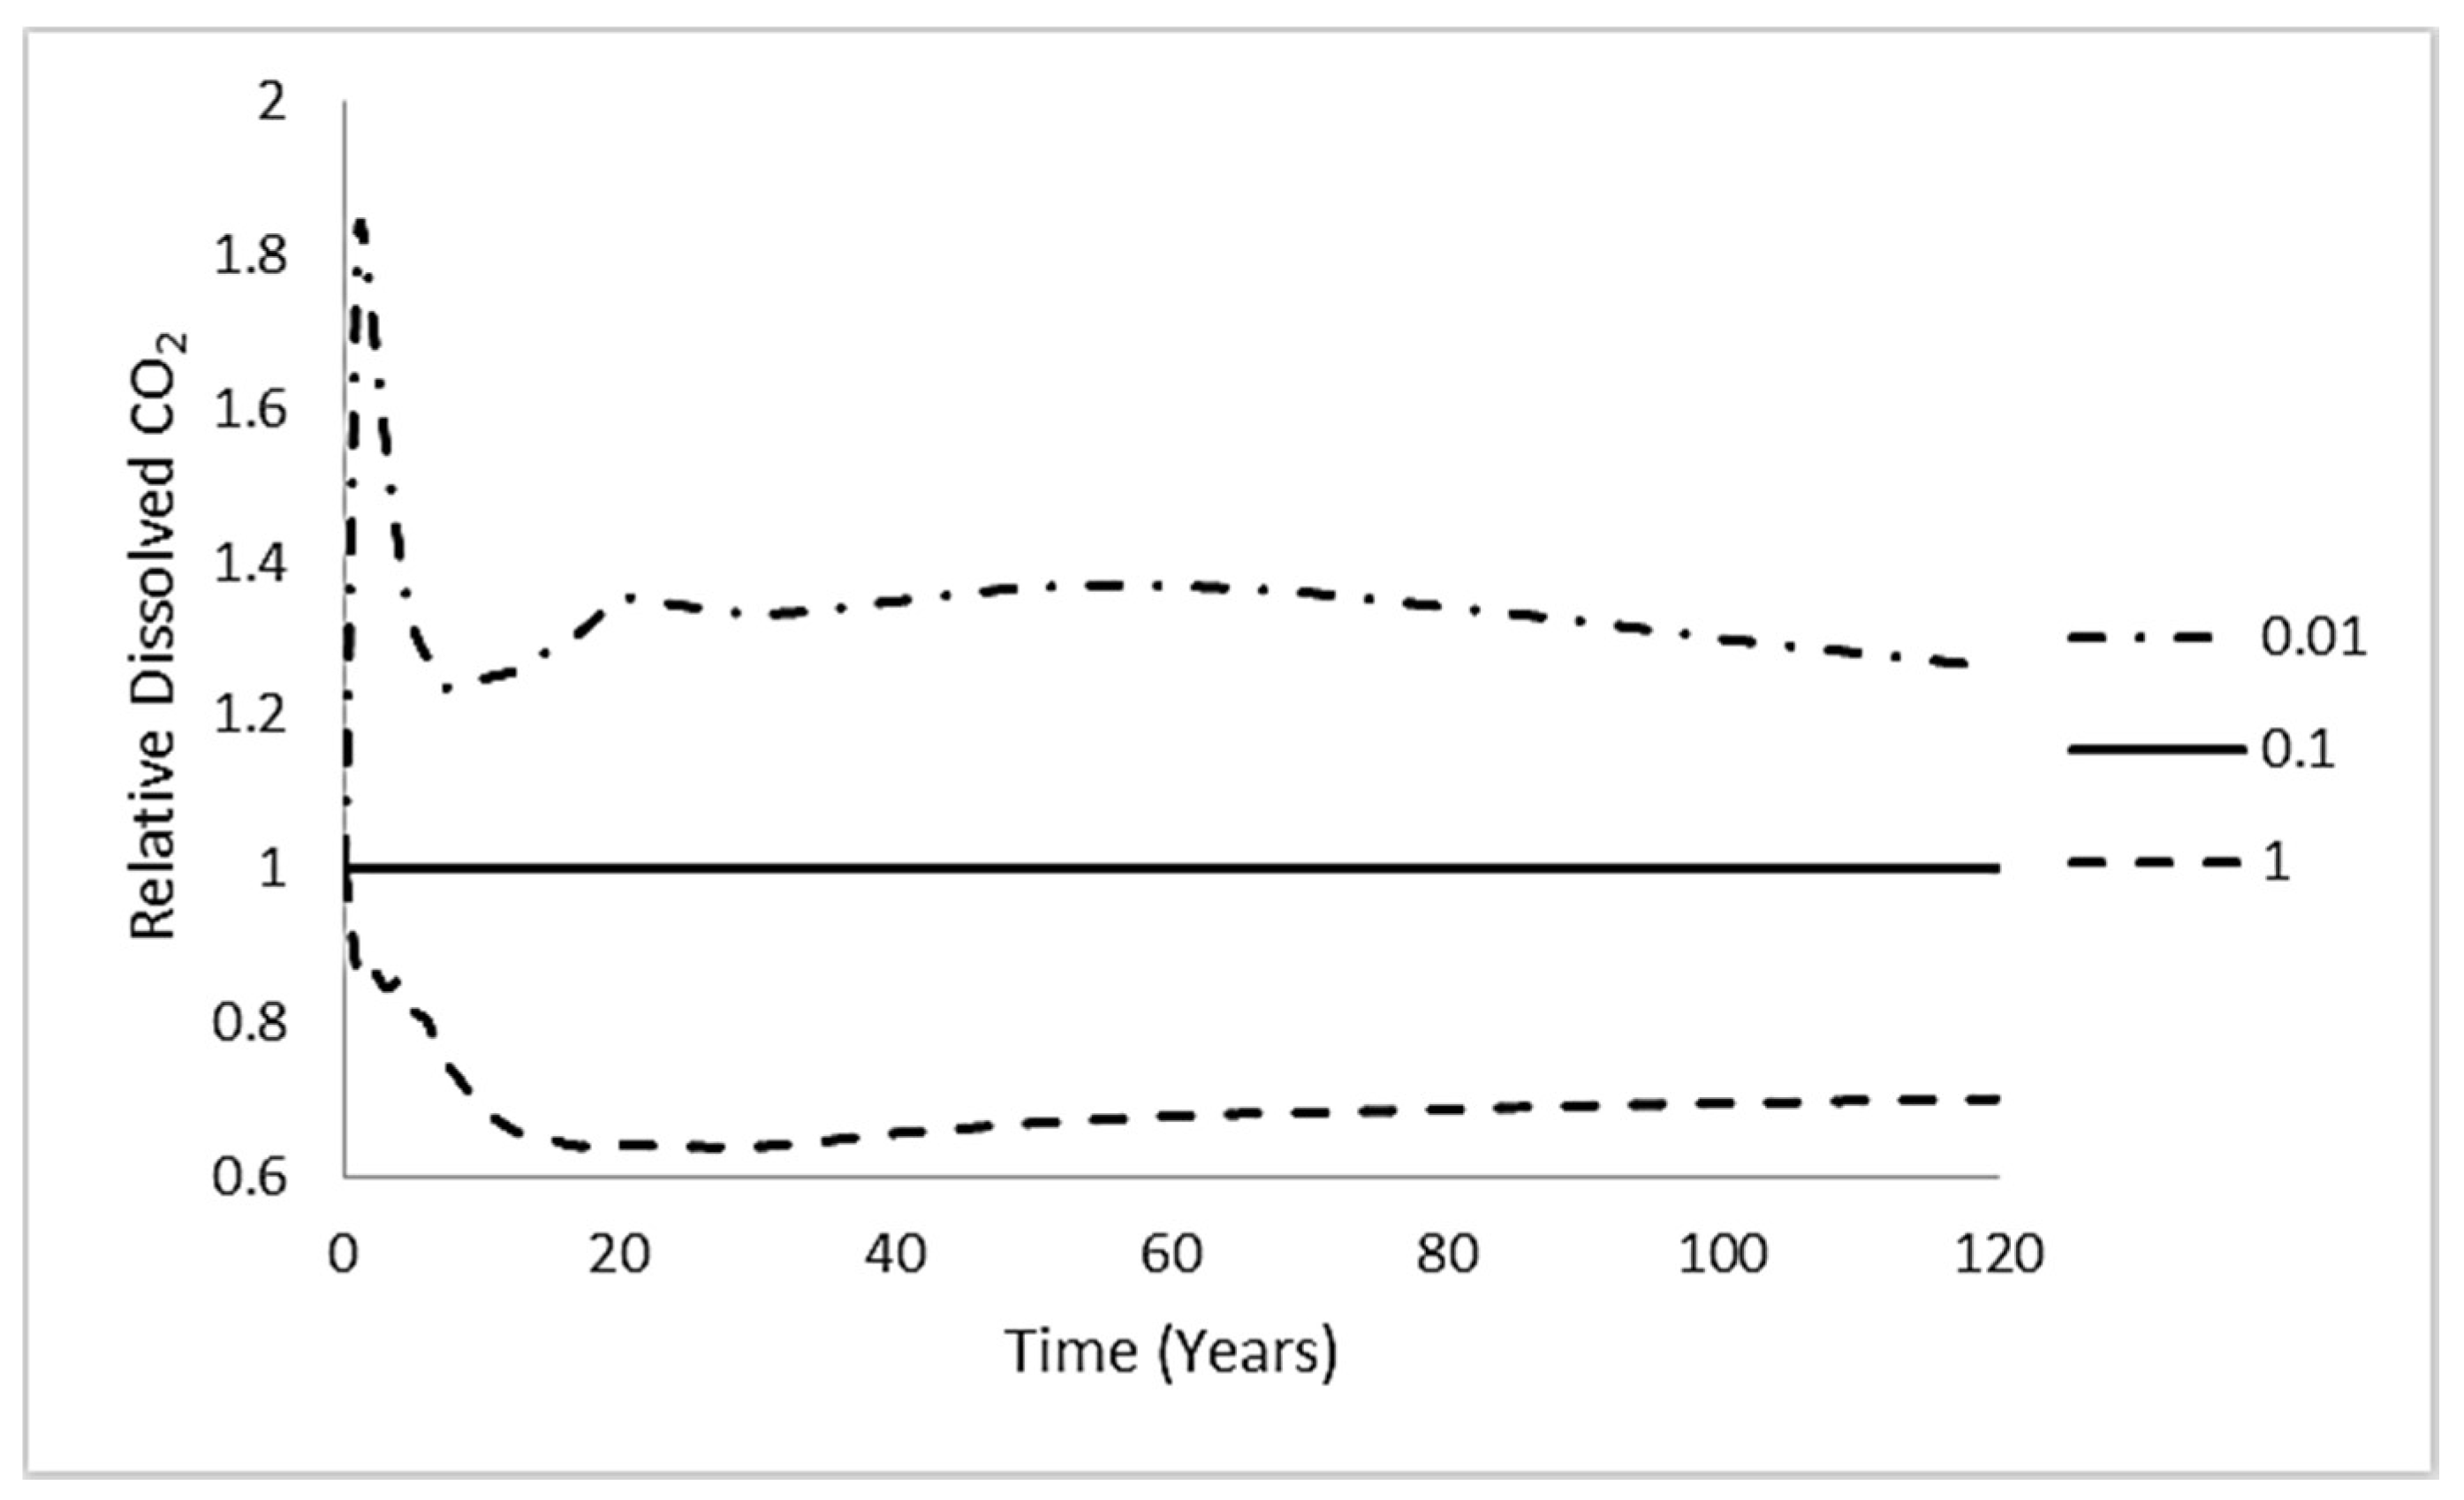
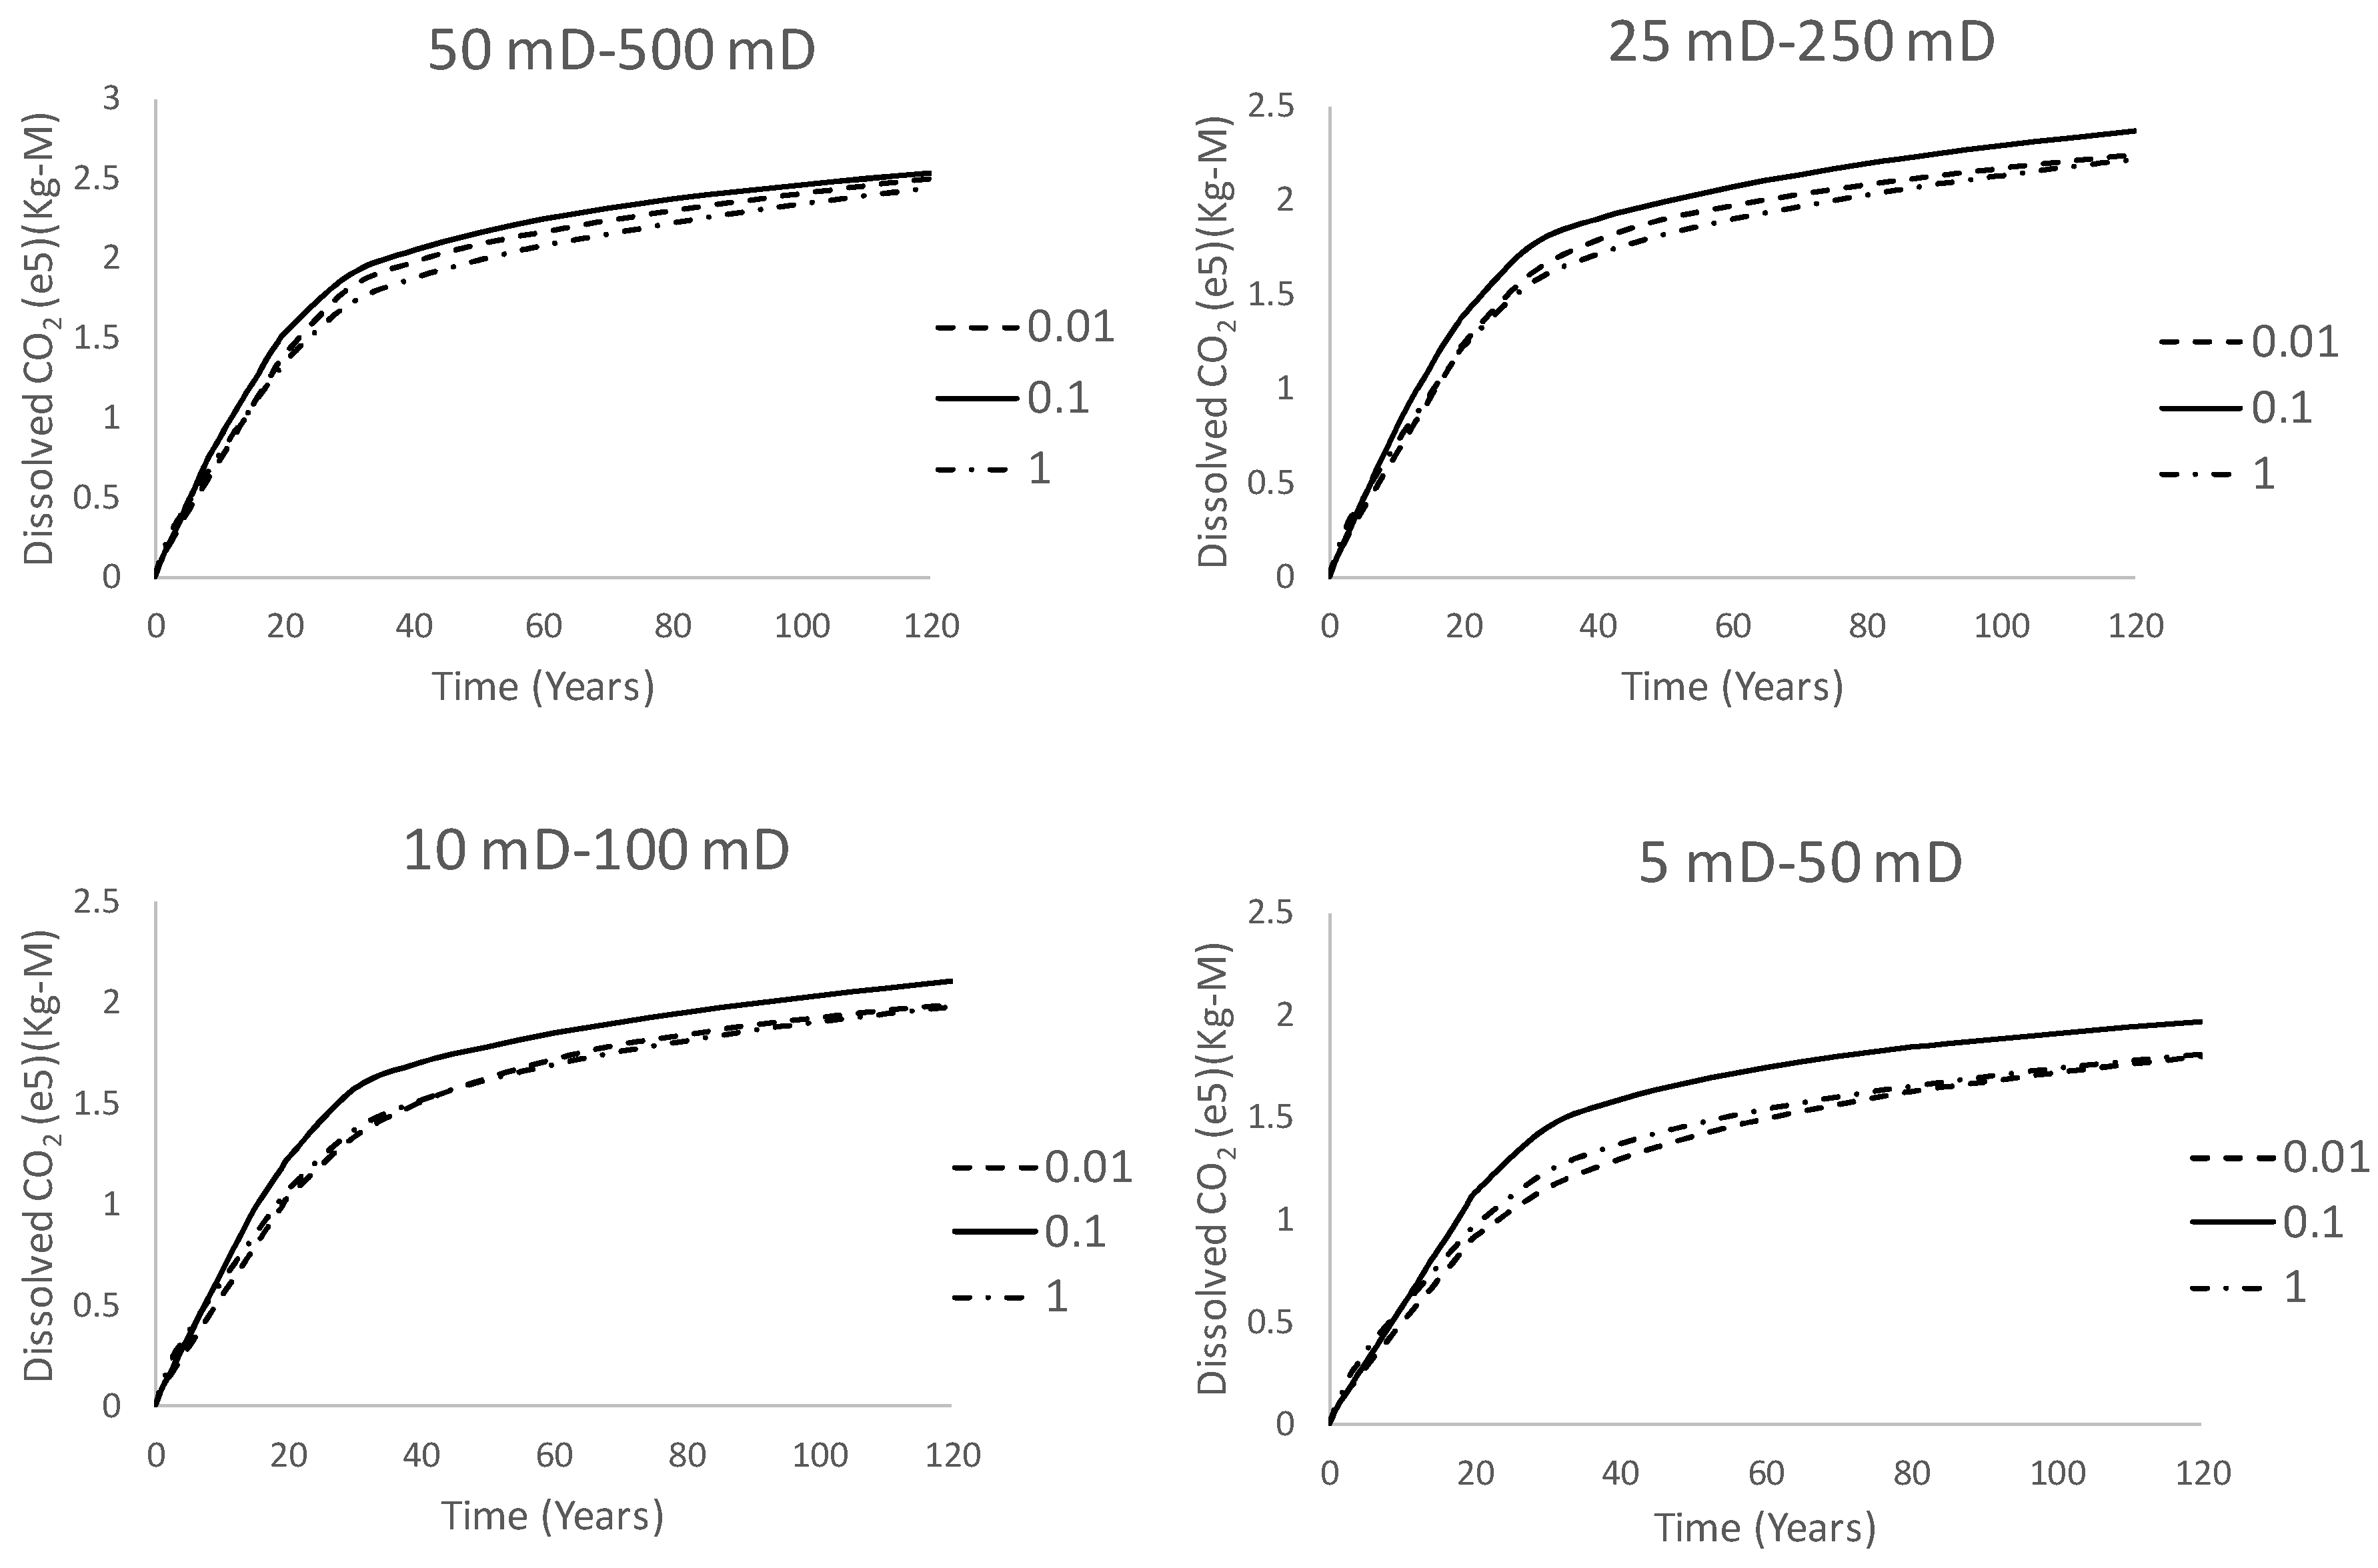
  • The results of our study show that the vertical to horizontal permeability ratio has a significant impact on CO2 storage efficiency and the value of absolute vertical and horizontal permeability controls the impact of Kv/Kh ratio on the dissolution of CO2 in brine. Furthermore, in low permeability reservoirs the effect of vertical to horizontal permeability on the dissolution of CO2 in water is more sensible than in the high permeability reservoirs.
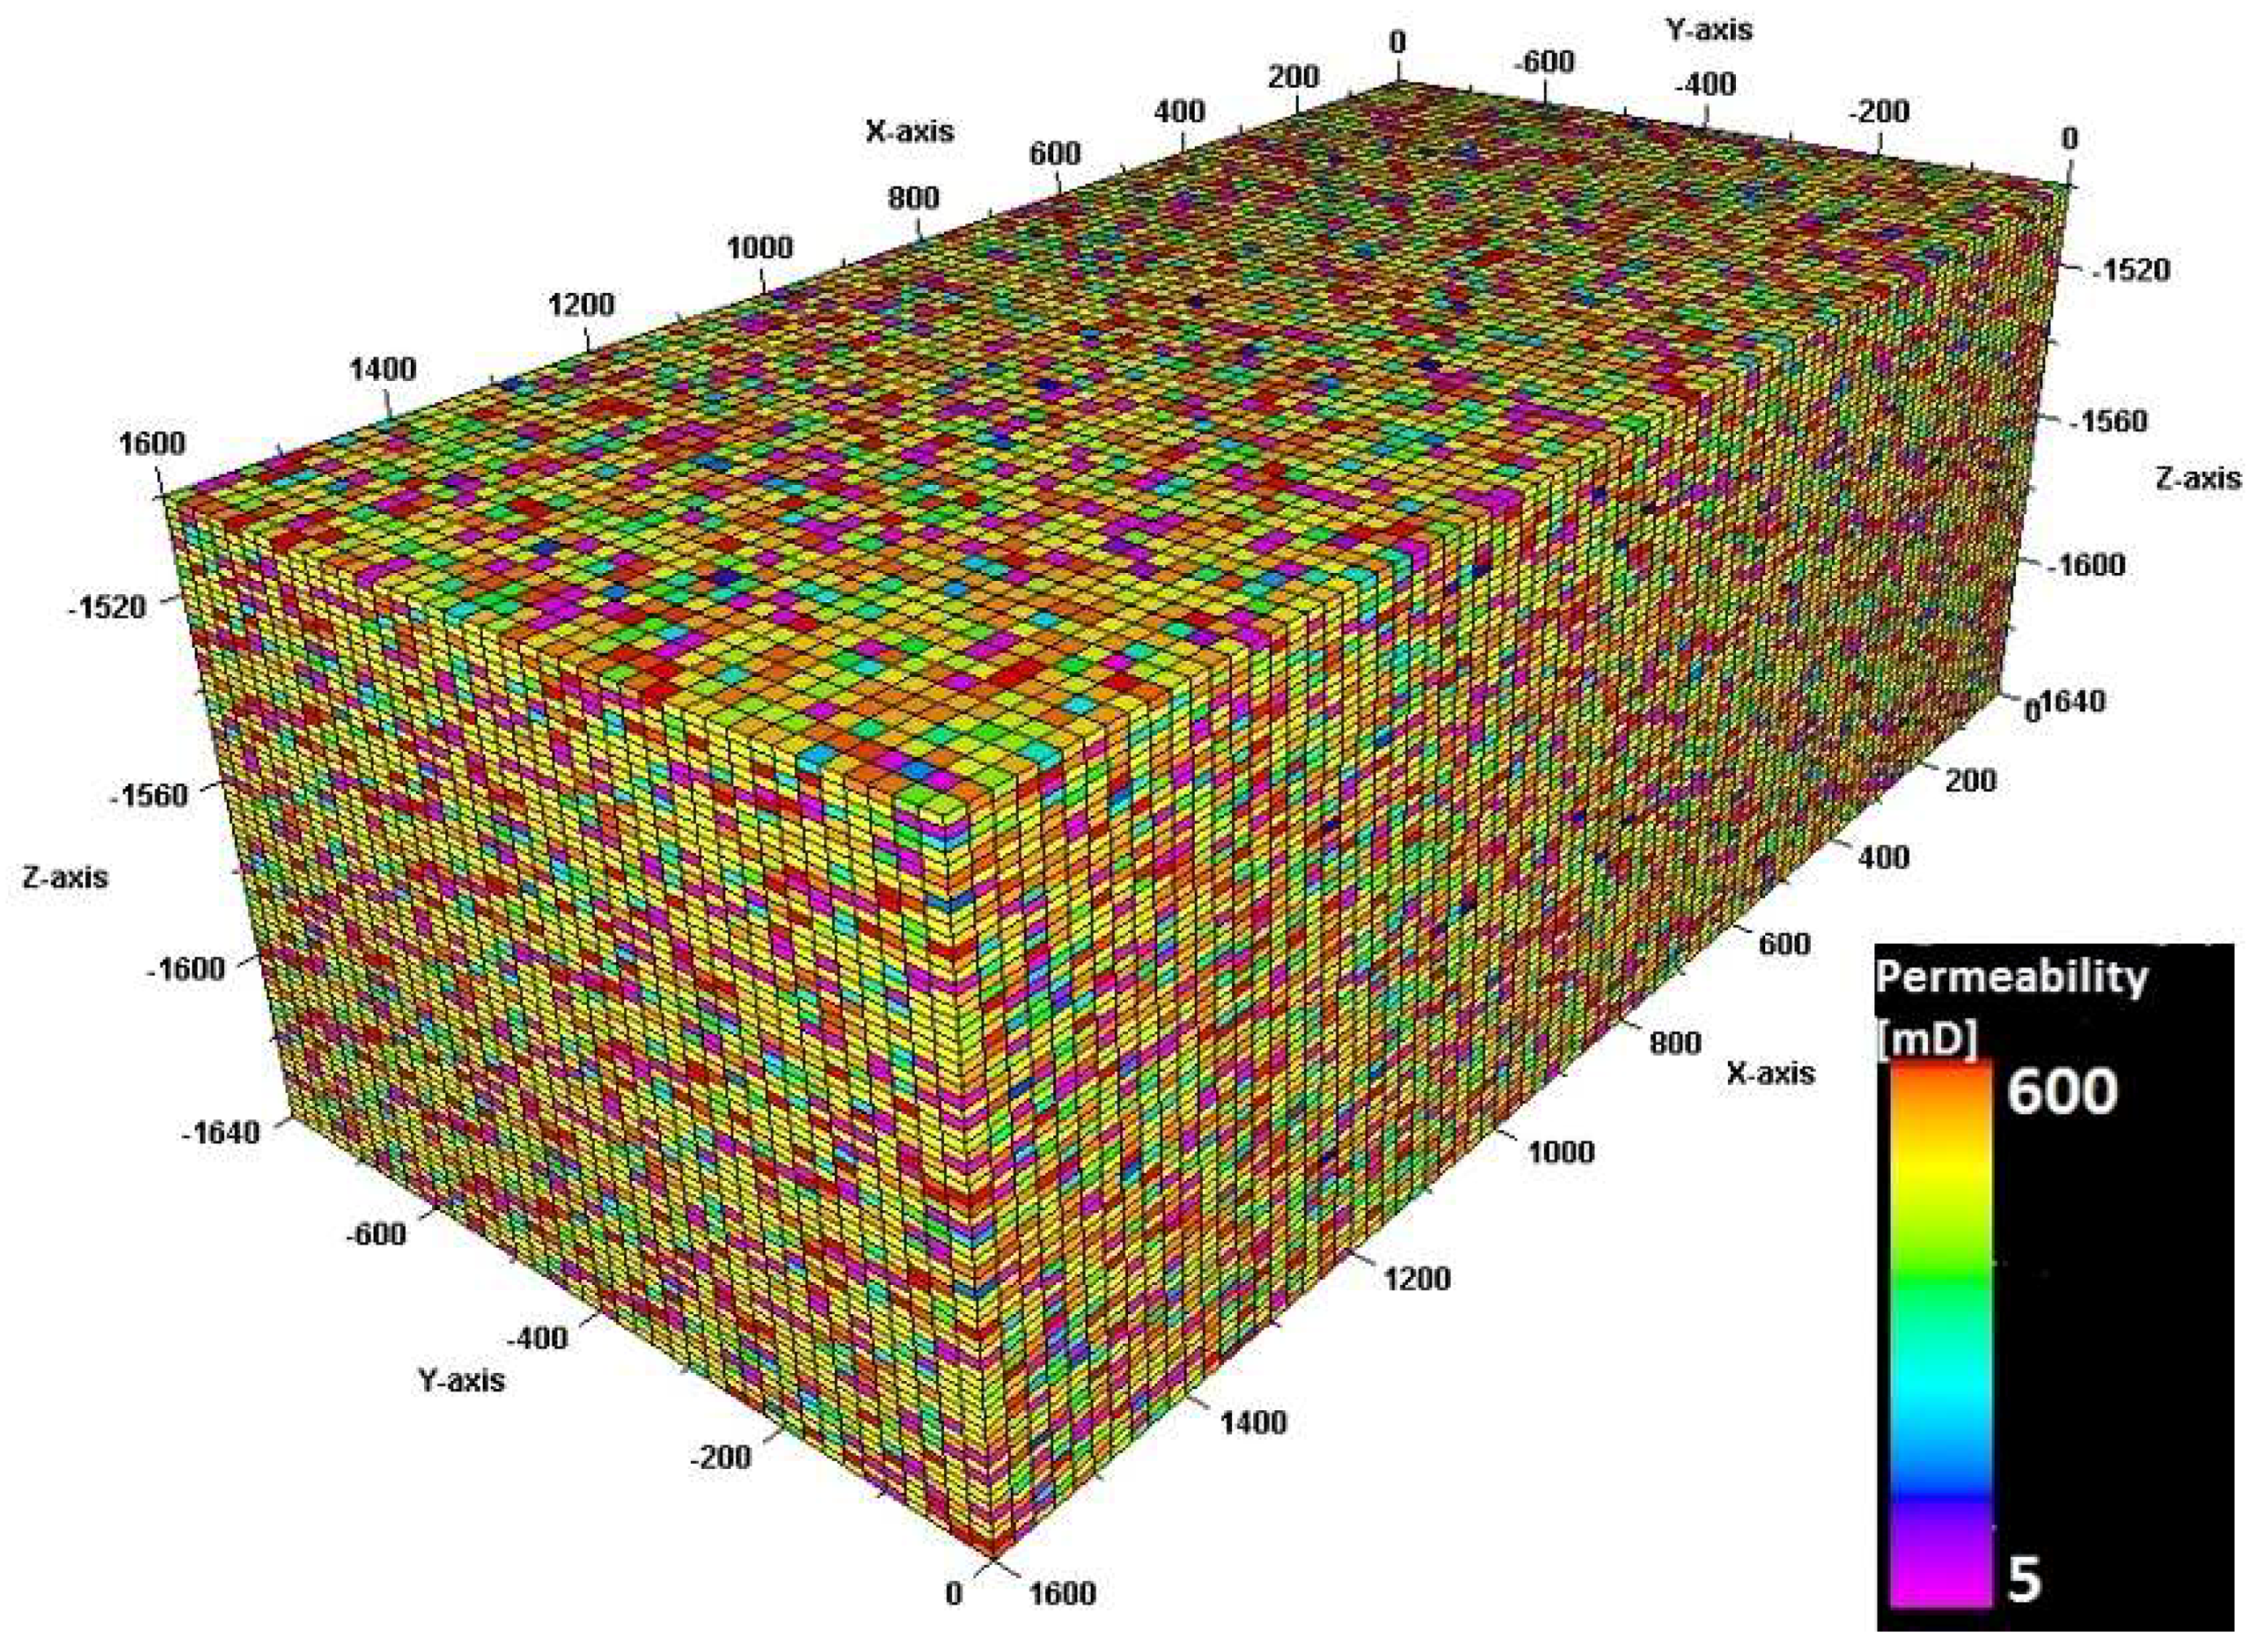
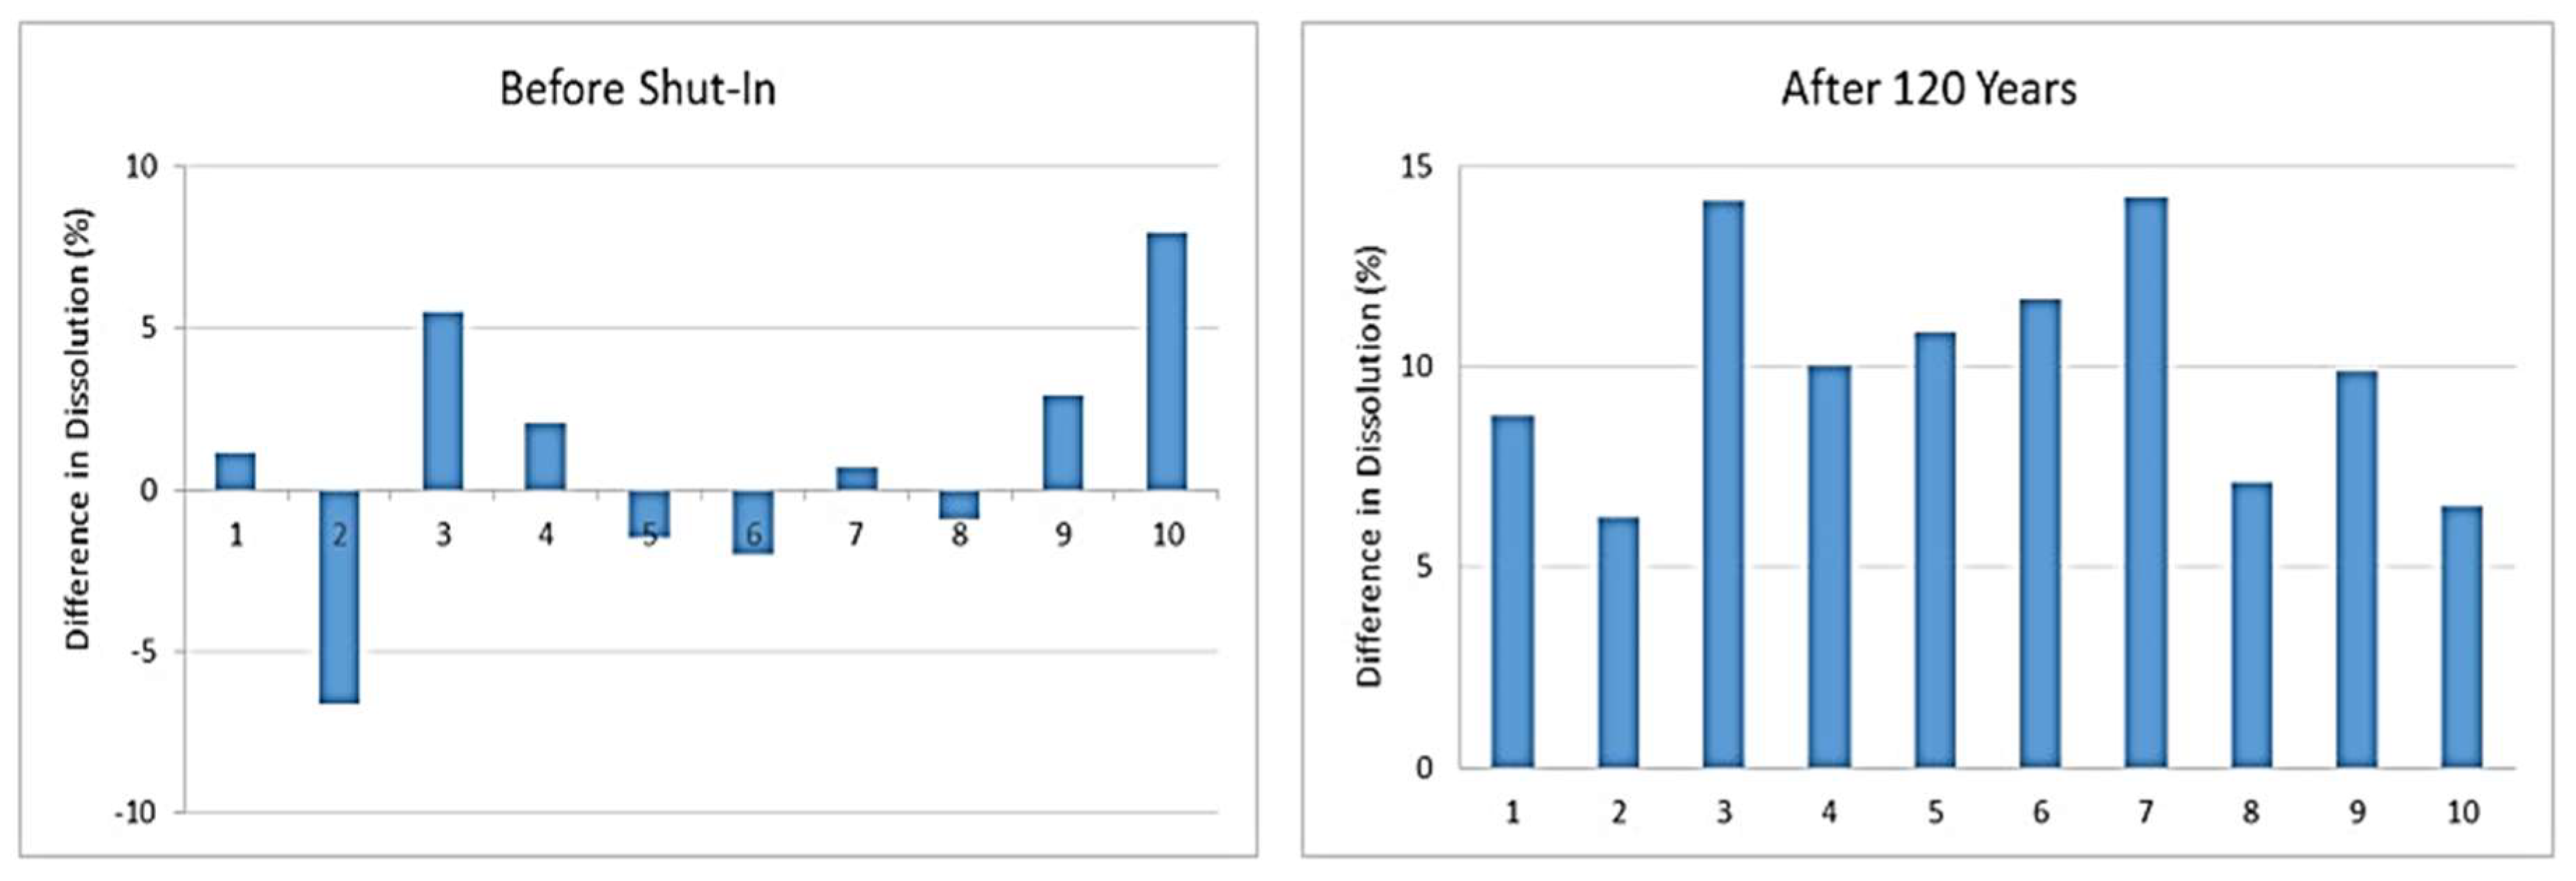
  • Heterogeneous permeability plays an important role in aquifer performance and the amount of dissolved CO2 in brine. The results of our study show that different heterogeneous permeability data can result in different amounts of CO2 being dissolved in brine which is ±7% after the injection stops and up to 13% after 120 years based on our simulations. In this regard, the reservoir performance cannot be judged by just adding one set of heterogeneity data. Applying precise and correct heterogeneity data is crucial when investigating the dissolutions by simulations. Higher standard deviation in producing heterogeneity data with the same mean will result in decrease in solubility of CO2 in brine.

Author Contributions

For research articles with several authors, a short paragraph specifying their individual contributions must be provided. The following statements should be used “Conceptualization, M.A.; Methodology, S.M.S.; Software, M.A.; Validation, M.A., and S.M.S.; Formal Analysis, M.A. and S.M.S.; Investigation, M.A.; Resources, M.A.; Data Curation, M.A. and S.M.S.; Writing-Original Draft Preparation, M.A.; Writing-Review & Editing, M.A. and S.M.S.; Visualization, M.A.; Supervision, S.M.S.; Project Administration, S.M.S.; Funding Acquisition, S.M.S., please turn to the CRediT taxonomy for the term explanation. Authorship must be limited to those who have contributed substantially to the work reported.

Funding

The fund for this study is provided with the Fluid and Complex Systems Research Centre at Coventry University which is highly acknowledge.

Acknowledgments

The authors of this study wish to thank Schlumberger for the use of ECLIPSE 300 and Petrel and Amarile for the use of the RE-Studio. Additionally, the contribution of Philip Costen in this work is highly acknowledged.

Conflicts of Interest

The authors declare no conflict of interest.

References

  1. Metz, B.; Davidson, O.; De Coninck, H.; Loos, M.; Meyer, L. IPCC Special Report on Carbon Dioxide Capture and Storage; Working Group III; Intergovernmental Panel on Climate Change: Geneva, Switzerland, 2005. [Google Scholar]
  2. Bachu, S. CO2 storage in geological media: Role, means, status and barriers to deployment. Prog. Energy Combust. Sci. 2008, 34, 254–273. [Google Scholar] [CrossRef]
  3. Jiang, X. A review of physical modelling and numerical simulation of long-term geological storage of CO. Appl. Energ. 2011, 88, 3557–3566. [Google Scholar] [CrossRef]
  4. Juanes, R.; Spiteri, E.; Orr, E.; Blunt, M. Impact of relative permeability hysteresis on geological CO2 storage. Water Resour. Res. 2006, 42. [Google Scholar] [CrossRef]
  5. Garcia, S.; Kaminska, S.; Maroto-Valer, M. Underground carbon dioxide storage in saline formations. In Proceedings of the Institution of Civil Engineers—Waste and Resource Management; Thomas Telford Ltd.: London, UK, 2010. [Google Scholar]
  6. Chiquet, P.; Daridon, J.-L.; Broseta, D.; Thibeau, S. CO2/water interfacial tensions under pressure and temperature conditions of CO2 geological storage. Energy Convers. Manag. 2007, 48, 736–744. [Google Scholar] [CrossRef]
  7. Onoja, M.; Shariatipour, M. The impact of the gradational contact at the reservoir-seal interface on geological CO2 storage capacity and security. Int. J. Greenh. Gas Control 2018, 72, 1–13. [Google Scholar] [CrossRef]
  8. Bachu, S.; Bonijoly, D.; Bradshaw, J.; Burruss, R.; Holloway, S.; Christensen, N.P.; Mathiassen, O.M. CO2 storage capacity estimation: Methodology and gaps. Int. J. Greenh. Gas Control 2007, 1, 430–443. [Google Scholar] [CrossRef]
  9. Spycher, N.; Pruess, K. CO2-H2O mixtures in the geological sequestration of COPartitioning in chloride brines at 12–100 °C and up to 600 bar. Geochim. Cosmochim. Acta 2005, 69, 3309–3320. [Google Scholar] [CrossRef]
  10. Xu, T.; Apps, J.A.; Pruess, K.; Yamamoto, H. Numerical modeling of injection and mineral trapping of CO2 with H2S and SO2 in a sandstone formation. Chem. Geol. 2007, 242, 319–346. [Google Scholar] [CrossRef]
  11. Nghiem, L.; Shrivastava, V.; Kohse, B.; Hassam, M.; Yang, C. Simulation and optimization of trapping processes for CO2 storage in saline aquifers. J. Can. Petrol. Technol. 2010, 49, 15–22. [Google Scholar] [CrossRef]
  12. Shariatipour, S.M.; Mackay, E.J.; Pickup, G.E. An engineering solution for CO2 injection in saline aquifers. Int. J. Greenh. Gas Control 2016, 53, 98–105. [Google Scholar] [CrossRef]
  13. Hassanzadeh, H.; Pooladi-Darvish, M.; Keith, D.W. Accelerating CO2 dissolution in saline aquifers for geological storage—Mechanistic and sensitivity studies. Energy Fuels 2009, 23, 3328–3336. [Google Scholar] [CrossRef]
  14. Zirrahi, M.; Hassanzadeh, H.; Abedi, J. The laboratory testing and scale-up of a downhole device for CO2 dissolution acceleration. Int. J. Greenh. Gas Control 2013, 16, 41–49. [Google Scholar] [CrossRef]
  15. Emami-Meybodi, H.; Hassanzadeh, H.; Green, C.P.; Enis-King, J. Convective dissolution of CO2 in saline aquifers: Progress in modeling and experiments. Int. J. Greenh. Gas Control 2015, 40, 238–266. [Google Scholar] [CrossRef]
  16. Ide, S.T.; Jessen, K.; Orr, F.M. Storage of CO2 in saline aquifers: Effects of gravity, viscous, and capillary forces on amount and timing of trapping. Int. J. Greenh. Gas Control 2007, 1, 481–491. [Google Scholar]
  17. Li, D.; He, Y.; Zhang, H.; Xu, W.; Jiang, X. A numerical study of the impurity effects on CO2 geological storage in layered formation. Appl. Energy 2017, 199, 107–120. [Google Scholar] [CrossRef]
  18. Holloway, S.; Vincent, C.J.; Bentham, M.S.; Kirk, K.L. Top-down and bottom-up estimates of CO2 storage capacity in the United Kingdom sector of the southern North Sea basin. Environ. Geosci. 2006, 13, 71–84. [Google Scholar] [CrossRef]
  19. Noy, D.J.; Holloway, S.; Chadwick, R.A.; Williams, J.D.O.; Hannis, S.A.; Lahann, R. Modelling large-scale carbon dioxide injection into the Bunter Sandstone in the UK Southern North Sea. Int. J. Greenh. Gas Control 2012, 9, 220–233. [Google Scholar] [CrossRef] [Green Version]
  20. Williams, J.; Jin, M.; Bentham, M.; Pickup, G.; Hannis, S.; Mackay, E. Modelling carbon dioxide storage within closed structures in the UK Bunter Sandstone Formation. Int. J. Greenh. Gas Control 2013, 18, 38–50. [Google Scholar] [CrossRef] [Green Version]
  21. Cameron, T.; Crosby, A.; Balson, P.; Jeffery, D.; Lott, G.; Bulat, J.; Harrison, D. The Geology of the Southern North Sea; United Kingdom Offshore Regional Report; British Geological Survey: Nottingham, UK, 1992. [Google Scholar]
  22. Bentham, M. An Assessment of Carbon Sequestration Potential in the UK–Southern North Sea Case Study; Tyndall Centre for Climate Change Research: Nottingham, UK, 2006. [Google Scholar]
  23. Heinemann, N.; Wilkinson, M.; Pickup, G.E.; Haszeldine, R.S.; Cutler, N.A. CO2 storage in the offshore UK Bunter sandstone formation. Int. J. Greenh. Gas Control 2012, 6, 210–219. [Google Scholar] [CrossRef]
  24. Bagheri, M.; Shariatipour, S.M.; Ganjian, E. A review of oil well cement alteration in CO2-rich environments. Int. J. Greenh. Gas Control 2018, 186, 946–968. [Google Scholar] [CrossRef]
  25. Salimi, H.; Wolf, K.H. Integration of heat-energy recovery and carbon sequestration. Int. J. Greenh. Gas Control 2012, 6, 56–68. [Google Scholar] [CrossRef]
  26. Ganjdanesh, R.; Bryant, S.; Orbach, R.; Pope, G.; Sepehrnoori, K. Coupled carbon dioxide sequestration and energy production from geopressured/geothermal aquifers. SPE J. 2014, 19, 239–248. [Google Scholar] [CrossRef]
  27. Shariatipour, S.M.; Pickup, G.E.; Mackay, E.J. Simulations of CO2 storage in aquifer models with top surface morphology and transition zones. Int. J. Greenh. Gas Control 2016, 54, 117–128. [Google Scholar] [CrossRef]
  28. Bachu, S. Review of CO2 storage efficiency in deep saline aquifers. Int. J. Greenh. Gas Control 2005, 40, 188–202. [Google Scholar] [CrossRef]
  29. NETL, M. Carbon Sequestration Atlas of the United States and Canada, 1st ed.; The U.S. Department of Energy, Office of Fossil Energy: Washington, DC, USA, 2007.
  30. Sifuentes, W.F.; Giddins, M.A.; Blunt, M.J. Modeling CO2 Storage in Aquifers: Assessing the key contributors to uncertainty. In Proceedings of the SPE Offshore Europe Oil and Gas Conference and Exhibition, SPE 123582, Aberdeen, UK, 8–11 September 2009. [Google Scholar]
  31. Lengler, U.; De Lucia, M.; Kuhn, M. The impact of heterogeneity on the distribution of CO2: Nnumerical simulation of CO2 storage at Ketzin. Int. J. Greenh. Gas Control 2010, 4, 1016–1025. [Google Scholar] [CrossRef]
  32. Oloruntobi, O.S.; LaForce, T. Effect of aquifer heterogeneity on CO2 sequestration. In Proceedings of the SPE Europec/Eage Annual Conference and Exhibition, SPE 121776, Amsterdam, The Netherlands, 8–11 June 2009. [Google Scholar]
  33. Issautier, B.; Viseur, S.; Audigane, P.; Chiaberge, C.; LeNindre, Y. A new Approach for evaluating the impact of fluvial type heterogeneity in CO2 storage reservoir modeling. CR GEOSCI 2016, 7, 531–539. [Google Scholar] [CrossRef]
  34. Shariatipour, S.; Pickup, G.E.; Mackay, E.J.; Heinemann, N. Flow simulation of CO2 storage in saline aquifers using a black oil simulators. In Proceedings of the Carbon Management Technology Conference, CMTC 151042, Orlando, FL, USA, 7–9 February 2012. [Google Scholar]
  35. Al-khdheewi, E.A.; Vialle, S.; Barifcani, A.; Sarmadivaleh, M.; Iglauer, S. Influence of the injection well configuration and rock wettability on CO2 plume behaviour and CO2 trapping capacity in heterogeneous reservoirs. Int. J. Greenh. Gas Control 2017, 43, 190–206. [Google Scholar]
  36. Zakrisson, J.; Edman, I.; Cinar, Y. Multiwell injectivity for CO2 storage. In Proceedings of the Asia Pasific Oil and Gas Conference and Exhibition, SPE 116355, Perth, Australia, 20–22 October 2008. [Google Scholar]
  37. Cihan, A.; Birkholzer, T.J.; Bianchi, M. Optimal well placement and brine extraction for pressure management during CO2 sequatration. Int. J. Greenh. Gas Control 2015, 42, 175–187. [Google Scholar] [CrossRef]
  38. Bennion, B.; Bachu, S. Drainage and imbibition relative permeability relationships for supercritical CO2/brine and H2S/brine systems in intergranular sandstone, carbonate, shale, and anhydrite rocks. SPE Reserv. Eval. Eng. 2008, 11, 487–496. [Google Scholar] [CrossRef]
  39. Brook, M.; Shaw, K.; Vincent, C.; Holloway, S. Gestco case study 2a-1: Storage Potential of the Bunter Sandstone in the UK Sector of the Southern North Sea and the Adjacent Onshore Area of Eastern England; NERC Open Research Archive: Nottingham, UK, 2003. [Google Scholar]
Figure 1. The 3D reservoir simulation model showing the horizontal heterogeneous permeability.
Fluids 03 00076 g001
Figure 2. Simulation result for the effect of injection period on CO2 dissolution in brine vs. time.
Fluids 03 00076 g002
Figure 3. Simulation result for the effect of Kv/Kh ratio on the amount of dissolved CO2 vs. time by changing Kv.
Fluids 03 00076 g003
Figure 4. Simulation result for the effect of Kv/Kh ratio on CO2 dissolution in brine vs. time by changing Kh.
Fluids 03 00076 g004
Figure 5. Control of absolute permeability on Kv/Kh ratio on CO2 dissolution in brine (by changing Kv).
Fluids 03 00076 g005
Figure 6. Simulation result for the effect of heterogeneity on CO2 dissolution in brine vs. time.
Fluids 03 00076 g006
Figure 7. Increase/decrease in permeability for different permeability heterogeneity data.
Fluids 03 00076 g007
Figure 8. Gas saturation distribution after 120 years in 6 different cases.
Fluids 03 00076 g008
Figure 9. Effect of two layers of permeability heterogeneity on the dissolution of CO2 in brine in two cases. (A) First simulation with the first set of heterogeneity data, (B) Second simulation with the second set of heterogeneity data.
Fluids 03 00076 g009
Figure 10. Simulation result for the effect of the number of grid block connections between well and reservoir.
Fluids 03 00076 g010
Figure 11. Gas saturation distribution by vertical (left) and horizontal well (right).
Fluids 03 00076 g011
Figure 12. Simulation result for the effect of vertical and horizontal wells on CO2 dissolution in brine.
Fluids 03 00076 g012
Table 1. Input data for the basic model [22].
Input DataValueUnits
H. Permeability250mD
V. Permeability25mD
Porosity0.18-
Depth1500m
Number of Blocks80 × 40 × 70-
Blocks Dimensions20 × 20 × 2m
Rock Compressibility5.56 × 10−51/bars
Temperature55°C
Pressure150bars
Thickness140m
Injection Rate1Mt/year
Table 2. Reservoir fluid properties used in the simulation at 150 bars and 55 °C [9].
SpecificationCO2Brine
Critical Point73 bars, 31 °C217.6 bars, 373.8 °C
Molecular Weight44 g/Mol18 g/Mol
Density651.85 Kg/m3992.08 Kg/m3
Viscosity0.051 mPa.s1 mPa.s
Table 3. Data of increase/decrease of CO2 dissolution in brine with changing the maximum of the range.
Case No.After Shut-in (20 Years) (%)After 120 Years (%)
11 (Kv 0.5 mD to 40 mD) &
(Kh 5 mD to 500)
−1.6011.36
12 (Kv 0.5 mD to 70 mD) &
(Kh 5 mD to 900 md)
−0.9210.79
13 (Kv 0.5 mD to 100 mD) &
(Kh 5 mD to 1100 mD)
4.8812.10
14 (Kv 0.5 mD to 150 mD) &
(Kh 5 mD to 1400 mD)
−0.438.06
Table 4. Data of increase/decrease of CO2 dissolution in brine for different ranges.
Case No.After Shut-in (20 Years) (%)After 120 Years (%)
15 (Kv 5 mD to 40 mD) &
(Kh 100 mD to 450 mD)
0.822.33
16 (Kv 15 mD to 70 mD) &
(Kh 25 mD to 650 mD)
1.972.74
17 (Kv 20 mD to 30 mD) &
(Kh 150 mD to 500 mD)
3.631.10
18 (Kv 1 mD to 90 mD) &
(Kh 200 mD to 800 mD)
6.375.42
19 (Kv 10 mD to 80 mD) &
(Kh 50 mD to 800 mD)
0.56-0.61
Table 5. Data of increase/decrease of CO2 dissolution in brine with changing standard deviation.
Case No.After Shut-in (20 Years) (%)After 120 Years (%)
20 (S.D. = 5&50)1.280.58
21 (S.D. = 10&100)3.811.12
22 (S.D. = 30&300)0.204.98
23 (S.D. = 40&400)−4.593.29
24 (S.D. = 80&700)−4.602.24
25 (S.D. = 100&900)−8.66−1.27
26 (S.D. = 200&1100)−10.03−4.33
Table 6. Difference in CO2 dissolution by changing well location compared to the base case.
Case No.After Shut-in (20 Years) (%)After 120 Years (%)
1 (Symmetry to the base)−1.21−1.66
2 (Centre of the model)23.7511.52
3 (blocks 20&10 in XY plane)26.7113.51
4 (Blocks 60&30 in XY plane)25.4311.60

