Article

Study of Local Inertial Focusing Conditions for Spherical Particles in Asymmetric Serpentines

Física i Cristal∙lografia de Materials i Nanomaterials (FiCMA-FiCNA)-EMaS, Departament Química Física i Inorgànica, Campus Sescelades, Universitat Rovira i Virgili, E-43007 Tarragona, Spain
*
Author to whom correspondence should be addressed.
Submission received: 13 November 2019 / Revised: 16 December 2019 / Accepted: 17 December 2019 / Published: 20 December 2019

Abstract

:
Inertial focusing conditions of fluorescent polystyrene spherical particles are studied at the pointwise level along their pathlines. This is accomplished by an algorithm that calculates a degree of spreading function of the particles’ trajectories taking streaklines images as raw data. Different confinement ratios of the particles and flow rates are studied and the results are presented in state diagrams showing the focusing degree of the particles in terms of their position within a curve of an asymmetric serpentine and the applied flow rate. In addition, together with numerical simulation results, we present empirical evidence that the preferred trajectories of inertially focused spheres are contained within Dean vortices’ centerlines. We speculate about the existence of a new force, never postulated before, to explain this fact.

Graphical Abstract

1. Introduction

The merging of microfluidics with inertial focusing has provided researchers with interesting applications whose performance can hardly be matched by conventional techniques in other disciplines, particularly in fields related with flow cytometry. One of the most remarkable features of inertial focusing is the precision and reproducibility it offers to passively focus cells and particles [1,2,3,4,5] while keeping them evenly spaced [6,7,8,9]; an invaluable characteristic when cells are required to move at a certain constant distance from a detector while being regularly spaced between each other over and over during a measurement to avoid multiple detection. Inertial focusing positions are inherently dependent on particle’s physical properties (its size, shape and deformability [10,11,12,13]). Particularly, both theoretical and experimental approaches have found a strong relationship between the particle’s diameter and the inertial lift [14,15,16,17,18,19,20]. This fact and other physical particularities of cells and particles (like size, rigidity and shape) are further exploited to separate cells and particles in a passive manner according to these properties to either sort them, enrich a particular sub-population [21,22,23,24,25,26,27,28,29], perform a solution reduction of a sample (volume reduction) [30,31,32] or a solution exchange in a sample containing cells (RInSE) [33,34].
The complex nature of inertial focusing has become a cumbersome barrier for a detailed physical description of this process. Hence, many authors have suggested the use of dimensionless constants as design parameters to quantify and characterize inertial focusing conditions in microfluidic devices. A precise knowledge of the scaling laws of the involved inertial forces has also been sought [1,14,35,36]. Such parameters generally depend on the size of the particles, physical properties of the fluid (viscosity, density, flow rate, etc.) and the geometric dimensions and features of the microfluidic channels through which particles and cells are flowing within. The achievement of proper inertial focusing conditions can then be inferred from the values of these dimensionless constants and variables with respect to known specific inequalities or diagrams both deduced from experimental and/or numerical data. The main purpose of these studies is to gather information provided by the experimental conditions to produce state diagrams which outline the focusing conditions of particles in a succinct manner; the outcome of the experiment can in principle be deduced according to the position or parcel that the associated dimensionless constants in a given experiment occupy in a state diagram [1,36,37,38,39,40]. A well stablished criterion to characterize inertial focusing in straight channels is based on the use of two dimensionless constants, namely, the particle confinement ratio λ = a / D h , where a is the particle diameter and D h = 2 w h / ( w + h ) is the hydraulic diameter of the channel, where w and h are the width and height of the channel; and the particle Reynolds number R e p = λ 2 R e C , where R e C = ρ U M a x D h / μ is the channel Reynolds number, ρ is the density of the fluid, U M a x the maximum velocity of the flow in the channel and μ is the fluid viscosity. For a given channel geometry, inertial effects over particles will only occur if the value of the aforementioned constants simultaneously exceed a threshold which, in the case of the confinement ratio, prior research determined to be λ > 0.07 [1] and, in the case of the particle Reynolds number, R e p 1 [41]. The strict application of these conditions, however, seems not advisable since the focusing/defocusing transition appears to lay in a somewhat diffuse frontier; inertial focusing has also been observed for R e p < 1 [36,39] and, simultaneously, for λ < 0.07 in curved channels [38]. The threshold in the particle confinement ratio may be attributed to the dependence of the shear gradient lift force, that causes wall-directed inertial migration of particles across the section of the channel, with this parameter (inertial lift force scales as F L a 3 / D h near the channel centerline). The existence of a threshold for the particle Reynolds number, on the other hand, incorporates the need of a minimum flow rate so that inertial effects of the fluid are significant for inertial migration of particles to occur.
When curved channels are used, an additional secondary transverse flow, known as Dean flow, appears as a superposition to the main flow. A detailed description about the origin of this secondary flow can be found in the literature [42,43,44]. The dimensionless number that characterizes the strength of Dean flows in a curved channel is the Dean number, D e = R e C δ 1 / 2 , where δ = D h / 2 r is the curvature ratio and r is the mean radius of curvature of the channel. If secondary flows are strong enough, the position and the stability of the particles’ focusing positions may be influenced by the drag induced by the Dean flow. Aiming at finding a parameter to characterize particle focusing conditions in curved channels, some authors proposed the use of a ratio between lift forces and the drag caused by Dean flows, the inertial force ratio, R F = F L / F D [1,36,40]. The value of this ratio should, in principle, be useful to predict the outcome of the interaction between inertial lift and Dean drag forces on the particles’ equilibrium positions in a curved channel; no change in the focusing positions ( F L F D ), the positions are modified ( F L F D ) or stable trajectories are completely destroyed by Dean flows ( F L F D ).
Inertial focusing in curved geometries are credited with superior focusing and particle control capabilities. The presence of Dean flows can favor the destruction and/or emergence of new stable focusing positions with respect to those found in a straight channel with the same aspect ratio. This can lead to a reduction in the number of stable trajectories down to a number of selectable positions whose existence depends on R e , λ and D e . Additionally, it is believed that Dean drag may allow faster focusing than in straight channels because it aids particles in sweeping the section of the fluidic channel to find their focusing position faster [36]. Due to the dependence of Dean drag and inertial lift to particle size, inertial focusing in curved channels enables unique particle size-dependent equilibrium positions which can be used for passive selective positioning and sorting [2,21,39,40,45,46,47,48].
In this paper we present a series of focusing measurements which involve the characterization of the degree of spreading (DoS) of the streak of fluorescent polystyrene beads moving in an asymmetric serpentine under inertial focusing conditions. This analysis is applied over a series of averaged video frame images obtained at different flow rate conditions, channel aspect ratios and particle diameters. The characterization takes place in one of the smaller curves of the serpentine, where Dean flows are more intense and inertial lift forces over the particles, due to the velocity gradients, are stronger as well. In some cases, the focusing regime is achieved in far-off conditions than those stated in the literature. The degree of spreading of the particles is not limited to an intensity profile measurement at a particular section of the channel as in prior studies [36,39,40,46,47,48], but to an extended measurement across the entire area defined by the small curve region. The employed method allows us to capture fine variations of focusing conditions in the curve caused by local flow field conditions. In addition, we make use of previous results obtained from numerical simulations [49] to highlight the apparent preference of particles to move along Dean vortices centerlines. Although prior experimental evidence has proven how particles in curved geometries can focus under inertial focusing conditions when Dean flows are present, no conclusive physical explanation of the mechanics behind this process has yet been provided. In the last section, we present a possible explanation for this phenomenon founded in the existence of the shear profile for the well-known transverse (Dean) flow.

2. Experimental Setup and Employed Materials

Three different molds containing asymmetric serpentine geometries were done employing conventional photolithography techniques. A single serpentine design was created and engraved for that purpose in a chromium mask with a submicron resolution UV laser (DWL 66 fs, Heidelberg Instruments GmbH, Heidelberg, Germany). SU8 (SU8-2150, MicroChem Corp., Newton, MA, USA) was then applied over three inch wafers and spun at different speeds in order to obtain three different resist thicknesses, 37 , 44 and 73   μ m . The serpentine design was then transferred from the chromium mask using a UV mask aligner (MG 1410, SÜSS MicroTec AG, Garching, Germany) onto the baked SU8 substrates. One single mask design could then be used to produce three microfluidic channels with varying aspect ratios.
Figure 1 shows the design of one of the serpentines together with the dimensions of one of its periodic units. The curvature radii were chosen to match the values used in our previous numerical study [49]. The microfluidic chip was elaborated in polydimethylsiloxane (PDMS) (Sylgard 184, Dow Corning Corp., Midland, MI, USA). As in our previous work [49], this microfluidic device also incorporated micromachined glass mirrors which provided a lateral view of the microfluidic channels as the focusing process of the particles took place.
Fluorescent polystyrene particles (2105B, 2106C and 2106G, Phosphorex, Inc., Hopkinton, MA, USA) of three different diameters ( 3 , 6 and 10   µ m ) were used to characterize the degree of focusing. These particles were pumped at 473   nm with a fiber coupled blue diode laser (06-01 Series, Cobolt AB, Solna, Sweden) and recorded with a CCD camera (DCU223C, Thorlabs, Newton, NJ, USA) using an inverted microscope platform. A pressure controller (OB1-mk3 from Elveflow, Paris, France) was used to reach a stable flow rate in the microfluidic device. The flow rate was acquired with a flow sensor (MSF4, Elveflow, Paris, France) with feedback control over our pressure controller. Typical employed flow rates ranged from 50 to 400   µ l / min .

3. Methods

A custom-developed algorithm was sequentially applied over 1024 x 768 resolution images obtained from video frame averaging. The flow rate was kept constant during the acquisition of each video, meaning that each averaged image (corresponding to 120 seconds of a 14 frames/s rate video) was representative of a given flow rate, particle size and channel geometry. The flow rate was varied between each video acquisition from 30 50   μ L / min up to 310 400   μ L / min in 10   μ L / min steps. A whole set of averaged images was then obtained for a given channel geometry (height) from a fixed portion of the serpentine (located at a small turn of the serpentine) and fixed particle size.
The resulting images contained fluorescence intensity streaks of particles travelling through the small turn from left to right (left hand side in Figure 2). The code then performed a column-to-column scan over these images to find the maximum intensity values at each column. By connecting all the found successive maxima, we obtained the hereinafter-called pseudo trajectory. Particles cast a fluorescence streak as they move whose intensity magnitude in the final image is proportional to the number of particles traveling through the same path. The pseudo trajectory can therefore be understood as the trajectory that any given particle will follow with the highest likelihood for the given experimental conditions (flow rate, particle size and channel geometry).
Perpendicular segments were defined at each point of the pseudo trajectory employing the positions of their adjacent points to determine its direction (left hand side in Figure 2). Said segments were centered with respect to the pseudo trajectory while its length was kept constant, no matter of its orientation, at 400 pixels ( 154   μ m ) ensuring that the entire width of the fluidic channel was contained within the segments. An internal MATLAB function was used to extract the image intensity profile values along each perpendicular segment. By stacking all intensity profiles, the original image could be mapped into a new 400 × 768 resolution image in which the pseudo trajectory is represented as a straight line (upper rightmost section in Figure 2).
The degree of spreading at each intensity profile was calculated as a weighted standard deviation of pixel intensities from the pseudo-trajectory as:
D o S ( i ) = j = 1 400 c ( i , j ) C ( j 200 ) 2 ,
where,
C = j = 1 400 c ( i , j ) ,
where c ( i , j ) is the 400 × 768 resolution eight-bit intensity encoded image with column index i running from 1 to 768. The index j runs across the entire width of the transverse segments, from 1 to 400. Figure 3a shows a representative plot of the degree of spreading for a given particle size. Local minima of the DoS, marked with green dots, indicate the positions at which the stream of particles experiences a local tightening; positions preceded and followed by regions with a lesser amount of focusing. At the edges of the DoS curve, the analysis algorithm marks with red dots and red shaded bands the regions at which the fluorescence streak is partially hidden at the border of the image so as to ignore the values of the DoS at these regions.
When gathering all the DoS curves for different flow rates a surface, the spreading degree map, is obtained (Figure 3b). The lower regions on this surface represent the conditions (flow rate and position in the curve) for which the best inertial focusing is achieved. These measurements are repeated for different particle diameter/channel aspect ratio combinations to obtain a more general picture of the inertial focusing behavior. This approach gives rise to a richer and more detailed view of inertial focusing conditions of particles since the whole fluidic curved region, with its flow features acting over the particles at each point of the curved trajectory, is considered for the analysis.

4. Results

4.1. DoS and Spreading Degree Map

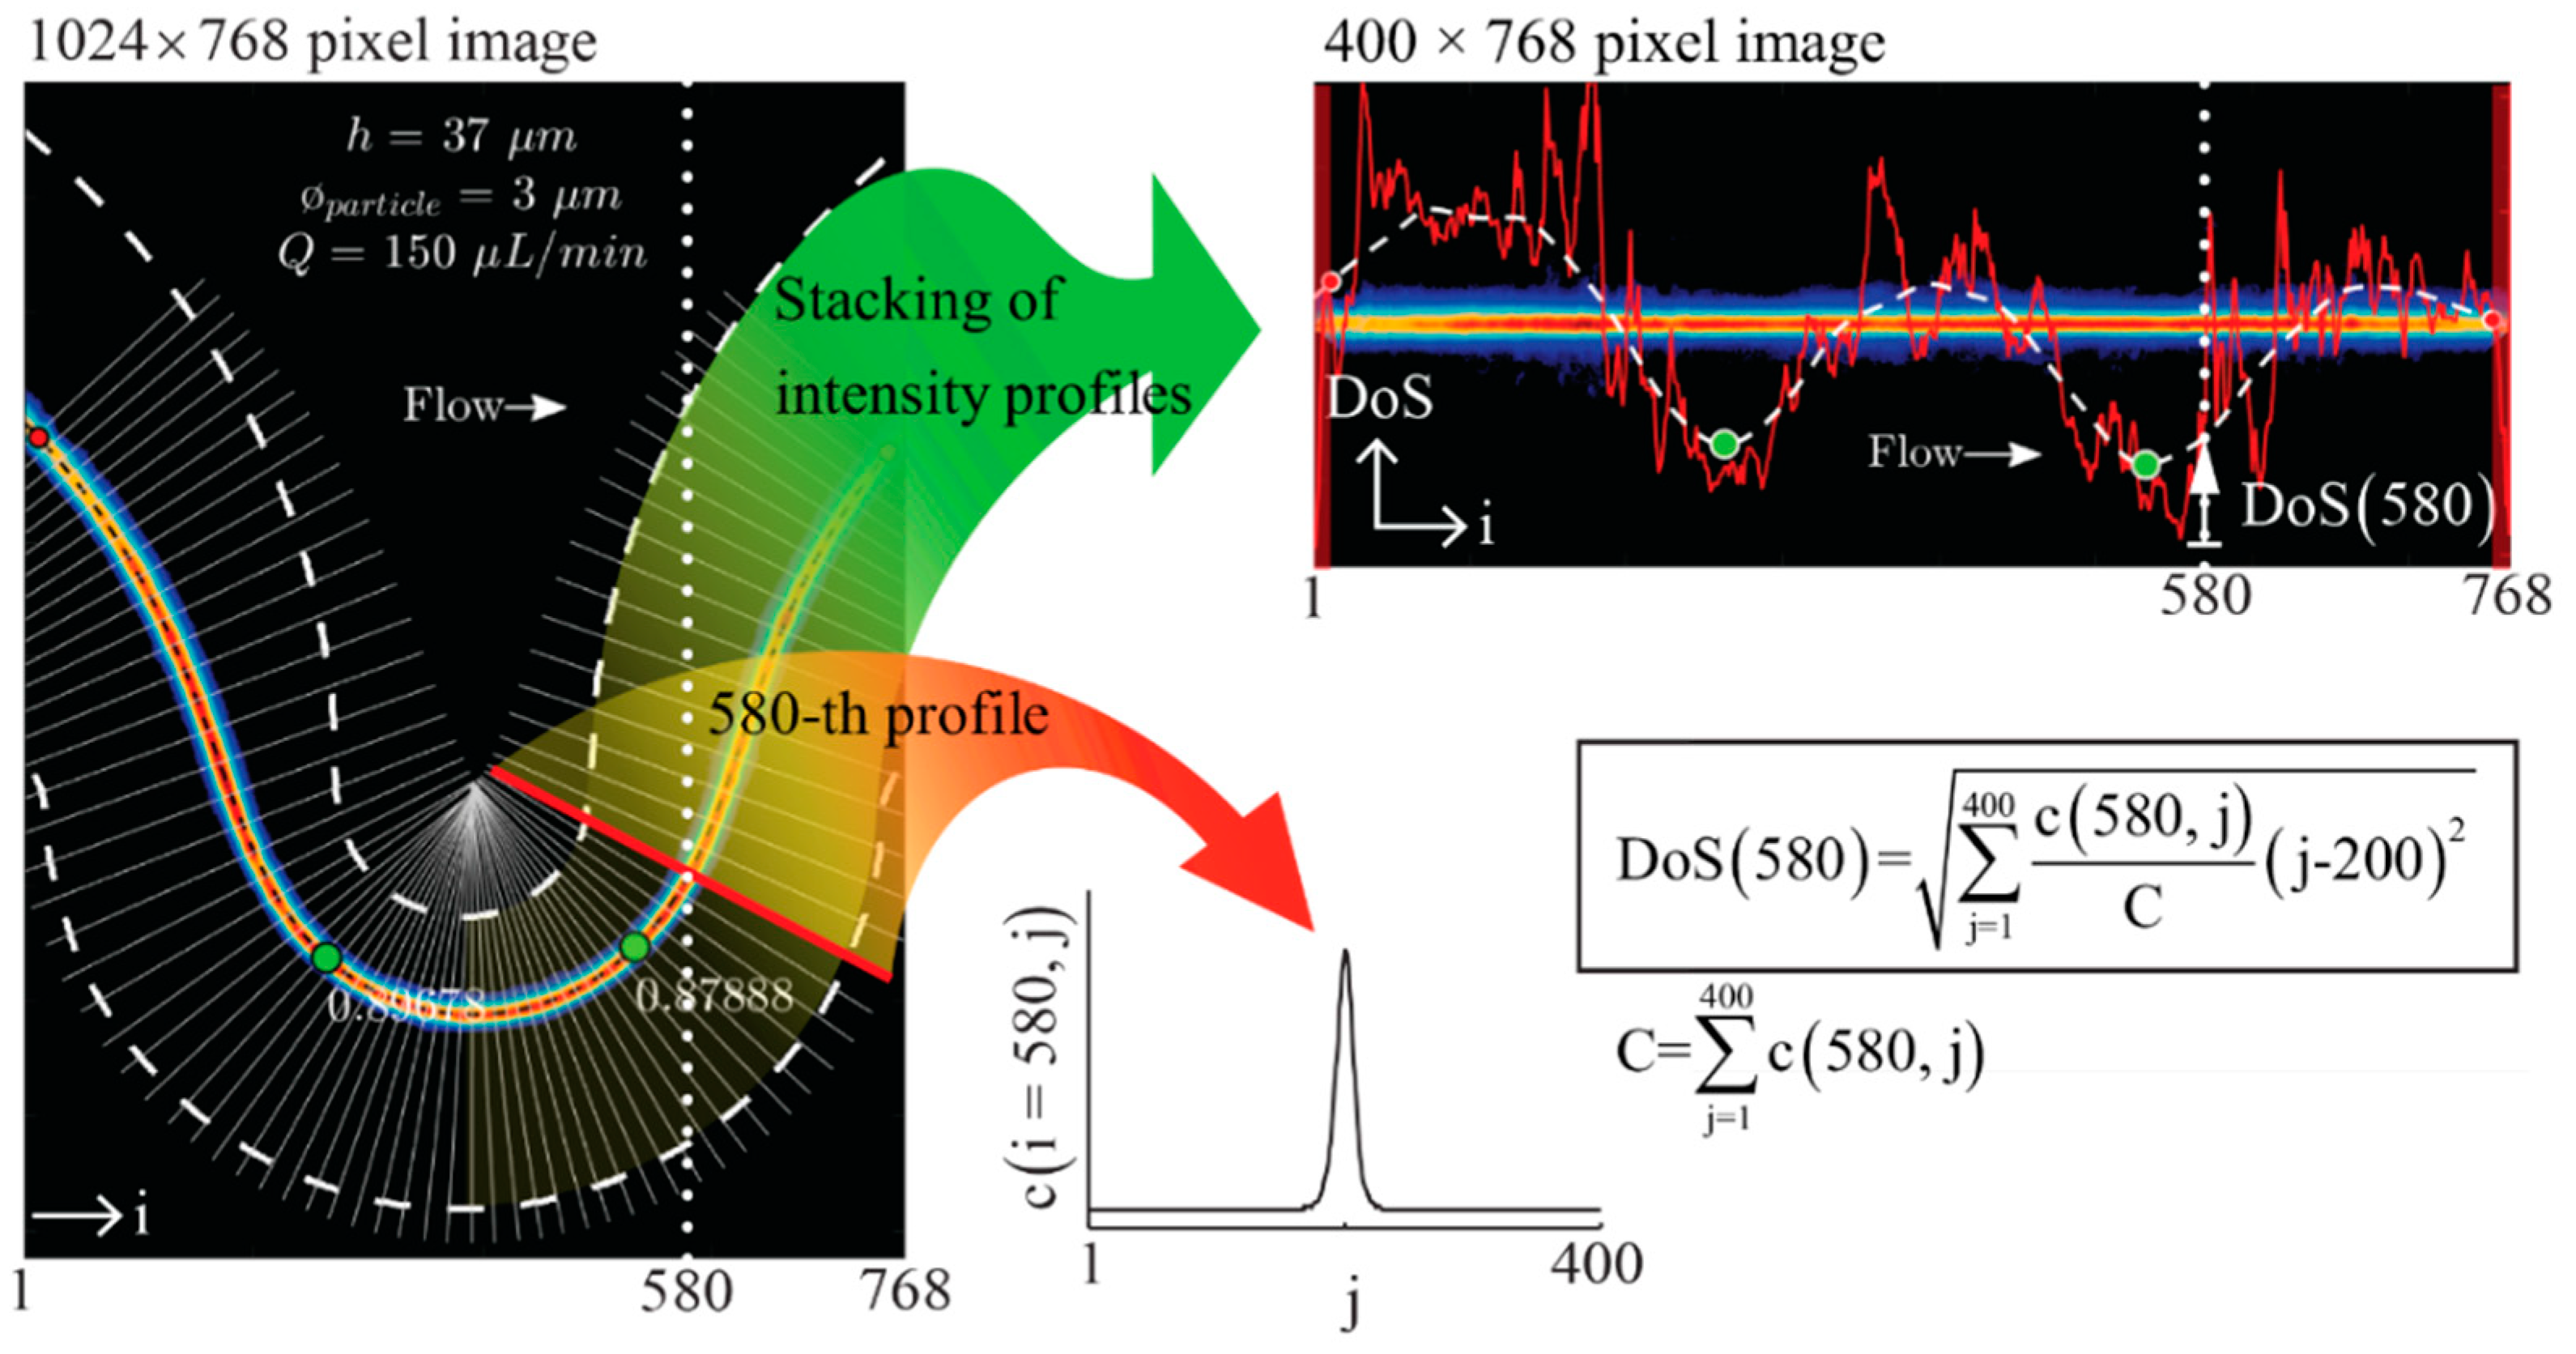
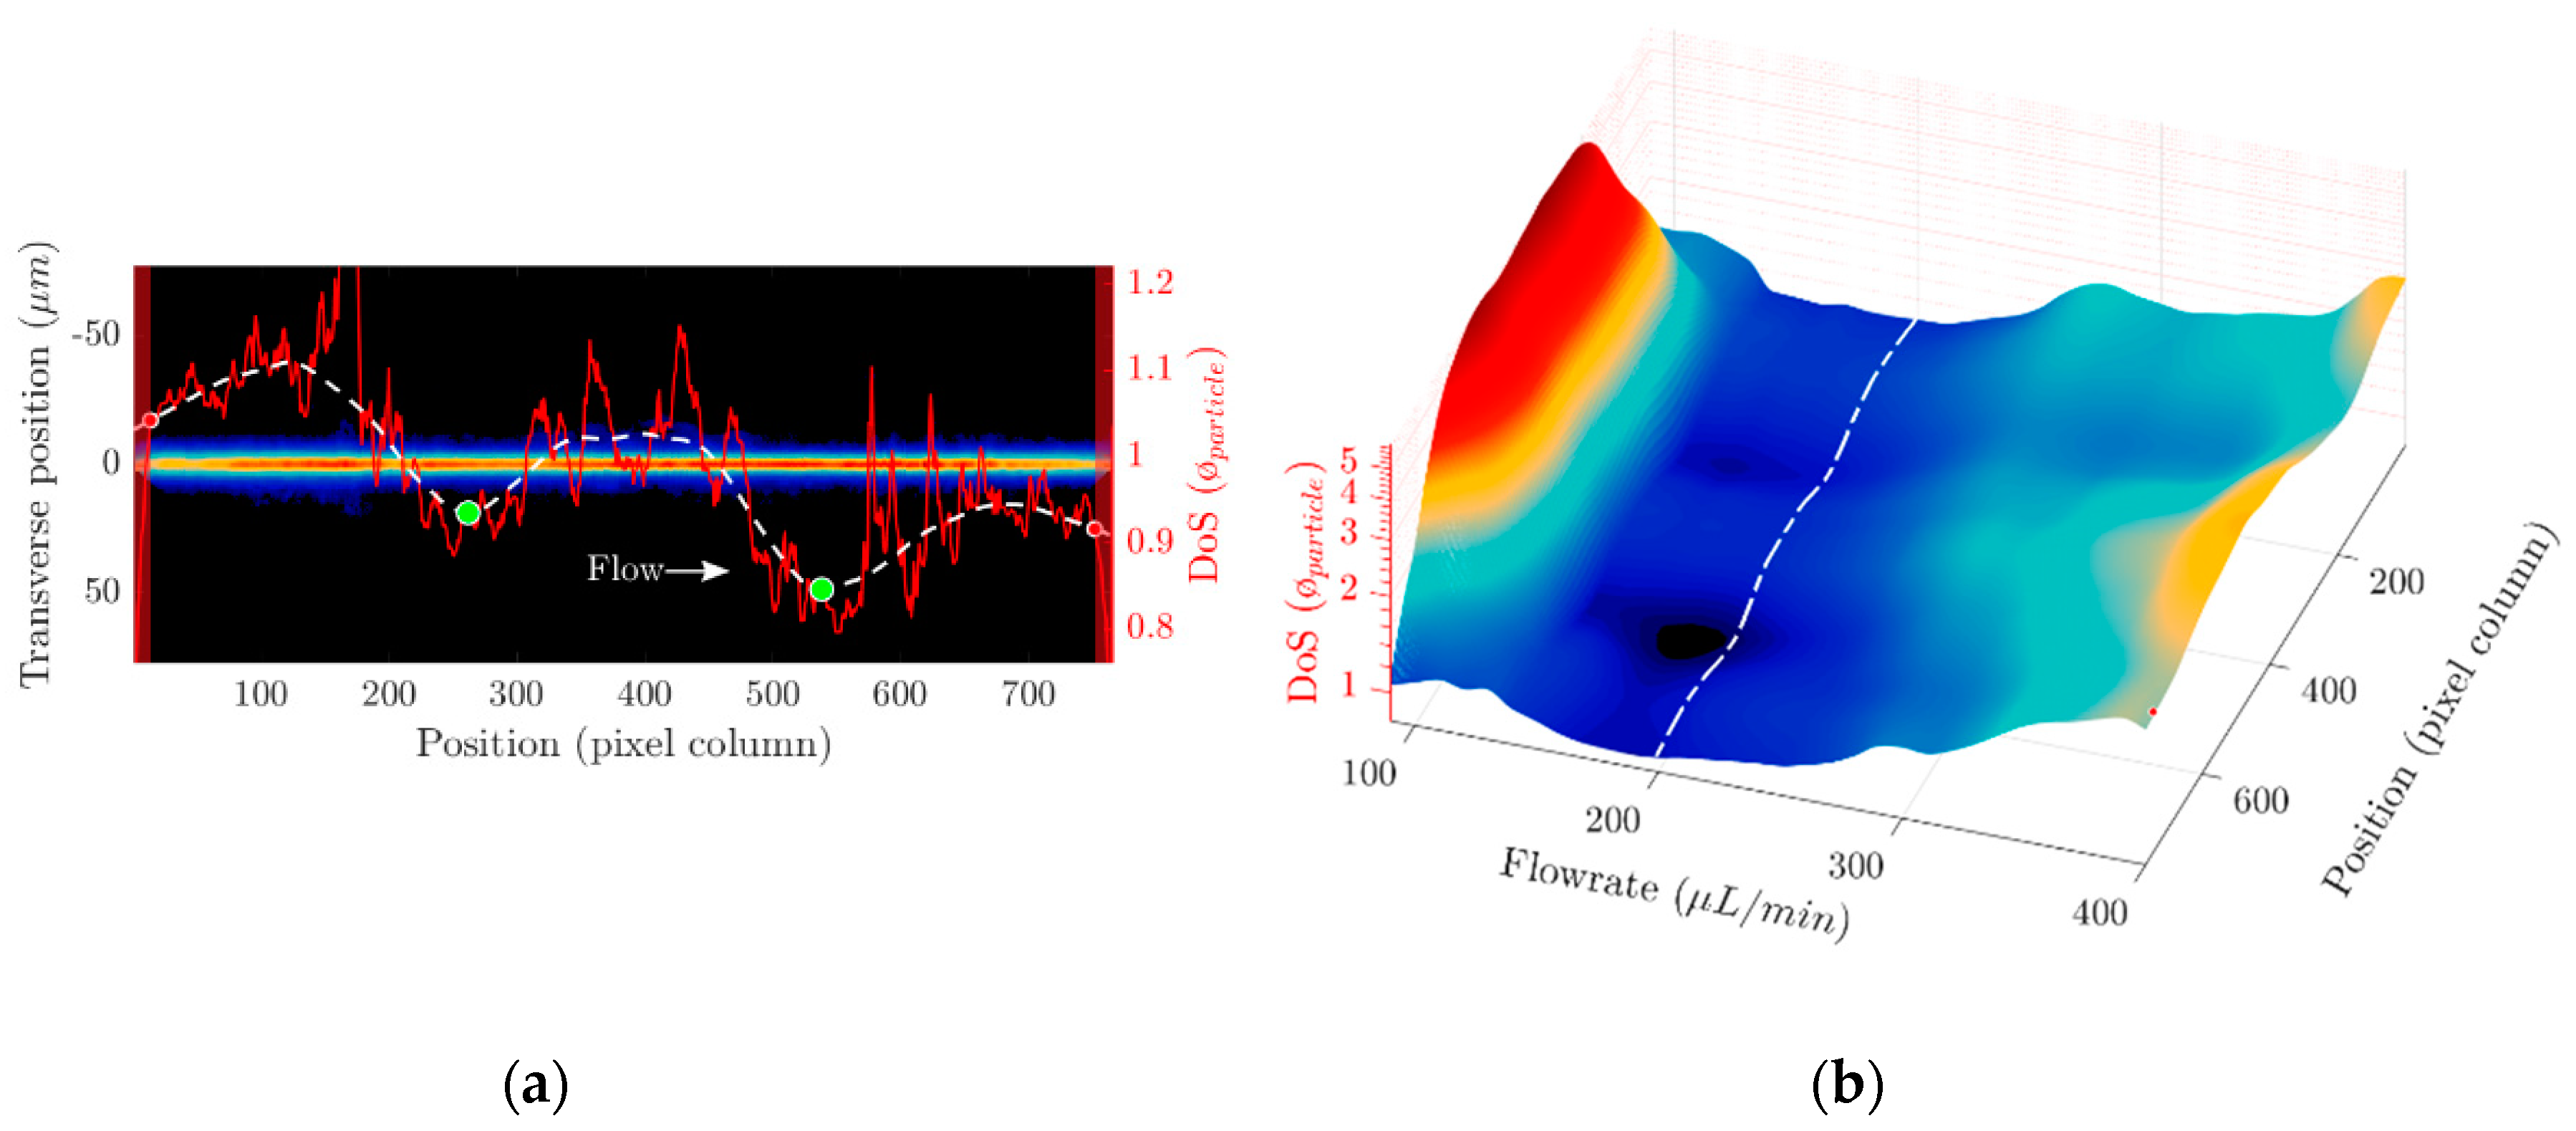
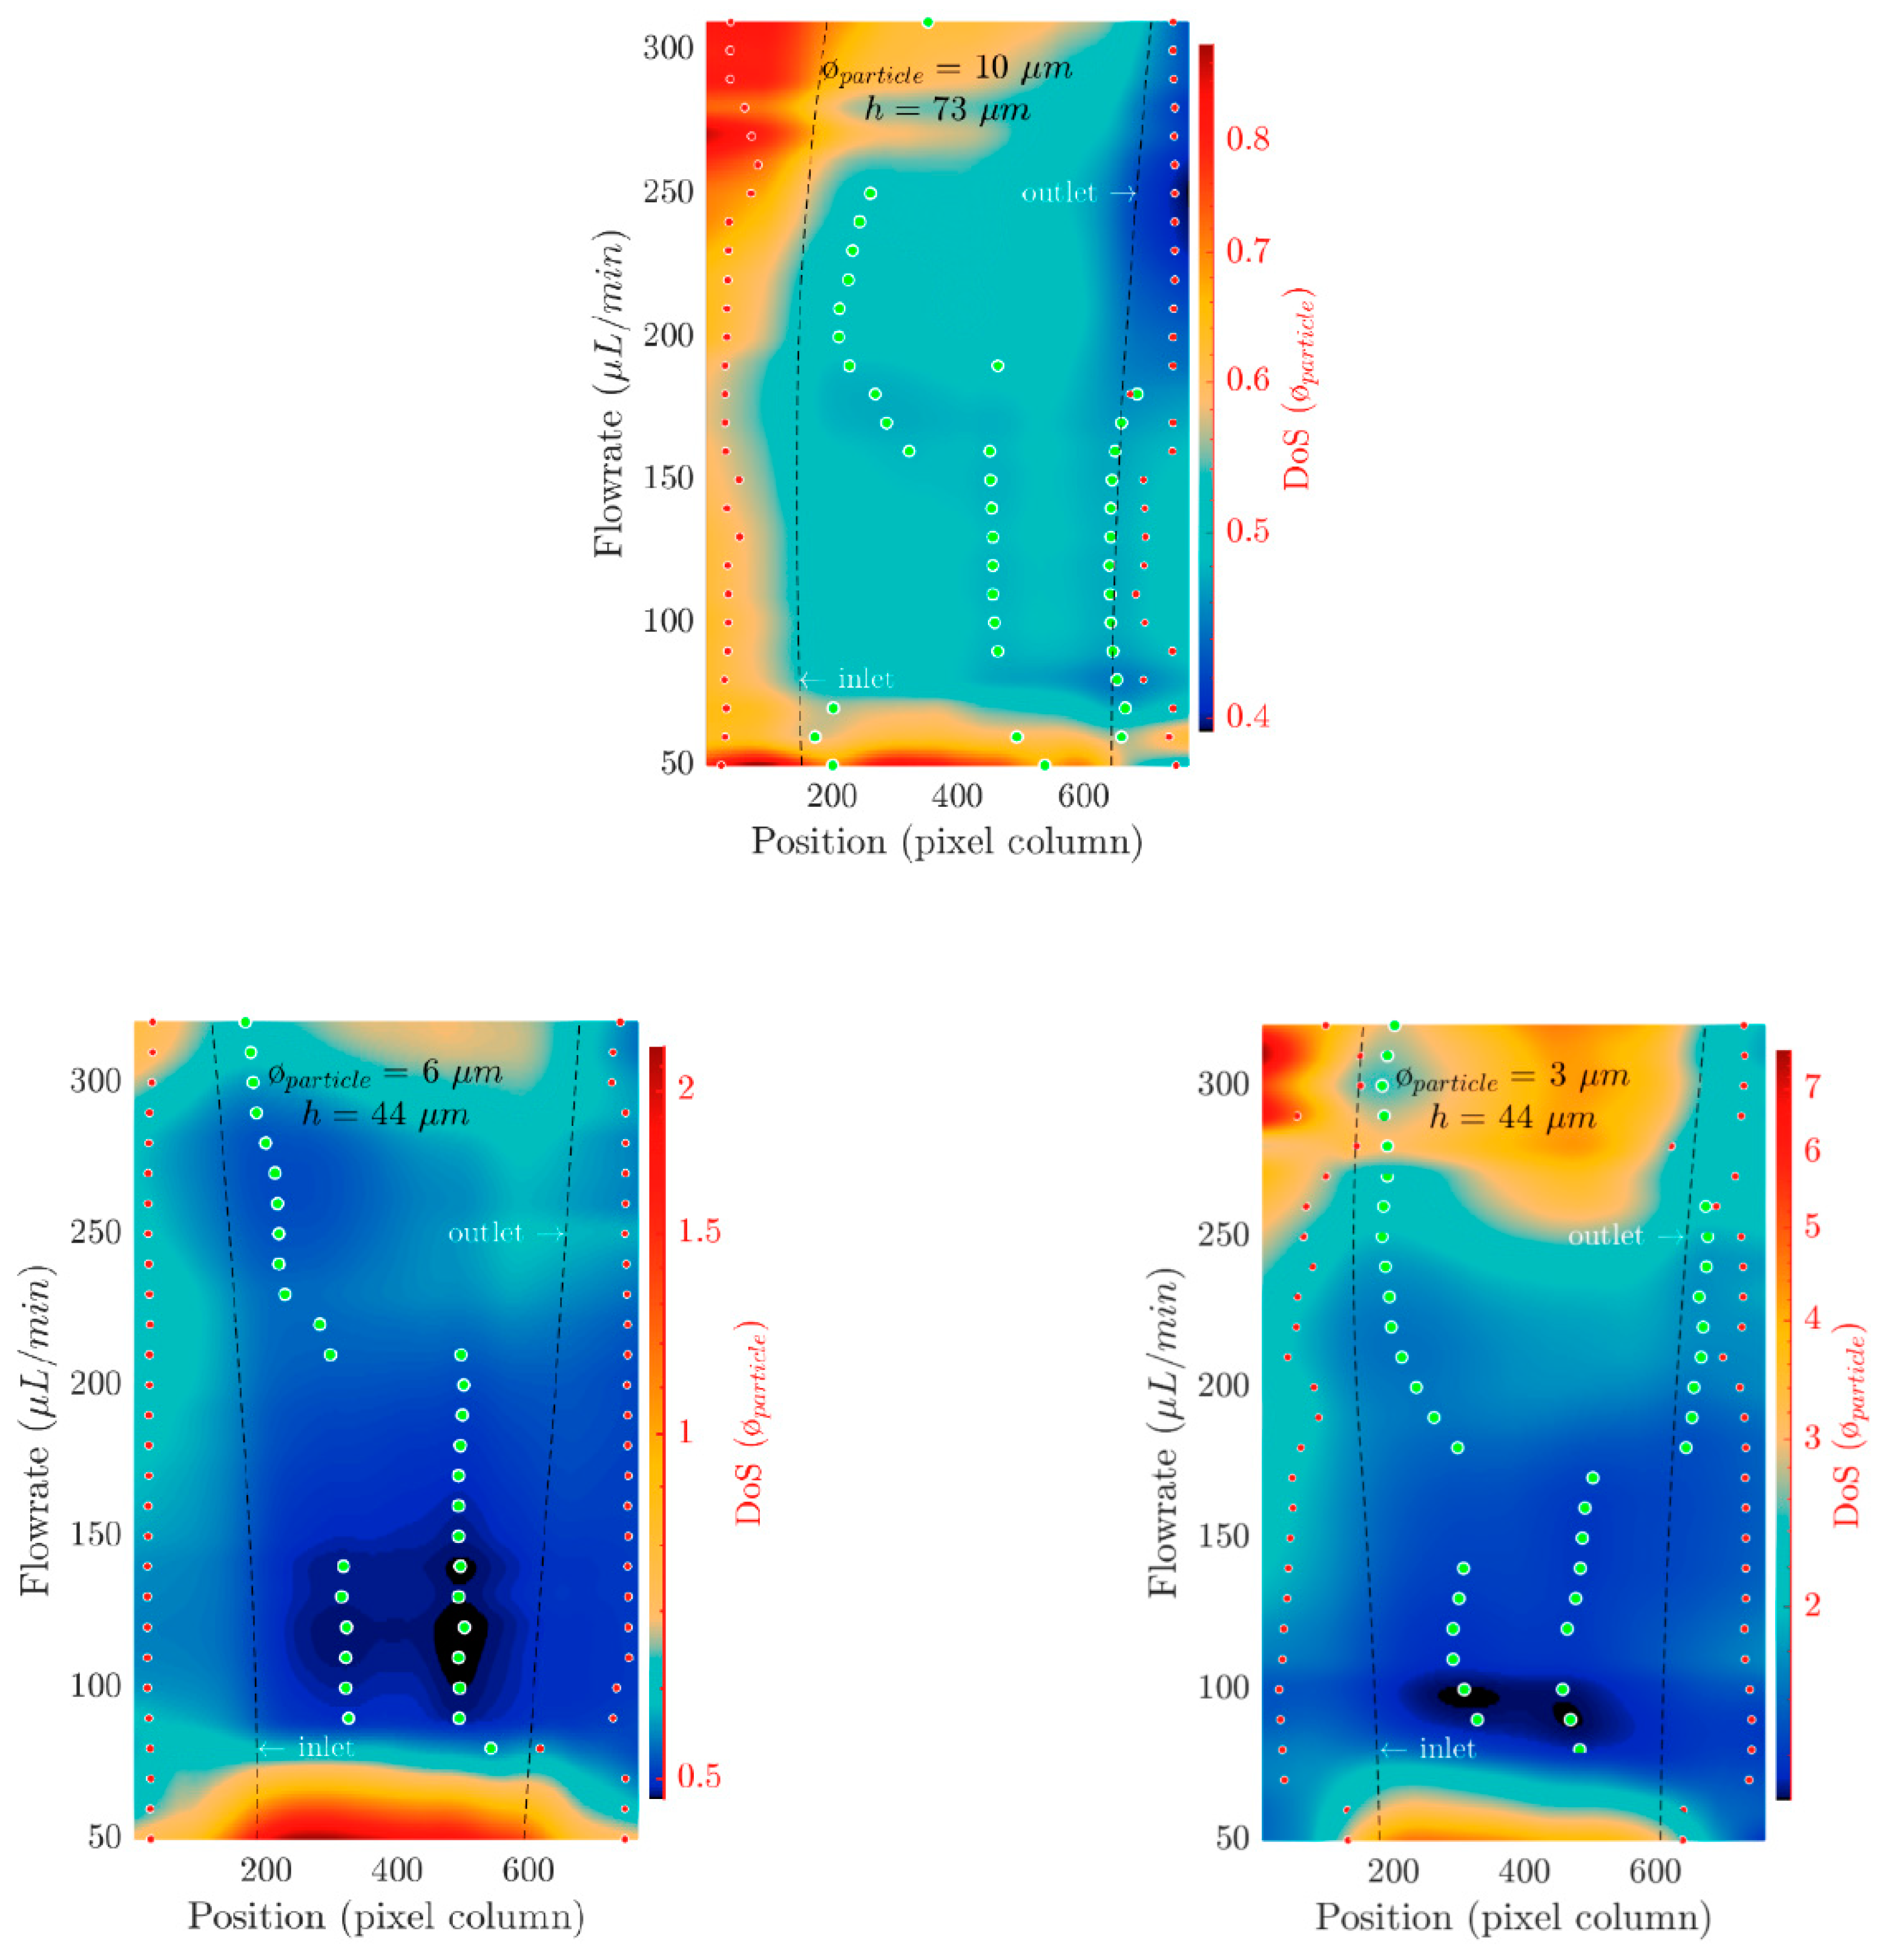
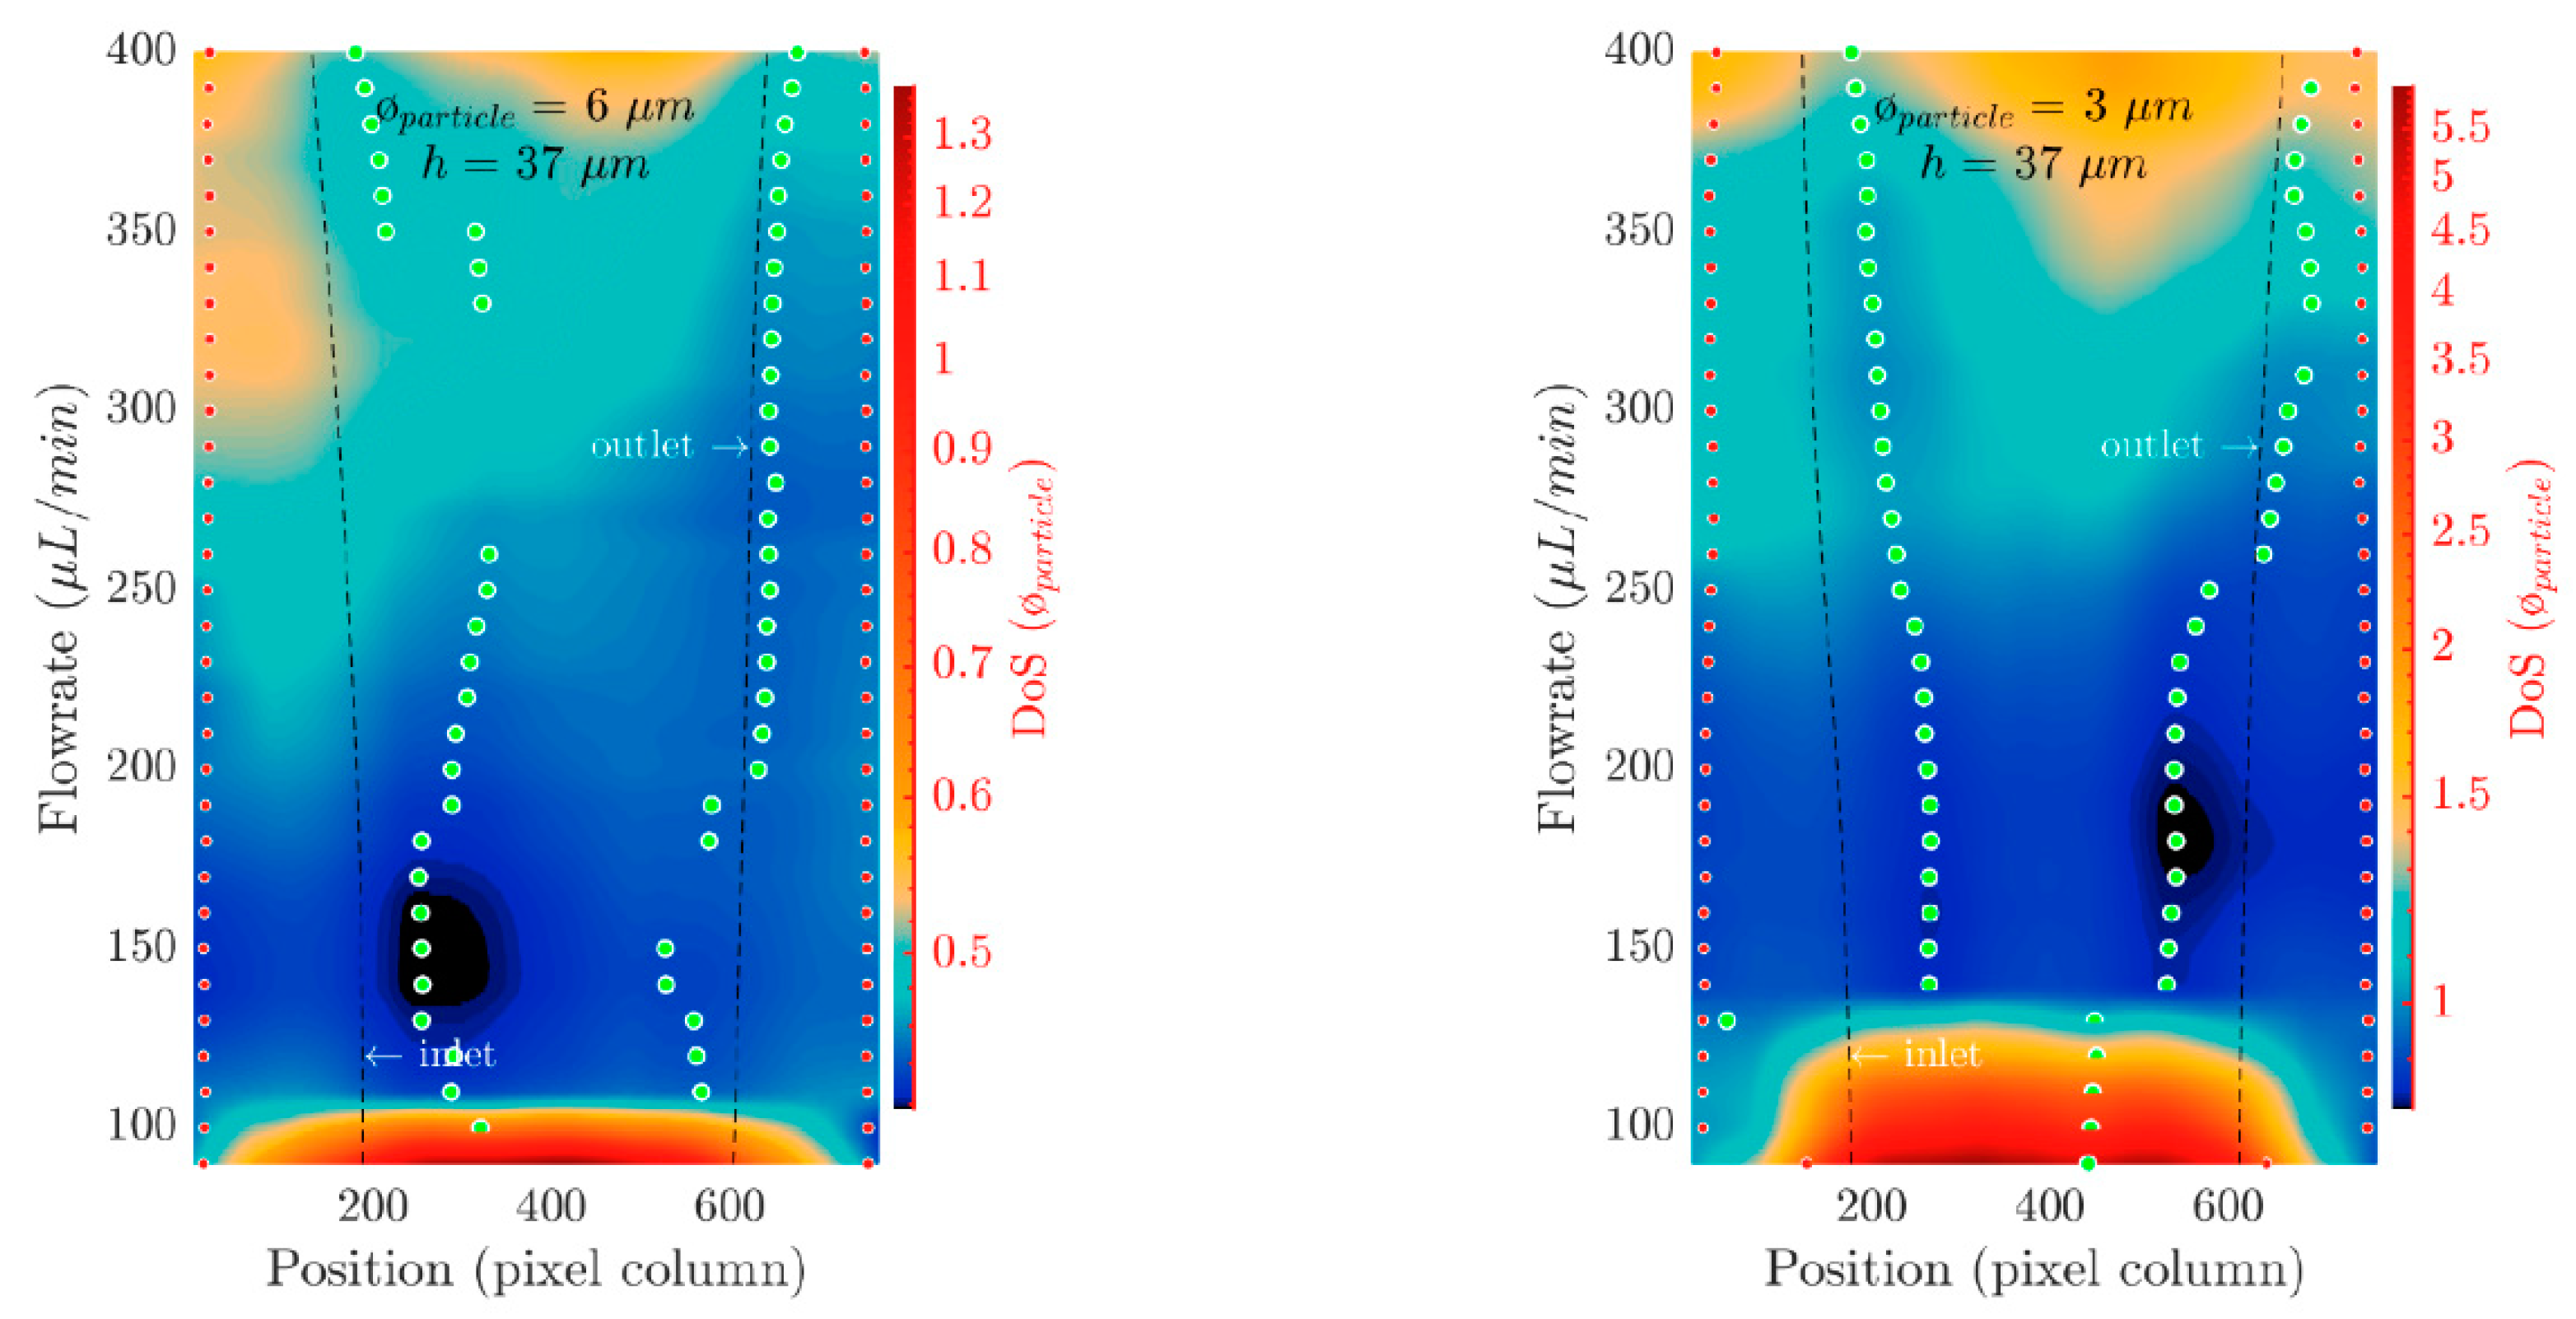
Figure 4 shows the calculated spreading degree maps for different channel heights and particle diameters. Local minima of the DoS, marked with green dots, indicate the positions at which the stream of particles experiences a local tightening; positions preceded and followed by regions with a lesser amount of focusing. In most of the cases, two local minima are found for the degree of spreading along the focused streak of particles at a given flow rate. The positions of the DoS’s local minima vary with the applied flow rate giving rise to stability valleys across the spreading degree map surface indicating the positions where the best local focusing conditions are achieved for a given flow rate. The general trend that can be inferred from the spreading degree maps is that the small curve region outputs smaller degree of spreading coefficients than those produced in the big curve, i.e., the DoS at the inlet (left hand side of the map) is always bigger than that at the outlet (right hand side), implying that the stream of particles defocus at the big turn when its action is considered globally.
The two vertical black dashed lines in the maps indicate the position at which the pseudo trajectory crosses the geometric boundary between the small and the big turns. The fact that these are not completely straight vertical lines is explained by the fact that the pseudo trajectory shape, as well as its relative position with respect to the walls of the channel, changes with the flow rate. These lines are useful to determine which regions of the spreading degree map correspond to the small and big turn regions. In some cases, the local minima (green dots) tend to first develop and remain inside the small curve region up to a given flow rate, beyond which the right local minimum enters the big curve of the serpentine. The left local minima are always contained within the small curve regardless of the particle size and the applied flow rate.
When comparing the focusing behavior of the same particle size for two different channel heights, we see how focusing for 3 and 6   μ m particles is achieved faster in the 44   μ m high channels (especially in the case of 3   μ m particles) as the flow rate is increased (Figure 4b-e). The spreading degree maps for the 3   μ m particle shows how, for the 44   μ m channel, particles are completely focused at around 90   μ L / min whereas focusing occurs at 140   μ L / min for the 37   μ m channel. Still comparing the focusing behavior for a fixed particle size ( 3 or 6   μ m particles), we see how the DoS coefficient happens to reach smaller values (streak of particles more confined) in the 37   μ m channel once focusing conditions are fully achieved, something that appears to be in concordance with its bigger particle confinement ratio value ( λ ( Ø = 3   μ m ,   h = 37   μ m ) = 0.06 and λ ( Ø = 6   μ m ,   h = 37   μ m ) = 0.11 against λ ( Ø = 3   μ m ,   h = 44   μ m ) = 0.05 and λ ( Ø = 6   μ m ,   h = 44   μ m ) = 0.1 ).
It should be noted that, for the 3   μ m particles case, focusing takes place for particle Reynolds values below 1 in the 44   μ m high channel ( R e p ( Q = 130 μ L / min ) 0.16 ) , which is not surprising given that other authors reported the focusing of particles for R e p < 1 as well [36,39]. More remarkable is probably the fact that for the 37   μ m channel R e p ( Q = 130 μ L / min   ) 0.21 , yet full focusing is not quite achieved at this flow rate (Figure 4e). This suggests that state diagrams, the majority of which are expressed in terms of the channel aspect ratio, represent a futile effort in trying to characterize inertial focusing conditions when these are used as a criterion to find a threshold to reach inertial focusing regime. Nonetheless, these results suggest that, while focusing happens at lower flow rates in the 44   μ m channel, this comes at the expense of a less defined streak than the one obtained in the 37   μ m channel. The flow field distribution in the lower aspect ratio channel ( h = 37   μ m , w = 100   μ m ) appears to have a greater influence in keeping particles (specially 3   μ m particles) entrained in the Dean vortices at flow rates for which these same particles are focused in the 44   μ m high channel. Likewise, as the flow rate is increased above the focusing threshold, bigger particle confinement ratios for a given particle size, guarantee a smaller DoS coefficient. Unsurprisingly, 6   μ m particles achieve smaller DoS values (better focusing conditions) than 3   μ m particles for a given channel height. This is mainly due to the strong dependence of the inertial lift force with the particle diameter ( F L i f t a 3 / D h ).
The fact that 3 and 6   μ m particles reach focusing conditions faster in the 44   μ m channel for a given particle size seems to contradict the inertial force ratio argument, R f = F L i f t / F D , given its inverse relationship with the hydraulic diameter cubed, R f ~ 2 r a 2 / D h 3 f ( R e C , x ^ 0 , h / w ) [36], where r is the biggest radius of curvature of the system, a is the particle’s diameter and f ( R e C , x ^ 0 , h / w ) is a coefficient that depends on the channel Reynolds number, the normalized position of the particle in the section of the channel and the aspect ratio of the channel [15,35]. We are assuming here a small variation for the f coefficient between h   =   44   μ m and 37   μ m with respect to the quotient 2 r a 2 / D h 3 ; variations of the normalized equilibrium positions and aspect ratios between each channel height are considered small whereas R e C is the same or varies very little between channel sizes at the applied flow rates. Additionally, f is assumed to vary significantly only beyond a given flow rate which, in the case of a straight channel, happens to lay somewhere around a corresponding channel Reynolds number of R e C   ~   60 [14]. In our case the flow rate at this R e C is around Q   =   130   μ L / min for both the 37 and the 44   μ m high channels. If R f magnitude is to be taken as a threshold for inertial focusing to occur, it would be expected that particles would focus faster (as the flow rate increases) in the 37   μ m channel, again, assuming that the coefficient value f does not change significantly between each channel height and that it remains approximately constant below Q   =   130   μ L / min . Another aspect in which these results reveal an inconsistency with the current theory is in the fact that focusing of 3   μ m particles takes place at smaller values than the set threshold of the inertial force ratio, R f   ~   0.08 [36], R f ( Ø =   3   μ m ,   h = 44   μ m )   ~   0.022 .

4.2. Pathlines through Vortices’ Centerlines

As already pointed out in our previous study [
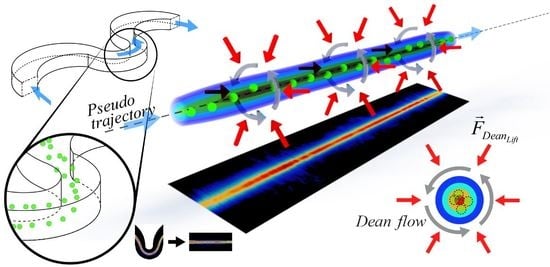
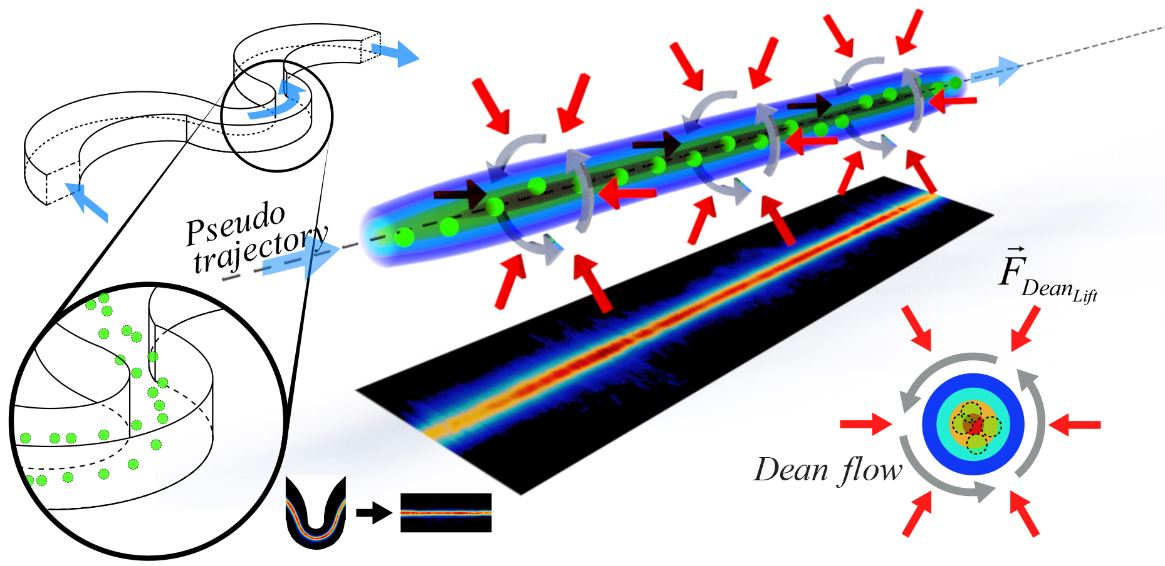
49], a joint analysis of fluid dynamics simulations and inertial focusing experimental results, reveals a strong tendency of the focused stream of particles to translate through Dean vortices’ centerlines. This behavior is maintained for a wide range of flow rates as the streak of particles moves towards the outer wall of the small turn following the vortices’ centerlines as the Dean number (flow rate) increased. 
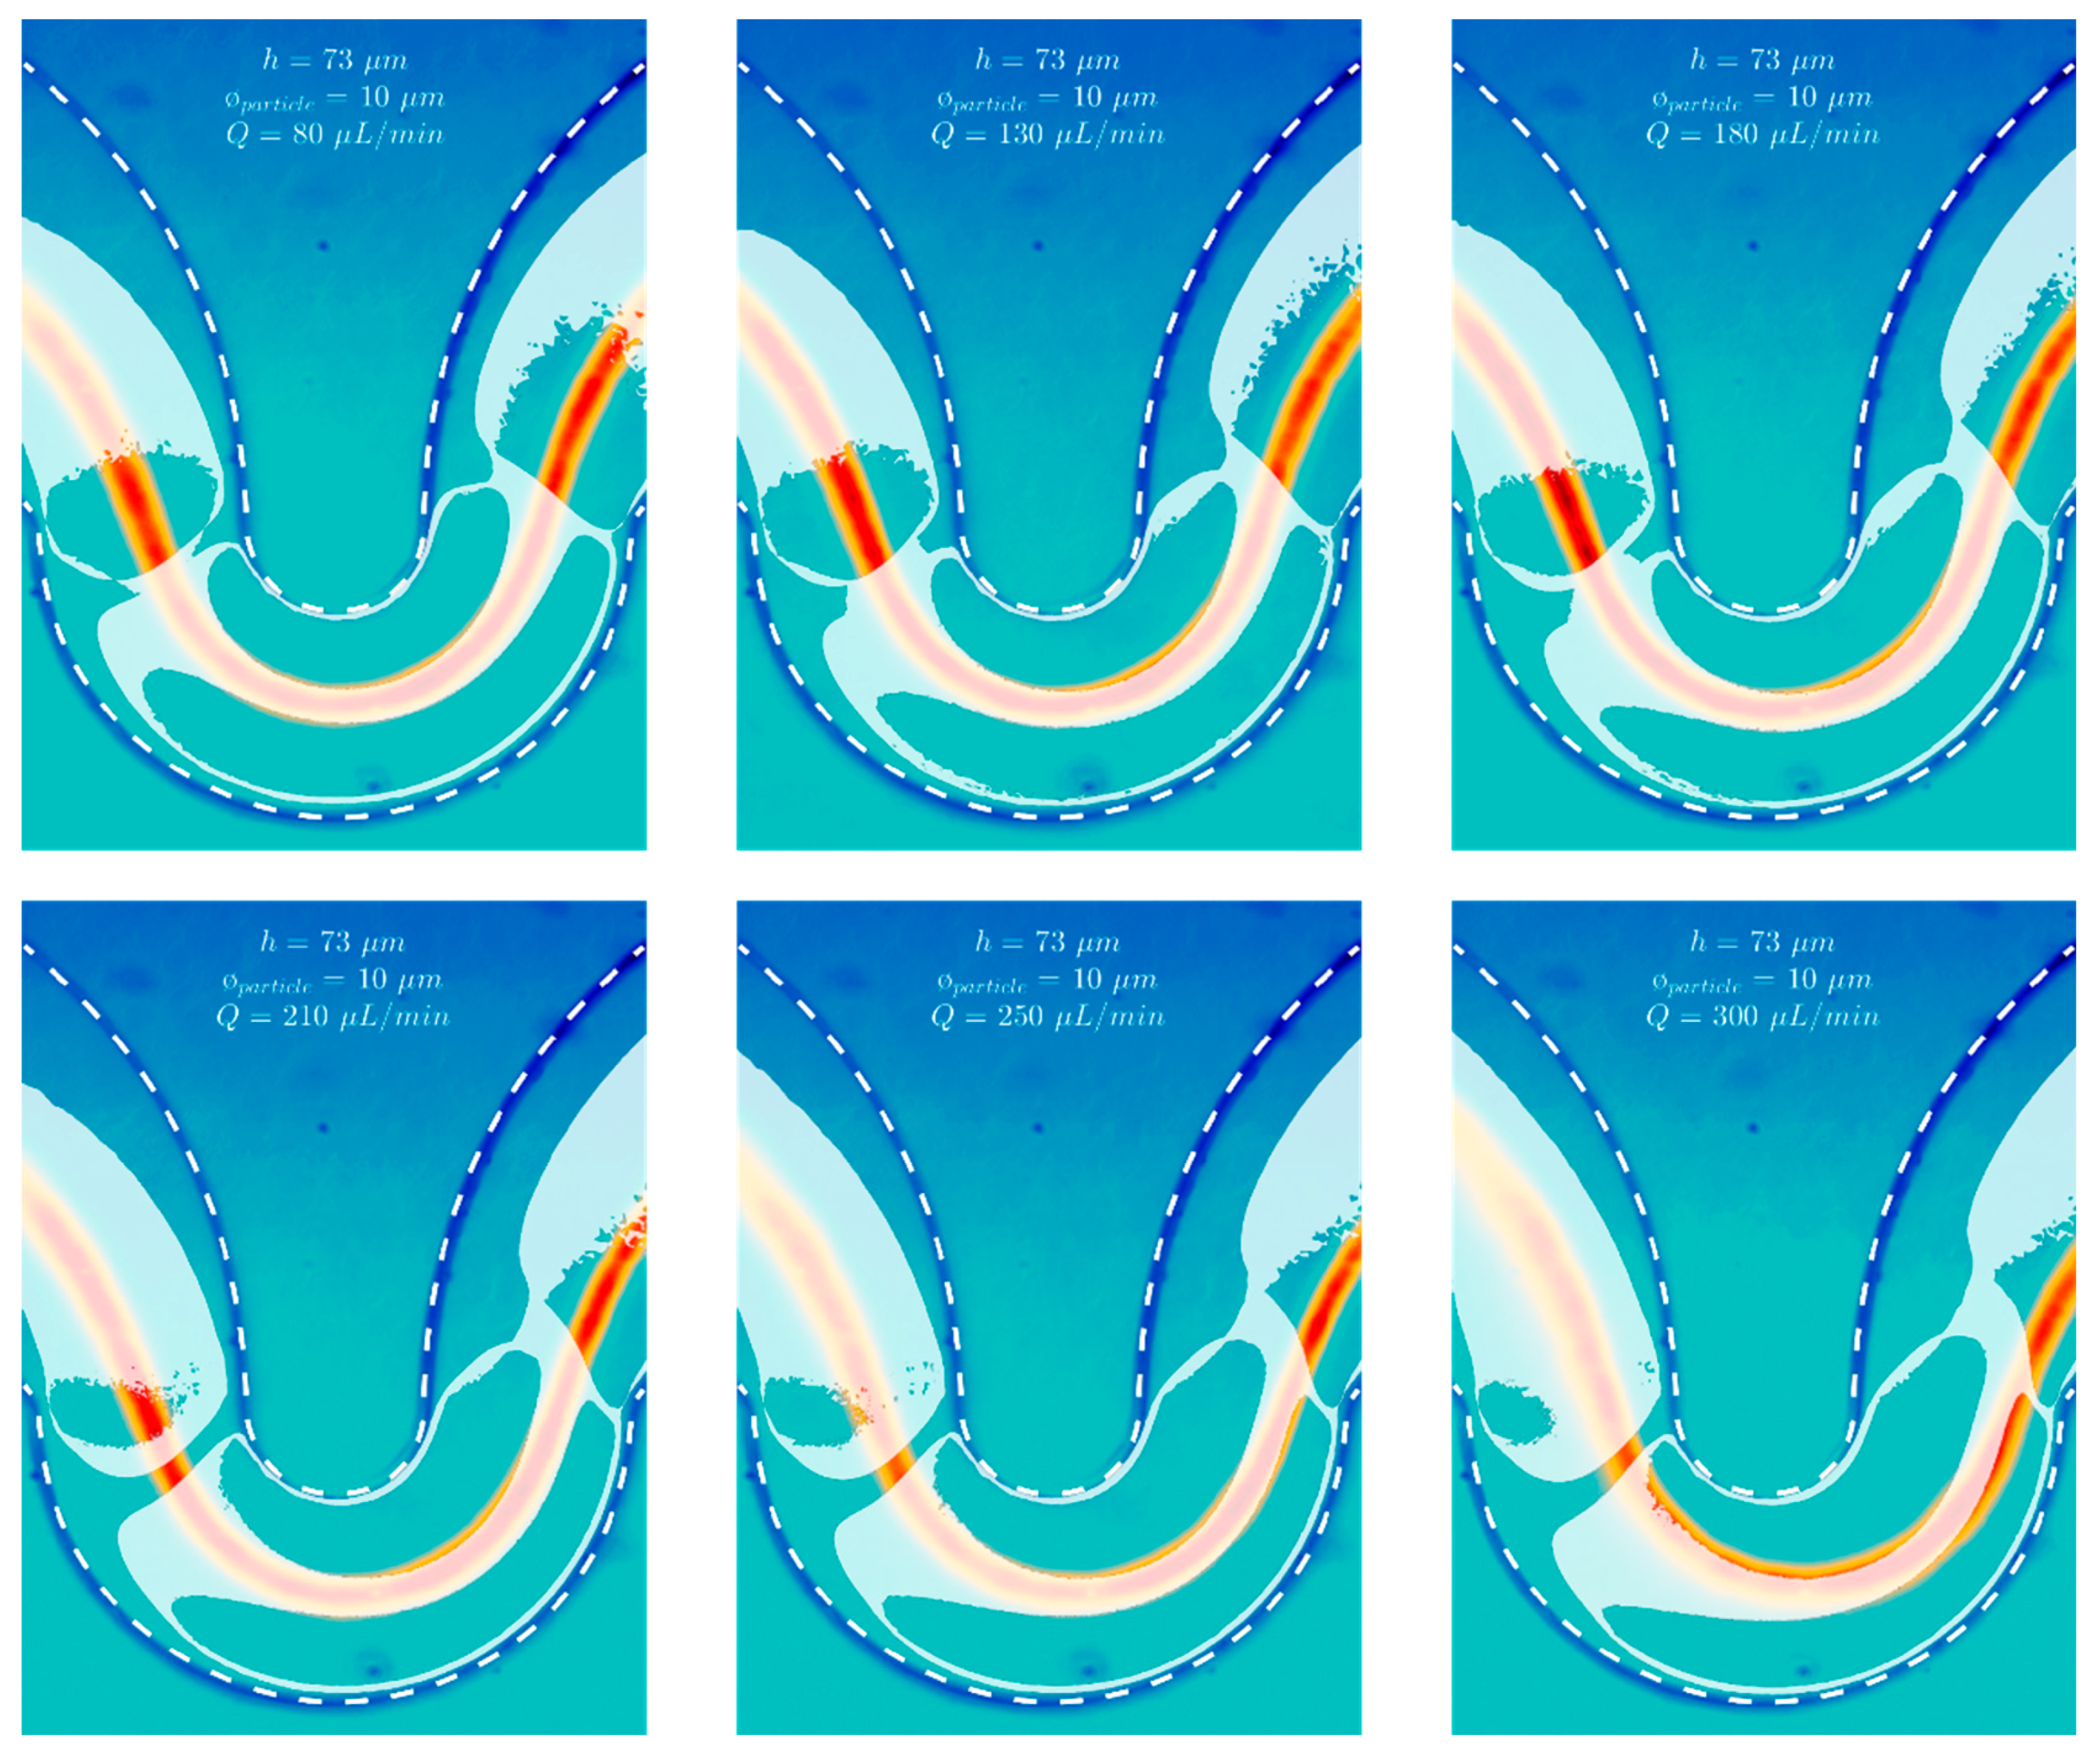
Figure 5 illustrates, from a zenithal view, how the fluorescence streaks of particles along the small curve approximately coincide with the vortices’ centerlines in the fluid dynamics (CFD) simulation—a computer algorithm that solves Navier–Stokes equations—as the flow rate varied and the central region of the vortices evolve in shape accordingly. The fluid-structure interaction (FSI) simulation, which incorporates the effects of the perturbed flow field through its interaction with the particle —coupled solving of Navier–Stokes and structural mechanics equations—shows how the Ø   = 10   μ m particle is contained at all times at the center of the upper vortex as it moves along the small curve (Figure 6). These simulations were carried out in COMSOL (version 5.0, COMSOL Inc., Stockholm, Sweden).
The lateral displacement of a focused streak of particles in curved channels has already been reported in previous studies as either the flow rate is varied or the curvature of the channels changes along the pathlines as in a spiral [21,37,50]. It is known that in our situation, when the focused streak is located in the central region of a curved channel, far from the lateral walls, said streak is in fact composed by two trains of particles mirrored in z , as opposed to the single streak that normally develops in the nearby region of the inner wall [21,37,38,50]. This situation implies that particles cannot occupy the half-height region of the channel, where Dean flows are stronger [37,51,52,53]. Instead, it is assumed that they will be located at regions with small Dean flows, specially as the flow rate is increased [38]. In all studied cases in the literature, however, the idea that Dean drag/shear gradient lift force balance is a determinant factor is an extensively employed argument when trying to explain an unify all the physical processes that describe the focusing conditions of particles as the parameters of the problem change. This fact implies that, while working under inertial focusing conditions, particles being held in equilibrium in a stable trajectory inside curved channels are under the influence of secondary flows so that a net force (Dean drag) counteracts inertial lift forces.
The emergence of two stable trajectories, mirrored in z , in the 73   μ m high serpentine [49] supports the simulation results since each trajectory can be assigned to the upper and lower counter-rotating Dean vortices’ center. This fact suggests that particles in curved channels, focused under inertial focusing mechanisms in the exposed conditions, are partially shielded against the influence of Dean drag because they translate through regions with small net local lateral flows, the centerlines of Dean vortices [49,53]. A direct implication of the prior statement is that the influence of Dean flow and its contribution to the modification of the focusing positions is minimal; the vortices’ centers play a decisive role in the particles’ pathline, whose development is not simply determined by the balance of two forces (shear gradient-induced lift and Dean drag) acting simultaneously on the particles.
The geometry of the channels, with its corresponding Dean vortices centerlines, will dictate the approximate trajectory of the resulting streaklines of particles as inertial focusing conditions are achieved. The natural question that arises is that if it is just due to coincidence that particles translate through centerlines of the vortices or if it may exist in some physical phenomena which imposes that such behavior must manifest if inertial focusing conditions are to be achieved.

4.3. The Origin of the Dean-Induced Inertial Lift Force

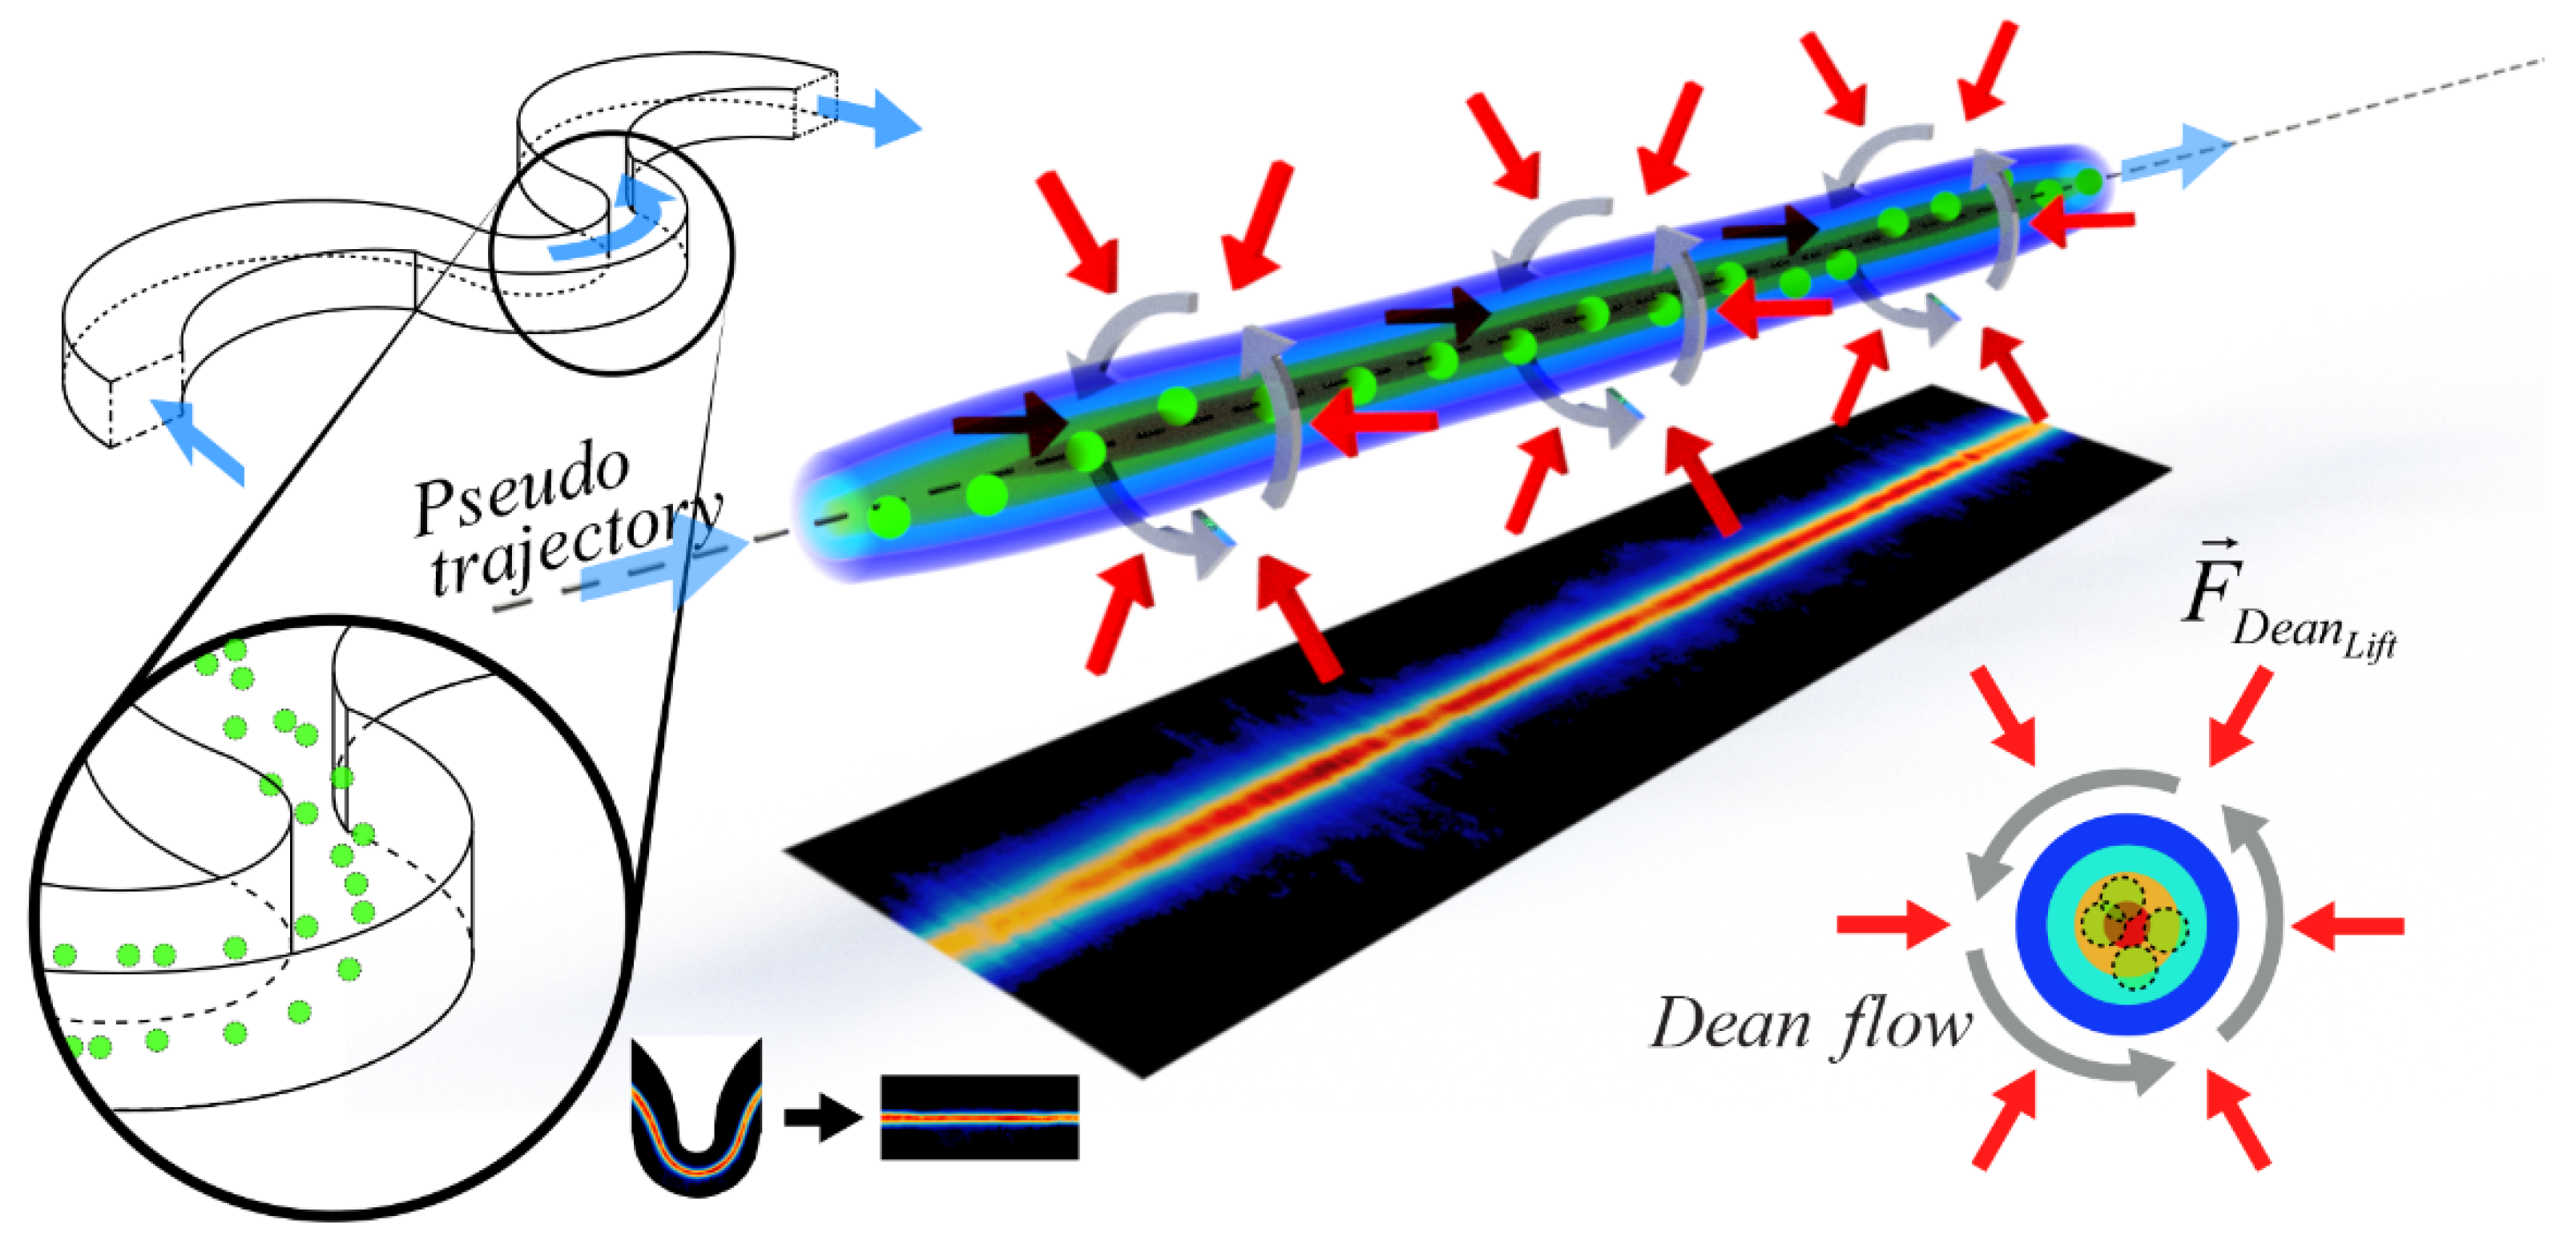
Given that in this approach the Dean drag contribution to inertial focusing is being relativized, the emergence of a force, whose existence has never been postulated, to balance conventional Dean drag and inertial forces is necessary in order to take account for the modified focusing positions in the serpentine with respect to the rectangular section straight channel case. We speculate about the possibility that regular lift forces, that stem from the parabolic velocity profile in the streamwise direction, may have a Dean-induced counterpart in curved channels whose action would explain the apparent coincidence that stable inertial focusing equilibrium trajectories approximately match Dean vortices’ centerlines. The origin of this force, that would act over the particles in superposition with conventional lift forces, could be attributed to the velocity profile of the secondary flows and its finite shear gradient.
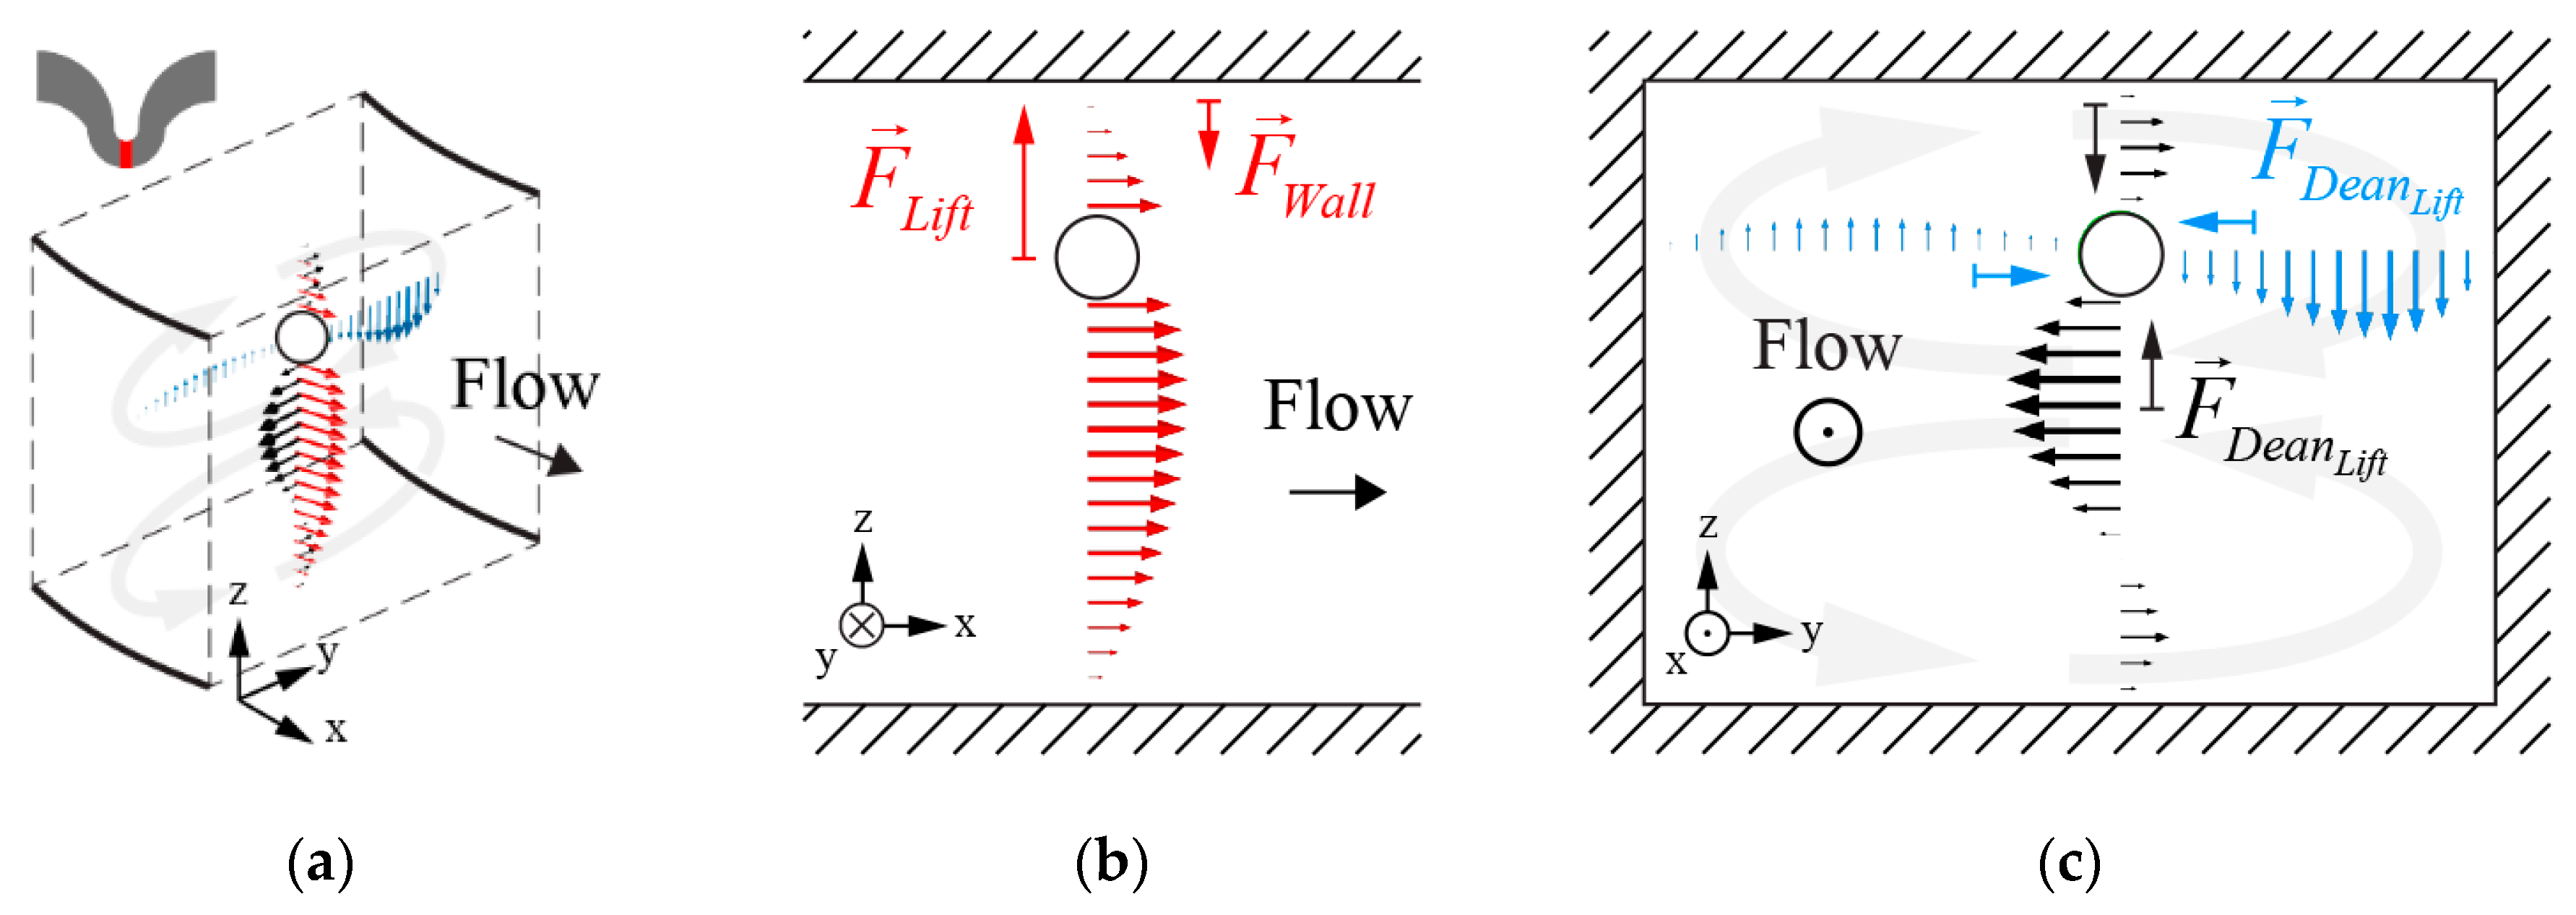
Due to the characteristic velocity profile of the Dean flow in a section of the channel, with an inflexion point between the inwards/outwards (upwards/downwards) moving lateral flow, and, by inferring the net sign of the product between the shear rate and its gradient along a radial direction [17,41,54], it is expected that this Dean-induced lift force is always perpendicularly oriented to the main flow and directed towards the center of the vortex (Figure 7). This way, the vortical structure of the Dean pattern, perturbs the trajectory of the particles not only because of the imparted drag but also because of the inertial effects it induces to the particles. This is a similar effect to the one that takes place in an expansion/contraction channel, in which particles translate through streamlines under the influence of a vortex (and, hence, the shear gradient of its flow profile) that develops in an expanded chamber in the vicinity of the main channel [55,56,57]. Like in the case of wall effect and shear-gradient lift forces, this Dean-induced inertial lift is expected to be stronger in the regions of the serpentine where velocity gradients are stronger.
CFD simulations reveal that under some circumstances, particularly in the small curve at low flow rates, the position of the centerlines of the vortices (represented as isosurfaces in Figure 5) approximately coincide with the maximum streamwise velocity magnitude streamlines—the vortex centerlines and maximum velocity points overlap—. As the flow rate is increased, the paths of the centerlines and the streamlines start to behave differently. The tendency of the focused particles is, however, to follow the centerlines of the vortices as the flow rate is varied up to a certain limit. Although the shear gradient-induced lift can be seen as the dominant contribution to inertial focusing at low flow rates, i.e., a particle’s path follows the region with the strongest (vertical) shear gradient (similarly to what happens in a low aspect ratio straight channel), it lacks an additional mechanism (which can be provided by the proposed Dean-induced lift force) to explain the seeming affinity of focused particles to remain at the center of the vortices (as shown in the FSI simulation with Ø   = 10   μ m particles). In the general case, when the streaklines do not necessarily coincide with the region of maximum vertical shear rate, the action of a Dean-related force must be considered.
In order to quantify the strength of the proposed Dean-induced lift force, named as F D e a n L i f t , it can be noted that a theoretically deduced formula for the lift forces for small Reynolds number in a two dimensional parabolic shear flow of the form 𝑣 = α + β z + γ z 2 is
F L i f t = F w + F s = ρ U m a x 2 a 4 / D h 2 ( β 2 G 1 + β γ G 2 )
where ρ is the density of the fluid, U m a x is the maximum velocity of the fluid, a is the particle diameter, D h is the hydraulic diameter, β and γ are the shear rate and the shear gradient (second derivative) of the velocity profile and G 1 and G 2 are parameters that modulate the strength of the wall effect, F w , and shear gradient-induced lift, F s , respectively, according to the position of a particle in the section of a channel [54]. β , G 1 and G 2 depend on a parameter s , the normalized position of the particle’s center with respect to the channel, so that its position directly influences the value of F L i f t . According to Equation 3 convention, the velocity profile is expressed with respect to a frame of reference whose origin is located at the particle’s center. In addition, by convention, a positive force points towards the direction of increasing s and vice versa.
Equation 3 was derived under the assumption that a / D h 1 and R e 1 . When these limitations are removed (by means of numerical calculations for instance), the magnitude of the lift force changes dramatically although the shape of the theoretically deduced formula is preserved [17]. This will serve us to prove that the magnitude of the proposed lift force, that emerges as a result of the Dean flow profile, is indeed strong enough to be considered during inertial focusing effects when compared to the conventional lift force magnitude caused by the streamwise parabolic velocity profile. We used the same conditions employed during the FSI simulation, for whom inertial focusing is known to occur in the real experiment, i.e., a channel with 73   μ m × 100   μ m section and a flow rate of Q = 130   μ L / min . From these, β and γ parameters are obtained from the flow profiles and the magnitude of F D e a n L i f t with respect to F L i f t can be estimated.
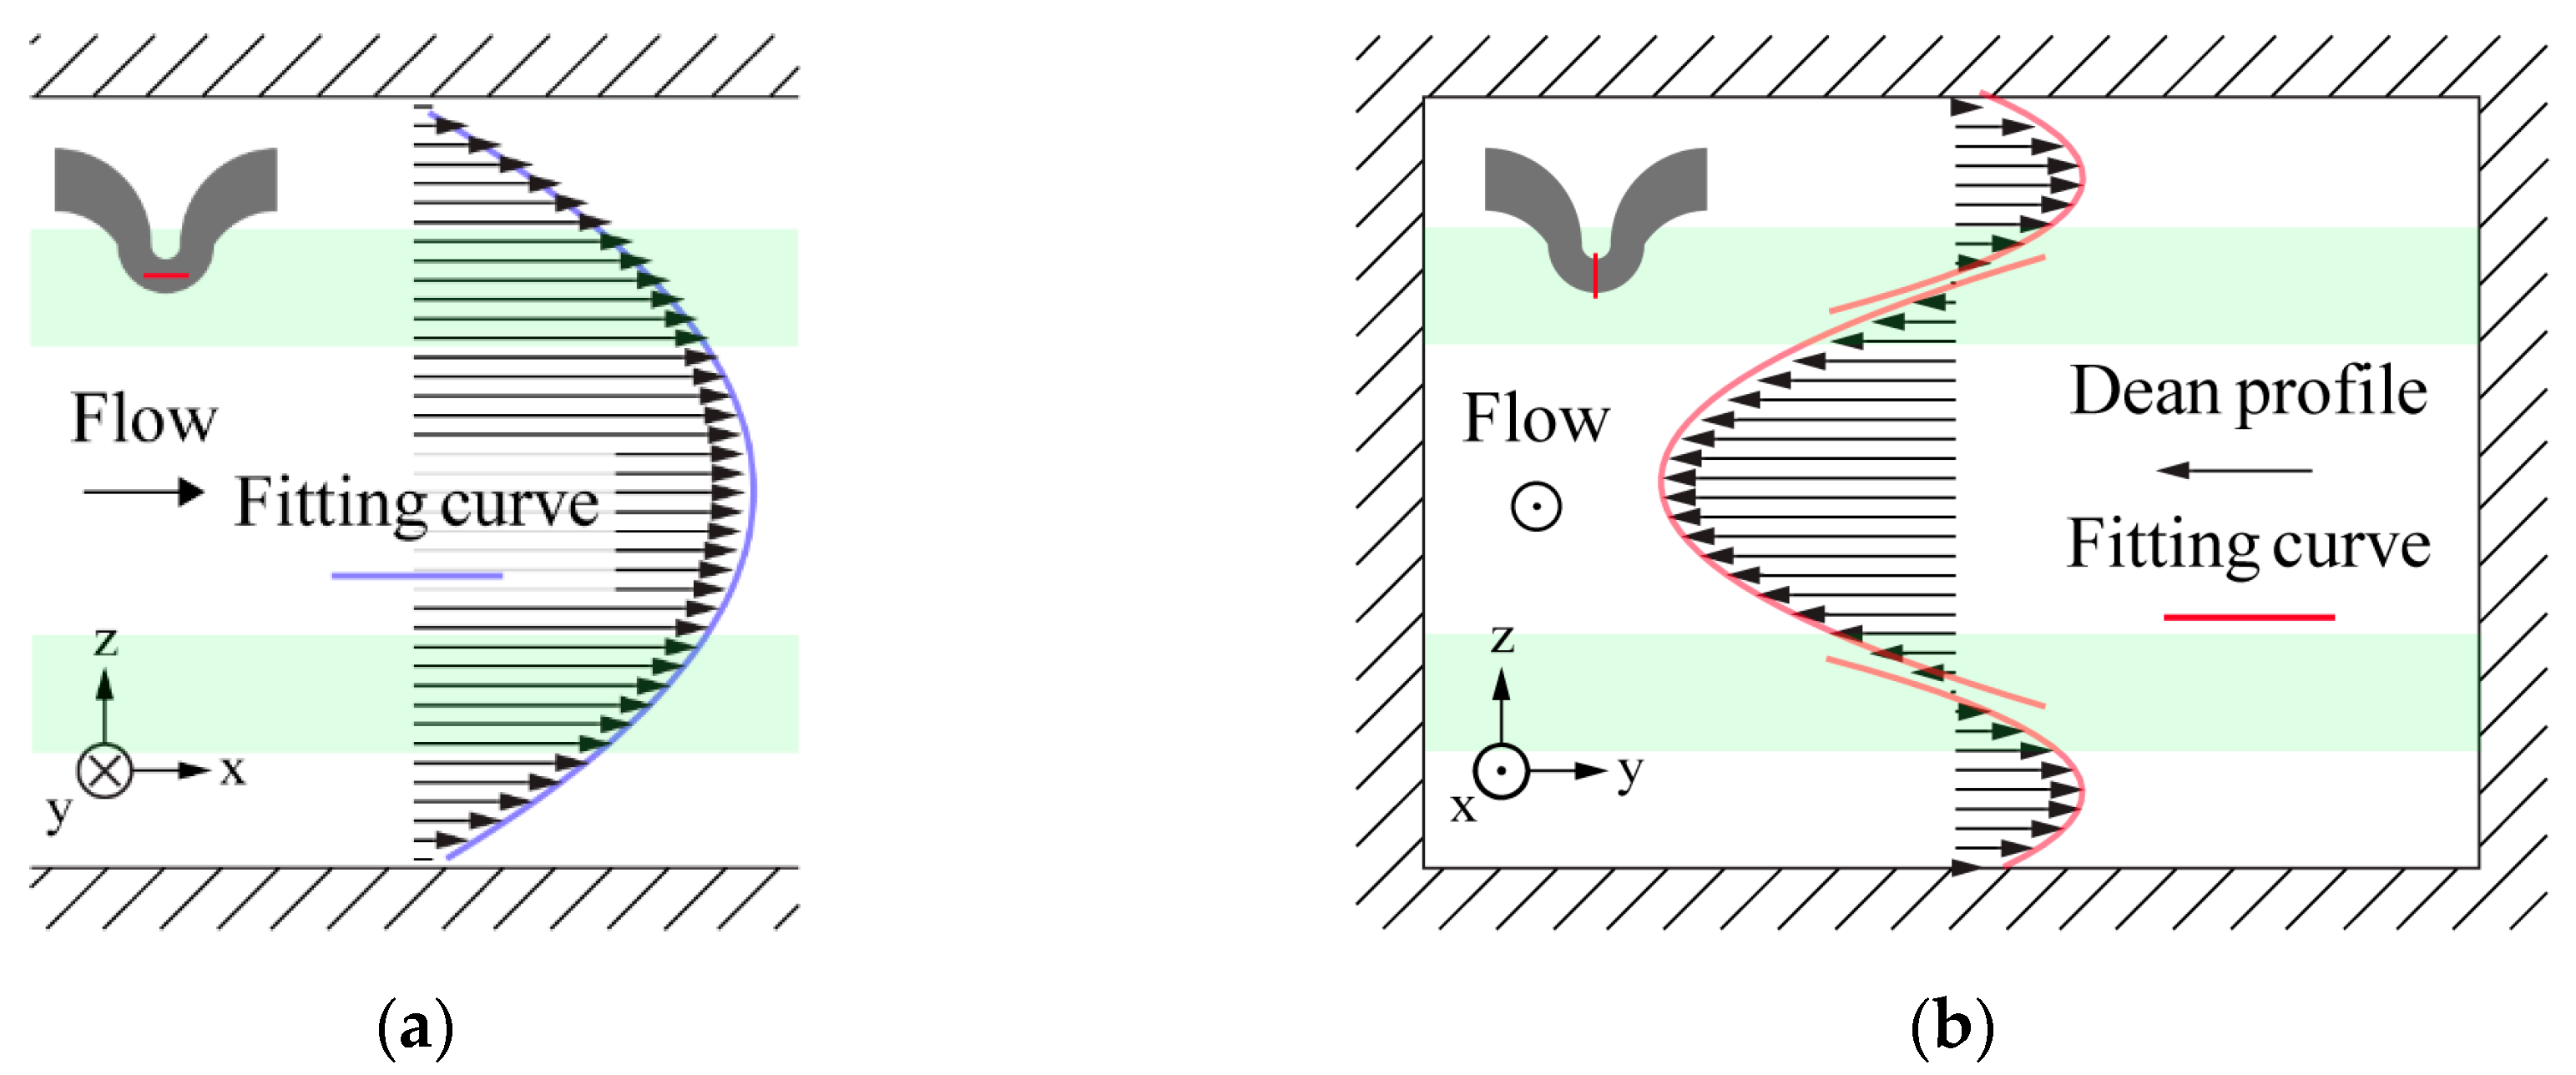
Figure 8 reveals how the velocity profiles from the opposing inwards and outwards Dean flows can be approximated around the maxima by a parabolic profile, which guarantees a proper adoption of F w and F s from Equation 3 to obtain an estimate of the Dean-induced lift force magnitude at least at regions away from the vortices centers (where the profile has an inflexion point).
Fitting results for the simulation of the profile from Figure 8 are shown in Figure 9. The values of the β coefficients for the streamwise and transverse (Dean flow) profiles, which were evaluated across the channel height, can generally be expressed as β ( s ) = A + B s , where s is the normalized particle height in the channel. The values for the γ coefficients, which are constant, were γ ~ 4 , γ D e a n o u t w a r d s ~ 16 and γ D e a n i n w a r d s ~ 70 . The term i n w a r d s / o u t w a r d s makes reference to transverse flows moving to/away from the center of curvature of the small curve. It should be noted that the outwards Dean flow was defined at 0.23 < s < 0.77 , the region bounded by null transverse velocities (Figure 9b).
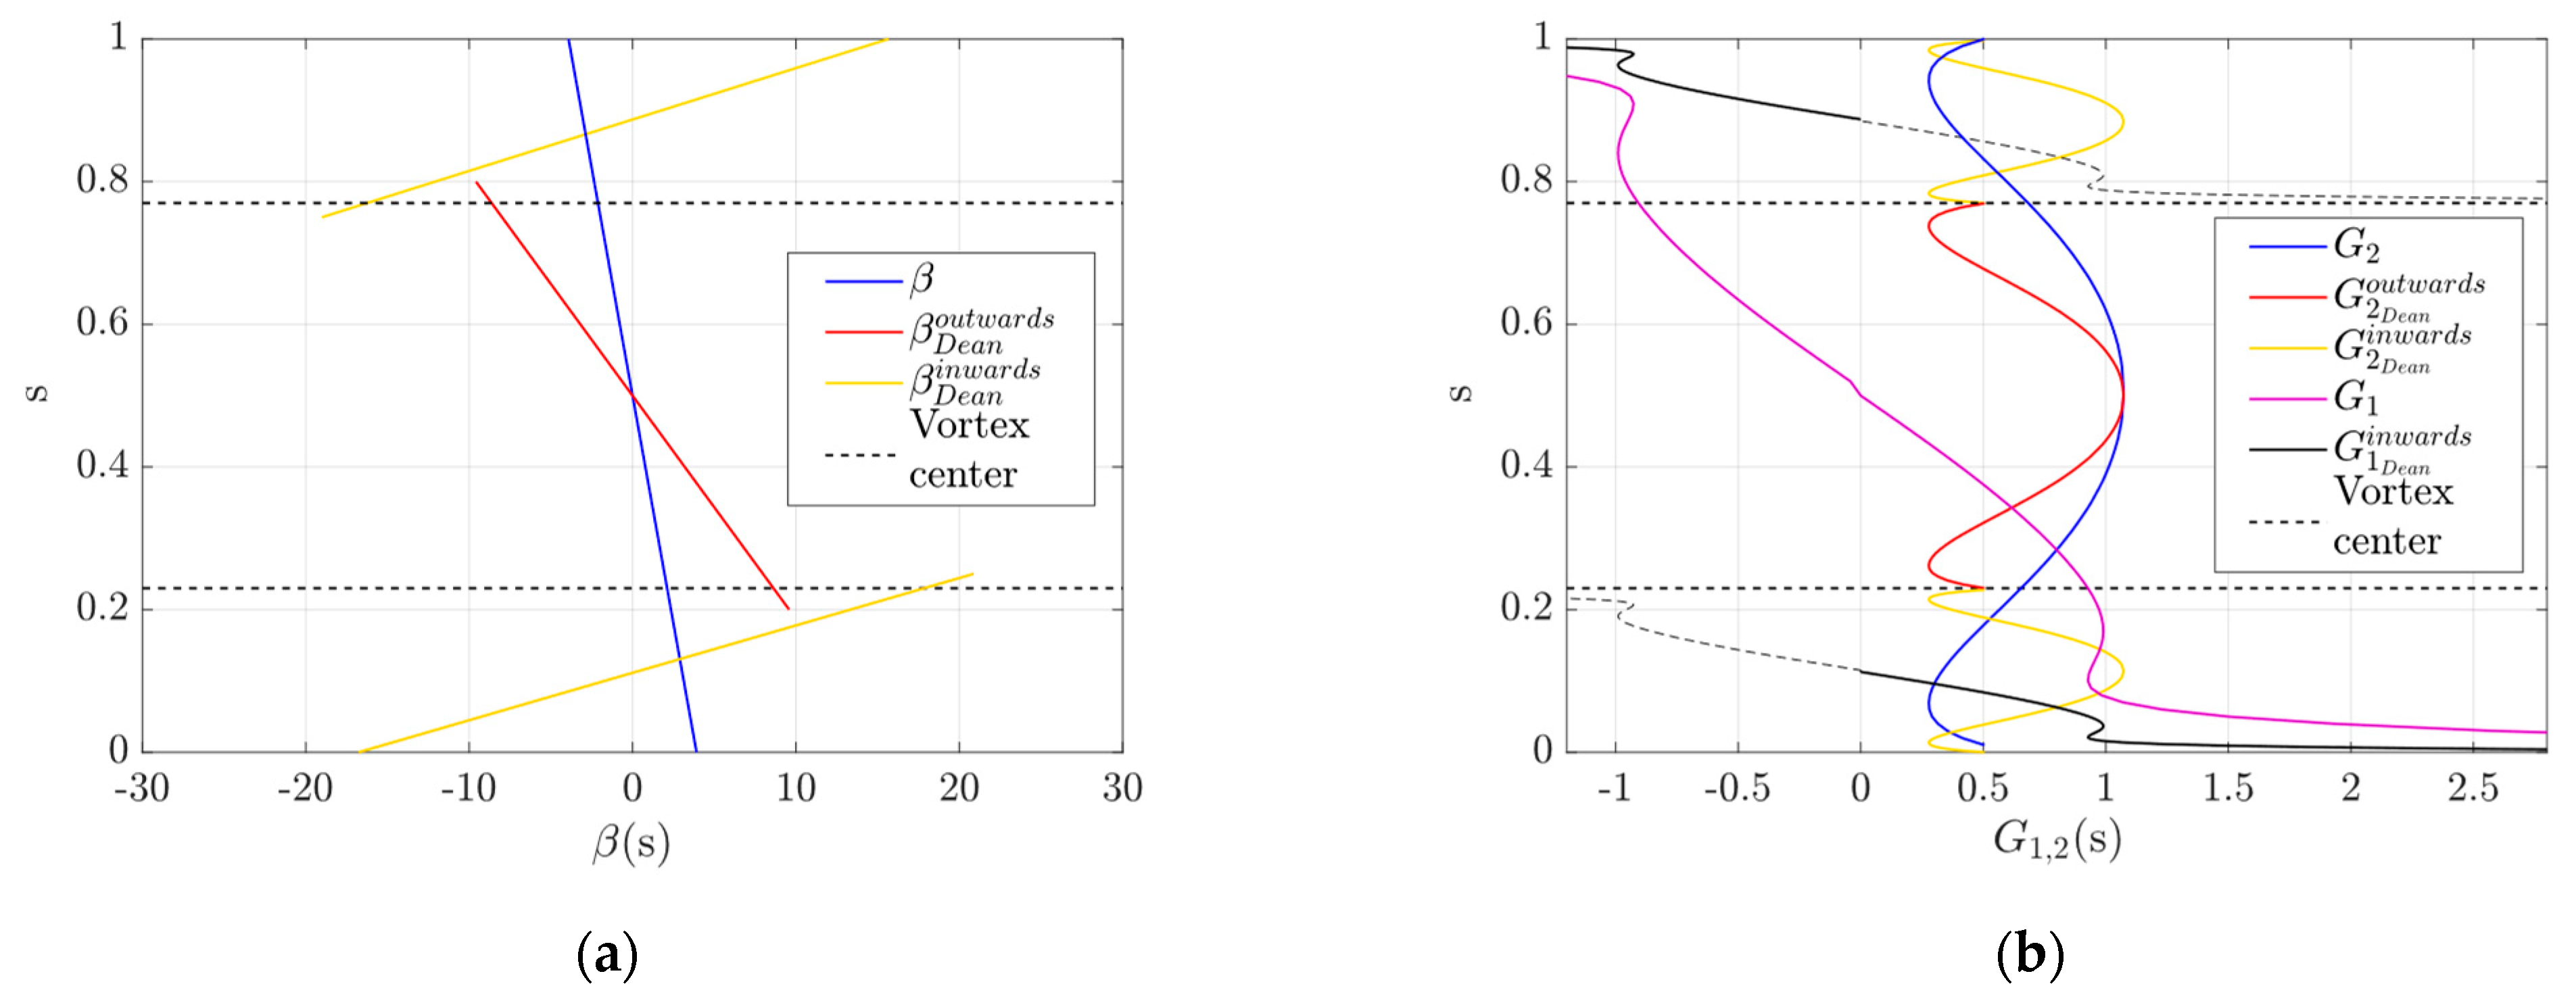
By taking the product β 2 G 1 , for the wall-effect lift, and β γ G 2 , for the shear-induced lift, the direction (the sign of the resulting force) of the contributing inertial forces can be inferred from Figure 9. Since β 2 > 0 , the sign of G 1 ( s ) completely determines the direction of F w . The direction of F s , on the other hand, is determined by the product β γ ( G 2 ( s ) > 0     s ). For example, β D e a n ( s > 0.5 ) < 0 and β D e a n ( s < 0.5 ) > 0 (Figure 9a). Since γ D e a n o u t w a r d s ~ 16 , F s ( s > 0.5 ) > 0 (pointing towards increasing s ) and F s ( s < 0.5 ) < 0 (pointing towards decreasing s ). The same procedure can be followed to deduce the direction of F w and F s caused by the streamwise velocity profile and the inwards-moving Dean flow profile.
The explicit lift formula from Equation 3 and the provided β and γ coefficients can be used to obtain the strength of the Dean-induced lift and the conventional lift forces caused by the curvature of the streamwise velocity profile. This study, however, needs to be performed by segments in the fluidic channel. For instance, in the central region, we have that the contributing β and γ factors for the Dean velocity profiles are β D e a n o u t w a r d s ~ 16 ( 1 2 s ) and γ D e a n o u t w a r d s ~ 16 . By making the proper substitutions in Equation 6.3 we found that:
F D e a n L i f t = ρ V D e a n m a x 2 a 4 D h β D e a n o u t w a r d s γ D e a n o u t w a r d s G 2 D e a n o u t w a r d s ~ 14.8 V m a x 2 a 4 D h ( 1 2 s ) G 2 D e a n o u t w a r d s
where the values for V D e a n m a x = 0.14   m / s and V m a x = 0.58   m / s were obtained from the simulation and the factor G 2 D e a n o u t w a r d s , which is defined in the central region of the channel ( 0.23   <   s   <   0.77 ), can be found in the literature [54]. The Dean-induced lift force in the upper region of the fluidic channel can be defined as
F D e a n L i f t = ρ V D e a n m a x 2 a 4 D h ( ( β D e a n i n w a r d s ) 2 G 1 D e a n i n w a r d s + β D e a n i n w a r d s γ D e a n i n w a r d s G 2 D e a n i n w a r d s ) ~
~   0.01 ρ V D e a n m a x 2 a 4 D h ( ( 123 + 139 s ) 2 G 1 D e a n i n w a r d s + ( 123 + 139 s ) 70 G 2 D e a n i n w a r d s )
where V D e a n m a x in the upper (lower) region of the channel is 0.059   m / s and V m a x   =   0.58   m / s . The coefficient β for the upper region ( 0.77   <   s   <   1 ) is β D e a n i n w a r d s = 123 + 139 s (yellow straight line in the upper region of Figure 9a).
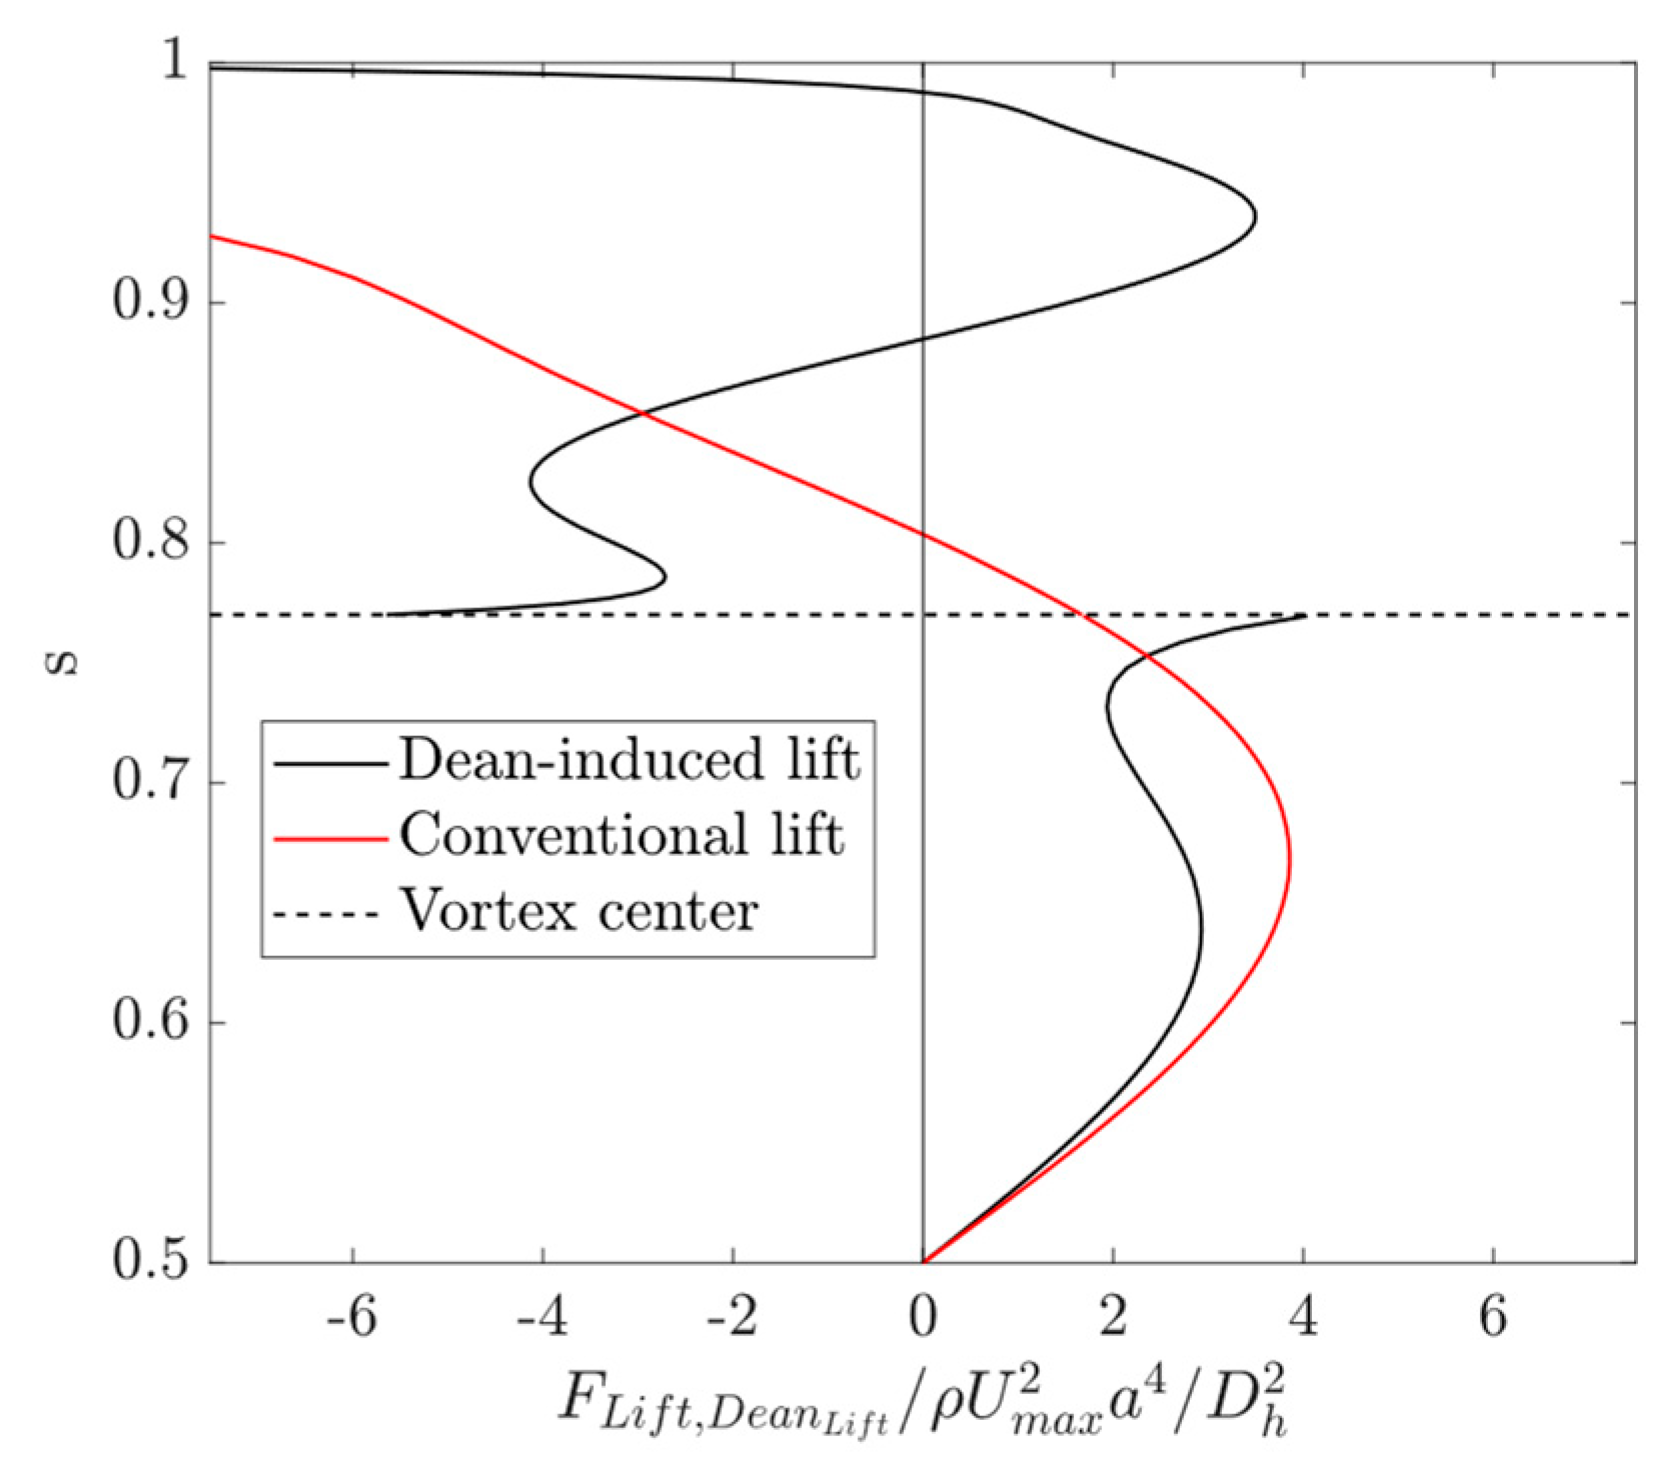
Equations 4 and 5 together with Figure 10 reveal how the proposed Dean-induced lift has a comparable order of magnitude than that of the shear-induced and wall-effect lift forces therefore representing an important contribution to inertial migration effects. According to Equation 3, it may appear that no Dean-induced effects can be as strong as those produced by conventional lift due to their dependence with the maximum velocity of the flow squared ( U D e a n < U S t r e a m w i s e   f l o w ). As demonstrated, a thorough study of the involved velocity gradients and second derivatives, should be considered as well. As mentioned earlier, the magnitude of the lift forces is expected to be much smaller than the one predicted theoretically when finite particle sizes and R e are considered. This effect, however, will be noticeable for both, the Dean-induced and the conventional lift, so a direct comparison between the magnitudes of both forces is still reasonable.

4.4. Focusing Mechanism and Early Effects of Dean-Induced Inertial Lift Force

In order to improve our understanding of inertial focusing mechanisms in an asymmetric serpentine by means of Dean drag and inertial forces, a descriptive approach, supported by simulations and experimental observations, about the initial stages of focusing at the beginning of the serpentine is provided in this section.
When focusing conditions are achieved (minimum flow rate and correct particle size/channel geometry ratio), particles entering the serpentine at random positions are subjected to both, the influence of shear gradient-induced lift and Dean drag. Besides the effects produced by these two forces, an additional effect caused by this hypothetical Dean-induced lift force would be the gradual inward displacement of particles to the center of either the upper or lower vortices. Like in the case of the conventional shear gradient lift, this force is entirely gradient-induced in nature.
The migration of particles moving in the central region of a given curve (between the upper and lower vortices centers) is strengthen by the addition of this Dean-induced lift force with the conventional shear gradient lift since they both push particles away from the central region. For particles located between the walls and a vortex center, however, the action of this force is different since the shear due to the Dean in those regions forces particles to move away from the walls. Although its effect in this situation is analogous, Dean-induced lift is not expected to be short ranged like the wall-effect lift since the former is entirely related to the geometry of the Dean flow profile in the near-wall region.
A possible explanation of how particles are gradually focused to the final focused trajectory is that, as unfocused particles pass through the succession of big and small turns, they are alternatively displaced axially (counterclockwise-clockwise) under the influence of the drag from the different Dean flow patterns that the particles encounter along the serpentine [53]. The effect of this vortex center-directed Dean-induced inertial force is, however, additive at each successive curve since it periodically pushes particles to the center of the vortices no matter of its rotation direction as they encounter the Dean vortices at each big-small curves. Particles will remain in a stationary trajectory once they reach a focusing position for which a balance between the different involved forces is achieved, a position that happens to be near the Dean vortices centerlines. Due to its Dean flow direct relationship, Dean-induced inertial lift effect will be minimal in those regions where Dean flow gradients are small (mainly at the vorticity transition regions) and maximal in those regions where they are stronger (halfway through the small curves).
The mechanisms by which vortex center-directed migration effects are attributed to this Dean-induced inertial force may be used to explain why inertial focusing can also occur in symmetric serpentines [1,47,48,53] since no net Dean drag effect—the product of the joint effect of the flow pattern in the small and the big curves—is required to reach inertial focusing conditions more efficiently [36]. Inertial focusing in symmetric serpentines generally produce two (as seen from above) focused streaks. The selective focusing to a single streak in an asymmetric serpentine is essentially taking place in the small curve as it is being favored by the stronger gradients in the small curve for 1) the streamwise flow (due to the smaller section of the small curve) and 2) the smaller curvature radius (which increases the Dean flow intensities and, hence, the strength of the Dean-induced lift force in the small curve). The use of a symmetric serpentine allows particles to focus at two coexisting stable trajectories, the corresponding to curves to the right and to the left in the serpentine and, for the appropriate flow rate, it allows the focusing of particles into a single trajectory. This is because an increase in the flow rate will eventually led the trajectories (which are initially closer to the inner walls of the left and right curves) to move outwards form the center of curvature until the two stable trajectories merge in a single one [47,53].
The existence of an additional Dean-induced inertial lift force may represent an additional argument to explain why focusing of particles occurs faster in curved geometries than in straight channels where no lateral flows are present and the migration rate of particles is exclusively attributed to the shear gradient-induced lift and the wall-effect inertial lift. Although Dean drag may be seen as an ancillary effect that assists particles to sweep the section of the channel to reach their equilibrium position faster [36], the inertial forces that Dean flow induces to the particles may be seen as an active component that speeds up this process or even makes inertial focusing possible when Dean flows are present because they speed up the translation of particles towards the vortices centerlines.
Early effects of inertial migration and Dean drag can already be noticed in the lateral view of the serpentine close to the inlet. Surprisingly, particles tend to be quickly entrained in the upper and lower vortices, much before the particles are completely focused. This fast separation of particles into two separate populations, suggests that the action of the shear gradient-induced lift in the vertical direction (whose gradient is stronger due to the aspect ratios of the channels) causes particles to be displaced vertically being entrained in the upper and lower vortices emptying the central region of the channel in the vertical direction.
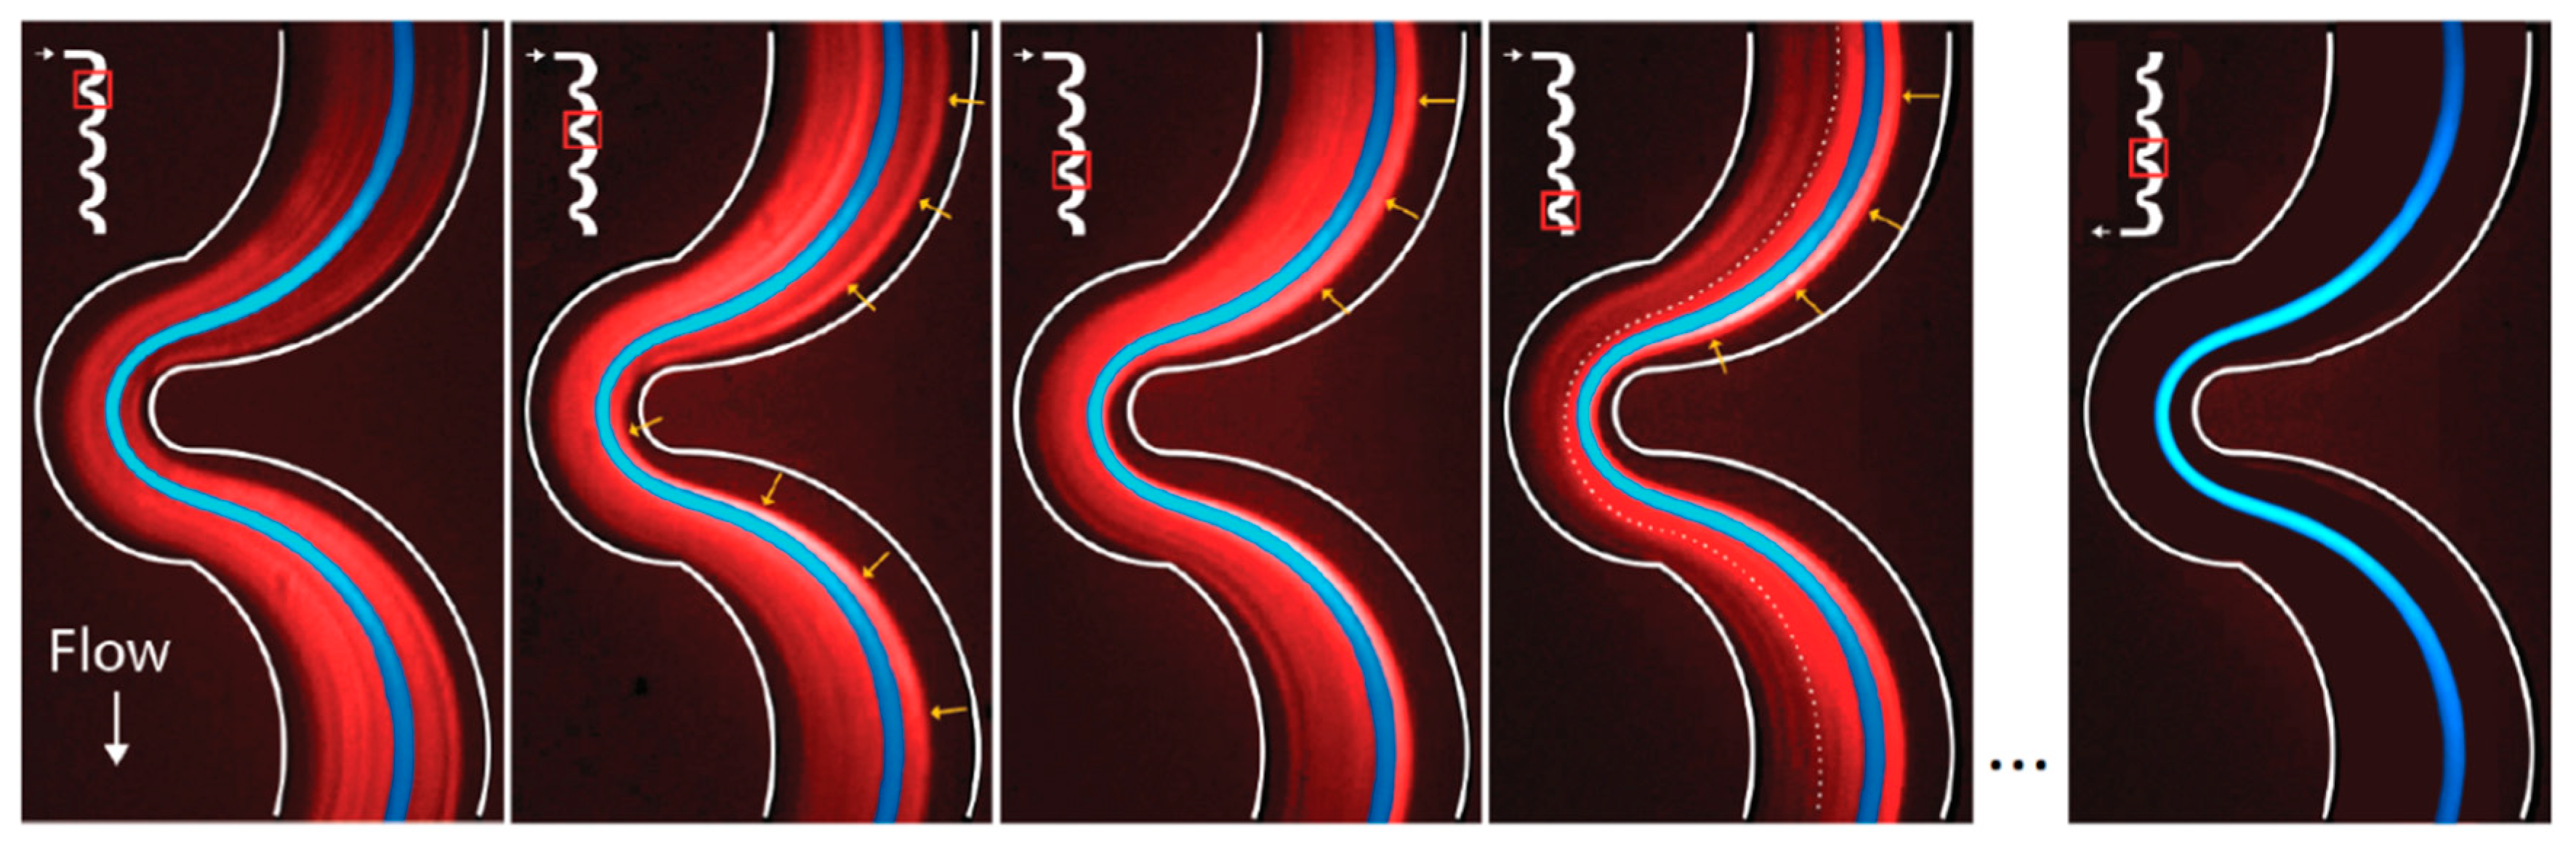
When observing the microfluidic channels azimuthally, the first sign of focusing is a progressive particle clearing at the inner region of the small curves and the corresponding outer region of the big curves (Figure 11), creating two differentiated regions, one in which there are no particles flowing within and another one in which particles seem to be entrained in a convective motion around the vortices’ centers due to the Dean drag. As particles enter the serpentine from the inlet, their position gradually evolves as they move along the channel until the inner region of the small curve and the outer region of the big curve are no longer accessible by any particle. It would appear that inertial lift forces, working in conjunction with Dean drag, prevent particles from leaving this convective region once they enter inside it after the particles have traveled a short distance in the serpentine. For instance, for the 44   μ m in height channel and the 6   μ m particles, the convective region is almost fully developed after the fourth big-small curve doublet when a flow rate of 90   μ L / min is applied (Figure 11).
By inspecting Figure 11, it appears that the particle-free region formation is particularly fast in the small curve as the streaklines at the inner region of the curve are pushed to their final position. This effect is hard to explain by taking into account Dean drag alone. Dean drag may explain the apparent outward-moving tendency of the streaks but only if particles are located close to the central region of the channel in the first and successive small curves, where Dean flows are directed outwards. This behavior suggests that, indeed, particles are being confined, due to the effect of the described Dean-induced lift, to a region where the influence of the Dean flow drives particles away from the inner wall in the small curve.
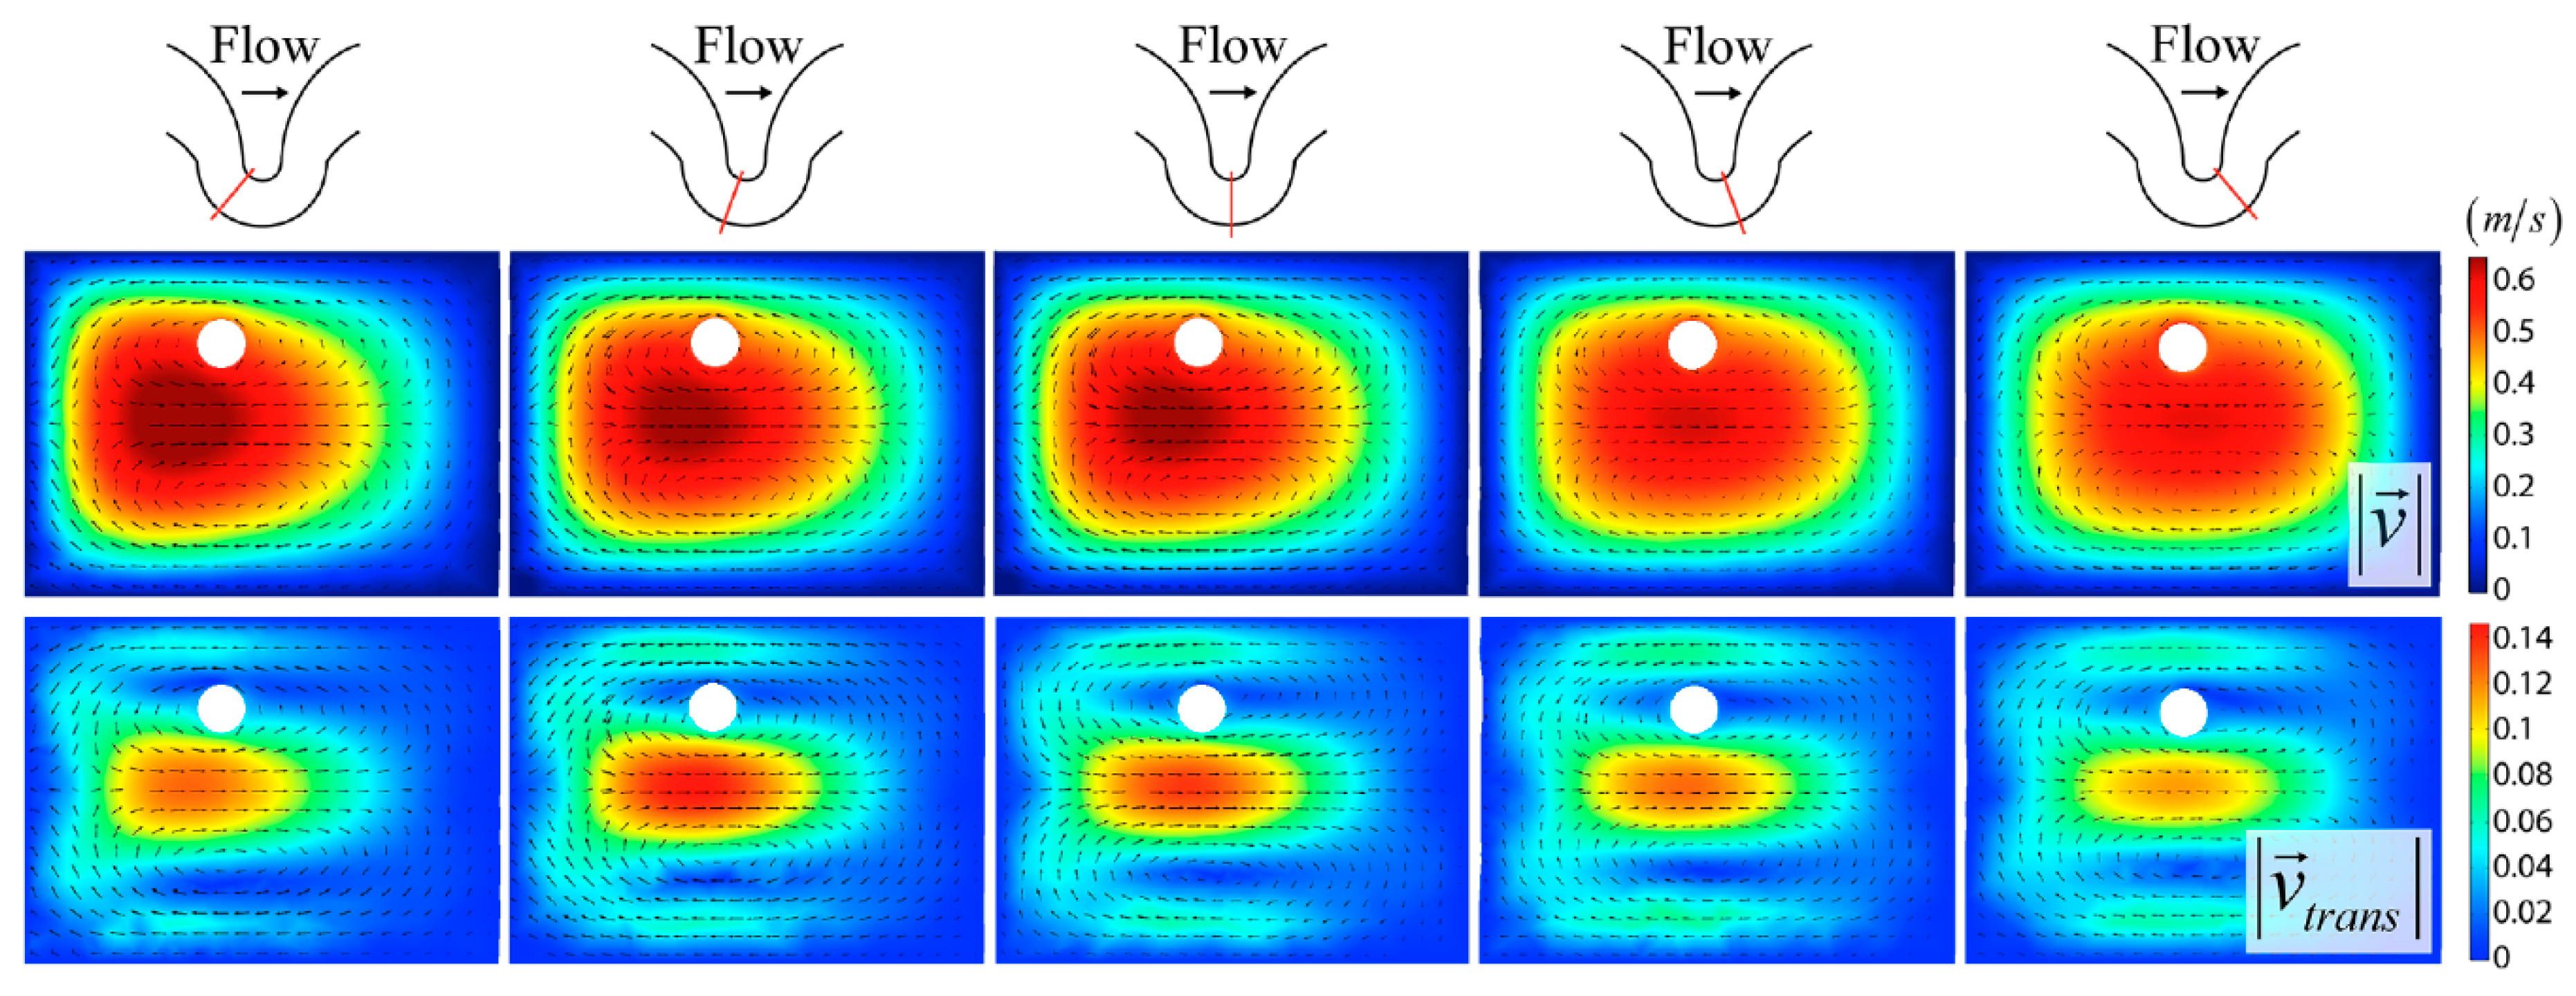
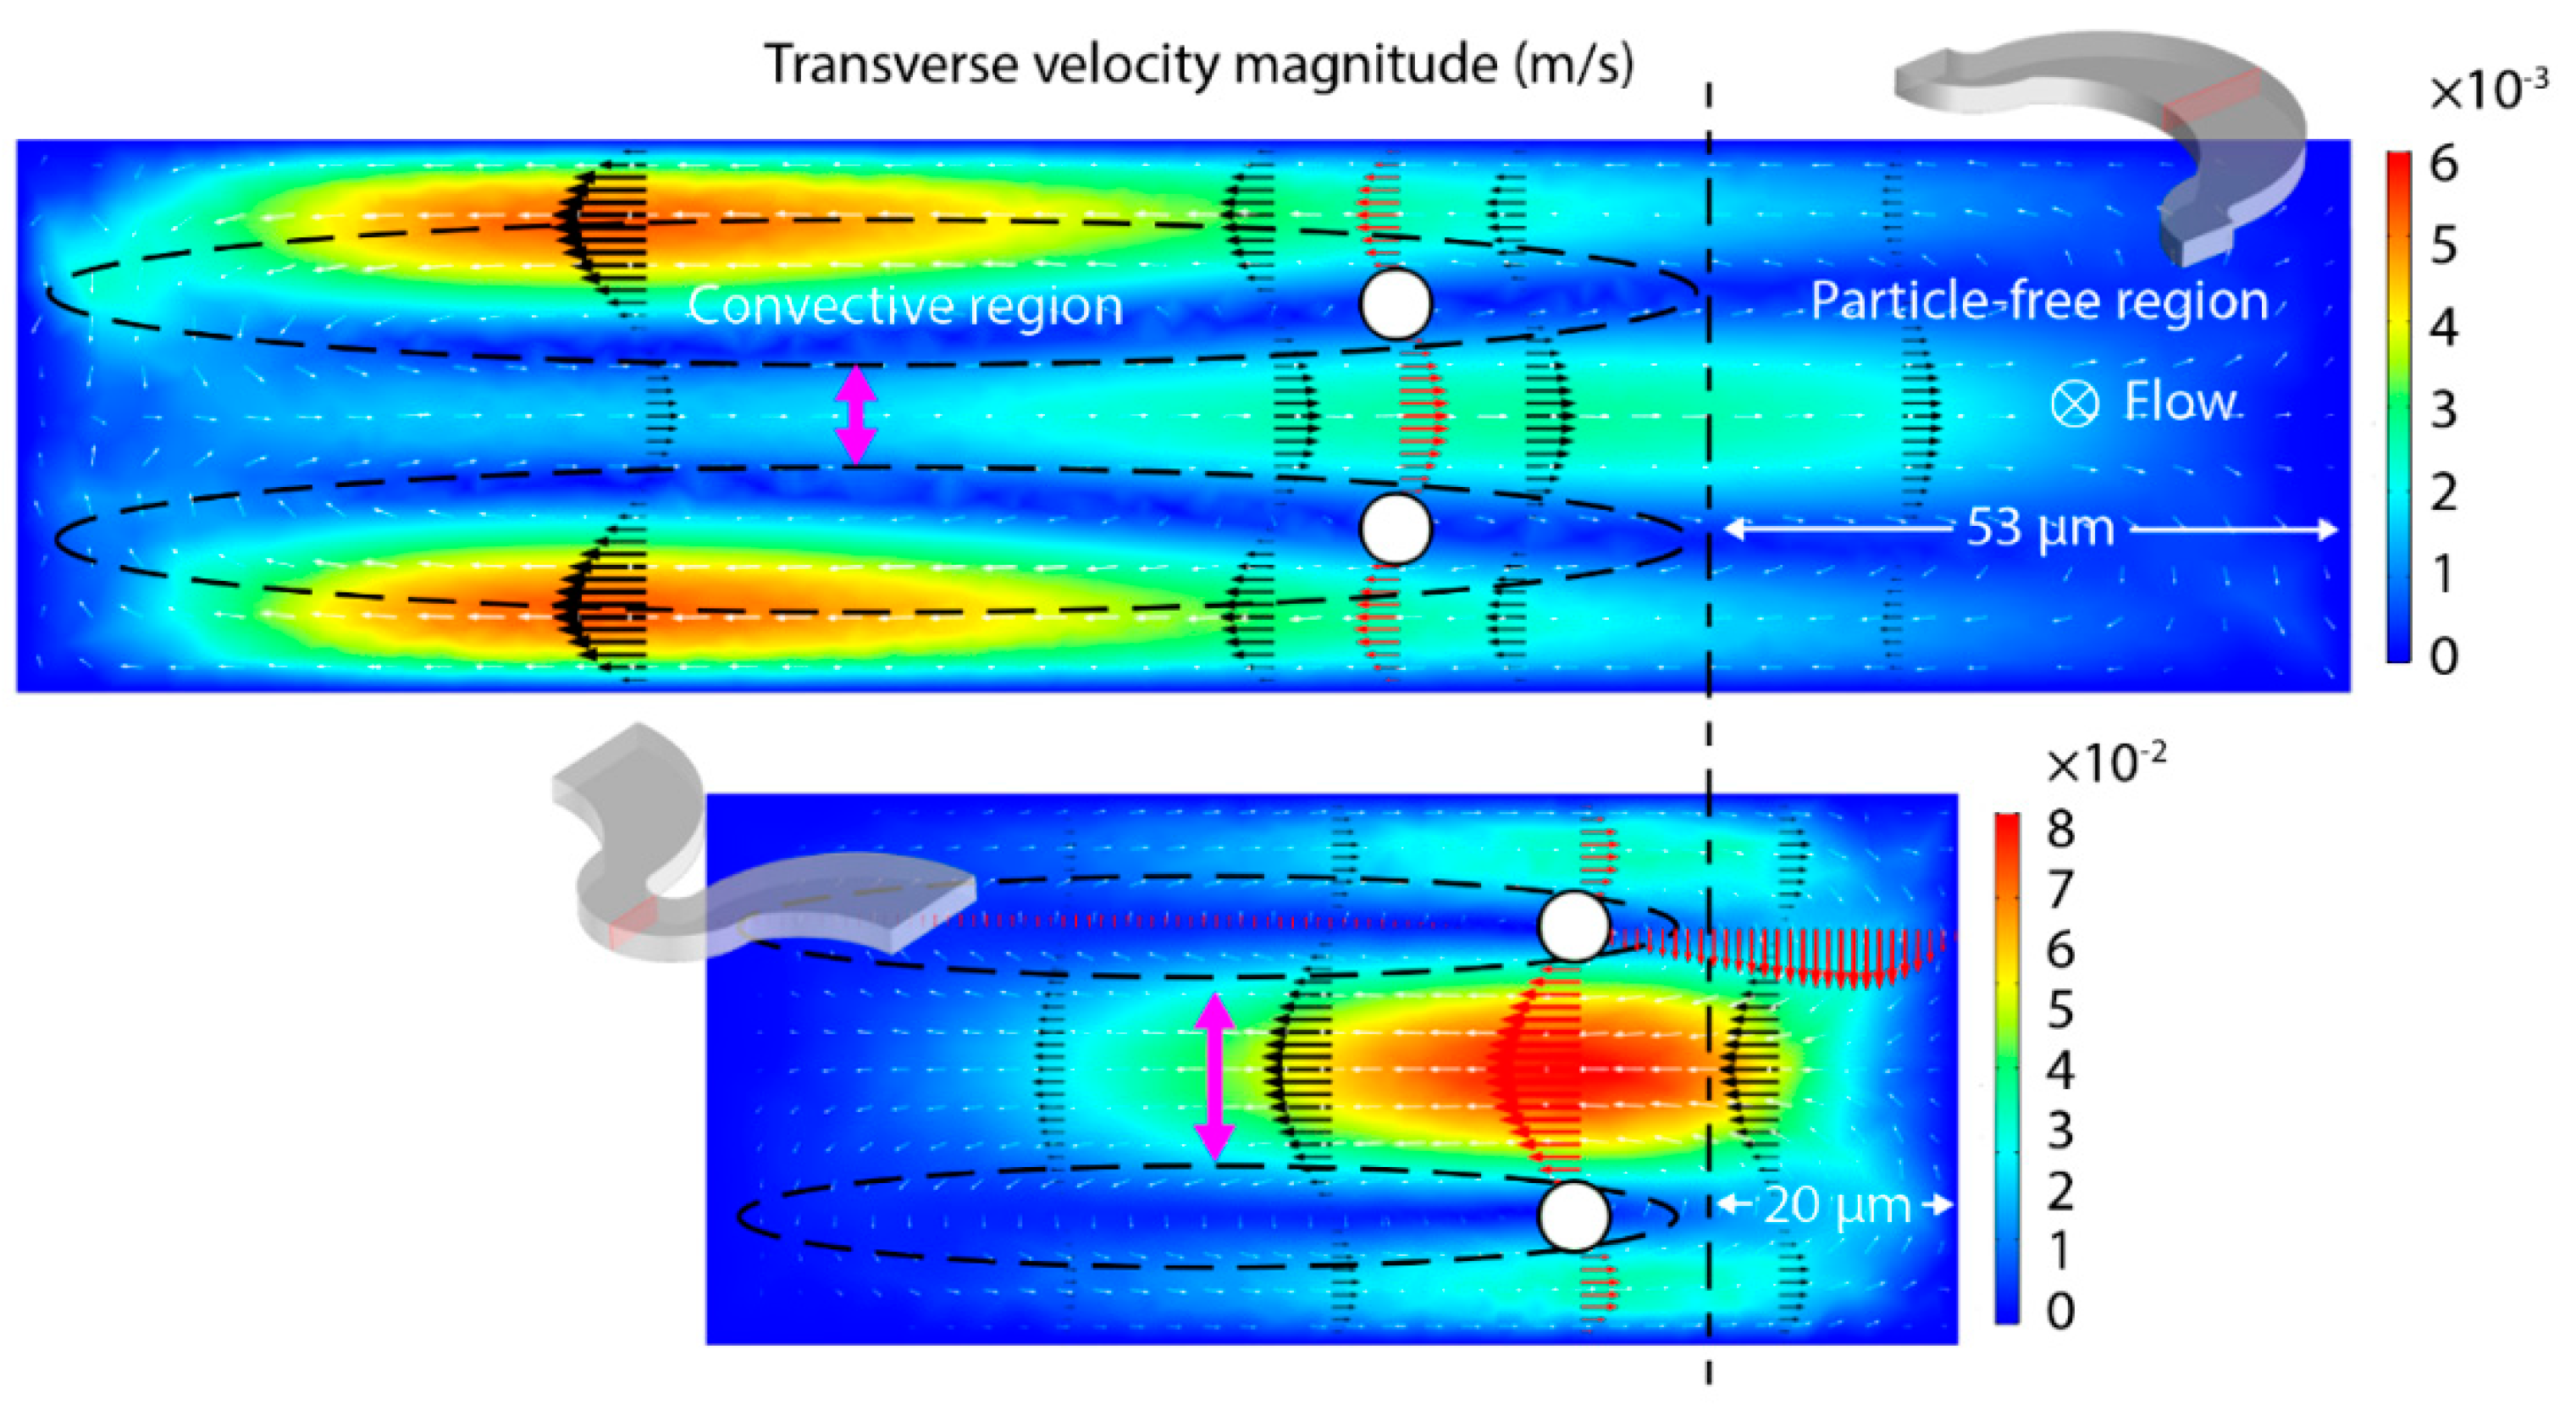
CFD simulations reveal how the lateral flow field in the big curve exhibits a marked asymmetric pattern as the width of the outwards moving streamlines in the central region increases from the center of curvature out, while the upper and lower lateral flow fields behavior is the opposite (Figure 12). Given this lack of symmetry, stable upper and lower trajectories in the big curve (white dots in Figure 12) appear to be closer to each other than in the small curve. Since the flow velocity is an order of magnitude higher in the small curve, it can be assumed that the stable points for the small curve will be dominant over the stable points of the big curve given the proportionality of lift forces to the maximum velocity squared, the shear and its gradient (Equation (3)). Since the equilibrium trajectory in the small curve is closer to the upper (lower) wall, as particles are gradually driven to the equilibrium points of the small curve, they will be eventually exposed, to a larger extent, to the inner flow of the big curve as they move from the small to the big curve speeding up the process of particle clearing in the outer region of the big curve. In addition, the simulations also reveal how upwards/downwards moving transverse flow is stronger in the inner region of the channel’s section in the small curve (Figure 12). This fact implies that particles will experience a stronger Dean-induced lift with a horizontal component in the inner region of the small curve, a circumstance that probably contributes to clear this region of particles faster.
In what appears to be a second focusing process, the rest of the fluorescence streaklines in the convective region (red streaklines in Figure 11) are gradually displaced to the final equilibrium trajectory as particles move through the fluidic serpentine until a single stable streak is observed at the end (blue streakline in Figure 11). This is, however, a relatively slow process when compared to the convective region formation since, under the studied circumstances, it takes almost the entire serpentine length (24 doublets) to obtain a completely focused streak of particles. The slow translation to the final equilibrium trajectory may be explained by the fact that, at this stage, the dynamics of unfocused particles is mainly governed by the influence of the Dean drag which can either drive particles closer or away from equilibrium positions. As long as particles do not approximate the equilibrium position, they will be entrained inside the Dean flows in the convective region.
In describing the particles’ completely focusing state, we can argue that the slight particle focusing variations observed in the first section of this paper are a direct consequence of the interaction between all the involved forces, including the hypothesized Dean-induced lift force. As particles travel along a given path, the level of confinement will depend on the particularities of the flow at each position in a very complex fashion (Figure 13). The variation of the Dean flow strength along said path will dictate the variation in the Dean drag and the Dean-induced lift force accordingly. In the same way, changes in the streamwise velocity profile, given the continuous change in channel’s section and curvature, will cause variations in the conventional lift forces. It is worth noticing that, under this new perspective, Dean drag is no longer an active component once the particles are completely focused —as suggested by the force ratio threshold argument ( F L / F D )— but merely a circumstantial effect during the focusing process in a curved channel; Dean-induced lift ultimately drives particles away from regions where transverse flows are stronger to regions with null net lateral flow and negligible Dean drag.

5. Conclusions

In this paper we have presented results about the focusing behavior of spherical particles translating along a varying transverse flow in an asymmetric serpentine. Simulation and empirical results revealed that the trajectories of inertially focused particles are contained within the Dean vortices centerlines. This implies that the drag due to Dean flows and conventional inertial forces are not in direct competition as suggested by previous studies when the particles are translating along stable trajectories under inertial focusing conditions.
In order to explain the apparent tendency of particles to move towards the vortices centerlines as they move down the serpentine, a new inertial force, that emerges in curved geometries, has been proposed. It is found that, in the limit of small Reynolds number and particle size, the magnitude of this force, whose origin is due to the sheared profile of the transverse flow, is comparable to the inertial lift forces caused by the parabolic velocity profile of the main flow. Taking previous theoretical studies into consideration, it is believed that this result is also valid in the limit of finite Reynolds number values and particle sizes.
The presented results are oriented towards its application to the field of flow cytometry applied to microfluidics; the size range of the analyzed particles during our experiments covers the typical size distribution of human circulating blood cells (white blood cells, red blood cells, etc.). Besides the promising passive focusing capabilities of inertial microfluidics—which directly translates into an improved repeatability—the improvement in our understanding of particle/cell inertial focusing will enhance the signal acquisition in next generation microfluidic devices, i.e., a more precise positioning of cells inside a microfluidic channel (like the one that inertial focusing offers) will diminish the coefficient of variation (CV) in the acquired signal: fluorescence, forward and side-scattering, etc., yielding to improved and better resolved results. Current commercial flow cytometers, on the other hand, have to rely on pre-focusing devices in fluidic cells to counter inherent conventional hydrodynamic focusing flaws [60]. Future inertial focusing devices will work in a simplified mode of operation; its hardware will be composed of lesser elements hence increasing the reliability of the apparatus.

Author Contributions

Conceptualization, E.P.; formal analysis, E.P., J.M.; funding acquisition, M.A.; investigation, E.P., J.M., F.D.; methodology, E.P.; project administration, F.D., M.A.; software, E.P.; supervision, J.M., F.D.; writing, E.P. All authors have read and agreed to the published version of the manuscript.

Funding

This research received financial support from Spanish Government under project MAT2016-75716-C2-1-R (AEI/FEDER, UE) and TEC 2014-55948-R, and from the Catalan Government under project 2017 SGR 755 and 2014 SGR 1358.

Conflicts of Interest

The authors declare no conflicts of interest.

References

  1. Di Carlo, D.; Irimia, D.; Tompkins, R.G.; Toner, M. Continuous inertial focusing, ordering, and separation of particles in microchannels. Proc. Natl. Acad. Sci. USA 2007, 104, 18892–18897. [Google Scholar] [CrossRef] [PubMed] [Green Version]
  2. Di Carlo, D.; Edd, J.F.; Irimia, D.; Tompkins, R.G.; Toner, M. Equilibrium separation and filtration of particles using differential inertial focusing. Anal. Chem. 2008, 80, 2204–2211. [Google Scholar] [CrossRef] [PubMed]
  3. Liu, N.; Petchakup, C.; Tay, H.M.; Li, K.H.H.; Hou, H.W. Spiral Inertial Micro-fluidics for Cell Separation and Biomedical Applications. In Applications of Micro-Fluidic Systems in Biology and Medicine; Tokeshi, M., Ed.; Springer: Berlin, Germany, 2019; pp. 99–150. [Google Scholar]
  4. Dalili, A.; Samiei, E.; Hoorfar, M. A review of sorting, separation and isolation of cells and microbeads for biomedical applications: Micro-fluidic approaches. Analyst 2019, 144, 87–113. [Google Scholar] [CrossRef] [PubMed]
  5. Volpe, A.; Gaudiuso, C.; Ancona, A. Sorting of Particles Using Inertial Focusing and Laminar Vortex Technology: A Review. Micromachines 2019, 10, 594. [Google Scholar] [CrossRef] [Green Version]
  6. Matas, J.-P.; Glezer, V.; Guazzelli, É.; Morris, J.F. Trains of particles in finite-Reynolds-number pipe flow. Phys. Fluids 2004, 16, 11. [Google Scholar] [CrossRef] [Green Version]
  7. Lee, W.; Amini, H.; Stone, H.A.; Di Carlo, D. Dynamic self-assembly and control of microfluidic particle crystals. Proc. Natl. Acad. Sci. USA 2010, 107, 22413–22418. [Google Scholar] [CrossRef] [Green Version]
  8. Kahkeshani, S.; Haddadi, H.; Di Carlo, D. Preferred interparticle spacings in trains of particles in inertial microchannel flows. J. Fluid Mech. 2016, 786. [Google Scholar] [CrossRef]
  9. Reece, A.E.; Oakey, J. Long-range forces affecting equilibrium inertial focusing behavior in straight high aspect ratio microfluidic channels. Phys. Fluids 2016, 28. [Google Scholar] [CrossRef] [Green Version]
  10. Sollier, E.; Masaeli, M.; Amini, H.; Camacho, K.; Doshi, N.; Mitragotri, S.; Di Carlo, D. Effect of particle shape on inertial focusing. In Proceedings of the 15th International Conference on Miniaturized Systems for Chemistry and Life Sciences, Seattle, WA, USA, 2–6 October 2011. [Google Scholar]
  11. Hur, S.C.; Henderson-MacLennan, N.K.; McCabe, E.R.B.; Di Carlo, D. Deformability-based cell classification and enrichment using inertial microfluidics. Lab Chip 2011, 11, 912. [Google Scholar] [CrossRef]
  12. Gossett, D.R.; Tsea, H.T.K.; Lee, S.A.; Yinge, Y.; Lindgren, A.G.; Yang, O.O.; Rao, J.; Clark, A.T.; Di Carlo, D. Hydrodynamic stretching of single cells for large population mechanical phenotyping. Proc. Natl. Acad. Sci. USA 2012, 109, 7630–7635. [Google Scholar] [CrossRef] [Green Version]
  13. Dudani, J.S.; Gossett, D.R.; Tse, H.T.K.; Di Carlo, D. Pinched-flow hydrodynamic stretching of single-cells. Lab Chip 2013, 13, 3728. [Google Scholar] [CrossRef] [PubMed]
  14. Di Carlo, D.; Edd, J.F.; Humphry, K.J.; Stone, H.A.; Toner, M. Particle Segregation and Dynamics in Confined Flows. Phys. Rev. Lett. 2009, 102, 094503. [Google Scholar] [CrossRef] [PubMed] [Green Version]
  15. Matas, J.-P.; Morris, J.F.; Guazelli, E. Inertial migration of rigid spherical particles in Poiseuille flow. J. Fluid Mech. 2004, 515, 171–195. [Google Scholar] [CrossRef] [Green Version]
  16. Hood, K.; Lee, S.; Roper, M. Inertial migration of a rigid sphere in three-dimensional Poiseuille flow. J. Fluid Mech. 2015, 765, 452–479. [Google Scholar] [CrossRef] [Green Version]
  17. Liu, C.; Xue, C.; Sun, J.; Hu, G. A generalized formula for inertial lift on a sphere in microchannels. Lab Chip 2016, 16, 884–892. [Google Scholar] [CrossRef] [PubMed] [Green Version]
  18. Volpe, A.; Paiè, P.; Ancona, A.; Osellame, R.; Lugarà, P.M.; Pascazio, G. A computational approach to the characterization of a micro-fluidic device for continuous size-based inertial sorting. J. Phys. 2017, 50, 2017. [Google Scholar]
  19. Volpe, A.; Paiè, P.; Ancona, A.; Osellame, R. Polymeric fully inertial lab-on-a-chip with enhanced-throughput sorting capabilities. Microfluid. Nanofluidics 2019, 23, 37. [Google Scholar] [CrossRef]
  20. Mashhadian, A.; Shamloo, A. Inertial micro-fluidics: A method for fast prediction of focusing pattern of particles in the cross section of the channel. Anal. Chim. Acta 2019, 1083, 137–149. [Google Scholar] [CrossRef]
  21. Kuntaegowdanahalli, S.S.; Bhagat, A.A.S.; Kumar, G.; Papautsky, I. Inertial microfluidics for continuous particle separation in spiral microchannels. Lab Chip 2009, 9, 2973–2980. [Google Scholar] [CrossRef] [Green Version]
  22. Wu, L.; Guan, G.; Hou, H.; Bhagat, A.; Han, J. Separation of leukocytes from blood using spiral channel with trapezoid cross-section. Anal. Chem. 2012, 84, 9324–9331. [Google Scholar] [CrossRef]
  23. Majid, E.W.; Guan, G.; Khoo, B.L.; Lee, W.C.; Bhagat, A.A.S.; Chaudhuri, P.K.; Tan, D.S.W.; Lim, W.T.; Lee, S.C.; Chen, P.C.; et al. Slanted spiral microfluidics for the ultra-fast, label-free isolation of circulating tumor cells. Lab Chip 2013, 14, 128–137. [Google Scholar]
  24. Masaeli, M.; Sollier, E.; Amini, H.; Mao, W.; Camacho, K.; Doshi, N.; Mitragotri, S.; Alexeev, A.; Di Carlo, D. Continuous inertial focusing and separation of particles by shape. Phys. Rev. X 2012, 2. [Google Scholar] [CrossRef] [Green Version]
  25. Mach, A.J.; Di Carlo, D. Continuous scalable blood filtration device using inertial microfluidics. Biotechnol. Bioeng. 2010, 107, 302–311. [Google Scholar] [CrossRef] [PubMed]
  26. Faivre, M.; Abkarian, M.; Bickraj, K.; Stone, H.A. Geometrical focusing of cells in a microfluidic device: An approach to separate blood plasma. Biorheology 2006, 43, 147–159. [Google Scholar]
  27. Tanaka, T.; Ishikawa, T.; Numayama-Tsuruta, K.; Imai, Y.; Ueno, H.; Matsuki, N.; Yamaguchi, T. Separation of cancer cells from a red blood cell suspension using inertial force. Lab Chip 2012, 12, 4336–4343. [Google Scholar] [CrossRef] [PubMed]
  28. Tanaka, T.; Ishikawa, T.; Numayama-Tsuruta, K.; Imai, Y.; Ueno, H.; Yoshimoto, T.; Matsuki, N.; Yamaguchi, T. Inertial migration of cancer cells in blood flow in microchannels. Biomed. Microdevices 2011, 14, 25–33. [Google Scholar] [CrossRef] [PubMed]
  29. Sun, J.; Li, M.; Liu, C.; Zhang, Y.; Liu, D.; Liu, W.; Hu, G.; Jiang, X. Double spiral microchannel for label-free tumor cell separation and enrichment. Lab Chip 2012, 12, 3952–3960. [Google Scholar] [CrossRef] [Green Version]
  30. Seo, J.; Lean, M.; Kole, A. Membrane-free microfiltration by asymmetric inertial migration. Appl. Phys. Lett. 2007, 91, 033901. [Google Scholar] [CrossRef] [Green Version]
  31. Xiang, N.; Chen, K.; Sun, D.; Wang, S.; Yi, H.; Ni, Z. Quantitative characterization of the focusing process and dynamic behavior of differently sized microparticles in a spiral microchannel. Microfluid. Nanofluidics 2012, 14, 89–99. [Google Scholar] [CrossRef]
  32. Ookawara, S.; Higashi, R.; Street, D.; Ogawa, K. Feasibility study on concentration of slurry and classification of contained particles by microchannel. Chem. Eng. J. 2004, 101, 171–178. [Google Scholar] [CrossRef]
  33. Gossett, D.R.; Tse, H.T.K.; Dudani, J.S.; Goda, K.; Woods, T.A.; Graves, S.W.; Di Carlo, D. Inertial manipulation and transfer of microparticles across laminar fluid streams. Small 2012, 8, 2757–2764. [Google Scholar] [CrossRef] [PubMed]
  34. Mach, A.J.; Kim, J.H.; Arshi, A.; Hur, S.C.; Di Carlo, D. Automated cellular sample preparation using a Centrifuge-on-a-Chip. Lab Chip 2011, 11, 2827–2834. [Google Scholar] [CrossRef] [PubMed]
  35. Asmolov, E.S. The inertial lift on a spherical particle in a plane Poiseuille flow at large channel Reynolds number. J. Fluid Mech. 1999, 381, 63–87. [Google Scholar] [CrossRef]
  36. Gossett, D.R.; Di Carlo, D. Particle focusing mechanisms in curving confined flows. Anal. Chem. 2009, 81, 8459–8465. [Google Scholar] [CrossRef] [PubMed]
  37. Martel, J.M.; Toner, M. Inertial focusing dynamics in spiral microchannels. Phys. Fluids 2012, 24. [Google Scholar] [CrossRef] [PubMed] [Green Version]
  38. Martel, J.M.; Toner, M. Particle focusing in curved microfluidic channels. Sci. Rep. 2013, 3, 3340. [Google Scholar] [CrossRef] [Green Version]
  39. Russom, A.; Gupta, A.K.; Nagrath, S.; Di Carlo, D.; Edd, J.F.; Toner, M. Differential inertial focusing of particles in curved low-aspect-ratio microchannels. New J. Phys. 2009, 11. [Google Scholar] [CrossRef]
  40. Wang, L.; Dandy, D.S. High-throughput inertial focusing of micrometer- and sub-micrometer-sized particles separation. Adv. Sci. 2017, 4, 10. [Google Scholar] [CrossRef] [Green Version]
  41. Amini, H.; Lee, W.; Di Carlo, D. Inertial microfluidic physics. Lab Chip 2014, 14, 2739–2761. [Google Scholar] [CrossRef]
  42. Dean, W.R. The stream-line motion of fluid in a curved pipe. Philos. Mag. 1928, 5, 673–695. [Google Scholar] [CrossRef]
  43. Squires, T.M.; Quake, S.R. Microfluidics: Fluid physics at the nanoliter scale. Rev. Mod. Phys. 2005, 77, 977–1026. [Google Scholar] [CrossRef] [Green Version]
  44. Berger, S.A.; Talbot, L.; Yao, S. Flow in curved pipes. Annu. Rev. Fluid Mech. 1983, 15, 461–512. [Google Scholar] [CrossRef]
  45. Bhagat, A.A.S.; Kuntaegowdanahalli, S.S.; Papautsky, I. Continuous particle separation in spiral microchannels using dean flows and differential migration. Lab Chip 2008, 8, 1906–1914. [Google Scholar] [CrossRef] [PubMed]
  46. Reece, A.E.; Kaastrup, K.; Sikes, H.D.; Oakey, J. Staged inertial microfluidic focusing for complex fluid enrichment. RSC Adv. 2015, 5, 53857–53864. [Google Scholar] [CrossRef] [Green Version]
  47. Zhang, J.; Yan, S.; Sluyter, R.; Li, W.; Alici, G.; Nguyen, N.-T. Inertial particle separation by differential equilibrium positions in a symmetrical serpentine micro-channel. Sci. Rep. 2014, 4, 4527. [Google Scholar] [CrossRef] [Green Version]
  48. Zhang, J.; Yan, S.; Li, W.; Alici, G.; Nguyen, N.-T. High throughput extraction of plasma using a secondary flow-aided inertial microfluidic device. RSC Adv. 2014, 4, 33149. [Google Scholar] [CrossRef] [Green Version]
  49. Pedrol, E.; Massons, J.; Díaz, F.; Aguiló, M. Two-way coupling fluid-structure interaction (FSI) approach to inertial focusing dynamics under Dean flow patterns in asymmetric serpentines. Fluids 2018, 3, 62. [Google Scholar] [CrossRef] [Green Version]
  50. Kim, T.H.; Yoon, H.J.; Nagrath, S. Optimization approach for inertial focusing and separation of cells in spiral microchannels. In Proceedings of the 18th International Conference on Miniaturized Systems for Chemistry and Life Sciences, San Antonio, TX, USA, 26–30 October 2014. [Google Scholar]
  51. Ardabili, S.; Gantelius, J.; Kowalewski, J.; Brismar, H.; Russom, A. Dean flow-coupled inertial focusing for ultra-high-throughput particle filtration. In Proceedings of the 14th International Conference on Miniaturized Systems for Chemistry and Life Sciences, Groningen, The Netherlands, 3–7 October 2010. [Google Scholar]
  52. Oakey, J.; Applegate, R.W., Jr.; Arellano, E.; Di Carlo, D.; Graves, S.W.; Toner, M. Particle focusing in staged inertial microfluidic devices for flow cytometry. Anal. Chem. 2010, 82, 3862–3867. [Google Scholar] [CrossRef] [Green Version]
  53. Jiang, D.; Tang, W.; Xiang, N.; Ni, Z. Numerical simulation of particle focusing in a symmetrical serpentine microchannel. RSC Adv. 2016, 6, 57647. [Google Scholar] [CrossRef]
  54. Ho, B.P.; Leal, L.G. Inertial migration of rigid spheres in two-dimensional unidirectional flows. J. Fluid Mech. 1974, 65, 365–400. [Google Scholar] [CrossRef]
  55. Park, J.; Song, S.; Jung, H. Continuous focusing of microparticles using inertial lift force and vorticity via multi-orifice microfluidic channels. Lab Chip 2009, 9, 939–948. [Google Scholar] [CrossRef] [PubMed]
  56. Wang, X.; Zhou, J.; Papautsky, I. Vortex-aided inertial microfluidic device for continuous particle separation with high size-selectivity, efficiency, and purity. Biomicrofluidics 2013, 7, 044119. [Google Scholar] [CrossRef] [PubMed] [Green Version]
  57. Zhou, J.; Kasper, S.; Papautsky, I. Enhanced size-dependent trapping of particles using microvortices. Microfluid. Nanofluidics 2013, 15, 611–623. [Google Scholar] [CrossRef] [PubMed] [Green Version]
  58. Segré, G.; Silberberg, A. Behaviour of macroscopic rigid spheres in Poiseuille flow Part 2. Experimental results and interpretation. J. Fluid Mech. 1962, 14, 136–157. [Google Scholar] [CrossRef]
  59. Vasseur, P.; Cox, R.G. The lateral migration of a spherical particle in two-dimensional shear flows. J. Fluid Mech. 1976, 78, 386–413. [Google Scholar] [CrossRef]
  60. Ward, M.D.; Kaduchak, G. Fundamentals of acoustic cytometry. Curr. Protoc. Cytom. 2018, 84, e36. [Google Scholar] [CrossRef] [PubMed]
Figure 1. (a) Environmental scanning electron microscope (ESEM) image of a general view of the SU8 master serpentine; (b) detailed view of the big and small curves of the serpentine; (c) dimensions used in the serpentine geometry.
Fluids 05 00001 g001
Figure 2. Left image: false color image of a fluorescent streak of 3   μ m particles in the small curve. The pseudo trajectory (black dashed line) is overlapped to the particle streak. Transverse segments (white solid lines) are traced at each point of the pseudo trajectory. In order to maintain a good visibility, only 10% of the total number of segments are plotted in this image. Center lower image: for exemplification purposes, the intensity profile of the red highlighted segment of the first image, c ( 580 ,   j ) , is shown. The degree of spreading is calculated with respect to the center of the distribution employing intensity values as weighting parameters. Right upper image: stacked transverse intensity profiles (false color) and overlapped degree of spreading curve (red solid line) for each i value. The degree of spreading (DoS) curve is smoothed so that a more reasonable curve is obtained (white dashed line). The white arrow represents de value of the DoS in the highlighted profile at the 580th profile/pixel column in the original image. The redish shaded bands at the sides of the map cover the regions for which the DoS curve values cannot be correctly calculated due to a partial covering of the fluorescent streak at the borders of the original image.
Fluids 05 00001 g002
Figure 3. (a) Mapped intensity profiles (false color) of a 3   μ m particle fluorescent streak in a 37   μ m high serpentine at Q = 200   μ L / min . The degree of spreading (red plot) is overlapped to it; (b) spreading degree map for the same particle size and channel geometry. The smoothed DoS curve corresponding to the flow rate from (a) is highlighted over the map (dashed white curve).
Fluids 05 00001 g003
Figure 4. Spreading degree maps for different particle sizes and channel geometries.
Fluids 05 00001 g004aFluids 05 00001 g004b
Figure 5. False color images of focused Ø   = 10   μ m fluorescent particles in the h = 73   μ m channel at different flow rates. Overlapped to the images are velocity modulus isosurfaces (partially transparent white) of the transverse flow field obtained in the centerlines in the fluid dynamics (CFD) simulation. The values at the isosurfaces for increasing flow rate are 5 × 10 3   m / s , 1.2 × 1   0 2   m / s , 2 × 1   0 2   m / s , 2.5 × 1   0 2   m / s , 3 × 1   0 2   m / s and 4 × 1   0 2   m / s . The top and bottom layers of the white isosurfaces have been removed in order to expose the characteristic vein of the central region of the vortices’ centerlines in the small curve.
Fluids 05 00001 g005
Figure 6. Flow field distribution, streamwise velocity and transverse velocity magnitudes at different sections of the small curve for the fluid-structure interaction (FSI) simulation. Flow fields and magnitudes at each plane represent different times as the particle moves through the curve. In order to have a proper representation of the small transverse velocity regions, the vector length of the velocity field is represented in logarithmic scale.
Fluids 05 00001 g006
Figure 7. Velocity profiles in the FSI simulation for the 10   µ m inertially focused particle in a 73   µ m high channel at Q = 130   µ L / min . (a) Middle section of the small curve with simulated flow velocity profiles around the focused particle. Colored arrows (with different length scales between them) represent the profiles for the main flow (red arrows) and Dean flows (black and blue arrows). Dean vortices are depicted with faint gray arrows; (b) the two main inertial forces, F L i f t and F W a l l , are caused by the parabolic velocity profile in the z direction and the presence of a wall near the particle. Short-range wall-effect inertial lift is only appreciable near the channel wall ( F w a l l ~ O ( w R e 1 / 2 ) [35] where w is the width of the channel). The maximum velocity for this profile is v 0.53 m / s ; (c) the Dean velocity profile in the vertical (black) and horizontal (blue) directions cause opposing Dean-induced lift forces. The maximum transverse flow at this section of the curve turns out to be v t r a n s 0.13   m / s .
Fluids 05 00001 g007
Figure 8. Simulated velocity profiles inside a 73   μ m × 100   μ m section channel at Q = 130   μ L / min . While being inertially focused, particles tend to accumulate in the regions within the green bands. (a) The simulated streamwise profile can be approximated by a parabolic profile in the x direction of the form v x = α + β z + γ z 2 ; (b) inwards and outwards transverse Dean flow profiles can be separately approximated by a parabolic profile as well. Since these profiles are vertically constricted due to the shape of the Dean profile, β and γ coefficients will differ from those obtained in the streamwise profile fitting.
Fluids 05 00001 g008
Figure 9. (a) Values of β coefficients in terms of the normalized particle height, s , for the streamwise velocity profile and the Dean flow profiles from Figure 8. (b) Data to represent G 1 and G 2 was obtained from [54]. Inward-moving Dean flow profile is bounded by one single wall, hence, the only contributing G 1 values (those that force the particle to move away from the wall) are plotted with a black solid line. The central part of the Dean flow (the corresponding to outward-moving flow) is delimited by dashed lines, which correspond to the centers of the Dean vortices.
Fluids 05 00001 g009
Figure 10. A direct comparison between the non-dimensional conventional lift, F L i f t , caused by the parabolic velocity profile of the streamwise flow, and Dean-induced lift forces, F D e a n L i f t . For 0.5 < s < 0.77 both, F L i f t and F D e a n L i f t add up pushing particles to increasing s (they are both positive). F D e a n L i f t is negative in the region 0.77 < s < 0.89 , meaning that the shear from the Dean profile in that range will push particles to decreasing s values, towards the vortex center. The lift due to the conventional lift is negative for most of this range so wall-effects will also contribute to push particles towards decreasing s values. In the point-like approximation particles reach an equilibrium position due to conventional lift forces at s   =   0.8 [54] which corresponds to a distance 0.6 times the radius of circular pipe [58,59], a position that happens to be above the equilibrium position for the Dean-induced lift force; the center of the Dean vortex.
Fluids 05 00001 g010
Figure 11. Particles in the process of being confined in the convective region (red streaklines) at a position next to the inlet of the serpentine and completely focused at the outlet of the serpentine (right image) for a 44   μ m in height channel and 6   μ m particles at 90   μ L / min . At this stage, Dean drag is the dominant force for some of the particles translating along a trajectory far from the Dean vortices centers. Fluorescence streaks are presented in false color to improve clarity; red and blue for particles under the confinement process and completely focused respectively. In order to identify its final position more easily, overlapped to each image is the same streakline image (colored in blue) obtained once the particles are completely focused at the end of the serpentine. Yellow arrows indicate the displacement undergone by the particles’ streaks contour with respect to the previous curve. The white dashed line in the last inlet image delimits, from the left side, a region that surrounds the final focused streak whose number of streaklines has noticeably increased between the last two images.
Fluids 05 00001 g011
Figure 12. Transverse flow fields and velocity magnitudes at the midpoint sections of the big (widest section) and the small curves in a 44   μ m in height channel. Overlapped white markers represent scaled 6   μ m particles located at the approximate equilibrium trajectories deduced from the zenithal views. The two upper and lower areas delimited by a dashed line represent the regions at which particles tend to concentrate after they are separated by a vertically directed inertial lift force (pink arrows) into two populations.
Fluids 05 00001 g012
Figure 13. Graphical representation of the spatial confinement experienced by one of the two stable focused particle trajectories as seen from the straightened fluorescence streak. The observed transverse Dean flow distribution and the Dean-induced lift forces (gray and red arrows respectively), acting on the spherical particles, are represented not to scale.
Fluids 05 00001 g013

