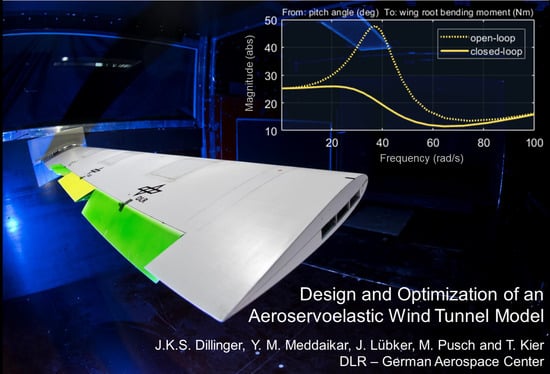
Design and Optimization of an Aeroservoelastic Wind Tunnel Model
by
 ,
,
Johannes K. S. Dillinger
1,* ,
,
Yasser M. Meddaikar
1,
Jannis Lübker
1,
Manuel Pusch
2 and
Thiemo Kier
2 1
Institute of Aeroelasticity, German Aerospace Center (DLR), 37073 Göttingen, Germany
2
Institute of System Dynamics and Control, German Aerospace Center (DLR), 82234 Weßling, Germany
*
Author to whom correspondence should be addressed.
Fluids 2020, 5(1), 35; https://doi.org/10.3390/fluids5010035
Submission received: 30 January 2020
/
Revised: 14 March 2020
/
Accepted: 14 March 2020
/
Published: 17 March 2020
(This article belongs to the Special Issue Flow and Aeroelastic Control)
Abstract
:Through the combination of passive and active load alleviation techniques, this paper presents the design, optimization, manufacturing, and update of a flexible composite wind tunnel model. In a first step, starting from the specification of an adequate wing and trailing edge flap geometry, passive, static aeroelastic stiffness optimizations for various objective functions have been performed. The second optimization step comprised a discretization of the continuous stiffness distributions, resulting in manufacturable stacking sequences. In order to determine which of the objective functions investigated in the passive structural optimization most efficiently complemented the projected active control schemes, the condensed modal finite element models were integrated in an aeroelastic model, involving a dedicated gust load alleviation controller. The most promising design was selected for manufacturing. The finite element representation could be updated to conform to the measured eigenfrequencies, based on the dynamic identification of the model. Eventually, a wind tunnel test campaign was conducted in November 2018 and results have been examined in separate reports.
1. Introduction
The work presented in this paper has been hosted in the DLR (German Aerospace Center) KonTeKst project [1], which focused on the development and analysis of configurations and technologies for emission and noise reduced short range aircraft. Part of the project focused on the development and testing of an actively controlled flexible composite wing that aimed at a validation of active load alleviation techniques.
Passive means of load alleviation have been a subject of research for many years. In particular, the identification of the manifold benefits attainable with composite materials has led to a considerable amount of research, in the past decades, starting in the late 1970s with the work by Starnes Jr and Haftka [2], describing a weight minimization subject to combinations of buckling, strength, displacement, and twist responses. The effect of bending torsion coupling [3], and nonsymmetric laminates [4] were already investigated in the 1980s, with a detailed overview of aeroelastic tailoring techniques, in general, provided by Shirk et al. [5]. Vanderplaats and Weisshaar provided an early overview on composite optimization techniques [6]. More recent aeroelastic tailoring works which also included the manufacturing aspects and constraints were given by Stodieck et al. [7,8,9] and Stanford et al. [10,11], the latter one presenting an overview of the state-of-the-art. In [12,13], the author describes a composite stiffness optimization framework that focused on passive aeroelastic tailoring problems, a derivative of which was employed in the present work.
Aeroservoelastic applications, in general, have been investigated extensively in the past, for example, in [14,15,16,17]. In particular, gust load alleviation by active means are implemented in many aircraft as summarized, for example, in [18]. One of the earliest examples of an aircraft incorporating active control to alleviate structural loads during gust encounter is the Lockheed C-5A [19]. On the C-5A aircraft, several control algorithms which command coordinated aileron deflections based on acceleration measurements have been evaluated to greatly reduce the wing bending moment during gusts and maneuvers. In modern aircraft, active gust load alleviation has become an integral part that has allowed for cost savings in terms of fuel and maintenance. Moreover, the development of new technologies such as morphing wings has increased gust load alleviation performance as studied, for example, in [20,21,22,23,24,25]. However, to achieve a maximum overall aircraft performance, the gust load alleviation function needs to be already considered needs to be considered in early aircraft design phases [26]. To that end, a highly automated procedure for gust load alleviation controller design and tuning is required. This, however, can be challenging, especially, because a large number of measurements or control surfaces are available for gust load alleviation, which is generally desired for a better gust load alleviation capability. To tackle this problem, promising control approaches as presented in [27] or [28] have proposed to blend control inputs or measurement outputs, and thereby reduce the control problem size. Through the combination of blending inputs and outputs with the objective of isolating and damping aeroelastic modes which dominate the structural loads, accordingly, blending-based control approaches have been applied, for example, in [29,30,31], where herein, the approach from [32] is used.
2. Model Design
2.1. Previous Campaigns: Lessons Learned
In previous projects, experience was gained with the entire process ranging from the structural layout, static aeroelastic optimization for various objective functions, model manufacturing, to eventually a wind tunnel test campaign. The tests mainly served as a test bench for the optimization process and the manufacturability of unconventional laminate stacking sequences. The wind tunnel employed in these campaigns was the DLR owned subsonic Side Wind Tunnel Facility (SWG) in Göttingen, Germany, featuring a test section of 2.4 × 1.6 m (width × height) and a maximum free stream velocity of 60 m/s.
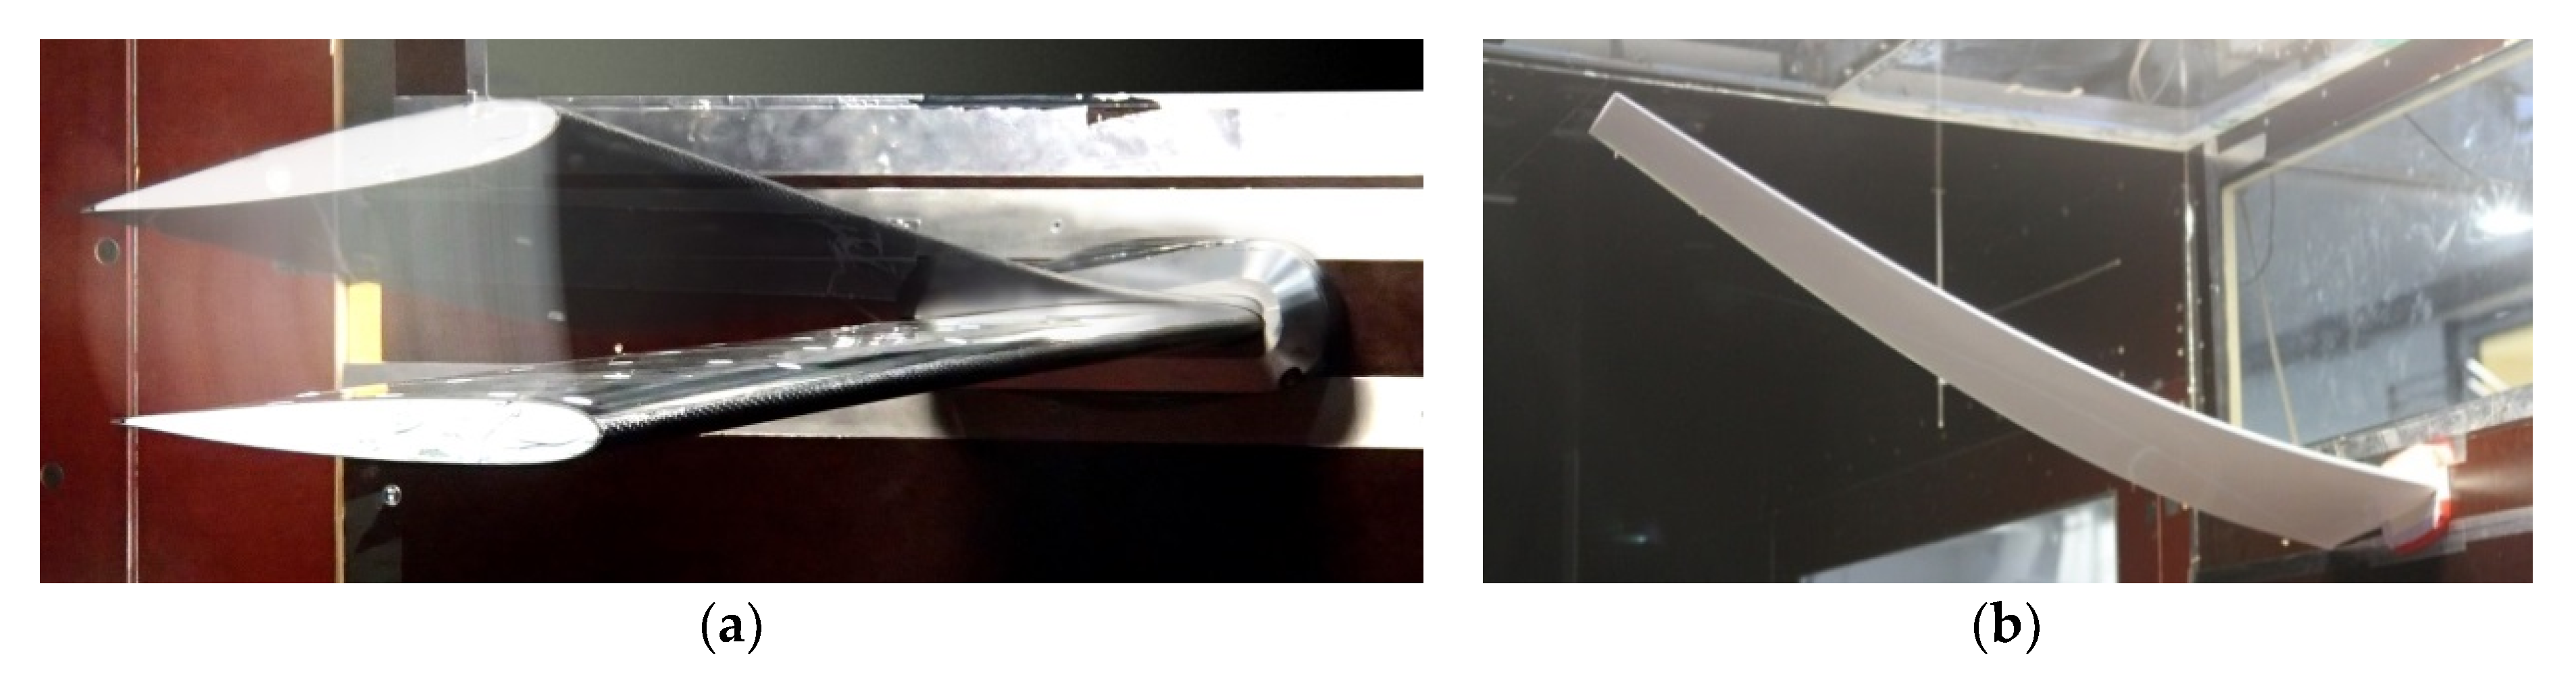
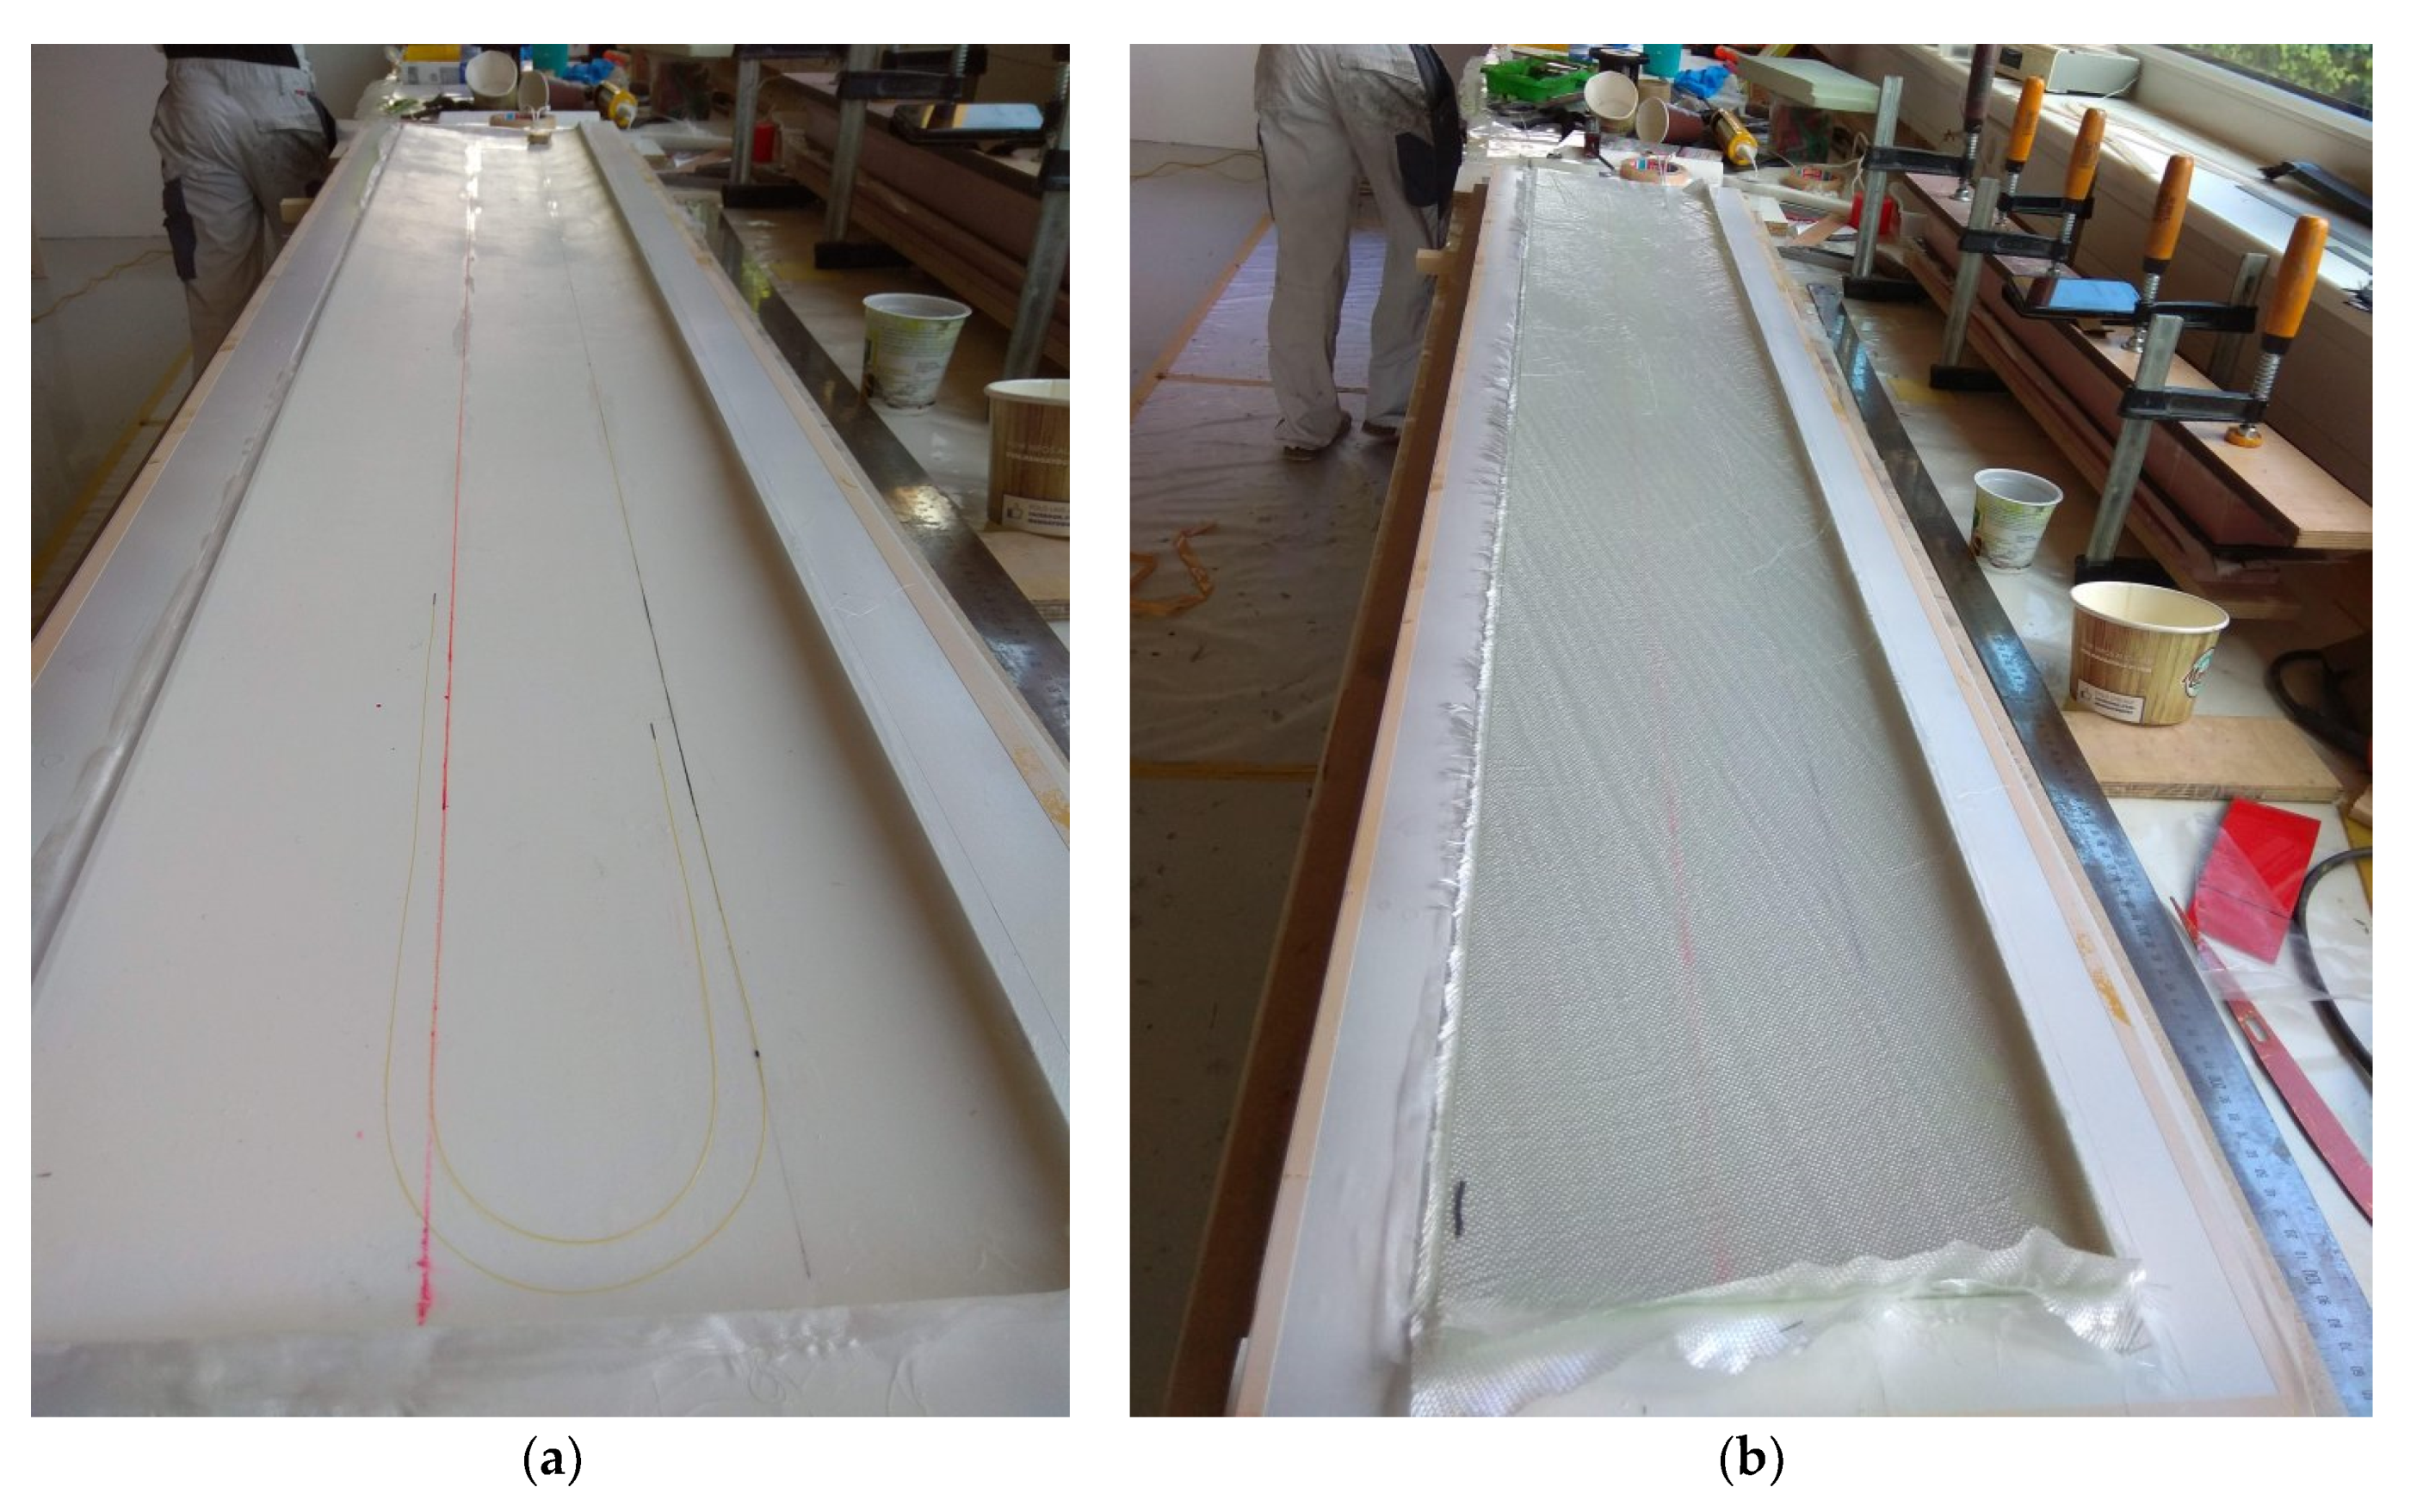
The first model comprised a non-swept wing of 1.0 m span, 0.2 m constant chord, and a symmetric airfoil [33]. It was built in collaboration with the Technical University of Delft, featuring a composite lay-up optimized for maximum static tip deflection, Figure 1a.
A forward swept wing featuring 1.6 m span and an average chord of 0.24 m was tested in the second test campaign [34], Figure 1b. For this wing, the objective function was also to maximize tip deflection, while being constrained to a maximum tip twist. Aeroelastic tailoring, in this case, allowed for a stiffness distribution suppressing the detrimental wash-in effect usually present in forward swept designs. Both wings were fully passive designs without trailing edge flaps or similar means.
Some very general lessons learned concerning the use and validity of measurement results from the previous experiments are summarized as follows:
- Aeroelastic experiments combine the uncertainties of structural, aerodynamic, and measurement disciplines;
- Eliminating uncertainties is key to finding realistic explanations for aeroelastic effects and elimination of uncertainties can be achieved by:
- o
- separating the disciplines in pretests where ideally only one discipline at a time is involved which allows for the identification of effects that can only be generated by the discipline investigated;
- o
- keeping disciplines as simple and predictable as possible.
Concerning aerodynamics, it has been observed that the behavior of the wind tunnel with freestream velocities larger than 40 to 50 m/s became somewhat unpredictable. The sources for possible errors are increasing freestream turbulence, quick heating up of the test section, and freestream flow, as well as noise.
Concerning structural layout the following has been observed:
- It is of utmost importance to gather and document as much information on the actual building process of the model as possible which allow for a meaningful update of the simulation models, and thus the elimination of a major source of uncertainties;
- Composite properties have to be determined, ideally, with every new material applied in the model;
- Clamping the model at the root and attaching it to the balance can be a large source for uncertainties which relates to the internal structure of the model itself, as well as the external structure required to transfer loads from the model to the balance.
One of the most prominent advancements to be addressed in KonTeKst as compared with previous projects was the consideration of flaps to investigate active load alleviation techniques. The additional complexity introduced by this again underlined the need to minimize uncertainties in the related aerodynamic and structure disciplines.
2.2. Model Specification
On the basis of the findings depicted in Section 2.1, and in particular in order to reduce modeling complexity while focusing on an adequate finite element and aerodynamic representation, a rather simple rectangular, non-swept wing layout was chosen over a complex shape, Figure 2. The span was set to the previously realized 1.6 m of the forward swept wing, representing a viable compromise amongst aspect ratio, wing flexibility, and the wind tunnel cross-sectional dimensions.
Two standard symmetric airfoils, NACA 0012 and NACA 0015, with a relative thickness of 12% and 15%, respectively, were preselected for application in the model. Considering a wing chord of 0.25 m, two-dimensional (2D) lift and drag polars for a Reynolds number range of ≈ 0.1 × 10⁶ to 1.0 × 10⁶ were computed with XFOIL, a two-dimensional interactive flow simulation software based on a 2D panel method coupled with a viscous boundary layer calculation [35], for both airfoils, NACA 0012 and NACA 0015, Figure 3. For the lower Reynolds number, both airfoils indicate a noticeably nonlinear lift curve slope, which basically is a result of laminar separation bubbles on the upper surface and a forward running transition location. As expected, on the one hand, the drag coefficients of the thicker NACA 0015 airfoil, in most areas, surpasses the ones for the thinner NACA 0012 airfoil. On the other hand, the maximum lift coefficients are higher for the NACA 0015, however, noting that Cl max is usually overestimated in XFOIL, so that only the relative distance between NACA 0012 and NACA 0015 should be considered here.
In favor of adequate space for sensor andactuator installation, but also to maintain a moderate aerodynamic behavior (higher Cl maximum) the NACA 0015 airfoil was chosen.
2.3. Flap Considerations
In order to estimate the capabilities of a regular camber changing trailing edge flap on the three-dimensional (3D) wing, a VSAERO model was generated. VSAERO is a potential flow panel software package for aerodynamic analysis of arbitrary shaped bodies, [36]. To this end, XFOIL was used to generate airfoil coordinates for a flap featuring 20% relative flap depth and a deflection of 10° (positive downward), with the hinge line being placed on the symmetry line of the airfoil. Simulating a single flap ranging from y = 1.2 to 1.5 m, the un-flapped airfoil coordinates were used from 0.0 to 1.19 m, and again from 1.51 m up to the tip at 1.6 m, thus, providing a transition zone from un-flapped to the flapped airfoil of 1.0 cm on both sides of the flap. As shown in Figure 4, the flap region is depicted which includes representation of off-body streamlines and pressure contours on the surface, for a representative angle of attack of 6.0°.
In order to exploit the capabilities of an active flap system, a more demanding flap architecture was also investigated, as described in the following. Instead of one, three trailing edge flaps with a relative depth of 20% were modeled, spanning approximately a region that on a standard-sized passenger aircraft would cover the trailing edge outside a possibly wing-mounted engine. Flap boundaries were chosen to be at y = 0.6, 0.9, 1.2, and 1.5 m. The outermost flap thus corresponded to the one investigated in the previous single flap case.
Table 1 lists the different flap deflection cases investigated in the following. The flap deflection is again achieved by the application of appropriate airfoil coordinates, as generated with XFOIL. As in the single flapped case, static calculations for an alpha range of 0° to 10° and velocities from 10 to 50 m/s were investigated. The relative change of lift force and root bending moment with respect to Case 1 (no flap deflection) is plotted in Figure 5. Closely investigating the relative lift forces, the plot on the left, on the one hand, reveals that a flap situated more towards the root is able to generate a larger lift force increase for a defined flap deflection than a flap on the outer wing. This can be explained by means of the lift (circulation) distribution. While circulation, and thus lift force as a result of pressure equalization, tend towards zero at the tip, the effectiveness in increasing overall circulation by deflecting a flap is the highest in the area of highest circulation. In the case of a rectangular, aerodynamically untwisted wing the circulation is the highest in the root. Thus, the closer a flap is positioned towards the root, the more effective it becomes in increasing lift.
The root bending moment, on the other hand, shows the opposite trend, the further outside the flap is located, the more additional root bending moment it can generate. Evidently, the increased lever arm dominates over the diminished lift force in the outer wing, meaning that a flap further outboard generates more root bending moment than an inboard flap, see Figure 5, plot on the right.
Moreover, the calculation indicates that combining flaps allows for a considerable increase in both, lift force and bending moment as compared with single flap deflections. Depending on the optimization objective this can be a significant assistance in achieving the desired goals or in increasing the performance.
3. Optimization
3.1. Analysis Model
The structural design was based on the experience gained in the first two wind tunnel campaigns. This involved the overall topological setup, as well as the employed materials. Regarding topology, a design with load carrying wing skins supported by a foam core was adapted. The material of choice for the wing skins was a unidirectional (UD) glass fiber with a surface weight of 220 g/m2. The main reason to prefer glass over carbon fiber were the higher strain allowables for the glass fiber, and thus an increased flexibility of the wing. Moreover, the application of this material in previously tested wind tunnel models increased the confidence concerning its applicability.
First analysis models incorporated a dedicated shear web which later was removed by virtue of its negligible contribution to the overall performance, while noticeably increasing the constructional effort.
The Nastran wing FE model was generated with the DLR in-house parametric modeling software ModGen [37], Figure 6. Again, based on experience gathered with previous wind tunnel models, the structural layout comprised load carrying composite skins and a foam core, represented in the FE model as shell and volume elements, respectively. ModGen also provided the doublet lattice (DLM) model, as well as the coupling model for the interconnection of the structural and aerodynamic model. In-depth descriptions of finite element models of similar topology, layout, and fidelity are found in [13], along with their application in [12,33,34].
Not being part of the optimization model, the flaps were modeled as beam rather than shell elements. To this end, a cross-sectional modeler was applied [38], providing among others a Timoshenko stiffness matrix, shear center location, mass matrix, and the center of gravity location. The structural layout of the flap comprised a closed cell construction with carbon fiber skins on top and bottom, supported by a foam core. Closing of the cell was achieved by a glass fiber tube, which also served as a bearing for the rotational shafts making up the flap hinge. A representation of the spanwise constant cross-section as being defined for the cross-sectional modeler is shown in Figure 7. Each flap was hinged at three points, maintaining the rotational degree of freedom about the hinge axis. The pushrod connection suppressing the rotational motion was simulated by means of a spring attachment.
In order to capture the dynamic behavior as accurate as possible, all masses known at this stage were considered in the finite element model. This incorporated structural data such as the fiber volume fraction achievable in the envisioned manufacturing process and identified in previously built models, as well as a precise representation of all non-structural masses such as sensors, sensor mounting devices, sensor cabling, actuators, and pushrods. Non-structural masses were modeled as point masses, attached via rigid body elements.
3.2. Structural Optimization
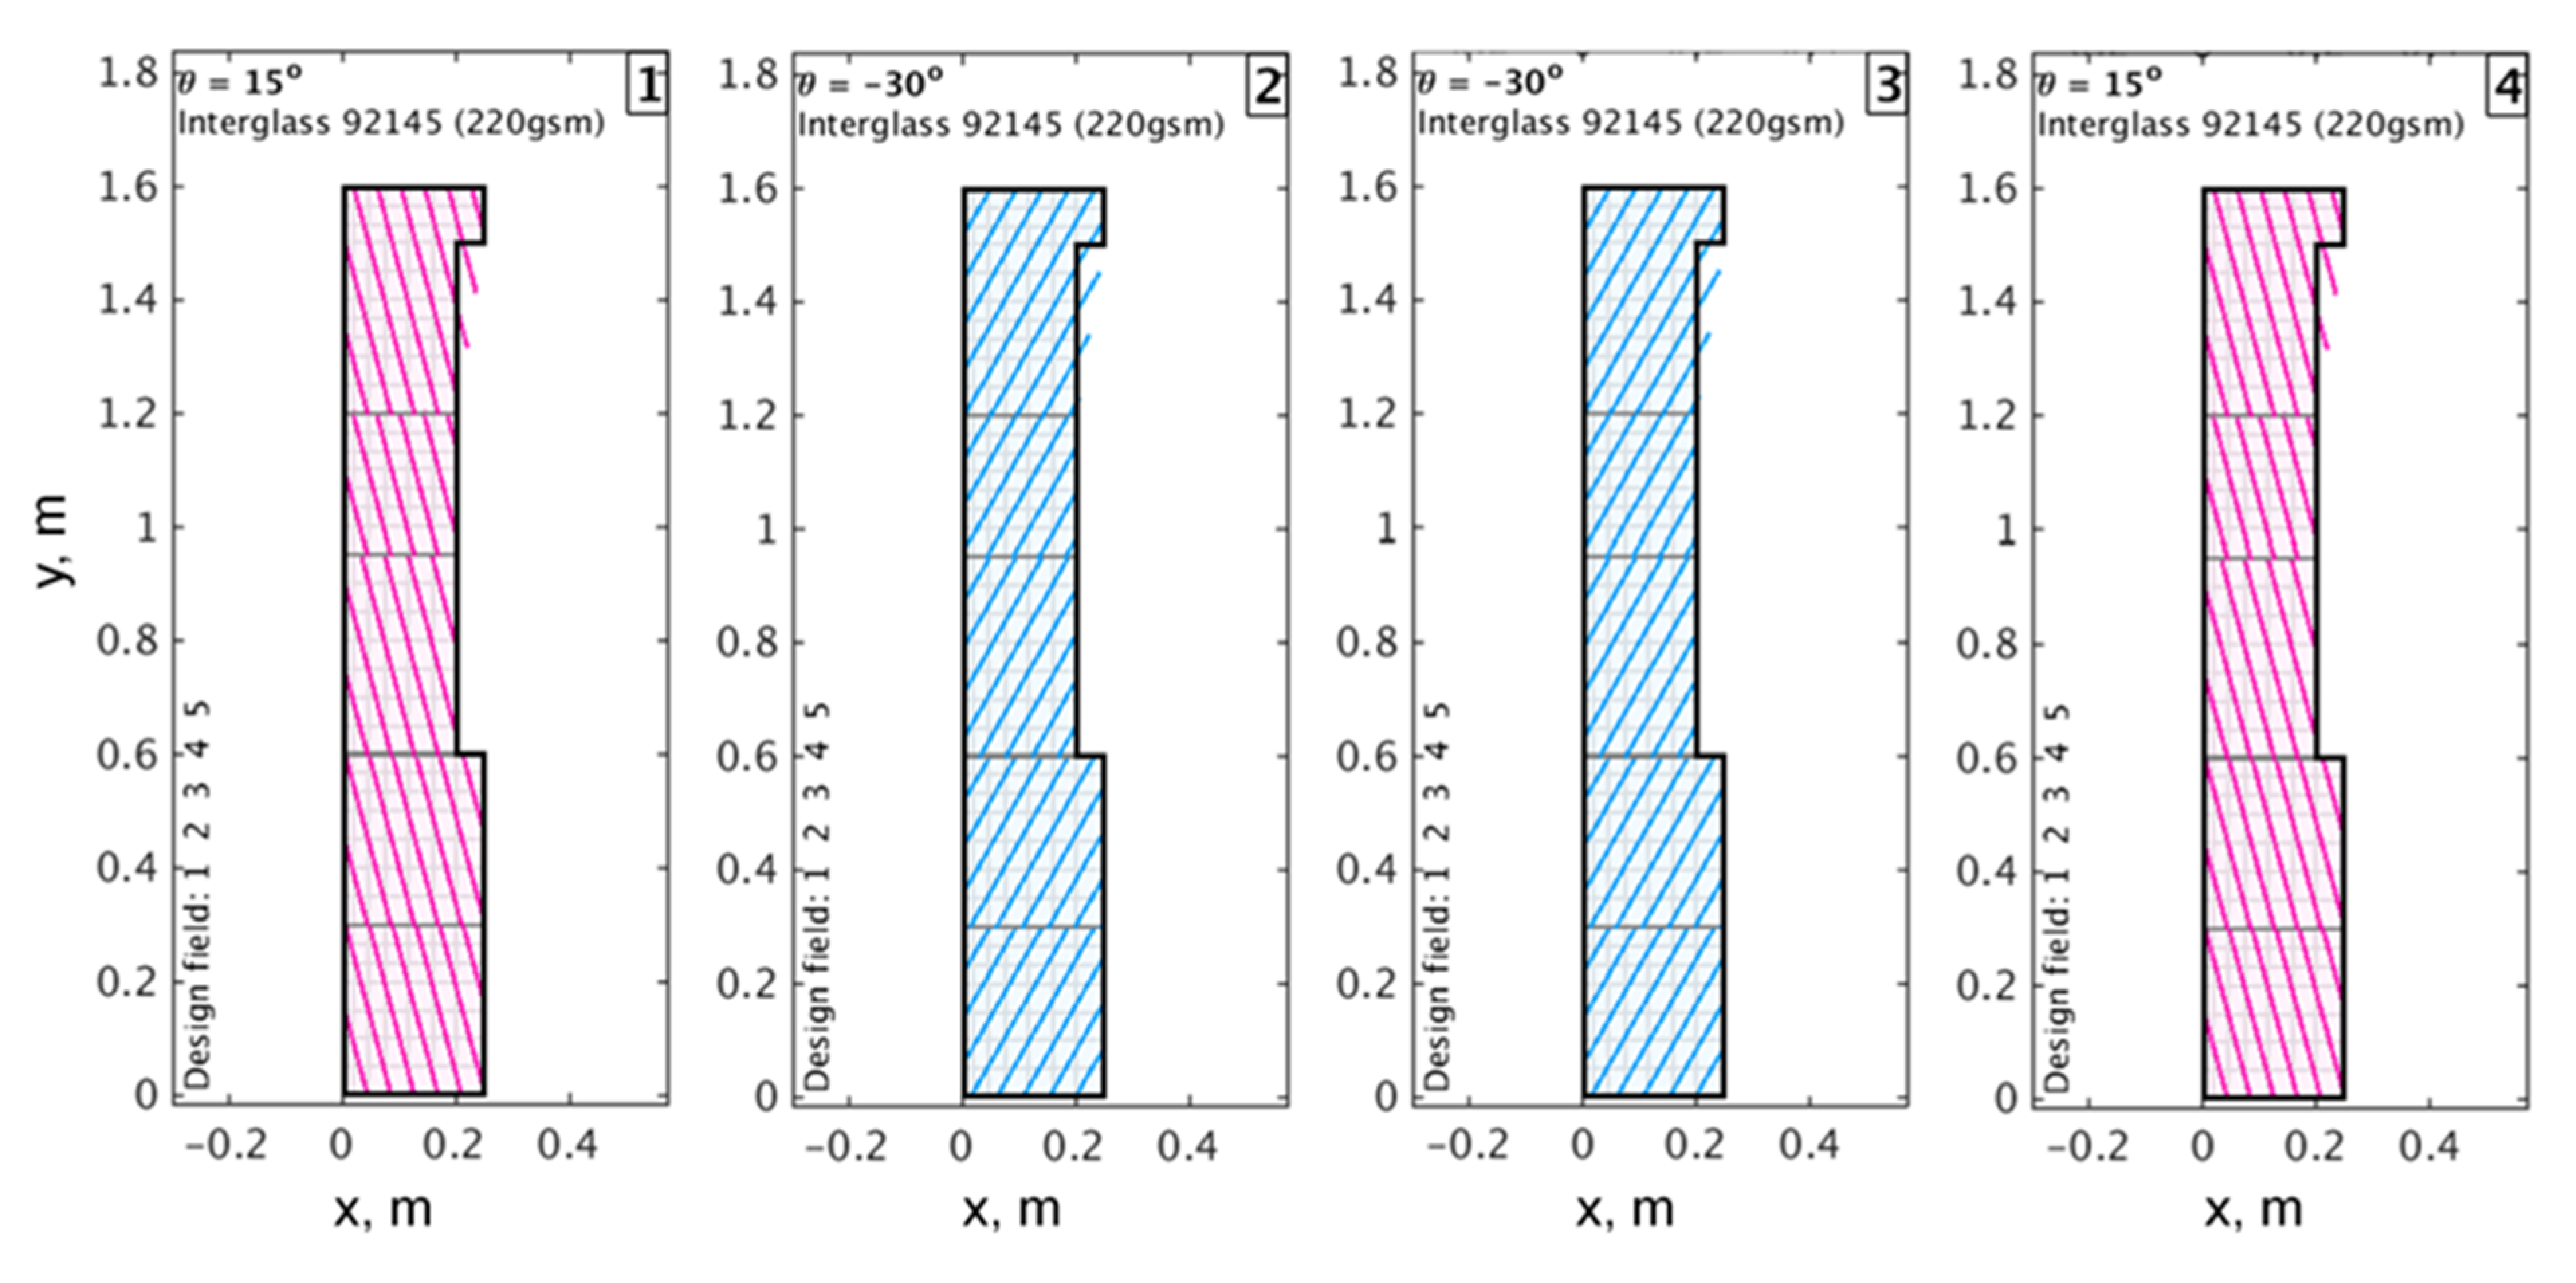
The wing skin lay-up was optimized in a two-step approach, which in detail is described in [13]. Applications of the process are shown in [12,13,33,39]. As a first step, the stiffness distribution represented as membrane and bending stiffness matrices was altered in dedicated design fields distributed in spanwise direction, a sample of which is shown in Figure 8. Serving as a sensible starting point, in a second step blended stacking sequences were optimized, eventually leading to lay-up tables directly suitable for the manufacturing process.
Responses considered in the optimization were mass, strain failure, aileron effectiveness, twist, displacement (both at the quarter chord and equidistant spanwise locations), divergence, and eigenfrequencies. The load cases considered are listed in Table 2, where α is the angle of attack and V the free stream velocity. Load cases 1003 and 1006 were devoted to model sizing, representing the ultimate loads to be expected when running the wind tunnel at maximum velocity and considering a failure of the angle of attack adjustment.
To identify which aeroelastic optimization objective would support most prominently the load alleviation controller, in total five objective functions were investigated in detail:
- aileron effectiveness maximization, ηmax;
- aileron effectiveness minimization, ηmin;
- tip deflection maximization, dmax;
- tip deflection minimization, dmin;
- 1st bending mode frequency minimization, fmin.
It was observed that in the case of the frequency minimization the optimizer simply increased the skin thickness in the outer wing, thereby introducing a large tip mass and, consequently, a decrease in eigenfrequency. To avoid this obvious, however unwished effect, but mainly to satisfy the lessons learned concerning a simple structural layout, the skin thickness eventually was fixed to 4 × 0.17 mm = 0.68 mm throughout the skins, representing four layers of UD glass fiber.
The optimized stiffness distribution in the upper wing skin for the aileron effectiveness maximization objective is plotted in Figure 9, showing the polar thickness normalized engineering modulus of elasticity , allowing for a visual assessment of the directional membrane stiffness distribution. It can be seen that in search of maximum aileron effectiveness, bending torsion coupling was introduced by tilting the main stiffness direction backward towards the tip. As a result, the twist towards the tip increases when bending the wing up (wash-in effect), thus, augmenting the lift force for a downward (positive) flap deflection. Eventually, aileron effectiveness is increased.
As mentioned before, the second optimization step consisted of a stacking sequence retrieval based on the continuous result from step one [40]. Due to the definite specification of four layers and the constraints involved in laminate blending, the resulting stacking sequence design was simplified to four continuous layers present throughout the entire skin. The stacking sequence for the ηmax objective is shown in Figure 10. The symmetric, unbalanced stack, identical for upper and lower skin, reflects the backward tilted main stiffness direction derived in optimization step one, Figure 9.
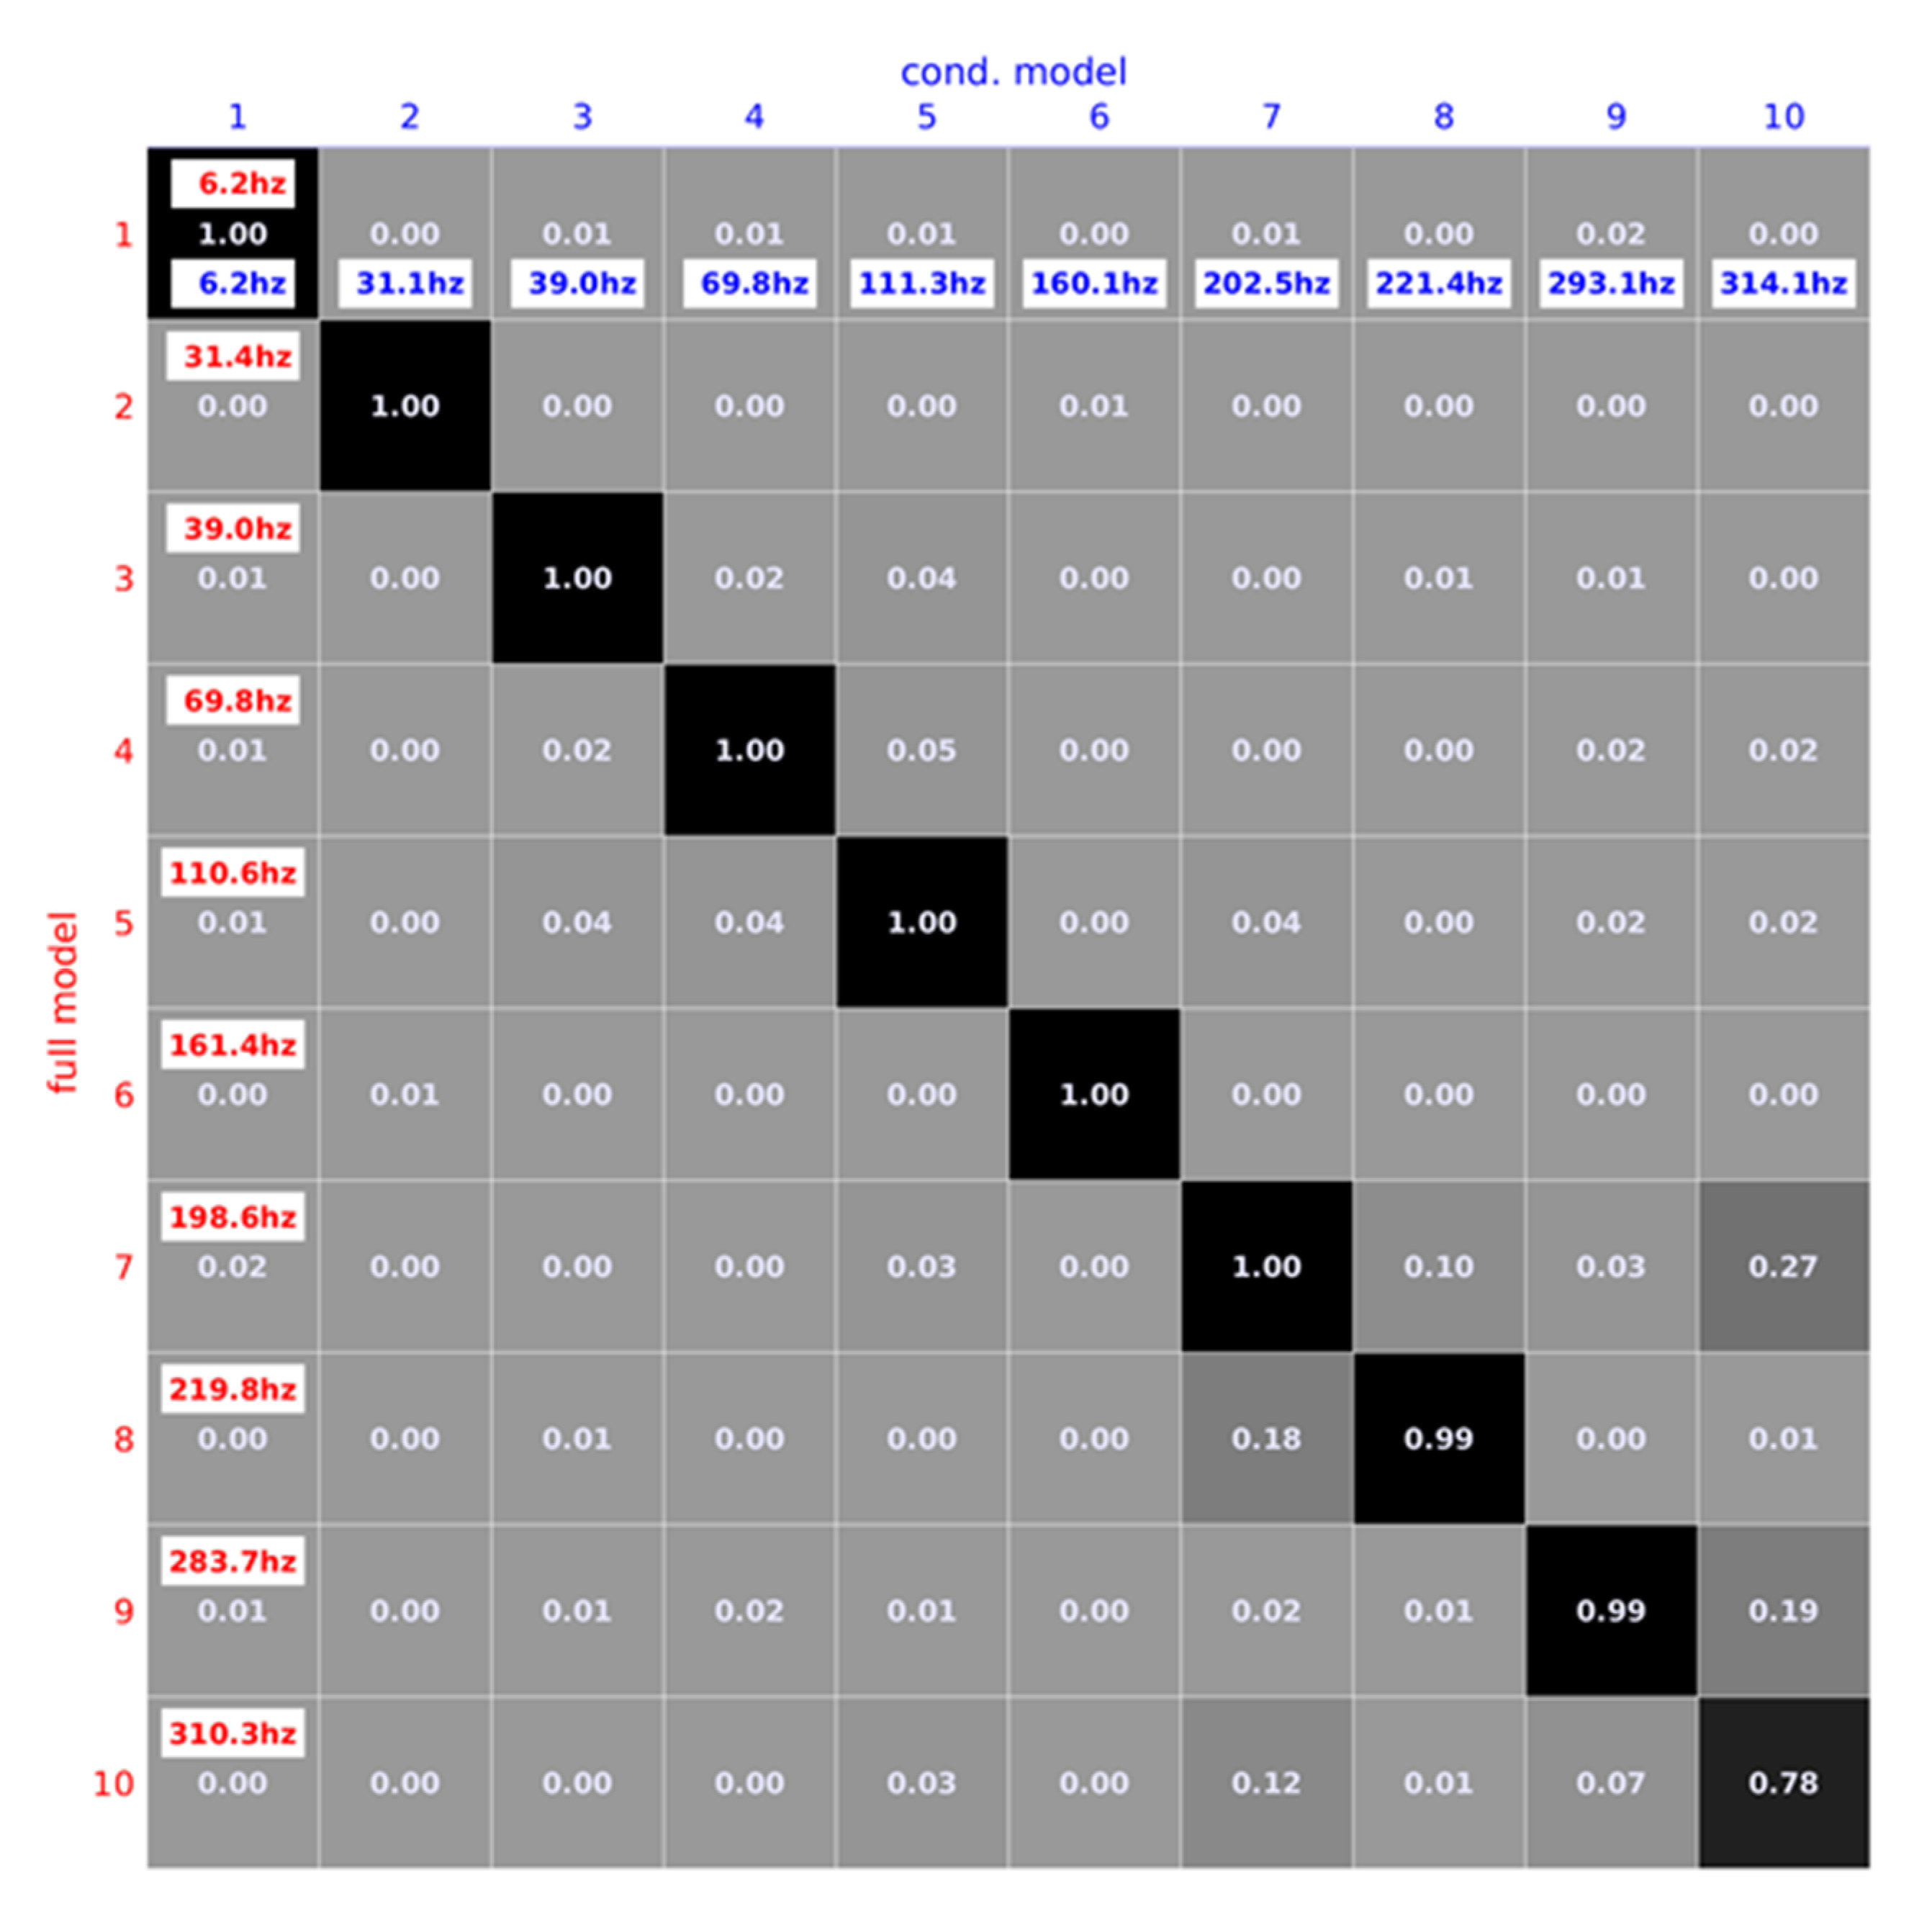
In order to reduce the number of degrees of freedom, a static Guyan reduction, as provided in Nastran, was applied. The models were condensed to 17 equally distributed grid points on the wing quarter chord, as well as five points along the hinge line of each flap. To validate the selection of reduced grid points, the so-called modal assurance criterion (MAC) matrix was computed for the full and the condensed model, Figure 11, showing a good agreement of the first 10 flexible modes.
The resulting mass and stiffness matrices could directly be implemented in the subsequent modal based controller design.
3.3. Controller Design and Model Selection
For each of the aeroelastically optimized models, a gust load alleviation controller was designed with the goal to maximize the reduction of the wing root bending moment (WRBM). This means that the absolute value of the WRBM is of minor interest but rather the ratio of the WRBM with and without active gust load alleviation.
3.3.1. State Space Modeling and Modal Decomposition
Accordingly, to design the gust load alleviation controllers, state space models of the different flexible wings are derived for a true airspeed of 40 m/s following the aeroelastic modeling procedure described in [41]. To that end, the eleven structural modes of lowest frequency were coupled with an unsteady aerodynamics model generated using the doublet lattice method [42] in combination with a rational function approximation according to Roger [43]. Note that for the structural model, the wing was clamped at its root and could only be rotated around its quarter chord line to simulate gust excitations. The derived aeroelastic model was augmented with eight vertical acceleration sensors, a strain gauge at the wing root, and three flap actuators which were modeled as second order Butterworth low-pass filters with a roll-off frequency of 15 Hz. The location of the sensors and flaps are depicted in Figure 12.
Carrying out a modal decomposition on the generated state space models of the different wing designs, the contribution of each aeroelastic mode to the WRBM is determined using the norm. Thereby, the pitch angle for gust simulations was considered as an input and the WRBM was considered as an output. As expected, the lightly damped wing bending modes have the largest contributions, where only the first one is within the assumed actuator bandwidth of 15 Hz. Hence, the objective of reducing the WRBM is translated to increasing the damping of the first wing bending mode.
3.3.2. Modal Control Using Blended Inputs and Outputs
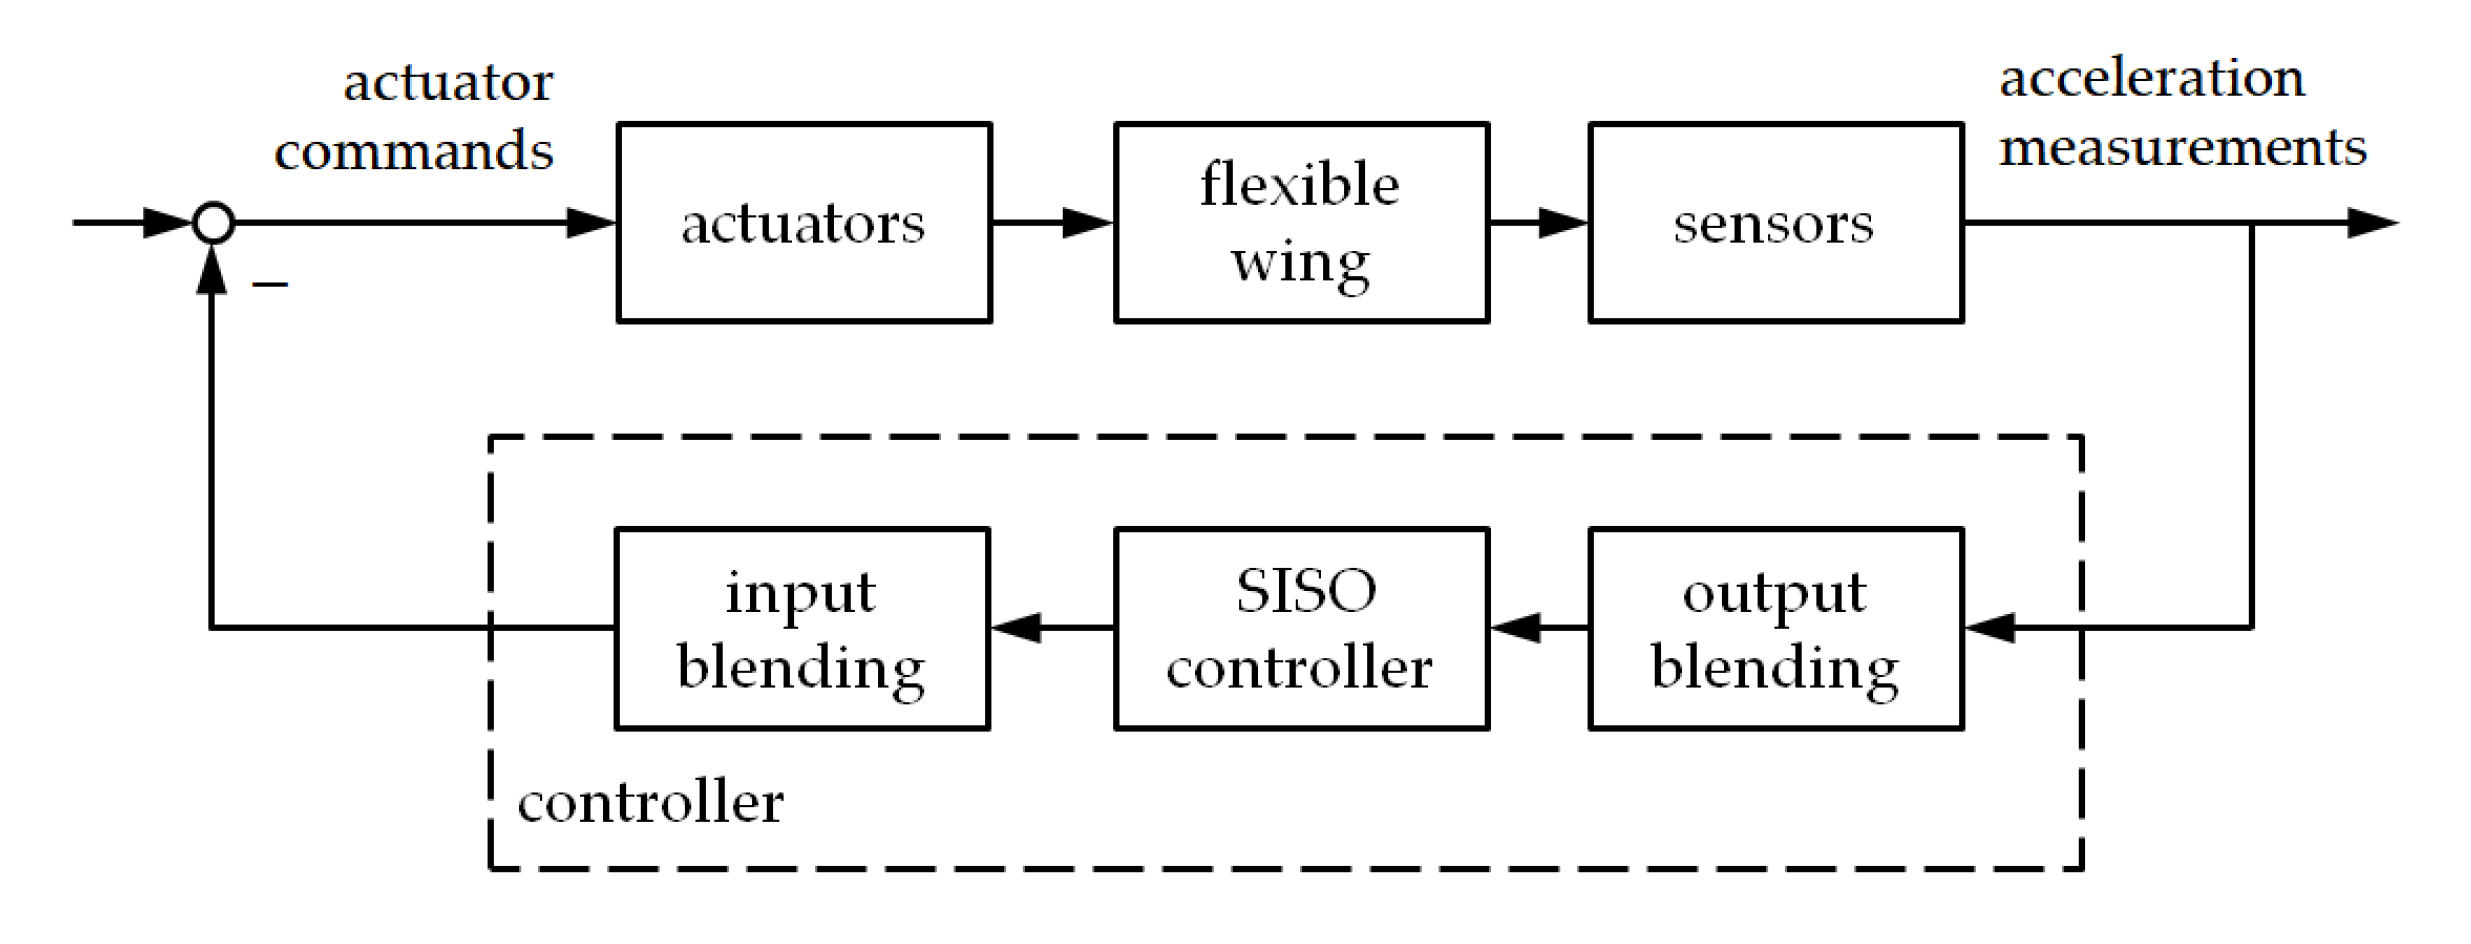
In order to damp the first wing bending mode, the modal control approach from [32] was used. The control approach suggests isolating the target mode(s) by blending control inputs and measurement outputs in an optimal way in order to enable a subsequent single-input single-output (SISO) controller design. In other words, the measurement outputs were weighted and summed up such that the resulting scalar signal best represents the response of target mode. Similarly, the control commands computed by the SISO controller were distributed to the given flap actuators in a way that the target mode was damped efficiently without exciting other modes. The resulting closed-loop interconnection is depicted in Figure 13.
Here, the control inputs are the command signals for the servos driving the three trailing edge flaps and the measurement outputs are eight vertical accelerations measured at the outer part of the wing, as depicted in Figure 13. The input and output blending vectors and with were derived for each model separately using the algorithm described in [32]. As SISO controller, a proportional-integral (PI) controller was chosen. The respective proportional and integral gains and were selected such that the first wing bending mode was damped without or only marginally affecting its natural frequency. Subsequently, the magnitude of the feedback gain was increased until the flap deflections reach a limit of for a harmonic gust excitation of 5° amplitude at resonance frequency, which is considered as a worst-case excitation. Note that for the selected feedback gains , the classical gain and phase margins at the blended inputs or blended outputs are far beyond common minimum requirements of 6 dB and 45°, respectively. Eventually, the resulting modal controller is given as
For more details on gust load alleviation controller design and tuning the reader is referred to [41].
3.3.3. Closed-Loop Evaluation
Closing the loop, the conjugate complex pole pair of the first wing bending mode is considerably damped, as visible in Figure 14, while the remaining system dynamics are not or only marginally affected. To evaluate the achieved WRBM reduction, a white noise vertical gust excitation was simulated by pitching the wing. For each model, the expected variance of the resulting WRBM with and without gust load alleviation controller was computed. The corresponding WRBM reduction is depicted in Figure 15. It can be seen that the wing statically optimized for maximum aileron effectiveness (ailmax) yields the maximum load reduction of around 28%. Furthermore, the open- and closed-loop frequency responses from the commanded pitch angle, representing the change in angle of attack for gust simulations to the WRBM, are compared in Figure 16. The achieved WRBM reduction not only at resonance frequency is clearly visible, where it is noted that the models optimized for minimum aileron effectiveness (ailmin) and minimum tip deflection (dispmin) are identical.
Additionally, the distance of the first wing bending mode to the residual modes in terms of natural frequency is the largest for the aileron effectiveness optimized model, as depicted in Figure 17. This is desirable since it implies reduced spillover effects, i.e., an undesired excitation of the residual modes, especially due to the limited actuator bandwidth. On the basis of all of these findings, the wing statically optimized for maximum aileron effectiveness was considered as best suitable for the wind tunnel test campaign and selected for manufacturing.
4. Manufacturing and Update
4.1. Model-Building and Sensor Installation
Deciding in favor of the model optimized for maximum aileron effectiveness, the wing was manufactured in a three-step procedure. First, the upper and lower wing skins were manufactured in CNC milled molds in a hand lay-up technique, including the fitting of fiber optical sensors for strain measurements, Figure 18. After curing the wing skins, in the spanwise direction, two types of foam were glued in the top and bottom halves, providing for the larger loads in the wing root by means of a denser foam in this area.
Second, the sensors, listed in Table 3, were installed in the upper and lower half of the wing skins. For that purpose, defined cutouts in the foam core were arranged in combination with tailor-made 3D printed mounting devices for the various sensor types. Eventually, in step three the model was closed by adhering upper and lower skin.
In a dedicated test setup, several servo drives, for flap actuation, were investigated and compared with respect to their dynamic behavior, eventually resulting in the selection of the “MKS HBL990” brushless digital servo [41].
Throughout the manufacturing process, all relevant masses, structural and non-structural were exactly measured and tabled, serving as an input to the subsequent model update.
4.2. Model Update
With the aeroelastic model constituting one of the main inputs to the controller design and the resulting actuator excitation driven by the control algorithm, an accurate representation of the aeroelastic model in the simulation is of great importance. Therefore, a finite element model update was performed based on a dynamic identification of the wind tunnel model. Since not only the wing itself, but also the wing mounting has a significant influence on the dynamic behavior, the test was performed with the model being mounted on the actual test stand, Figure 19.
The identification was conducted with 15 externally installed accelerometers, 13 of which pointed in the z-direction (out-of-plane) and two in the x-direction (in-plane). Eigenfrequencies, mode shapes, modal damping, and modal mass were identified by hammer testing.
After enhancing the finite element model with the masses identified during the manufacturing process, a model update based on the identified eigenfrequencies could be performed. The resulting eigenfrequencies are listed in Table 4 along with the generalized mass. Note that the updated finite element eigenfrequencies can also be found in Figure 11. The generalized masses are computed by diagonalizing the FE model mass matrix by a left and right multiplication with eigenvectors that are normalized to a unit value of their maximum displacement. The root of the resulting diagonal mass matrix contains the generalized masses of each mode on its diagonal. This definition matches with the experimentally evaluated generalized masses. The noticeable deviations, in particular for in-plane and torsion, are mainly attributed to the limited amount, positioning, and measurement direction of the applied accelerometers in the modal test.
The manual model update was achieved by first identifying the driving parameters which had the largest influence on the eigenfrequencies. It is important to note that only physically meaningful changes were made rather than arbitrary changes of stiffness and weight properties. Eventually, only very minor changes were required to achieve a good agreement between measured and computed eigenfrequencies of the first two bending and the torsional mode as follows:
- Between 1° and 2° adaption of the fiber angles in the 15° and −30° wing skin layers (compare Figure 10), owing to uncertainties in the hand lay-up;
- Adaption of a diminution factor accounting for fiber ondulation in the UD glass fiber layer from 0.9 to 1.0 (no ondulation effect);
- Foam core density reduction, resulting from varying declarations by the manufacturer.
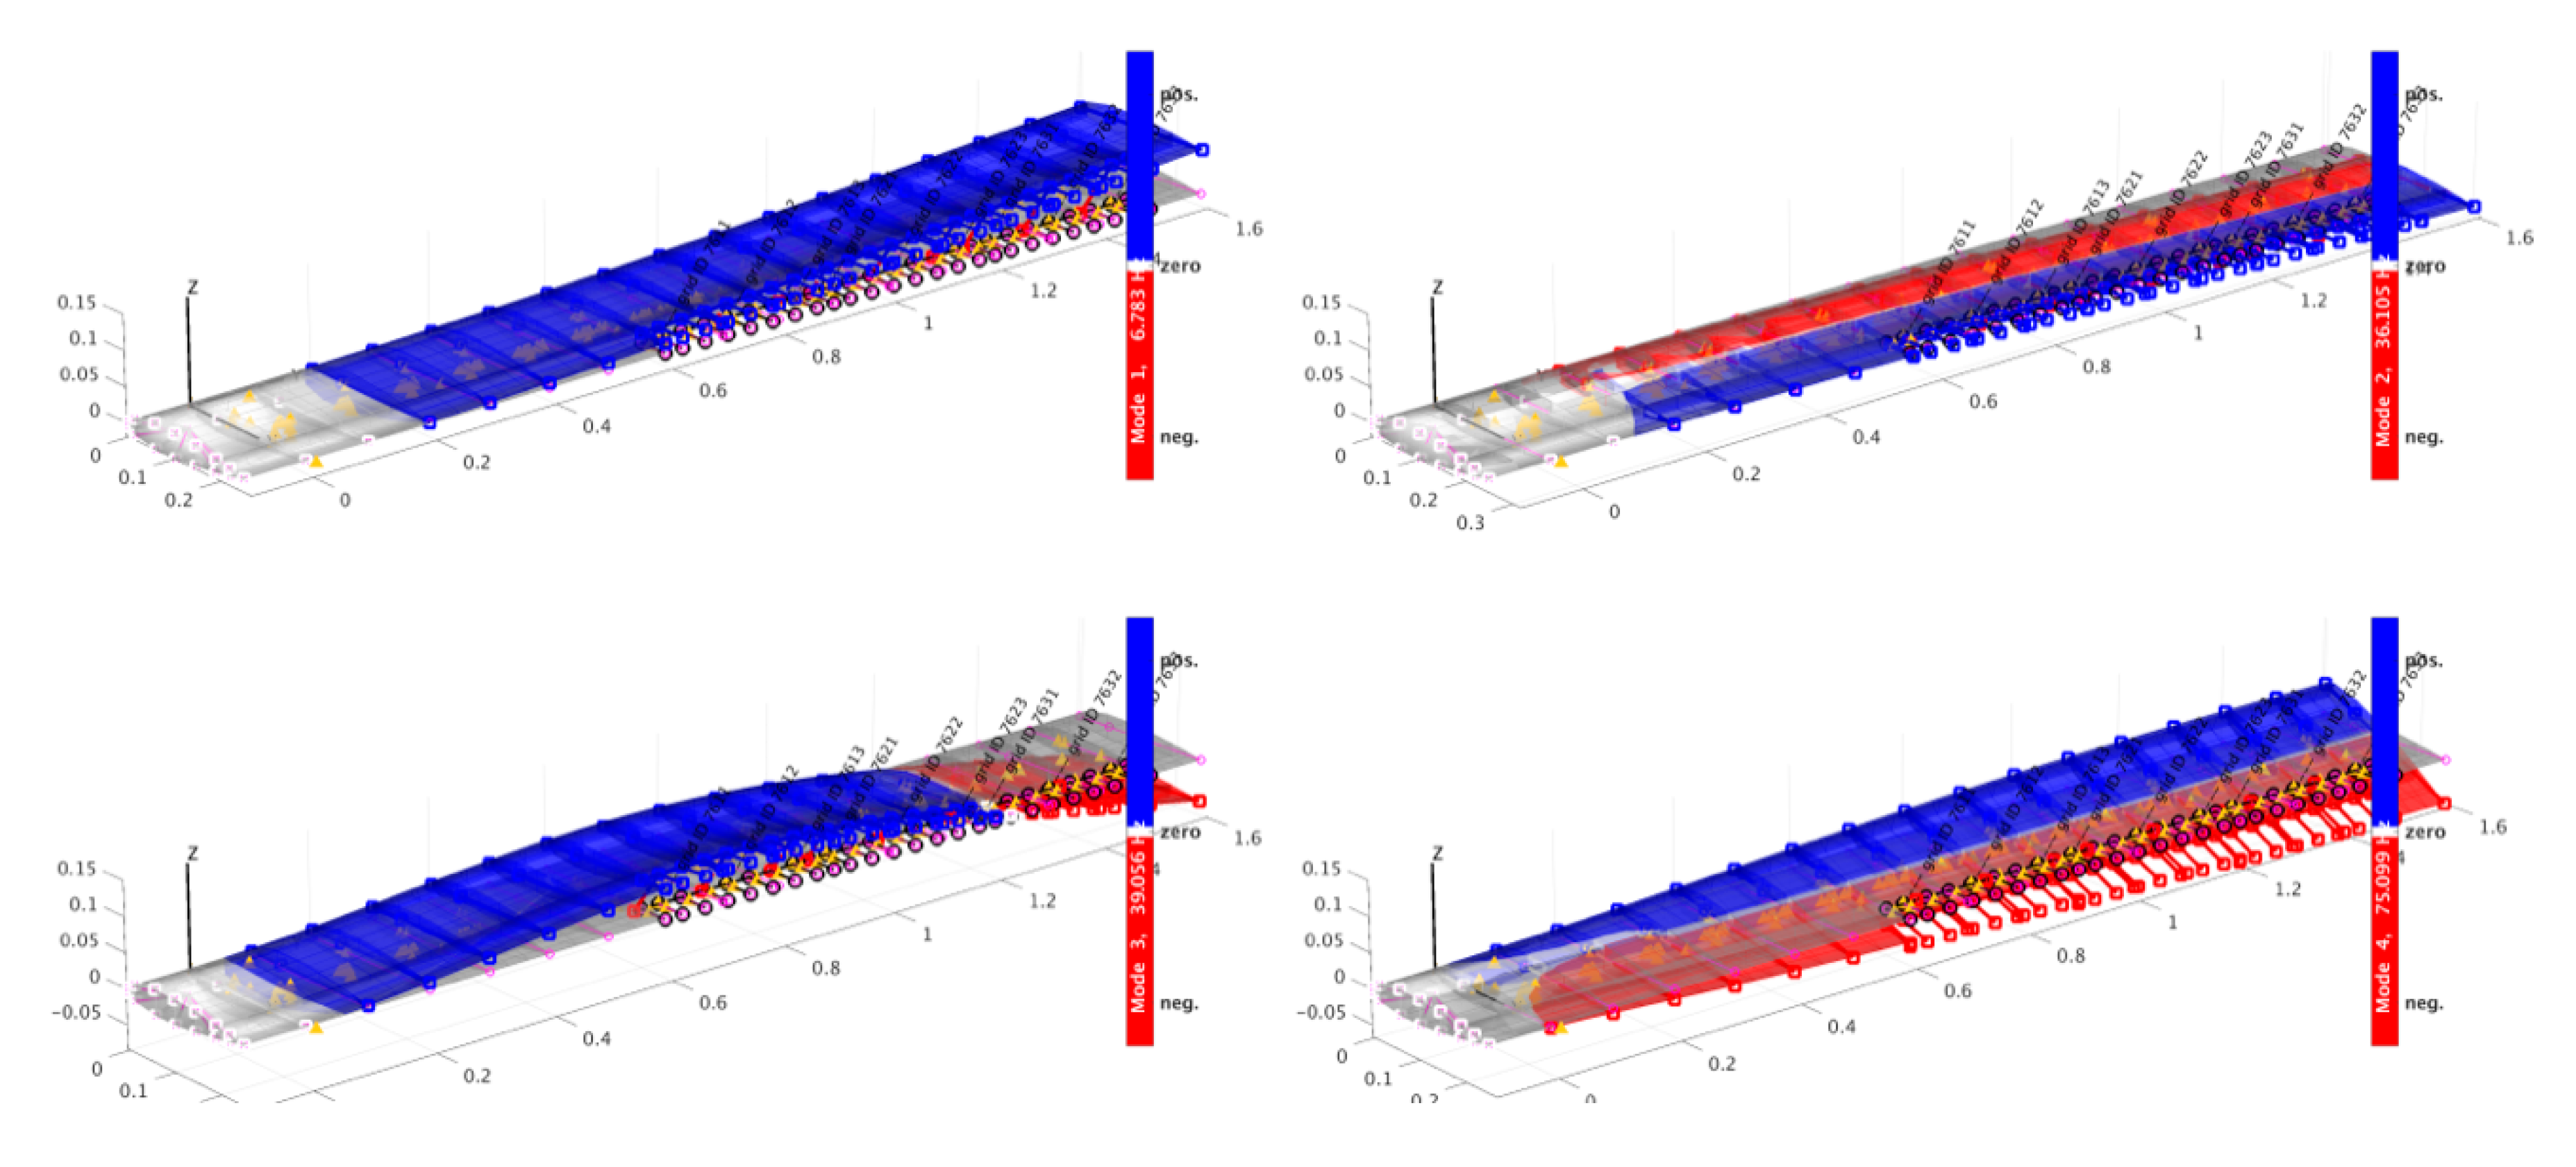
The first four mode shapes of the updated finite element model are shown in Figure 20. Still a large deviation in the first in-plane mode eigenfrequency persisted, however, noting that its contribution to the control algorithms was negligible anyway.
5. Conclusions and Outlook
The entire process of designing, building, and updating a wind tunnel model was presented in this paper. Starting with the general wing layout, complying with the requirements and goals pursued in the project, basic dimensions and aerodynamic parameters were defined. In order to evaluate the most promising combination of passive and active load alleviation means, various combinations of structural optimization and controller design were investigated. Deciding for the wing tailored for aileron effectiveness maximization, the wing was built, followed by an update of the finite element model. The wing was tested in a wind tunnel campaign in November 2018, first results of which were presented in [41].
The experience gained with respect to model optimization, manufacturing aspects, in particular concerning actuated flaps, but also regarding model mounting, should serve as valuable input for future test campaigns.
Author Contributions
Investigation, J.K.S.D., Y.M.M., J.L., M.P. and T.K.; Project administration, J.K.S.D.; Writing—original draft, J.K.S.D. and M.P.; Writing—review and editing, Y.M.M., J.L. and T.K. All authors have read and agreed to the published version of the manuscript.
Funding
This research received no external funding.
Conflicts of Interest
The authors declare no conflict of interest.
References
- Krüger, W. KonTeKst—Konfigurationen und Technologien für das Emissions- und Lärmarme Kurzstreckenflugzeug, Göttingen. 2015. Available online: https://www.dlr.de/fl/en/desktopdefault.aspx/tabid-1149/1737_read-47235/ (accessed on 16 March 2020).
- Starnes, J.H., Jr.; Haftka, R.T. Preliminary Design of Composite Wings for Buckling, Strength, and Displacement Constraints. J. Aircr. 1979, 16, 564–570. [Google Scholar] [CrossRef]
- Hollowell, S.J.; Dungundji, J. Aeroelastic Flutter and Divergence of Stiffness Coupled, Graphite Epoxy Cantilevered Plates. J. Aircr. 1984, 21, 69–76. [Google Scholar] [CrossRef]
- Green, J.A. Aeroelastic tailoring of aft-swept high-aspect-ratio composite wings. J. Aircr. 1987, 24, 812–819. [Google Scholar] [CrossRef]
- Shirk, M.H.; Hertz, T.J.; Weisshaar, T.A. Aeroelastic tailoring—Theory, practice, and promise. J. Aircr. 1986, 23, 6–18. [Google Scholar] [CrossRef]
- Vanderplaats, G.N.; Weisshaar, T.A. Optimum design of composite structures. Int. J. Numer. Methods Eng. 1989, 27, 437–448. [Google Scholar] [CrossRef]
- Stodieck, O.; Cooper, J.E.; Weaver, P.M. Interpretation of Bending/Torsion Coupling for Swept, Nonhomogenous Wings. J. Aircr. 2016, 53, 892–899. [Google Scholar] [CrossRef] [Green Version]
- Stodieck, O.; Cooper, J.E.; Weaver, P.M.; Kealy, P. Aeroelastic Tailoring of a Representative Wing Box Using Tow-Steered Composites. AIAA J. 2017, 55, 1425–1439. [Google Scholar] [CrossRef] [Green Version]
- Stodieck, O.; Cooper, J.E.; Weaver, P.M.; Kealy, P. Improved aeroelastic tailoring using tow-steered composites. Compos. Struct. 2013, 106, 703–715. [Google Scholar] [CrossRef]
- Stanford, B.K.; Jutte, C.V.; Coker, C.A. Aeroelastic Sizing and Layout Design of a Wingbox Through Nested Optimization. AIAA J. 2018, 27, 1–10. [Google Scholar]
- Jutte, C.; Stanford, B.K. Aeroelastic Tailoring of Transport Aircraft Wings: State-of-the-Art and Potential Enabling Technologies; NASA Langley Research Center: Hampton, VA, USA, 2014. [Google Scholar]
- Dillinger, J.K.S.; Klimmek, T.; Abdalla, M.M.; Gürdal, Z. Stiffness Optimization of Composite Wings with Aeroelastic Constraints. J. Aircr. 2013, 50, 1159–1168. [Google Scholar] [CrossRef]
- Dillinger, J. Static Aeroelastic Optimization of Composite Wings with Variable Stiffness Laminates; TU Delft, Delft University of Technology: Delft, The Netherlands, 2014. [Google Scholar]
- Livne, E. Integrated Aeroservoelastic Optimization: Status and Direction. Aiaa J. Aircr. 1999, 36, 122–145. [Google Scholar] [CrossRef]
- Livne, E. Future of airplane aeroelasticity. J. Aircr. 2003, 40, 1066–1092. [Google Scholar] [CrossRef]
- Mukhopadhyay, V. Historical perspective on analysis and control of aeroelastic responses. J. Guid. Control. Dyn. 2003, 26, 673–684. [Google Scholar] [CrossRef]
- Theis, J. Robust and Linear Parameter-Varying Control of Aeroservoelastic Systems; Technische Universität Hamburg-Harburg: Hamburg, Germany, 2018. [Google Scholar]
- Regan, C.D.; Jutte, C.V. Survey of Applications of Active Control Technology for Gust Alleviation and New Challenges for Lighter-Weight Aircraft; NASA: Bellevue, WA, USA, 2012.
- Disney, T.E. The C-5A Active Load Alleviation System. Am. Inst. Aeroenaut. Astronaut. 1977, 14, 81–86. [Google Scholar] [CrossRef]
- Menon, A.N.; Chakravarthy, A.; Gruenwald, B.C.; Yucelen, T.; Steck, J.E. Modeling and Control of Uncertain Hybrid Structure Flexible, Morphing Wings with Stability and Performance Guarantees. In Proceedings of the AIAA Scitech Forum, Orlando, FL, USA, 6–10 January 2020. [Google Scholar]
- Hashemi, K.E.; Alder, A.; Cramer, N.B.; Nguyen, N.T. Mode-based Sensing and Actuation Techniques for Multi-objective Flexible Aircraft Control. In Proceedings of the AIAA Scitech Forum, Orlando, FL, USA, 6–10 January 2020. [Google Scholar]
- Sanders, B.; Eastep, F.E.; Forster, E. Aerodynamic and Aeroelastic Characteristics of Wings with Conformal Control Surfaces for Morphing Aircraft. J. Aircr. 2003, 40, 94–99. [Google Scholar] [CrossRef]
- Murua, J.; Palacios, R.; Peiró, J. Camber effects in the dynamic aeroelasticity of compliant airfoils. J. Fluids Struct. 2010, 26, 527–543. [Google Scholar] [CrossRef] [Green Version]
- Arena, M.; Concilio, A.; Pecora, R. Aero-servo-elastic design of a morphing wing trailing edge system for enhanced cruise performance. Aerosp. Sci. Technol. 2019, 86, 215–235. [Google Scholar] [CrossRef]
- Kuzmina, S.; Ishmuratov, F.; Zichenkov, M.; Chedrik, V.; Amiryants, G.A.; Kulesh, V.; Malyutin, V.; Chedrik, A.; Timokhin, V.; Shalaev, S.; et al. Wind Tunnel Testing of Adaptive Wing Structures. Morphing Wing Technol. 2018, 1, 713–755. [Google Scholar]
- Pusch, M.; Knoblach, A. Integrated Optimization of Ailerons for Active Gust Load Alleviation. In Proceedings of the Internetional Forum on Aeroelasticity and Structural Dynamics (IFASD), St. Petersburg, Russia, 28 June–2 July 2015. [Google Scholar]
- Pusch, M. Allocation of Distributed Flaps for Gust Load Alleviation. In Proceedings of the Conference on Control, Technology and Application (CCTA), Kohala Coast, HI, USA, 27–30 August 2017. [Google Scholar]
- Nguyen, N.; Urnes, J. Aeroelastic Modeling of Elastically Shaped Aircraft Conceptual Wing Shaping Control for Drag Reduction. In Proceedings of the AIAA Atmospheric Flight Mechanics Conference, Minneapolis, MN, USA, 13–16 August 2012. [Google Scholar]
- Danowsky, B.; Thompson, P.; Lee, D. Modal Isolation and Damping for Adaptive Aeroservoelastic Suppression. In Proceedings of the AIAA Atmospheric Flight Mechanics Conference, Boston, MA, USA, 19–22 August 2013. [Google Scholar]
- Pusch, M. Aeroelastic Mode Control using H2-optimal Blends for Inputs and Outputs. In Proceedings of the 2018 AIAA Guidance Conference on Navigation and Control, Kissimmee, FL, USA, 8–12 January 2018. [Google Scholar]
- Pusch, M.; Ossmann, D. Blending of inputs and outputs for modal velocity feedback. In Proceedings of the 27th IEEE Mediterranean Conference on Control. and Automation, Akko, Israel, 1–4 July 2019. [Google Scholar]
- Pusch, M.; Ossmann, D. H2-optimal Blending of Inputs and Outputs for Modal Control. IEEE Trans. Control. Syst. Technol. 2019, 27, C3. [Google Scholar] [CrossRef] [Green Version]
- Meddaikar, Y.; Dillinger, J.; Sodja, J.; Mai, H.; de Breuker, R. Optimization, manufacturing and testing of a composite wing with maximized tip deflection. In Proceedings of the 57th AIAA/ASCE/AHS/ASC Structures Structural Dynamics, and Materials Conference, San Diego, CA, USA, 4–8 January 2016. [Google Scholar]
- Meddaikar, M.Y.; Dillinger, J.; Ritter, M.R.; Govers, Y. Optimization & Testing of Aeroelastically-Tailored Forward Swept Wings. In Proceedings of the IFASD 2017—International Forum on Aeroelasticity and Structural Dynamics, Como, Italy, 25–28 June 2017. [Google Scholar]
- Drela, M. XFOIL: An Analysis and Design System for Low Reynolds Number Airfoils. In Low Reynolds Number Aerodynamics; Springer: Berlin, Heidelberg, 1989. [Google Scholar]
- Maskew, B. PROGRAM VSAERO: A Computer Program for Calculating the Non-Linear Aerodynamic Characteristics of Arbitrary Configurations: User’s Manual; NASA: Bellevue, WA, USA, 1982.
- Klimmek, T. Parameterization of topology and geometry for the multidisciplinary optimization of wing structures. In Proceedings of the CEAS 2009—European Air and Space Conference, Manchester, UK, 6–29 October 2009. [Google Scholar]
- Ferede, E.; Abdalla, M. Cross-sectional modelling of thin-walled composite beams. In Proceedings of the 55th AIAA/ASME/ASCE/AHS/ASC Structures, Structural Dynamics, and Materials Conference, National Harbor, Maryland, 13–17 January 2014. [Google Scholar]
- Dillinger, J.; Abdalla, M.M.; Meddaikar, Y.M.; Klimmek, T. Static Aeroelastic Stiffness Optimization of a Forward Swept Composite Wing with CFD Corrected Aero Loads. In Proceedings of the International Forum on Aeroelasticity and Structural Dynamics (IFASD 2015), Saint Petersburg, Russia, 28 June–2 July 2015. [Google Scholar]
- Meddaikar, Y.; Irisarri, F.-X.; Abdalla, M. Blended Composite Optimization combining Stacking Sequence Tables and a Modified Shepard’s Method. In Proceedings of the 11th World Congress on Structural and Multidisciplinary Optimization (Submitted), Sydney, Australia, 7–12 June 2015. [Google Scholar]
- Pusch, M.; Ossmann, D.; Kier, T.; Tang, M.; Lübker, J.; Dillinger, J. Aeroelastic Modeling and Control of an Experimental Flexible Wing. In Proceedings of the Guidance, Navigation and Control (GNC), Milano, Italy, 3–5 April 2019. [Google Scholar]
- Albano, E.; Rodden, W. A doublet-lattice method for calculating lift distributions on oscillating surfaces in subsonic flows. Aiaa J. 1969, 7, 279–285. [Google Scholar] [CrossRef]
- Roger, K. Airplane Math Modelling Methods for Active Control Design. In Proceedings of the 44th AGARD Structures and Materials Panel, AGARD-CP-228, Lisbon, Portugal, 21 April 1977; pp. 4.1–4.11. [Google Scholar]
Figure 1.
Wind tunnel models in previous test campaigns, maximum tip delection objective. (a) Rect. wing. (b) Forward swept wing.
Figure 1.
Wind tunnel models in previous test campaigns, maximum tip delection objective. (a) Rect. wing. (b) Forward swept wing.

Figure 2.
Wing geometry.

Figure 3.
Two-dimensional (2D) polars for NACA 0012 and NACA 0015 free transition.

Figure 4.
VSAERO model including a trailing edge flap ranging from y = 1.2 to 1.5 m.

Figure 5.
Relative increase of lift and root bending moment for various angles of attack (independent of flight velocity), and various flap deflection cases.
Figure 5.
Relative increase of lift and root bending moment for various angles of attack (independent of flight velocity), and various flap deflection cases.

Figure 6.
Wing finite element model.

Figure 7.
Flap cross-section.

Figure 8.
Design fields.

Figure 9.
Optimized stiffness distribution for the ηmax objective model.

Figure 10.
Stacking sequence for the ηmax objective model.

Figure 11.
Modal assurance criterion (MAC) matrix of full and condensed model.

Figure 12.
Position of flaps and sensors on the wing.

Figure 13.
Control loop interconnection.

Figure 14.
Comparison of open- and closed-loop poles of the first wing bending mode of the different aeroelastic models.
Figure 14.
Comparison of open- and closed-loop poles of the first wing bending mode of the different aeroelastic models.

Figure 15.
Comparison of the achieved wing root bending moment (WRBM) reduction at a true airspeed of 40 m/s evaluated in terms of the expected variance for a white noise gust excitation simulated by pitching the wing.
Figure 15.
Comparison of the achieved wing root bending moment (WRBM) reduction at a true airspeed of 40 m/s evaluated in terms of the expected variance for a white noise gust excitation simulated by pitching the wing.

Figure 16.
Comparison of open-loop (light) and closed-loop (dark) wing root bending moment.

Figure 17.
Transfer functions from pitch angle to wing tip acceleration.

Figure 18.
Placement of the strain fiber (a) and a 15° unidirectional (UD) glass layer (b).

Figure 19.
Model mounted on test stand outside the tunnel.

Figure 20.
Mode shapes of the updated finite element model.


Table 1.
Case definition for different flap combinations.
| Flap | Spanwise Boundaries | Case | |||||
|---|---|---|---|---|---|---|---|
| 1 | 2 | 3 | 4 | 5 | 6 | ||
| 1 | 0.6–0.9 m | 0° | 0° | 0° | 10° | 0° | 10° |
| 2 | 0.9–1.2 m | 0° | 0° | 10° | 0° | 10° | 10° |
| 3 | 1.2–1.5 m | 0° | 10° | 0° | 0° | 10° | 10° |
Table 2.
Optimization load cases.
| Case | Type | α | V | Flap 1 | Flap 2 | Flap 3 |
|---|---|---|---|---|---|---|
| 1001 | αfixed | 5.0° | 50.0 m/s | 0.0° | 0.0° | 0.0° |
| 1002 | αfixed | 10.0° | 50.0 m/s | 0.0° | 0.0° | 0.0° |
| 1003 | αfixed | 15.0° | 60.0 m/s | 0.0° | 0.0° | 0.0° |
| 1004 | αfixed | −5.0° | 50.0 m/s | 0.0° | 0.0° | 0.0° |
| 1005 | αfixed | −10.0° | 50.0 m/s | 0.0° | 0.0° | 0.0° |
| 1006 | αfixed | −15.0° | 60.0 m/s | 0.0° | 0.0° | 0.0° |
| 1007 | divergence | % | % | 0.0° | 0.0° | 0.0° |
| 1008 | eigenfrequency | % | % | 0.0° | 0.0° | 0.0° |
| 1009 | ail. eff. | % | 50.0 m/s | 0.0° | 0.0° | 1.0° |
| 1010 | ail. eff. | % | 50.0 m/s | 0.0° | 1.0° | 0.0° |
| 1011 | ail. eff. | % | 50.0 m/s | 1.0° | 0.0° | 0.0° |
Table 3.
Sensors installed in the model.
| Type | Position | Output |
|---|---|---|
| accelerometer | 25% chord: x = 62.5 mm y = [300/600/900/1200/1500] mm | acceleration in z |
| - | 60% chord: x = 150.0 mm y = [300/600/900/1200/1500] mm | acceleration in z |
| - | x = 62.5 mm y = [900/1500] mm | acceleration in x |
| 3-axes accelerometer | 25% chord: x = 62.5 mm y = [200/400/600/900/1200/1500] mm | acceleration in xyz |
| strain gauge | upper skin: x = [62.5/150] mm y = [50/50] mm | 3-axes strain rosette |
| - | lower skin: x = [62.5/150/150] mm y = [50/50/600] mm | 3-axes strain rosette |
| strain fiber | 25% and 60% chord: y = [0–1600] mm | strain in fiber direction |
| potentiometer | installed in hinge line of each flap | flap deflection |
Table 4.
Comparison of eigenfrequency (f) and generalized mass (m) of selected structural modes.
| Mode Name | Measurement | Initial FEM | Updated FEM | |||
|---|---|---|---|---|---|---|
| f (Hz) | m (kg) | f (Hz) | m (kg) | f (Hz) | m (kg) | |
| 1st wing bending | 6.9 | 0.83 | 6.2 | 0.77 | 6.8 Hz | 0.81 |
| 1st in-plane | 26.8 | 1.24 | 31.4 | 0.75 | 36.1 Hz | 0.78 |
| 2nd wing bending | 39.0 | 0.90 | 39.0 | 0.61 | 39.1 Hz | 0.77 |
| 1st torsion | 75.2 | 0.29 | 69.8 | 0.90 | 75.1 Hz | 0.82 |
© 2020 by the authors. Licensee MDPI, Basel, Switzerland. This article is an open access article distributed under the terms and conditions of the Creative Commons Attribution (CC BY) license (http://creativecommons.org/licenses/by/4.0/).
Share and Cite
MDPI and ACS Style
Dillinger, J.K.S.; Meddaikar, Y.M.; Lübker, J.; Pusch, M.; Kier, T. Design and Optimization of an Aeroservoelastic Wind Tunnel Model. Fluids 2020, 5, 35. https://doi.org/10.3390/fluids5010035
AMA Style
Dillinger JKS, Meddaikar YM, Lübker J, Pusch M, Kier T. Design and Optimization of an Aeroservoelastic Wind Tunnel Model. Fluids. 2020; 5(1):35. https://doi.org/10.3390/fluids5010035
Chicago/Turabian StyleDillinger, Johannes K. S., Yasser M. Meddaikar, Jannis Lübker, Manuel Pusch, and Thiemo Kier. 2020. "Design and Optimization of an Aeroservoelastic Wind Tunnel Model" Fluids 5, no. 1: 35. https://doi.org/10.3390/fluids5010035