The Effect of Single Dielectric Barrier Discharge Actuators in Reducing Drag on an Ahmed Body


1
Department of Aerospace Engineering & Center of Excellence for Computational Aerospace Engineering, AmirKabir University, Tehran 1591634311, Iran
2
Department of Mechanical Engineering, University of Alberta, Edmonton, AB T6G 1H9, Canada
*
Author to whom correspondence should be addressed.
†
These authors contributed equally to this work.
Fluids 2020, 5(4), 244; https://doi.org/10.3390/fluids5040244
Submission received: 27 October 2020
/
Revised: 4 December 2020
/
Accepted: 10 December 2020
/
Published: 15 December 2020
(This article belongs to the Special Issue Aerodynamics and Aeroacoustics of Vehicles)
Abstract
:The feasibility of a single dielectric barrier discharge (SDBD) actuator in controlling flow over an Ahmed body, representing a simplified car model, has been numerically and experimentally investigated at Reynolds numbers of and . The Ahmed body had slant angles of and . The results showed that SDBD actuators could significantly enhance the aerodynamic performance of the Ahmed body. Several arrangements of the actuators on the slant surface and the rear face of the model were examined to identify the most effective arrangement for drag reduction. This arrangement resulted in an approximately drag reduction. This improvement in aerodynamic performance is attributed to the alteration of three-dimensional wake structures due to the presence of SDBD, which coincides with surface pressure variations on the slant and rear faces of the Ahmed body.
1. Introduction
Controlling the flow around ground vehicles has been studied extensively for drag reduction purposes, leading to improved efficiency. The combination of these improvements reduces the fuel consumption in ground transportation vehicles, and thus green-house gas emissions associated with them. The wake behind vehicles is a major source of pressure drag [1], which has motivated the development of many passive and active flow manipulation methods. Examples of passive flow control systems are increasing the surface roughness, vortex generators and porous layers to change the vortical structures in the wake. Uniform or pulsed jet flow and synthetic jets are also used to accelerate the flow away from the body or split the vortical structures in the wake [2,3]. Based on previous studies in this field, it is clear that active flow control methods can be efficiently used for reducing the drag force of bluff bodies. For instance, Prakash et al. (2018) [4] reduced the drag on an Ahmed body by up to using suction and jet blowing techniques. Dielectric barrier discharge (DBD) actuators are used as an active control method based on this principle. The characteristics of these actuators, such as their applicability on a surface without significant change of geometry, fast time-response, small size and static parts, motivate their applications in a wide range of industries [5].
DBD actuators can modify the laminar-to-turbulent transition, and reattach separated flows or enhance jet vectoring, at low Reynolds numbers (, where L is the body chord, is the velocity and is the viscosity). Non-thermal electric discharges can be useful for studying drag reduction, lift enhancement or noise reduction [6]. DBD actuators reattach the separated flow over the bluff body by increasing the transferred momentum into the boundary layer, which results in a smaller wake [7,8]. The performance of an actuators is related to specifications of the dielectric material, the configuration of the upper and encapsulated electrodes and the applied frequency and voltage [9]. Their impact on momentum in the boundary layer is limited, and therefore they appear to be more efficient in lower freestream velocities, or lower Reynolds numbers [8]. Consequently, most of the past studies (e.g., Boucinha et al. (2011) [6], Do et al. (2007) [7]) have been limited to velocities corresponding to .
Several recent investigations have focused on different applications of DBD actuators, such as controlling the separated flow around bluff bodies [7,10] and turbine and compressor blades [11]. However, only a few studies have focused on scrutinizing the effectiveness of DBD flow control actuators around cars. Boucinha et al. (2011) [6] reduced the drag (up to ) by implementing several SDBD actuators in the separated region on the rear slant of the Ahmed body. They also reported that the implementation of several actuators does not bring any advantages in comparison to using one actuator close to the separation line. Khalighi et al. (2016) [8] achieved a drag reduction of by implementing the DBD actuators on all four sides of a rounded square, back Ahmed body model. They also showed that, due to the small size, SDBD actuators are more effective at lower Reynolds numbers. Shadmani et al. (2018) [12] used steady and unsteady actuation to confirm that DBD actuators cannot suppress the separated flow on the rear slant of the Ahmed body at the Reynolds number of .
Guilmineau et al. (2018) [13] showed that the Reynolds averaged Navier–Stokes (RANS), detached eddy simulation (DES) and improved delay detached eddy simulation (IDDES) models can successfully simulate the flow field around the Ahmed body with the slant angle of . However, the experimental results imply that RANS modeling is incapable of predicting the flow features around the Ahmed body with a slant angle. This may be attributed to the large pressure gradients in the wake of a slant angle compared to the higher slant angles. The predicted wake regions behind the Ahmed body with RANS, DES and IDES methods are significantly different [13]. Therefore, we performed experimental tests to verify the accuracy of the computational analysis in predicting the drag coefficient of the Ahmed body with a slant angle of .
Implementing the actuators at some positions can increase drag due to additional surface roughness. Despite this, there have not been comprehensive studies, to the best of the authors’ knowledge, which focus on the effect of the positions of these actuators on the wall roughness and drag reduction. The main objective of this study was to find the optimum position for an SDBD actuator to achieve the maximum efficiency in controlling flow around the Ahmed body. Thus, the effects of implementing SDBD actuators in five positions at Reynolds numbers of and were numerically studied using an Ahmed body with slant angles of and . The experiments focuses on the slant angle of at Reynolds number . The problem description for the numerical method and experimental setup are discussed in Section 2 and Section 3, respectively. The validation of numerical results is presented and discussed in Section 4, followed by the results in Section 5. A summary of the main conclusions is provided in Section 6.
2. Numerical Simulations
The Reynolds averaged Navier–Stokes (RANS) equations are solved in three-dimensions using the SST model [13]. Details of the formulation can be found in Menter et al. (1994) [14]. In sinusoidal-driven DBDs, the boundary layer molecules remain approximately at ambient temperature [5]. Therefore, the energy equation can be neglected in simulations and only the continuity Equation (1) and modified momentum Equation (2) equations are considered.
Here, is the time-averaged velocity, is time-averaged pressure, is the stress tensor and is air density. Moreover, represents the amount of momentum produced by DBD actuators. An appropriate turbulence model for the current case study must be able to predict non-equilibrium turbulence due to the existence of large vortex structures, separation and a boundary layer that may evolve rapidly [15]. Based on Guilmineau et al. (2018) [13], the shear stress transport (SST) model was selected for simulations. ANSYS Fluent was used as the based solver for the simulations. Furthermore, the electric field and body force exerted by actuators were calculated using a User Defined Function (UDF) code. The distribution of charge density was considered as a boundary condition on the surface of the Ahmed body.
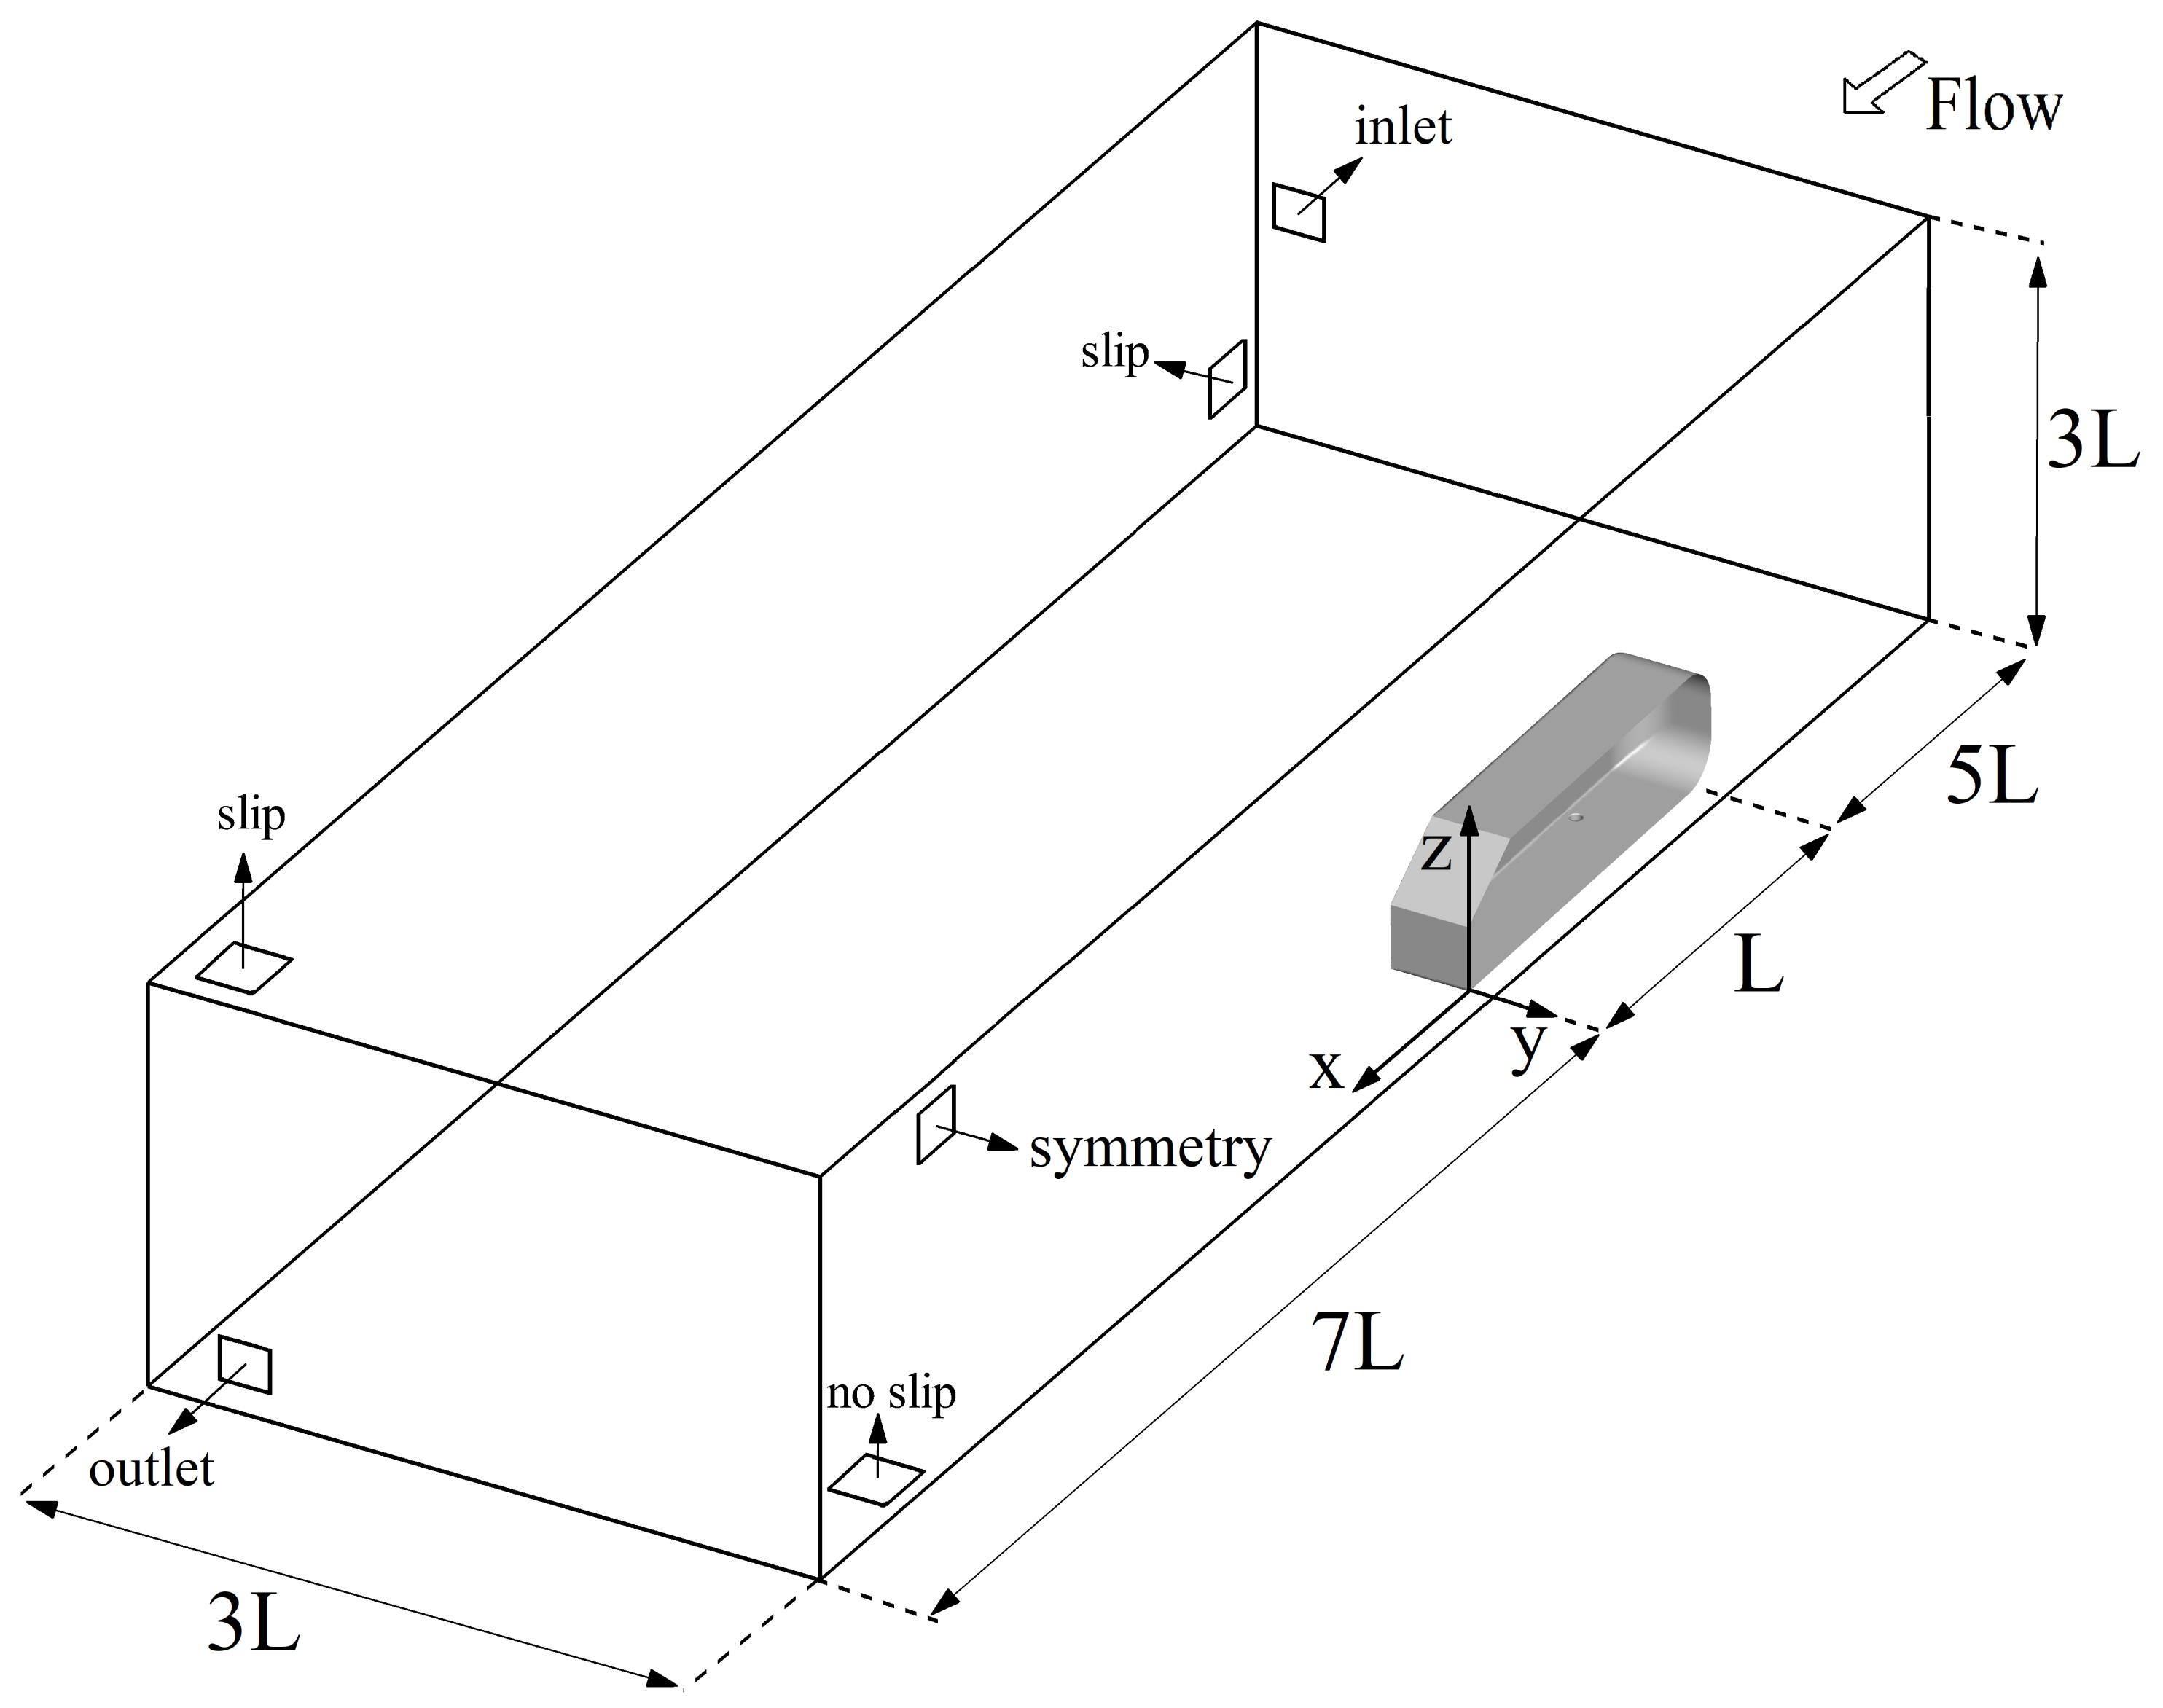
The computational domain in Figure 1 was designed following Mohammadikalakoo et al. (2020) [16], such that the upstream and downstream distances from the Ahmed body are and , where L is the model length. The distances of the model from the upper and side surfaces were . The computational domain shown in Figure 1 consisted of three subdomains for mesh refinement, such that the grid around the Ahmed body is most refined, and it expands as it gets closer to the boundaries. The mesh refinement facilitates capturing the flow field characteristics on the slant surface, especially the flow separation and reattachment before and after applying the DBD actuators. The spatial and temporal discretizations were both second-order accurate with the central difference scheme used for the former and the backward Euler method employed for the latter. The convergence criteria were based on the maximum residual root-mean-square of for the momentum equation.
The implications of spatial grid quality was determined using three cases: grid 1, grid 2 and grid 3. Table 1 shows the drag coefficients for different grids for the Ahmed body with slant angles and at a Reynolds number of . Mesh refinement from grid 2 ( elements) to grid 3 ( elements) had no considerable effect on the drag coefficient, where the variation was less than . Furthermore, Figure 2 shows that the difference of streamwise velocity in the wake of the Ahmed body model for grid 2 and grid 3 is less than . Thus, the mesh in grid 3 is sufficient for accurately capturing the mean drag coefficient of the Ahmed body.
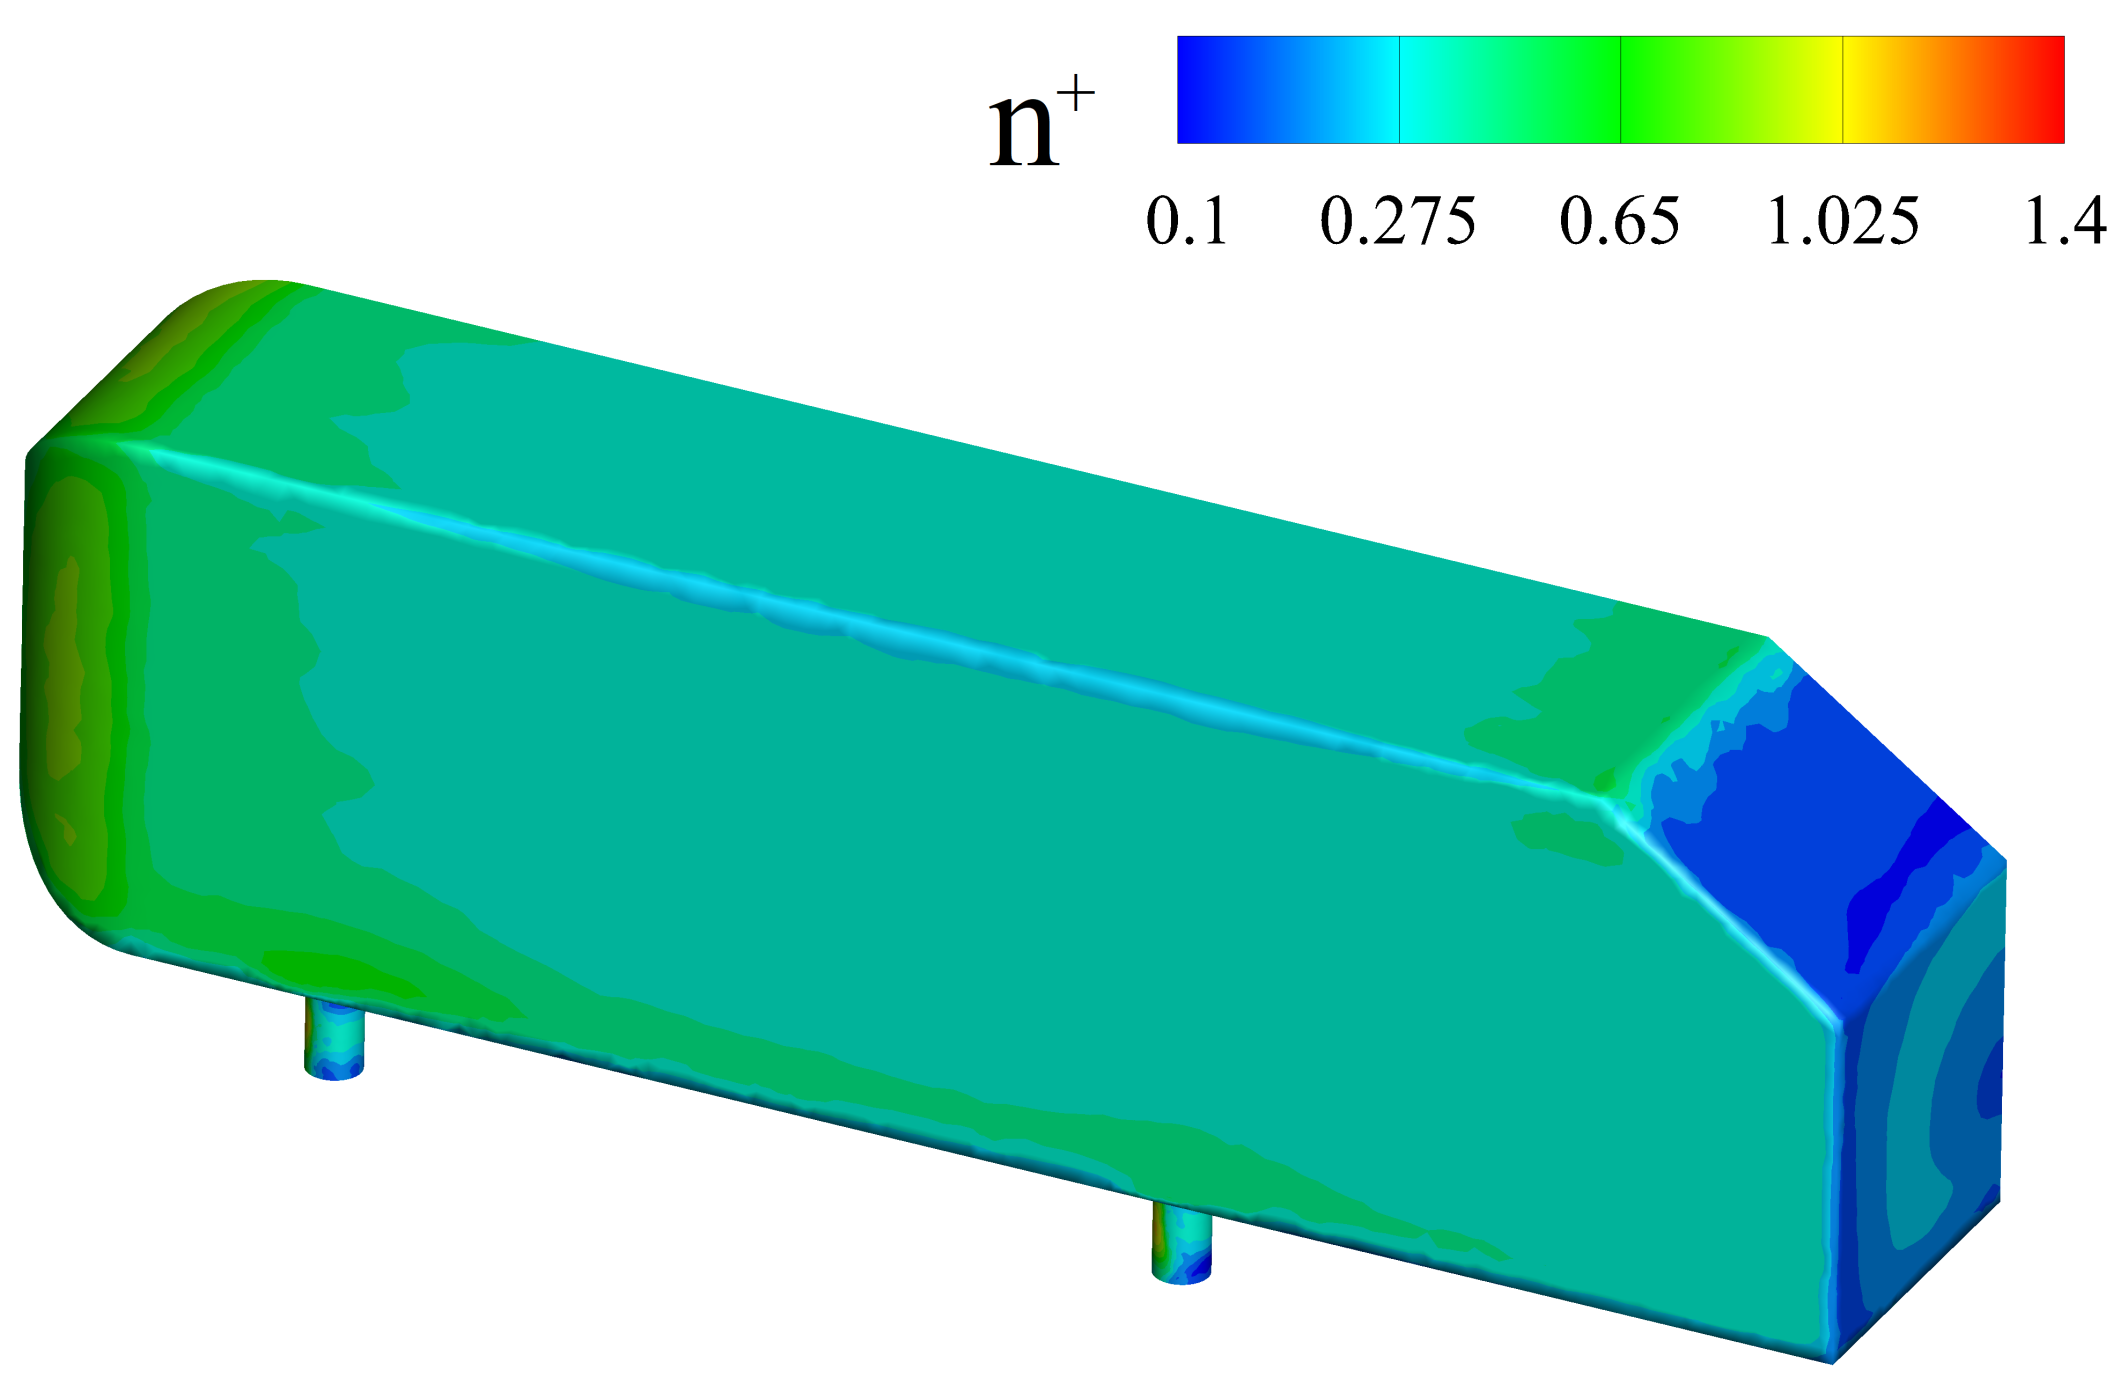
The non-dimensional wall distance () near the walls of the model is presented in Figure 3, which identifies that the average value of is less than 5. Thus, grid 3 is sufficient for accurately estimating the viscose sublayer [17].
SDBD Actuator Model
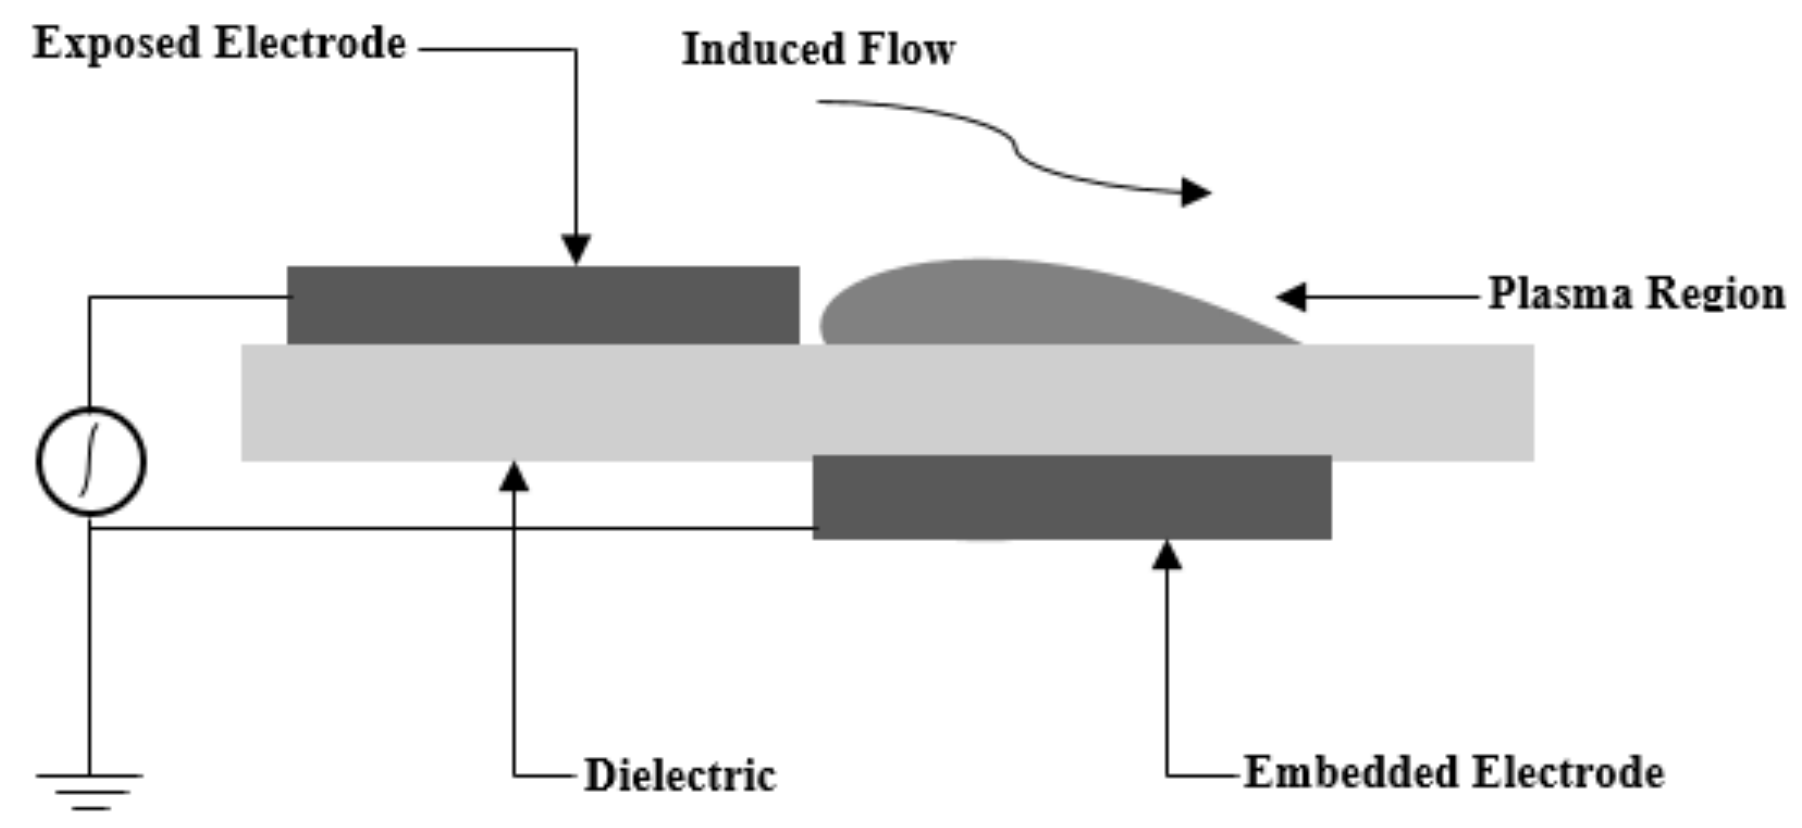
A single DBD actuator consists of two electrodes and one dielectric layer (see Figure 4). The high voltage alternating current (AC) power is applied to the upper (exposed) electrode, while the lower (encapsulated) electrode is covered with a dielectric layer that is electrically grounded. When the magnitude of the applied voltage is sufficiently high, air molecules near the upper electrode ionize, and due to the electrical field generated by electrodes, the momentum of the fluid increases.
We used the method introduced by Suzen and Huang (2005) [18] for simulating the body force produced by the actuators, which employs an electrostatic model with Gaussian charge distribution. The body force was calculated using the Lorentz equation, which was added to the Navier-Stokes equations as a body force term in Equation (2),
where is the net charge, shows the electric field and is the electric potential. The model of Huang (2005) [18] uses two independent equations to simulate the electric potential field and charge density:
where is the Debye length and represents the relative permittivity of the dielectric.
The AC voltages () applied to the electrodes are calculated using the following equation:
where is the maximum amplitude of the applied voltage and is a sinusoidal function wave given by:
where is the frequency of the AC voltage applied to the electrodes. In the current study, we considered steady state conditions, which transform into a square wave format [19]. The maximum amplitude of the applied voltage and frequency for numerical simulations are set as , 10 and 12 kV and kHz, respectively. The normal gradient of net charge () is calculated using the following equation over the embedded electrode:
where is the maximum net charge density and is the Gaussian distribution function defined as:
Here, is the location parameter indicating the maximum value of in the x direction for , and is the scale parameter determining the excited region width along the dielectric surface over the embedded electrode. It is important to note that is set to 0 for other regions, including the outer boundary, exposed electrode and the interface between air and the dielectric surface. The aforementioned parameters were selected based on the calibrations that followed the work of Bouchmal (2011) [19], which generalized the parameters as a function of . Thus, it is possible to use fixed constants for different Reynolds numbers while keeping constant.
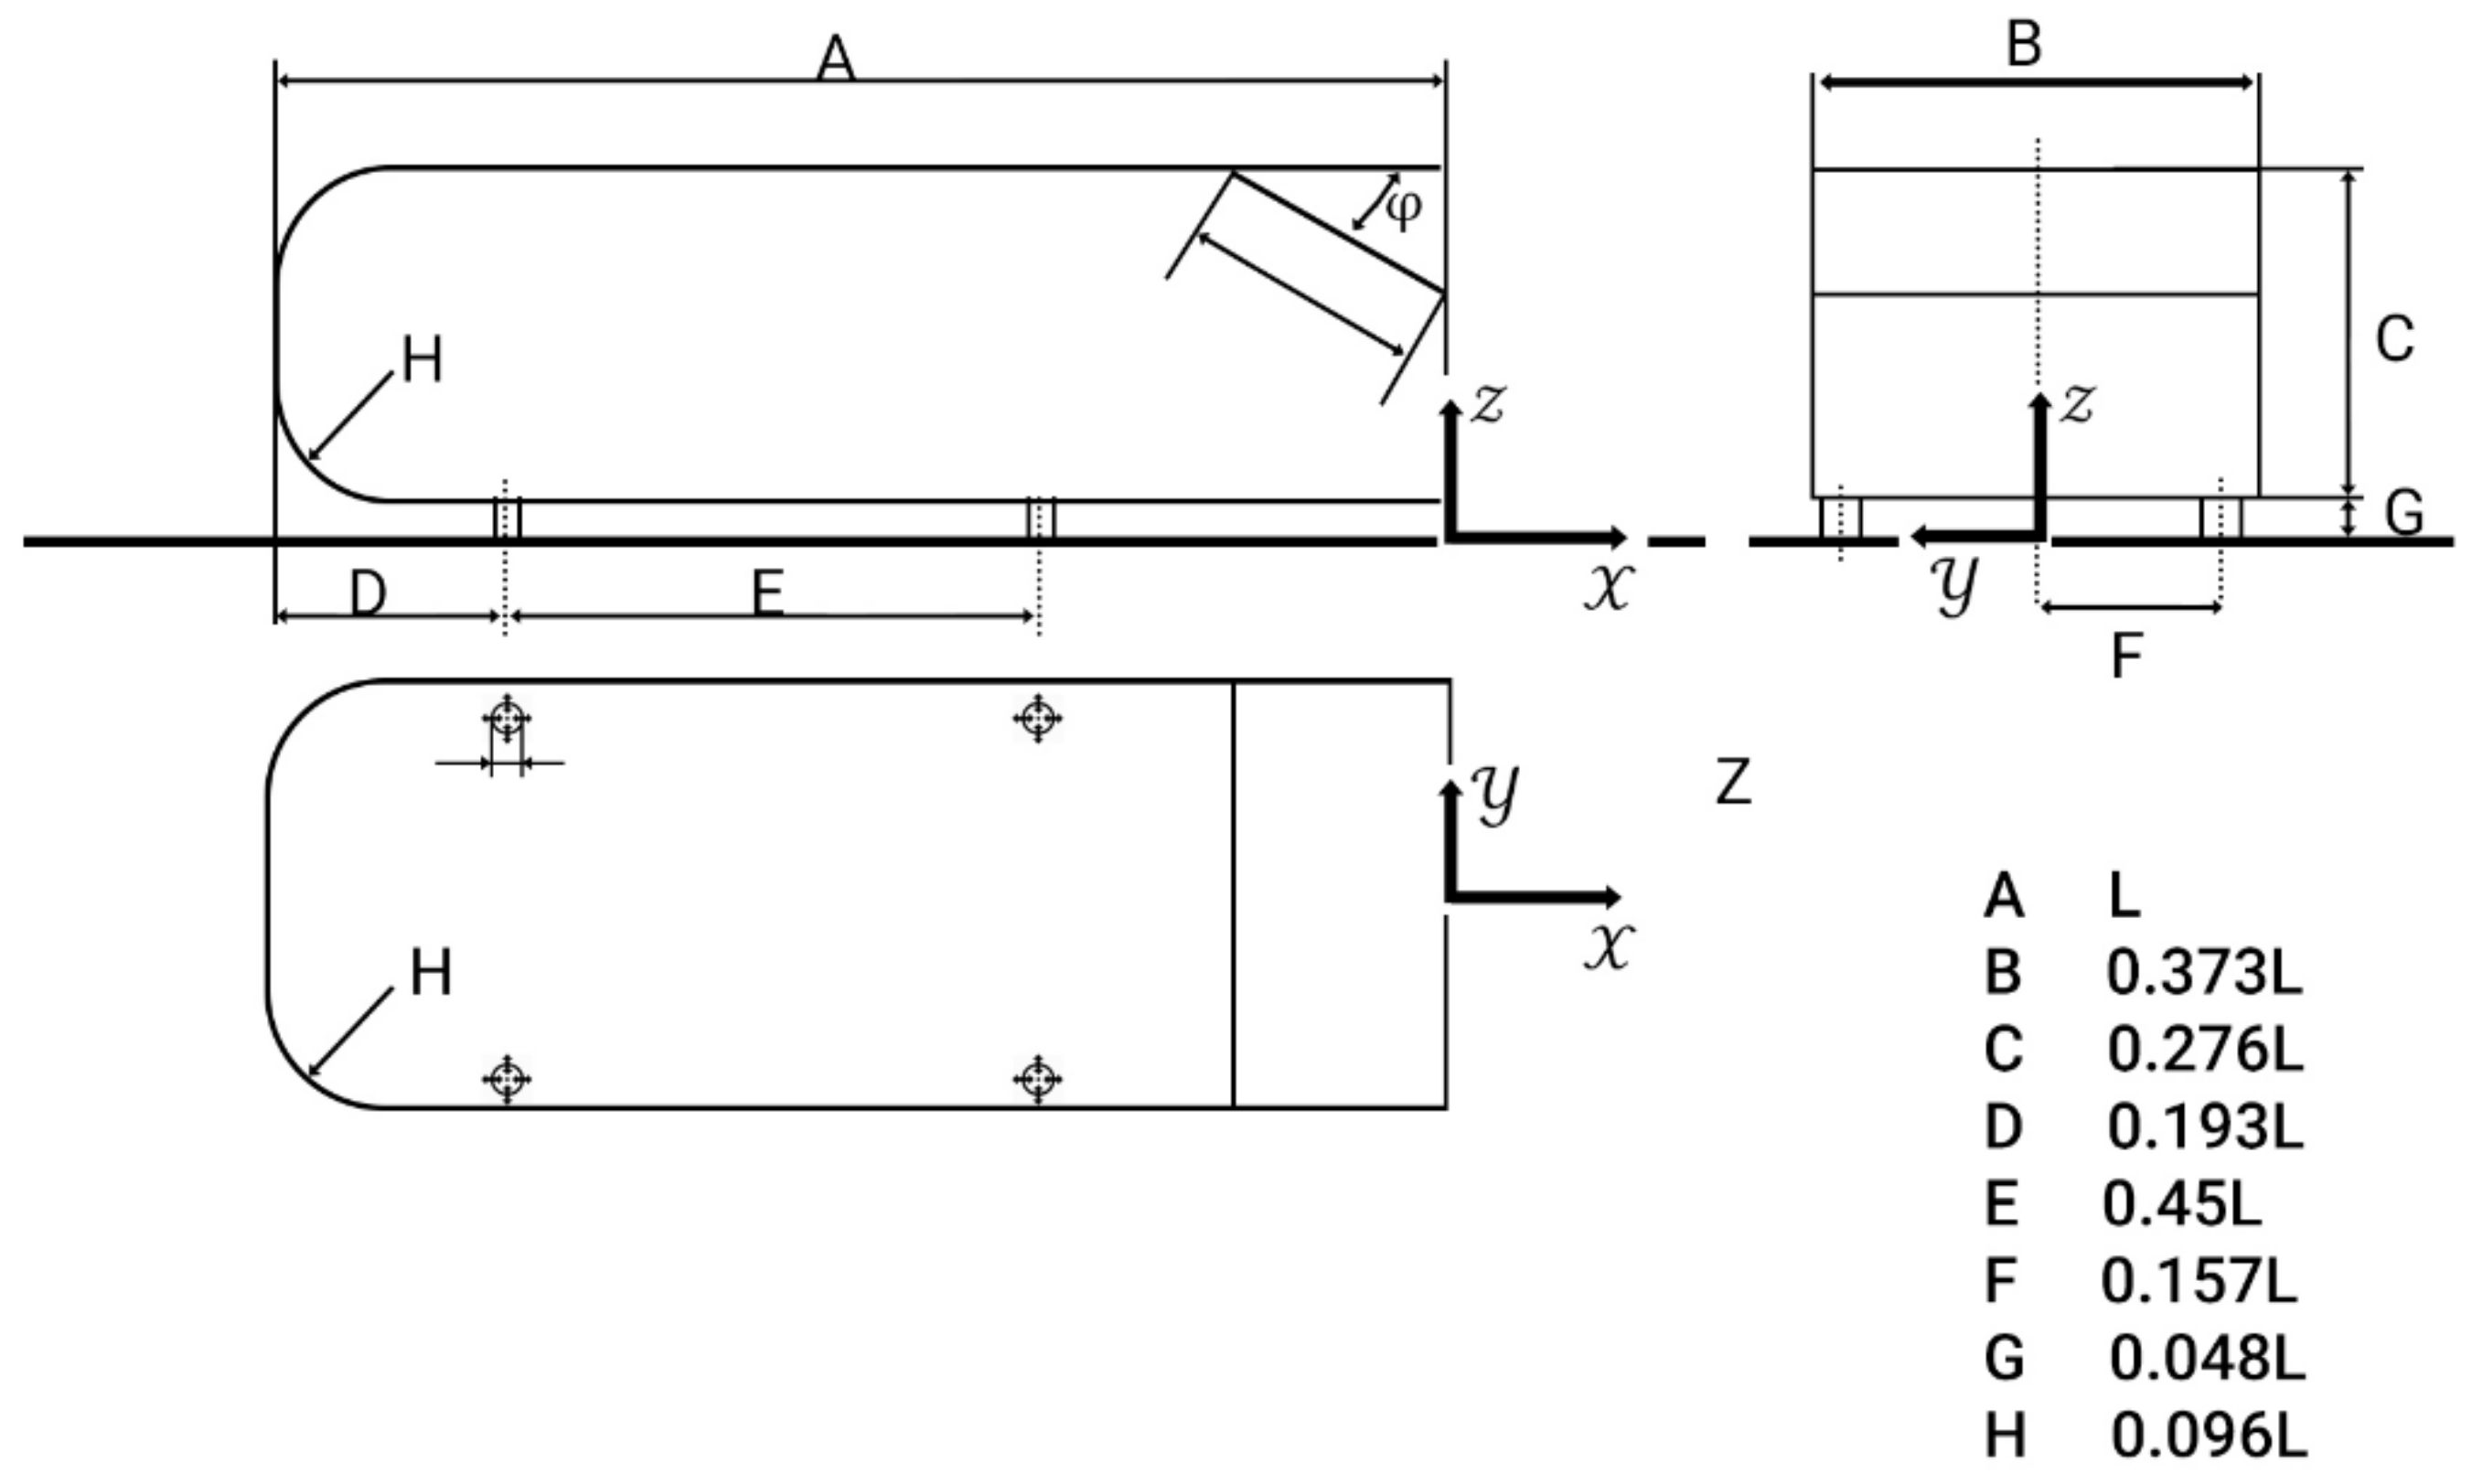
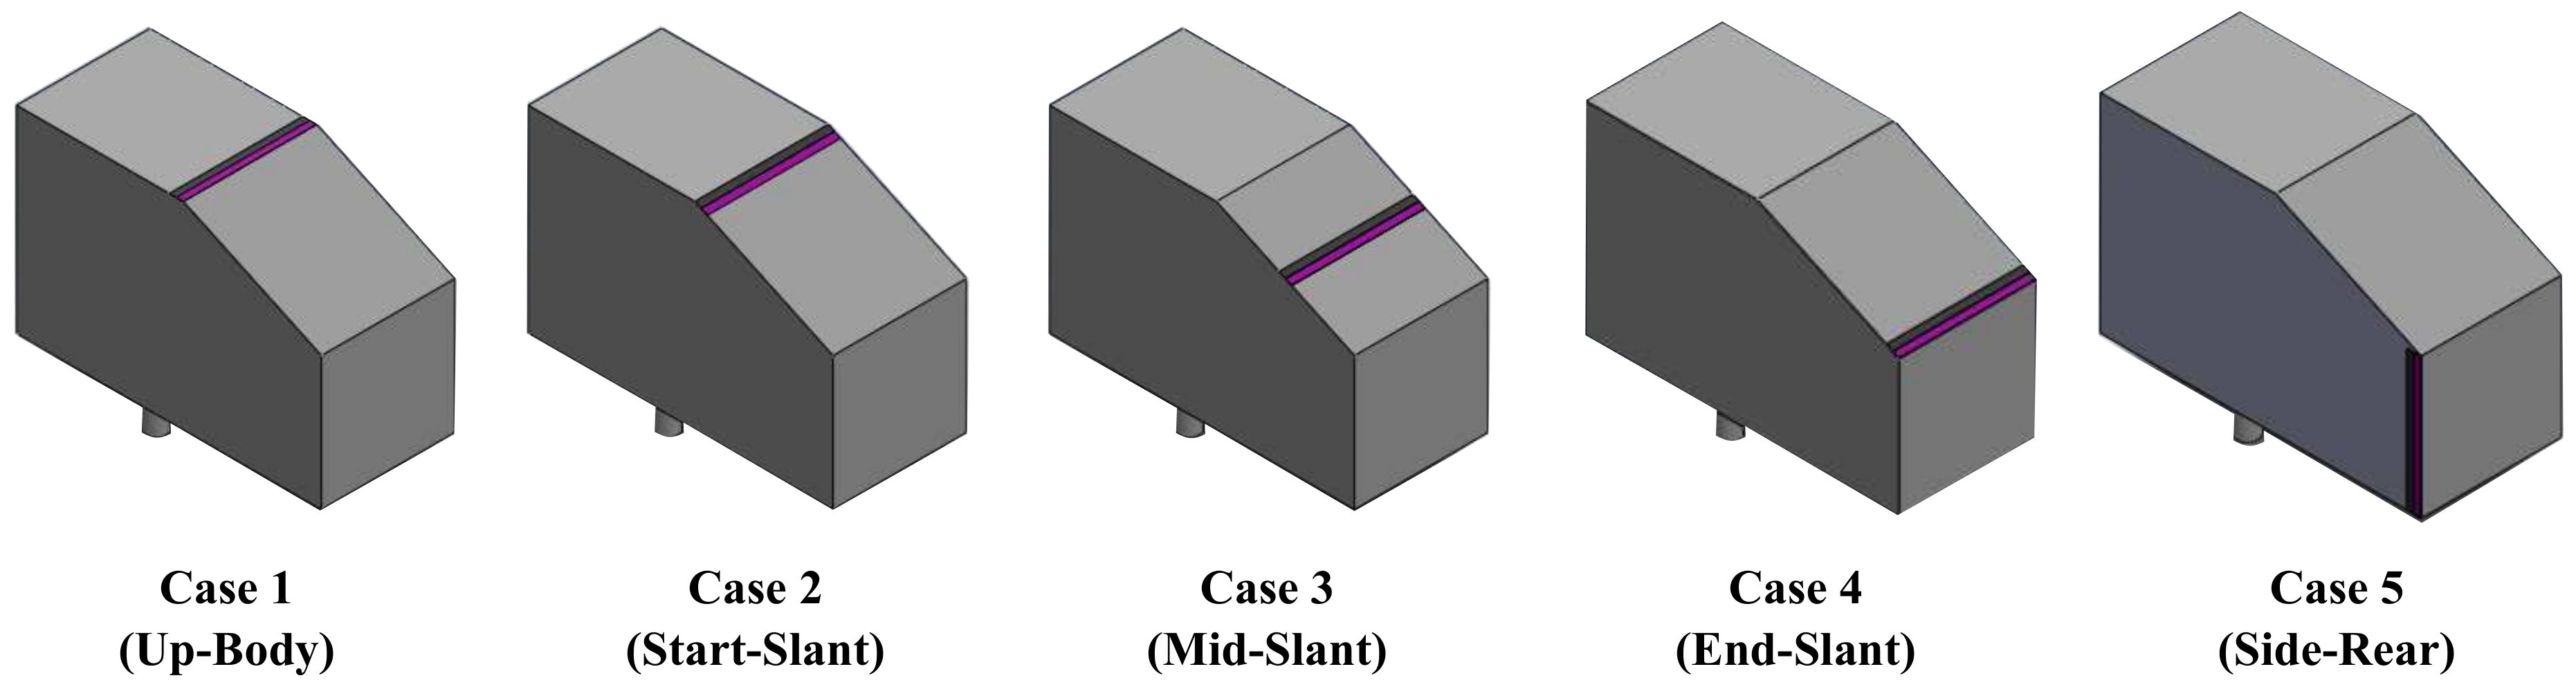
In this study, one SDBD actuator was placed in 5 different locations on the surface of an Ahmed body to determine the location that provides the best aerodynamic performance. The geometries of the Ahmed body and various locations have been indicated in Figure 5 and Figure 6. The actuators were designed following Suzen and Huang (2005) [18]. Four cases were investigated based on the locations of the actuators: on the connection part of the roof and slant (case 1), on the beginning part of the slant (case 2), at the middle part of the slant (case 3) and at the ending part of the slant (case 4). Furthermore, the effect of implementing two actuators on both ending parts of the model sides was investigated in case 5.
3. Experimental Setup
The experimental tests were carried out in the low subsonic wind tunnel of Dana Aerodynamic Research Laboratory at Amirkabir University, which has a 1 m × 1 m × 2.5 m test section. The air velocity in the wind tunnel is adjustable between 5 and 60 m/s with the turbulence intensity of approximately . In the present research, the freestream velocity was 10 m/s corresponding to . The Ahmed body dimensions in experiments (Figure 7) were the same as the one used in simulations. The Glauert’s correction with [20] has been utilized to minimize the experimental measurement errors.
The high voltage electricity and electromagnetic field generated by the DBD apparatus may create low-amplitude high-frequency noise on the analog signal of the measurement system. Therefore measurement instruments, the data acquisition system and high voltage wires were shielded using aluminum foil, and the shield was connected to the ground wire. Furthermore, the load cell location was sufficiently far from the actuator to minimize the noise generated by the strong DBD actuator electric field. The actuators were manufactured using photofabrication (printed circuit board, PCB fabrication) method. Kapton tape was utilized as the dielectric material. The shape and size of the actuators and thickness of the dielectric layer were chosen based on the numerical simulations in this study. A sinusoidal electric wave was generated using an AC power supply with a maximum peak to peak voltage of 20 kV and variable frequency up to 30 kHz. Paralleling the numerical simulations, the applied voltages in the experiments were 8, 10 and 12 kV and the frequency was 4.5 kHz. The SDBD actuator was driven continuously ( duty cycle). Force measurements were performed using L6D-C3 ZEMIC load cell with a combined error of less than FS. This translates to a maximum error of considering all of the measurements related to drag-reduction.
4. Validation Study
The numerical setup was validated around an Ahmed body with slant angles of and at and , by comparing the results with other studies that have similar condition and setup. As shown in Table 2, the maximum difference in drag coefficient with other experimental results is less than . For the case of an Ahmed body with slant angle, Guilmineau et al. (2018) [13] has shown that RANS simulation cannot model all the flow features. Therefore, only the drag coefficient is compared in different situations to ensure that the drag coefficient is correct. However in the case of slant angle, the literature [13] agrees that RANS turbulence model can successfully predict the main flow features around the Ahmed body. This variation in performance of RANS models may be attributed to large pressure and velocity gradients in the wake, as was suggested by Fogaing et al. (2019) [21].
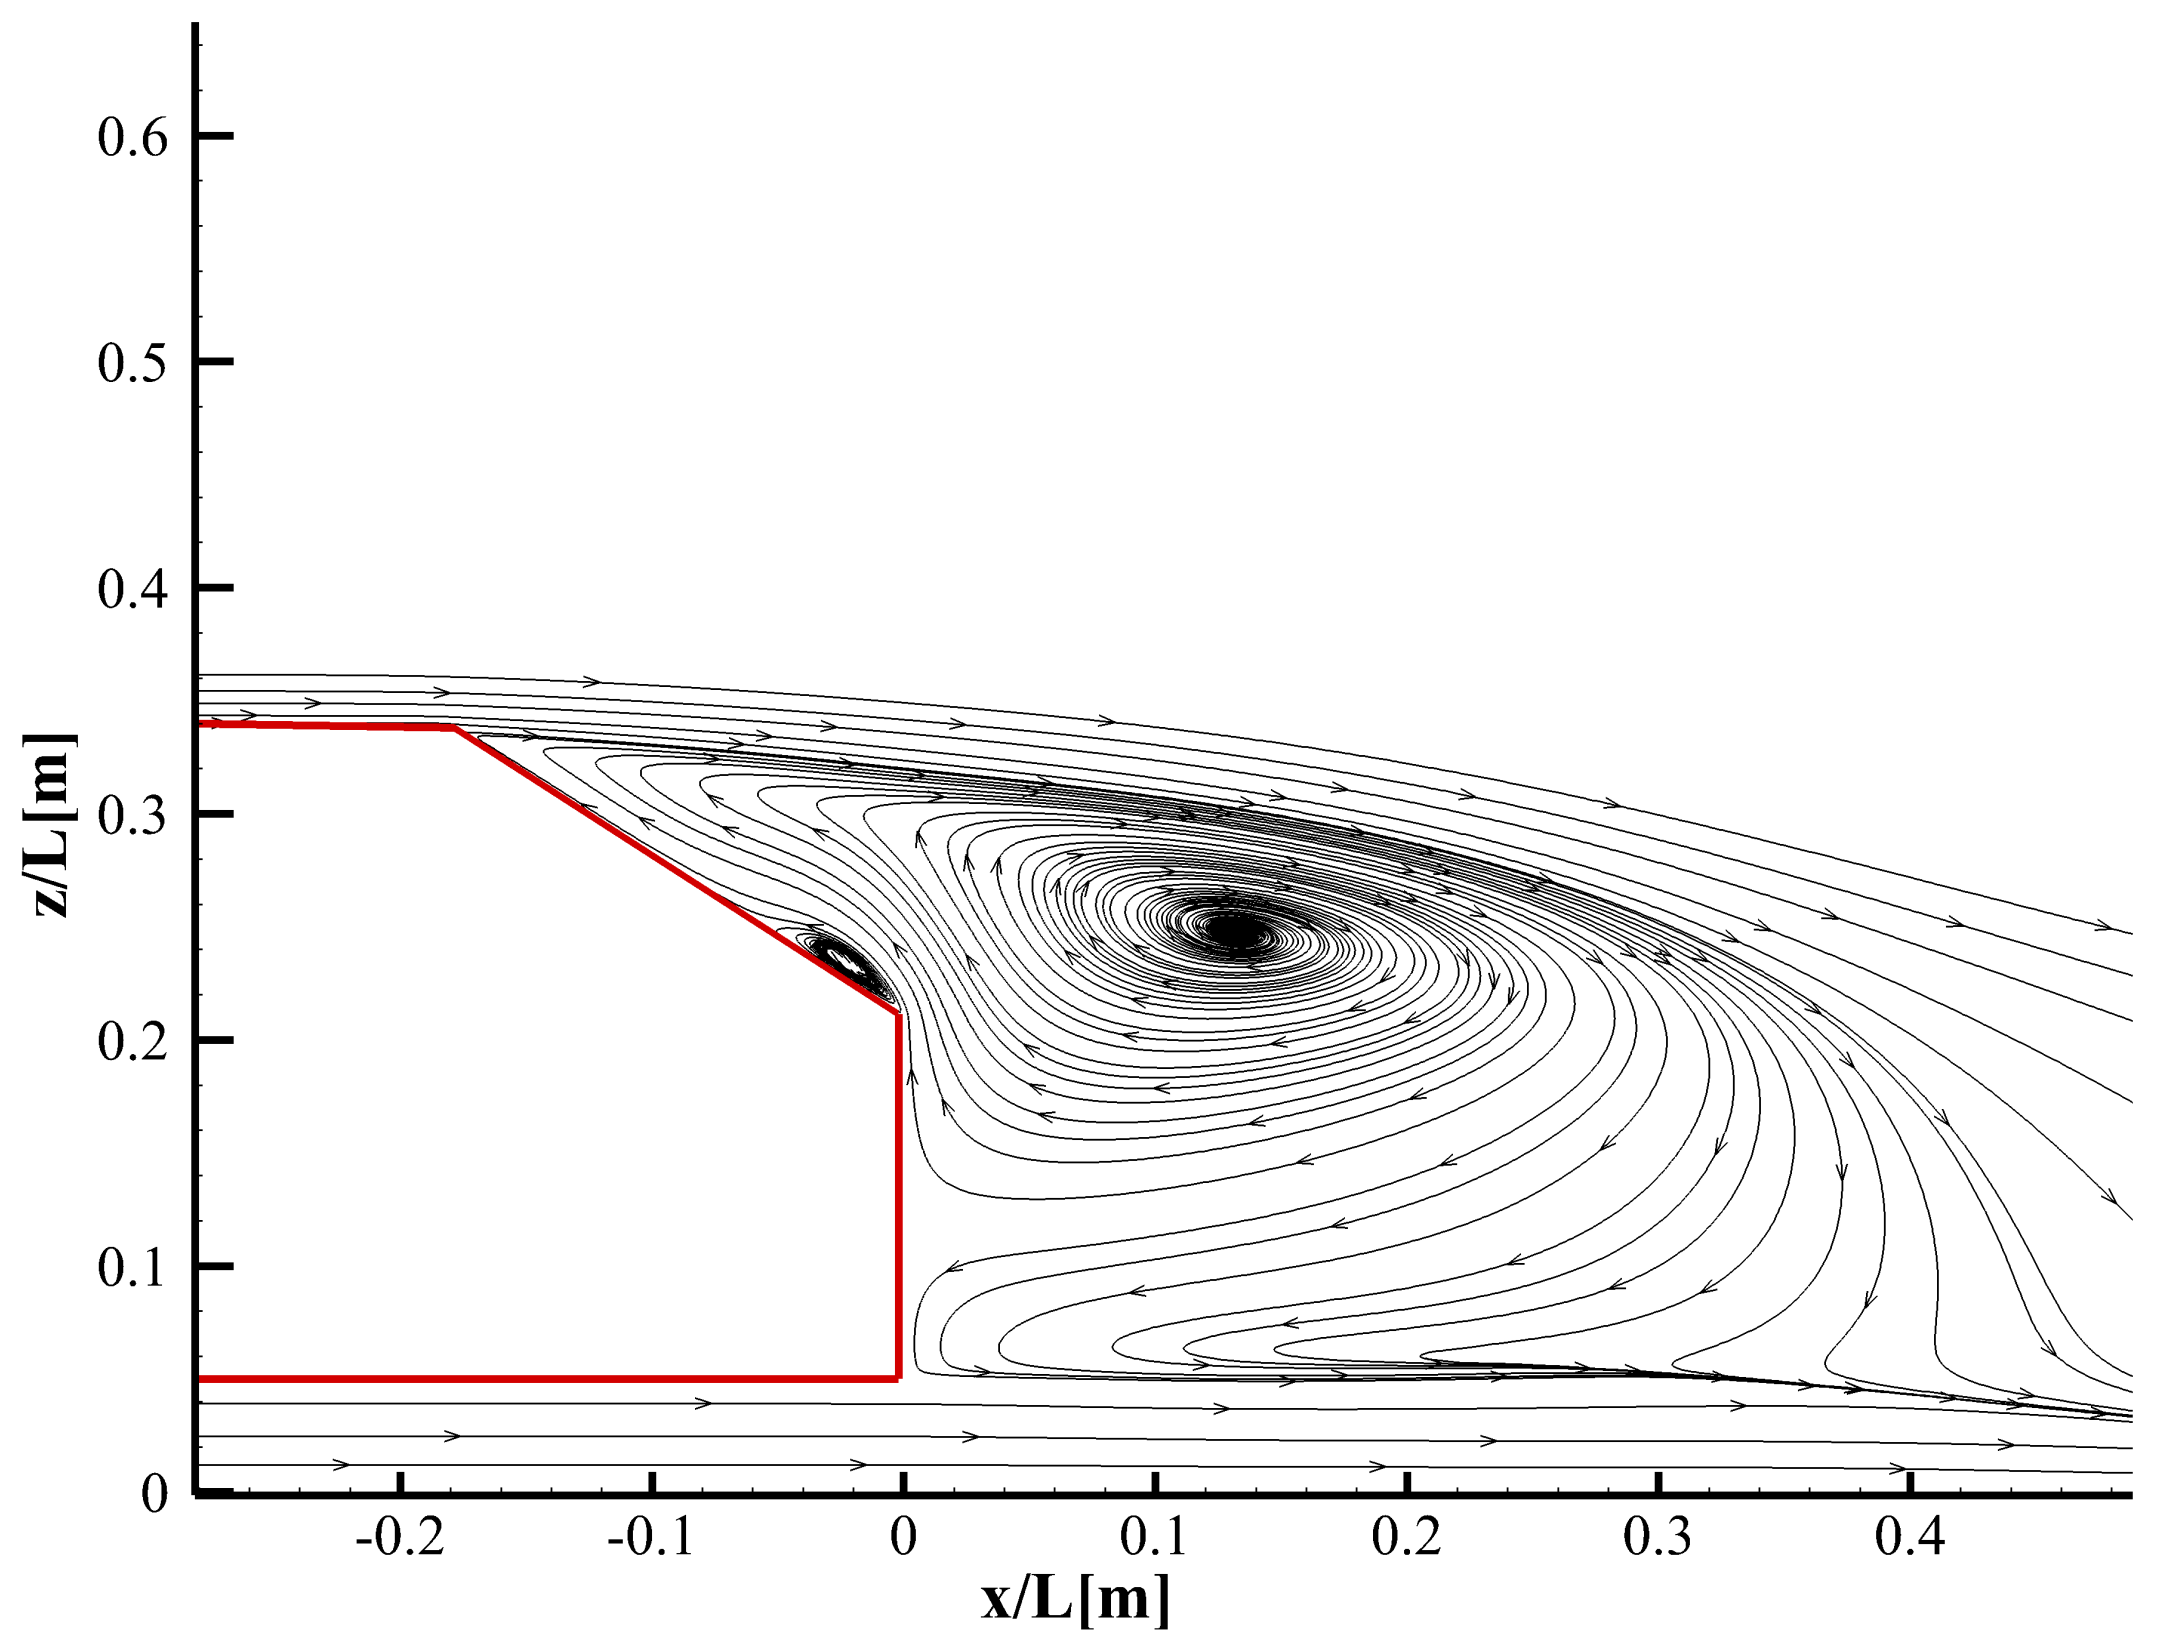
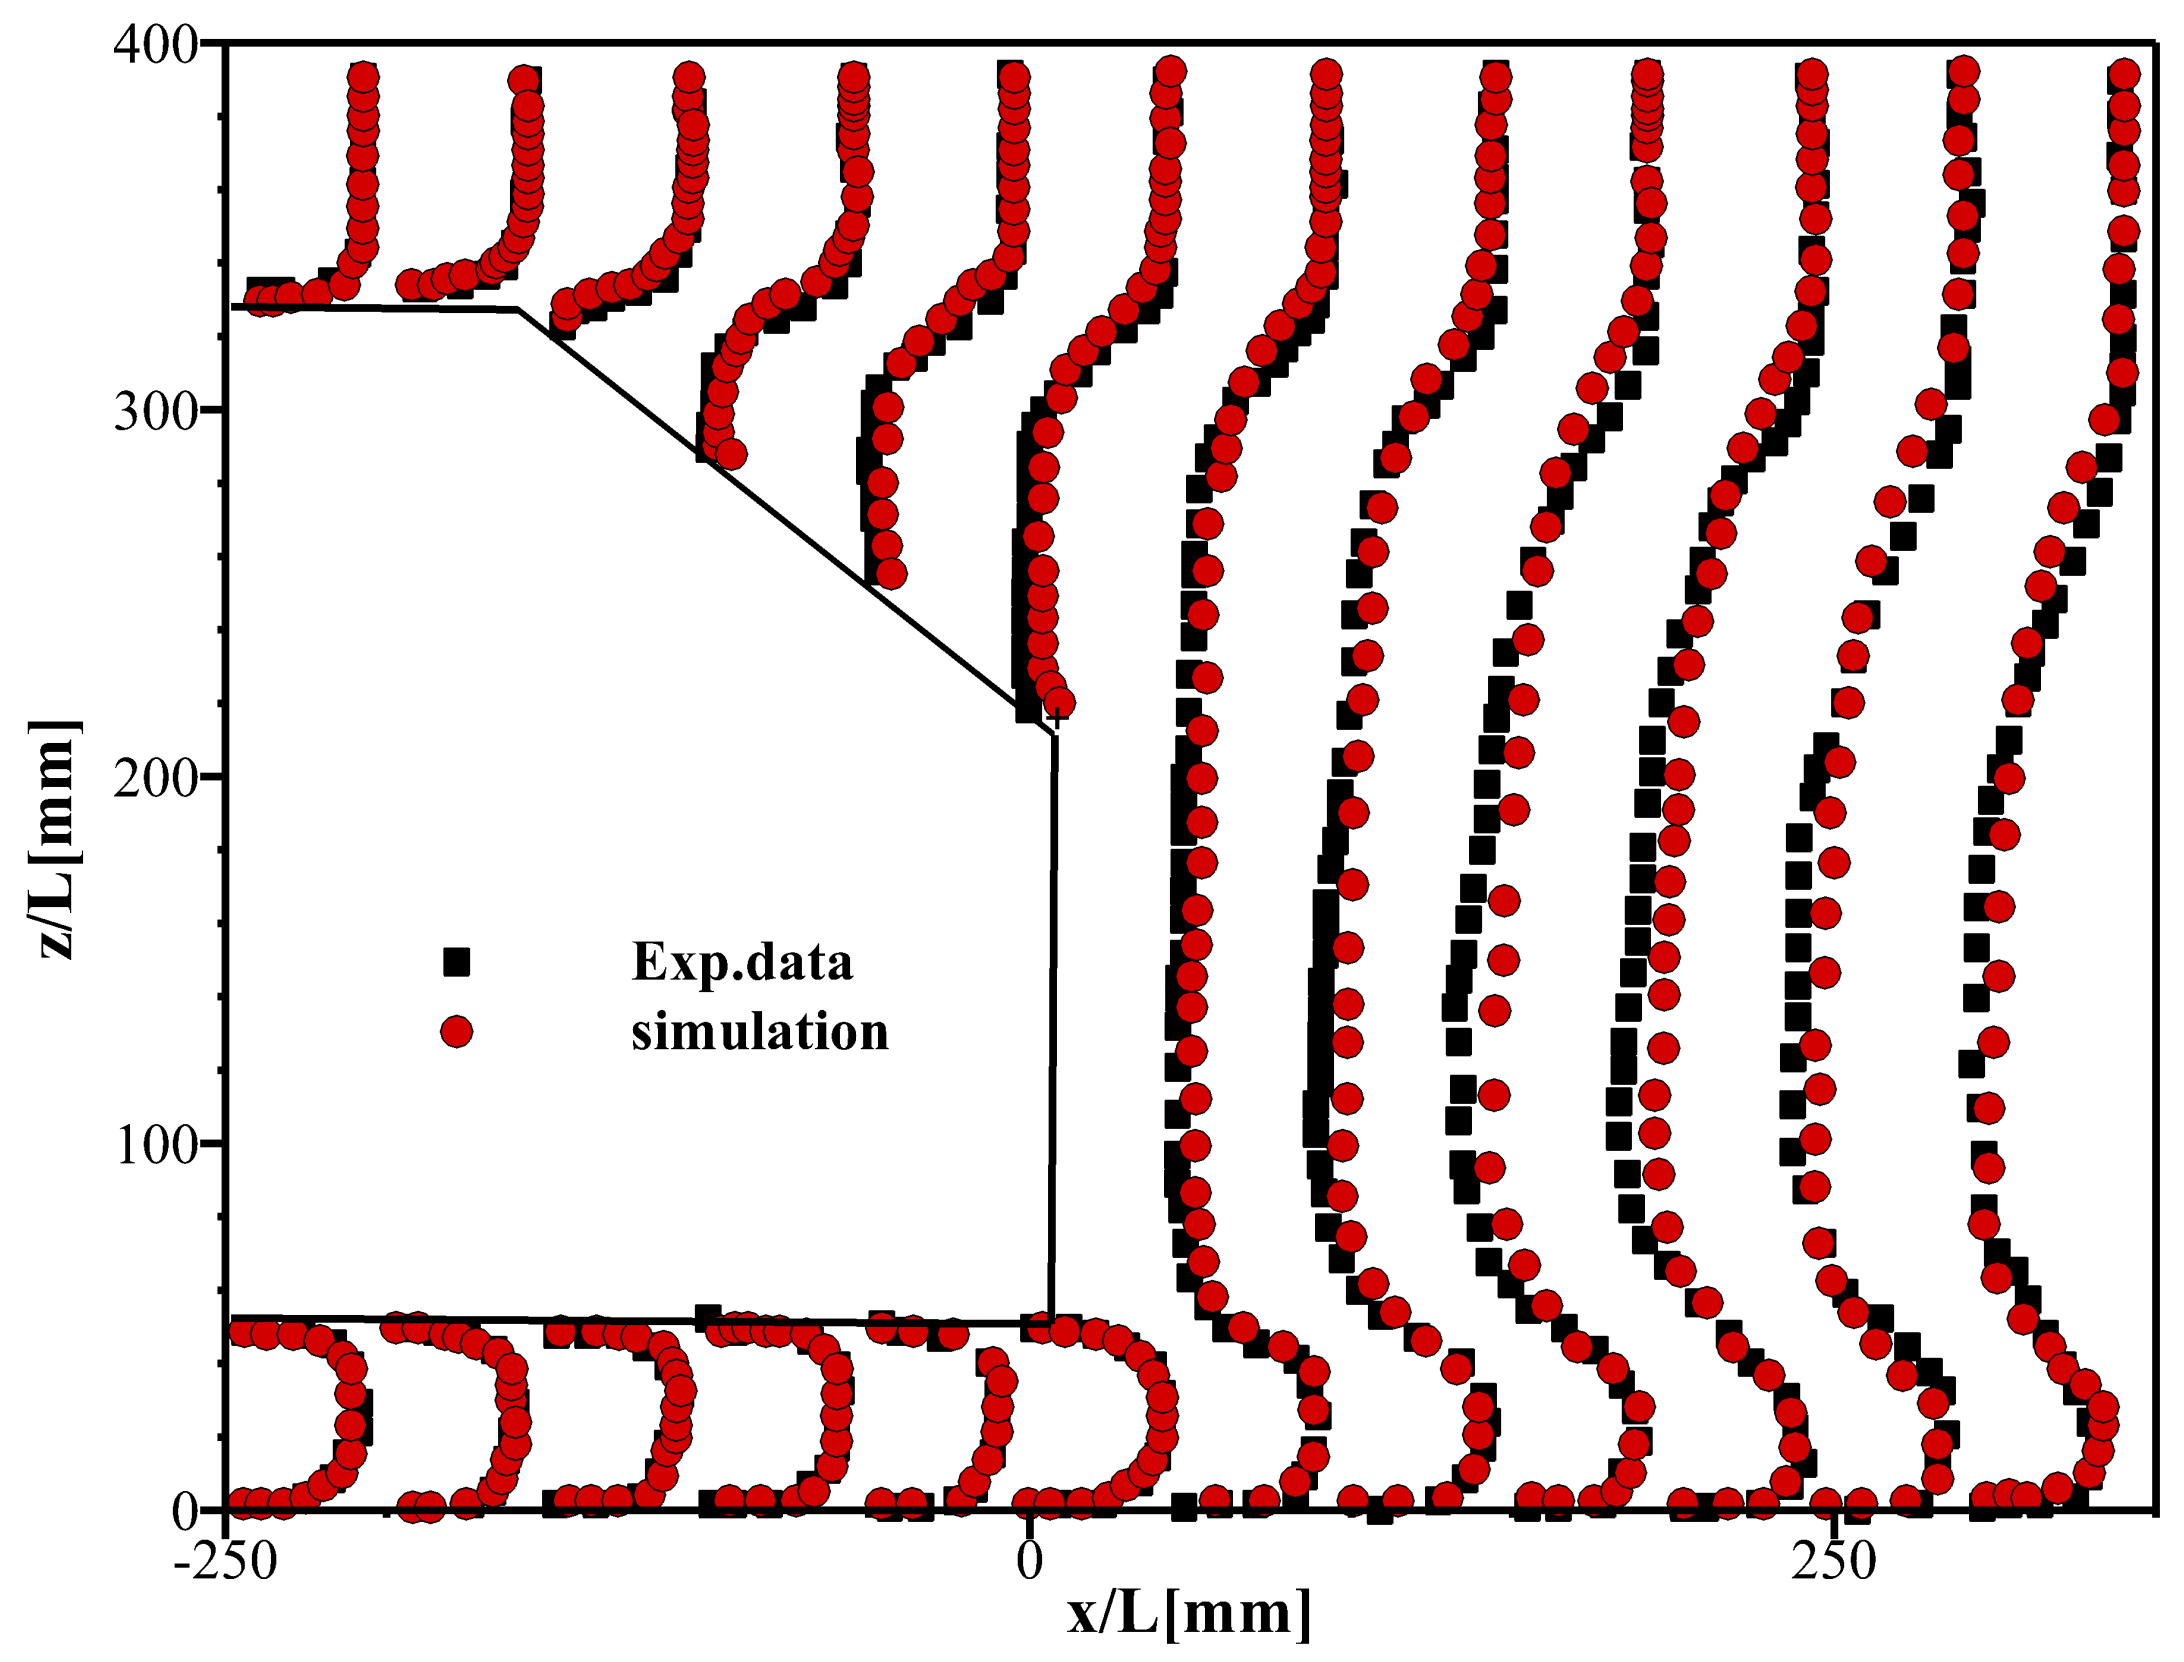
The wake characteristics in Figure 8 compare well with those obtained numerically by Guilmineau et al. (2018) [13]. Moreover, the current results compared with the experiments of Meili et al. (2011) [22] in Figure 9 show good agreement. Case 2, which looks at the SDBD actuator located at the beginning part of the slant surface, was selected for the validation study. The DBD actuator consisted of two conductive copper electrodes, which were separated by one dielectric layer that had a thickness of 0.127 mm and relative permittivity of . The values of and , and the quiescent air condition for the actuators, were selected due to the previously adjusted values by Bouchmal (2011) [19]. In the present study, the Debye length () was set at , and the applied frequency was 4.5 kHz. For applying the conditions of numerical simulation accurately in experiments, two layers of polyimide kapton tape were utilized for an approximate dielectric material thickness of m and a relative permittivity of 2.7. Furthermore, the applied voltage, frequency and dimensions of electrodes were selected based on those of the simulations.
We compare the results from simulations and experiments for the slant angle case and at the Reynolds number of in Table 3. The good agreement between numerical results and experimental data confirms the validity of numerical results in predicting the flow around an Ahmed body with and without the DBD actuators. The drag coefficient of the Ahmed body presented by Mile et al. (2011) [22] at a similar Reynolds number was 0.34, which is within the of the experimental results in the current study.
SDBD Actuator Model Validation
To validate the mathematical model utilized for estimating the velocity and body force of the actuator in the simulations, we simulated an SDBD actuator at zero freestream velocity. In the work of Suzen et al. (2005) [18], the actuator consisted of two 10 mm wide and 0.102 mm in thickness conductive copper strips as the electrodes, which were separated by a Kapton dielectric with a thickness of 0.127 mm. The lower electrode was grounded, and the excited air region was generated using a square wave with an applied voltage of kV and a frequency of 4.5 kHz. The quiescent conditions in this study were selected, such that they were the same as those used by Boucmal (2011) [19] and Suzen et al. (2005) [18]. The maximum velocity and magnitude of the computed body force vectors are compared with those of Boucmal (2011) [19] and Suzen et al. (2005) [18] in Table 4. Figure 10 shows the simulated velocity distribution of an SDBD actuator operating at zero freestream velocity. As shown, the maximum velocity region is concentrated over the upper left corner of the embedded electrode. Table 4 and Figure 10 show good agreement with results of Suzen et al. (2005) [18] and Bouchmal (2011) [19]. The small difference of the results () with those of Suzen et al. (2005) [18] can be attributed to the different numbers of cells and mesh quality.
5. Results
We begin by looking at the results associated with implementing the SDBD actuators at five different locations and two Reynolds numbers ( and ). For the lower Reynolds number, the induced voltage varied among 8, 10 and 12 kV with the frequency of 4.5 kHz. However, the induced voltage was limited to 12 kV for the higher Reynolds number due to the trivial effect of actuators at high speeds. The effect of using a combination of the best positions at the best operating condition for both Ahmed body models ( and slant angles) is numerically investigated.
5.1. Numerical Simulations
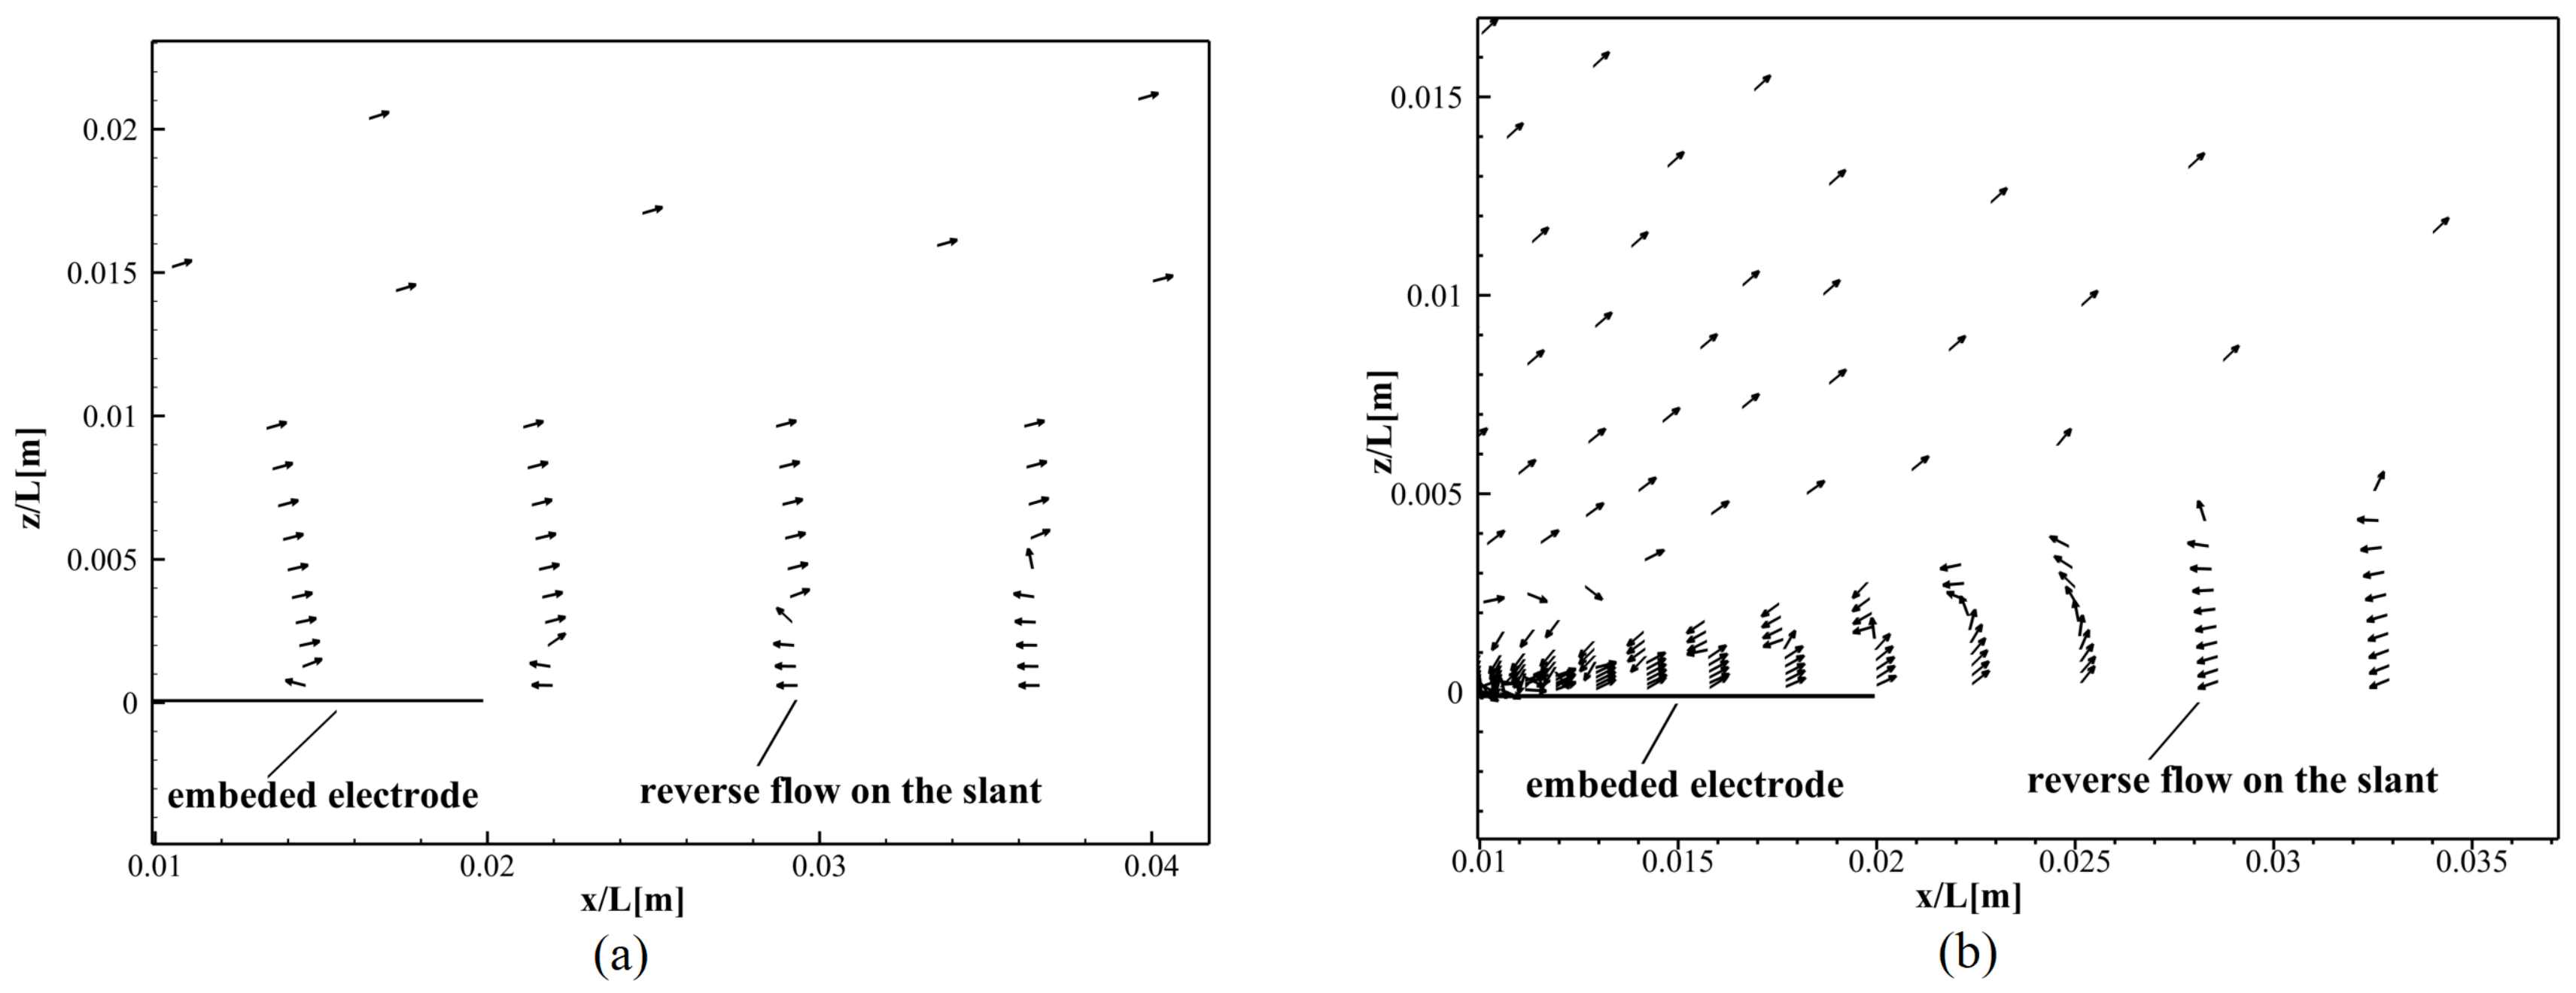
On the rear slant of the Ahmed body model with a slant angle, a separation bubble appears as the flow velocity decreases. The size of the separation bubble and reattachment point of the separated flow depend on the Reynolds number, which agrees with findings of M. Metka [24]. The separation bubble creates reverse flow on the slanted surface, which leads to larger drag. Figure 11 shows the effect of a single DBD actuator on the reversed flow region. The actuator induces momentum in the region and increases the flow velocity in the favorable direction. Drag reduction for slant angles and at and are shown in Table 5. Negative values of indicate an increase in drag after implementing the actuation.
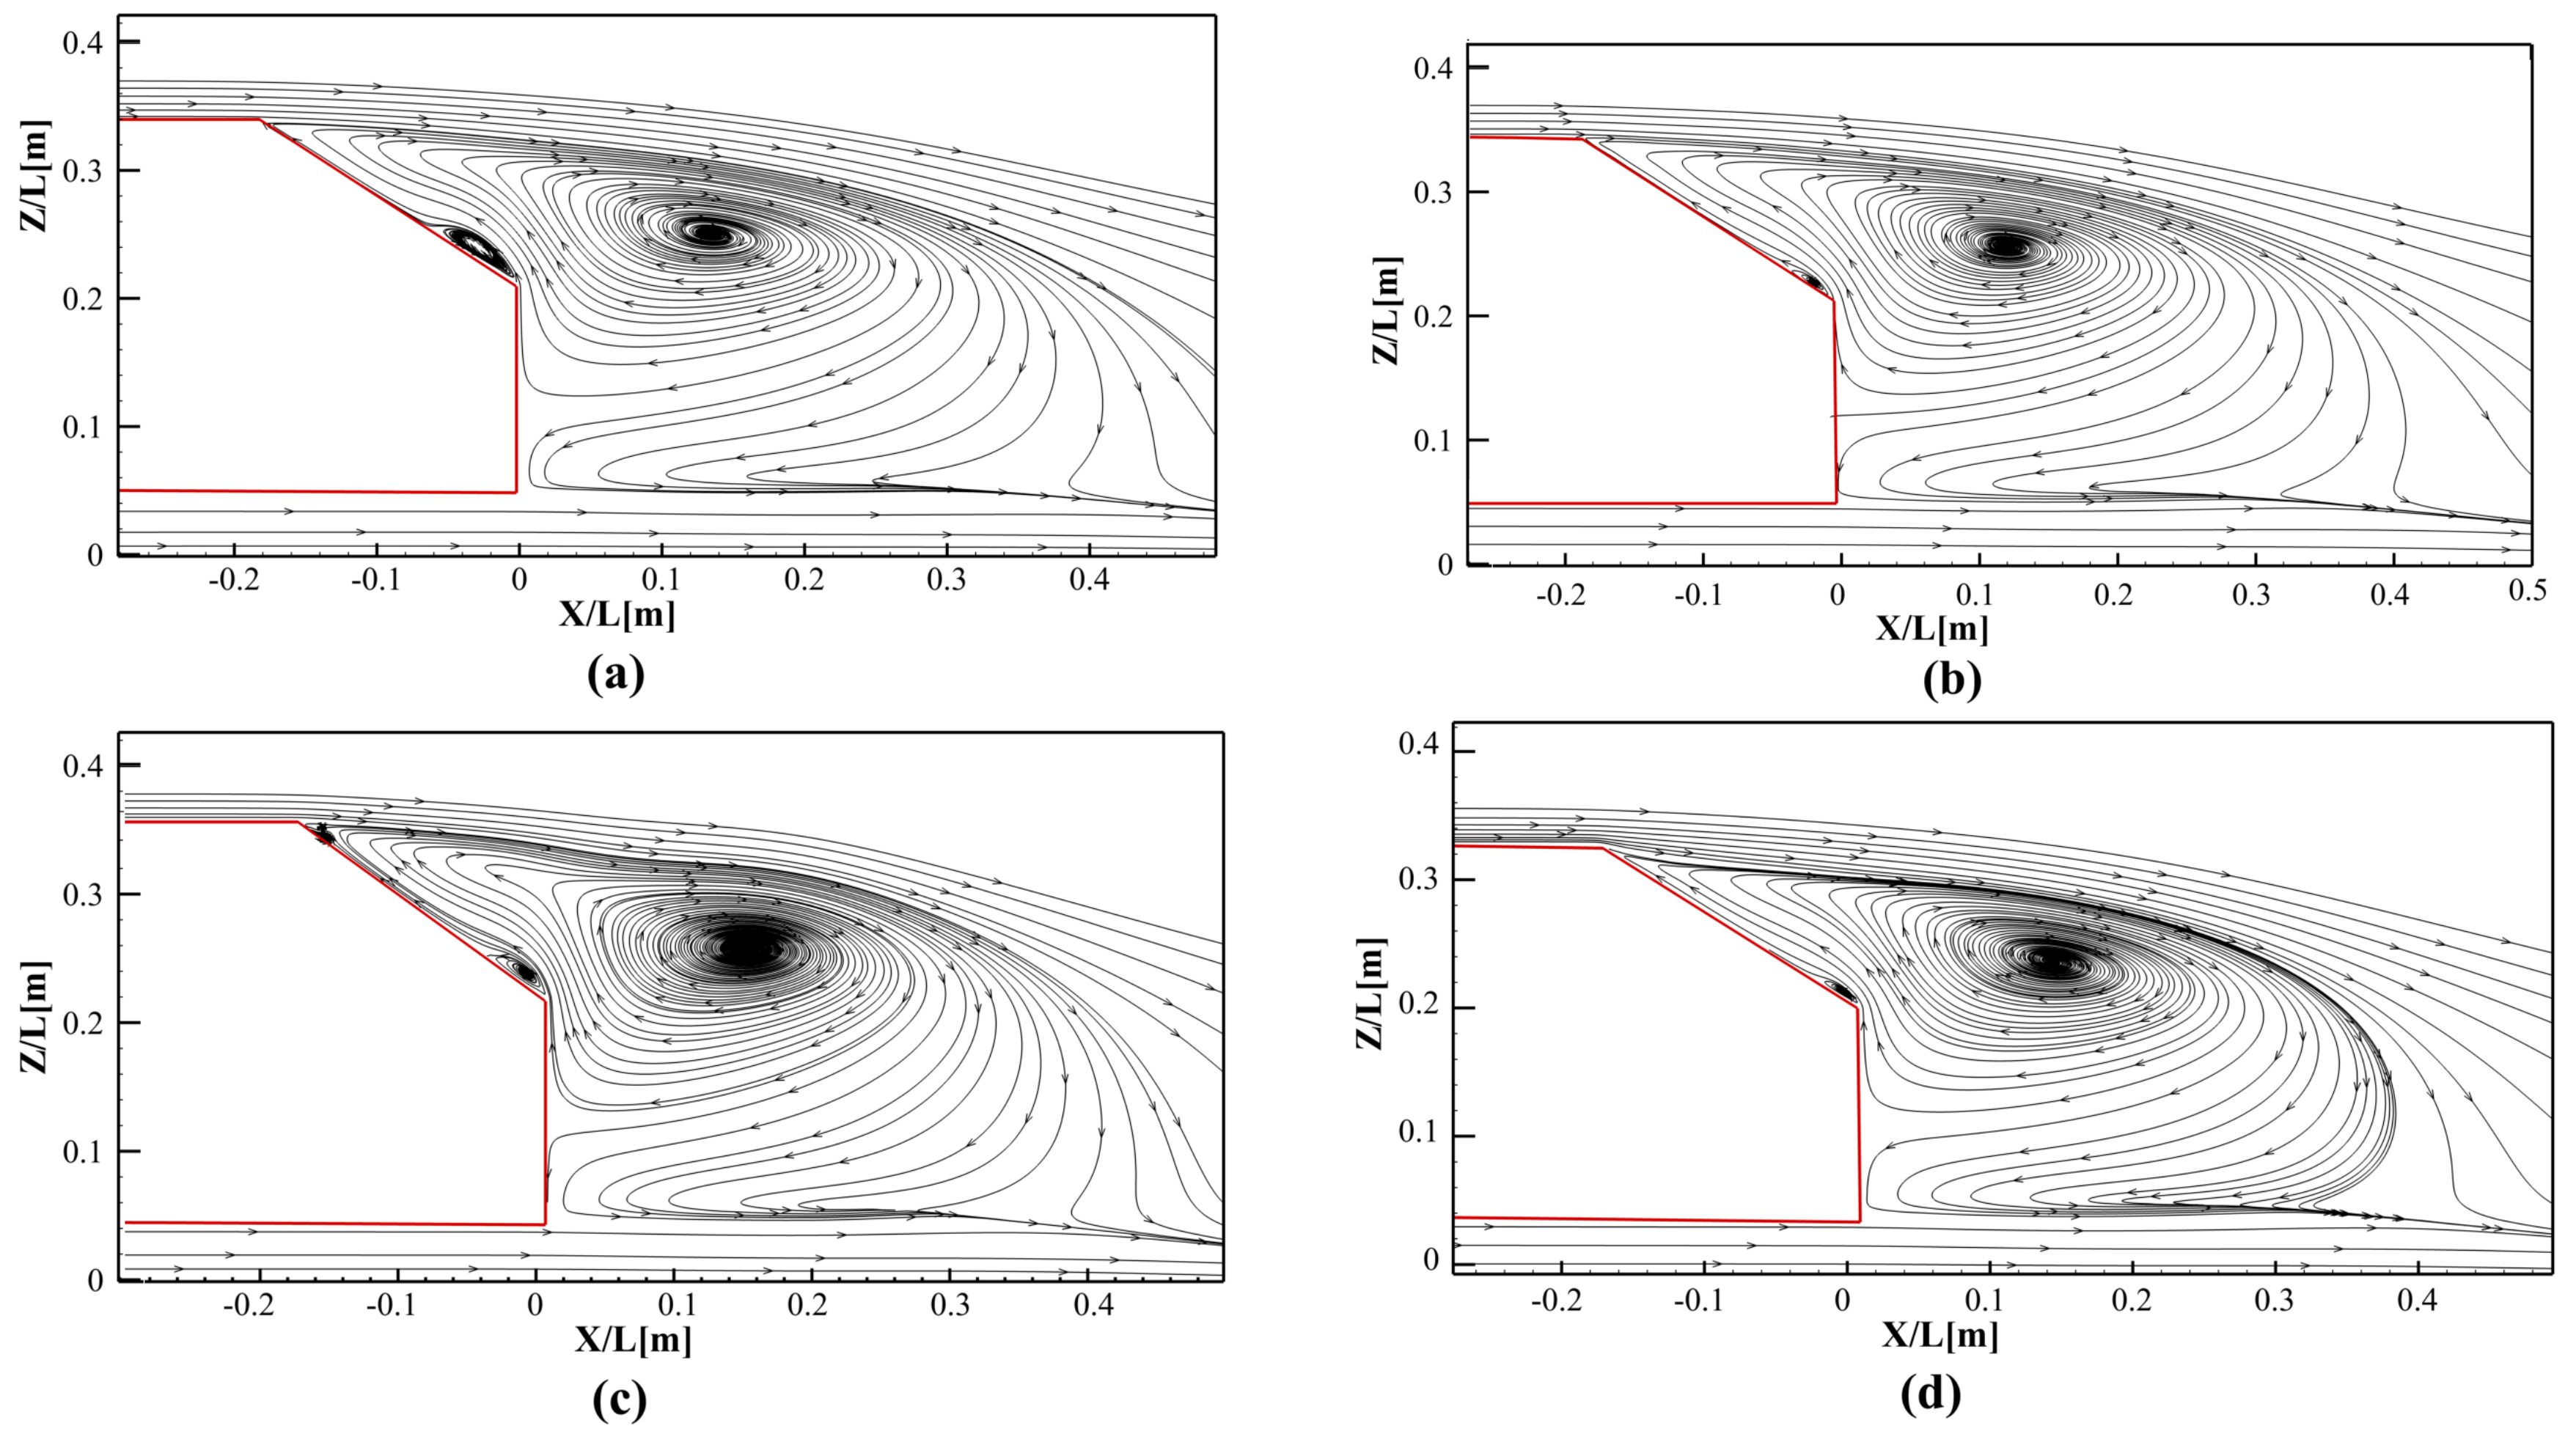
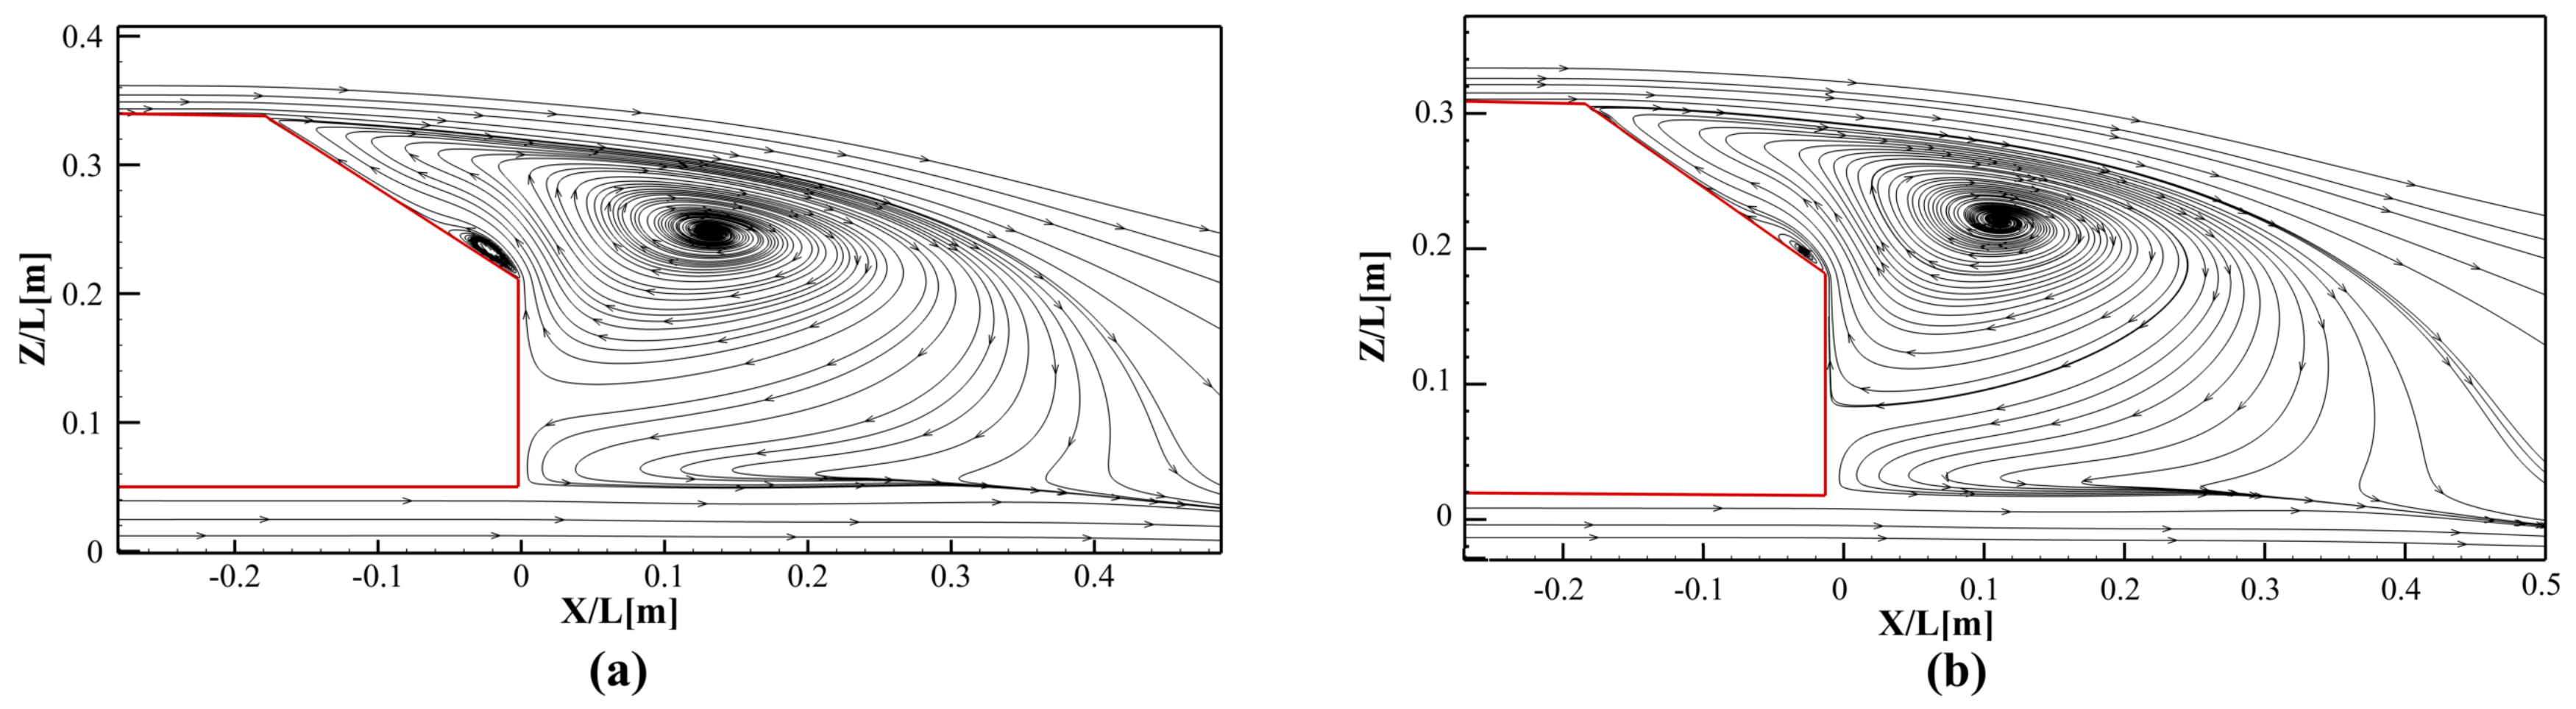
Based on the numerical results, SDBD actuators are effective tools for drag reduction at a Reynolds number of . As shown in Table 5, cases 2 and case 5 are the most effective positions of these actuators at this Reynolds number. As shown in Figure 12 and Figure 13, case 2 has the largest impact on the separation bubble in the wake region, which reduces the apparent size of the vortex in this area. Case 5 has the greatest effect on the separation bubble on the ending part of slanted surface. In this case, the length of wake area is smaller than other cases. Therefore, it is apparent that the smaller vortex structure (in apparent size) formed behind the body leads to smaller drag (larger drag reduction). Furthermore, increasing the magnitude of the imposed voltage improves the performance of the SDBD actuator, except for case 1. However, based on the results shown in Figure 13, case 2 does not create significant improvements at the higher Reynolds number (). Therefore, effective flow control at high Reynolds numbers requires larger body forces in order to create similar changes [8]. The presence of a SDBD actuator can change the drag force on the Ahmed body even without applying high voltage. This is mainly due to the changing geometry. As shown in Figure 14, the SDBD actuator changes the position of vortex core behind the model and increases the pressure on the slanted and rear surfaces, which reduces the drag. This agrees with findings of M. Metka [24].
The results based on using multiple configurations of the SDBD actuators (case 2 and case 5) at are shown in Table 6. Based on these results, using multiple arrangements of the actuators does not have any meaningful advantages over one single DBD actuator, which is aligned with the conclusions of Boucinha et al [6].
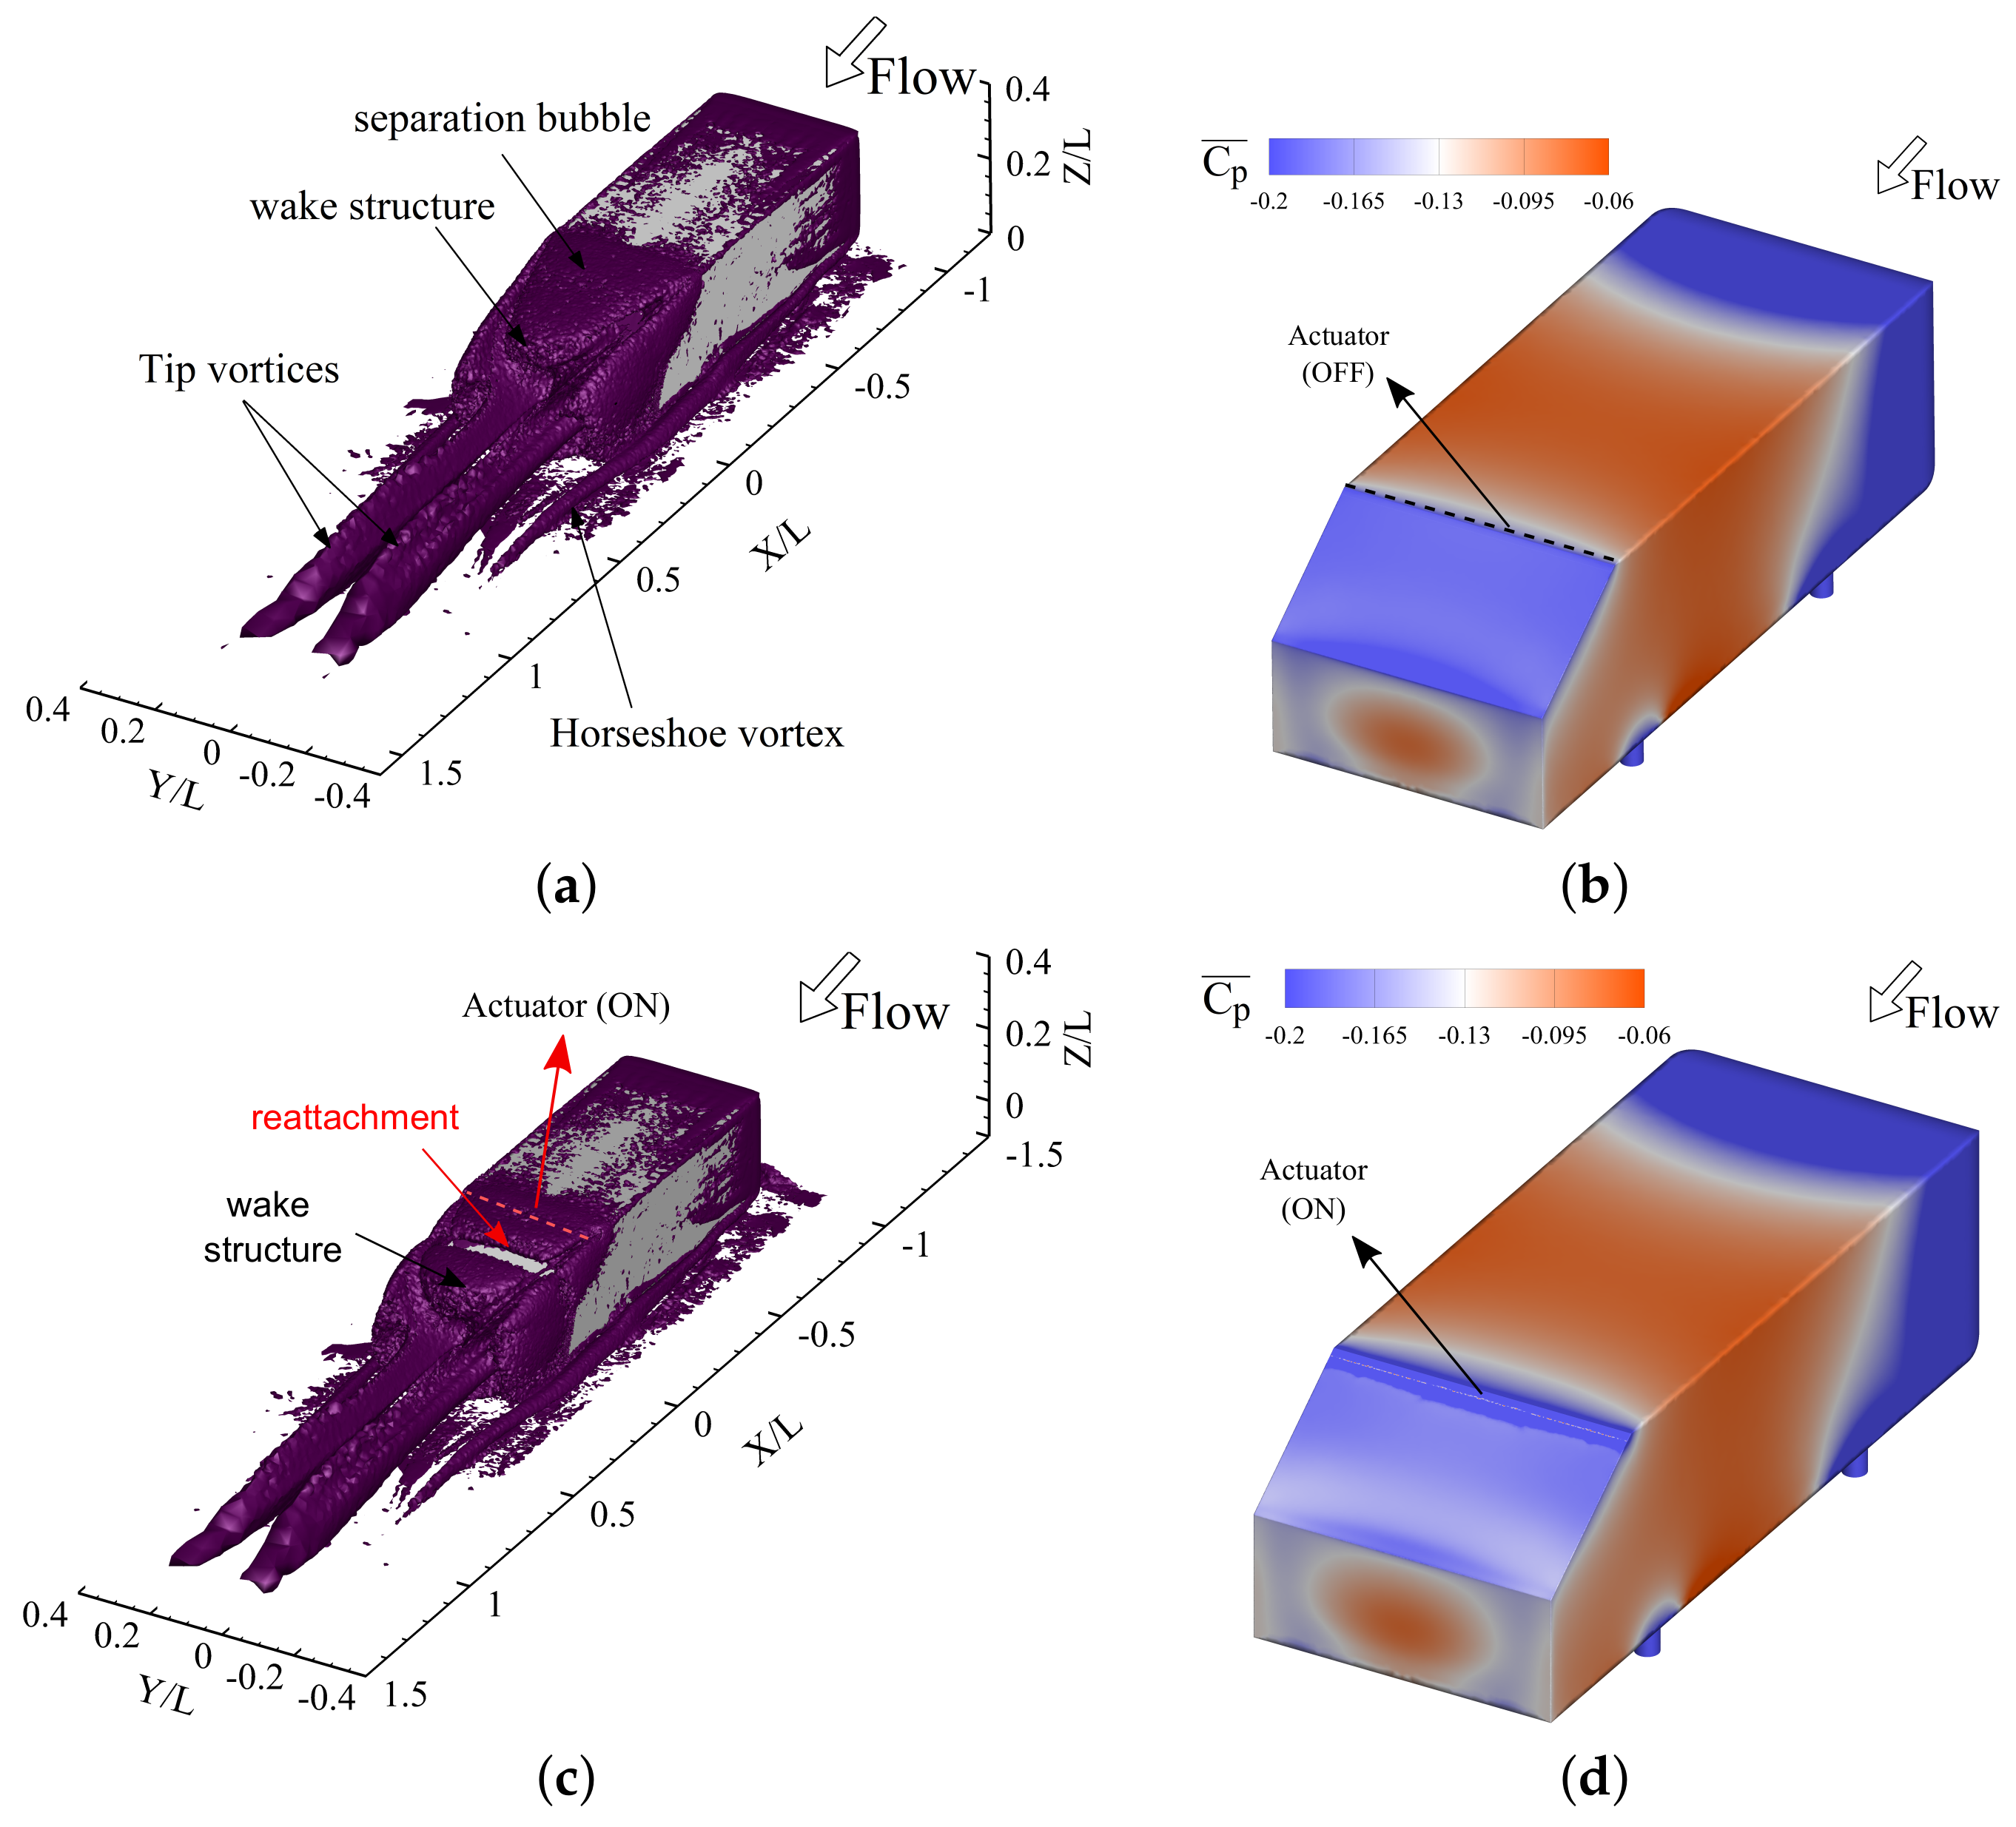
The flow physics attributed to the drag reduction is discussed using the three-dimensional wake illustrations in Figure 15 and Figure 16. Moreover, the surface pressure coefficients on the Ahmed body are shown, when the SDBD actuator is implemented based on the two optimized locations of case 2 and case 5 for the slant angle of . As shown in Figure 15, implementing the SDBD actuator on the upper part of the slant surface (case 2) corresponds to the reattachment of the flow to the slant surface. Therefore, the separation bubble on the slant is not connected to the wake structures. These changes lead to a pressure increase on the slant surface and a reduction in drag force.
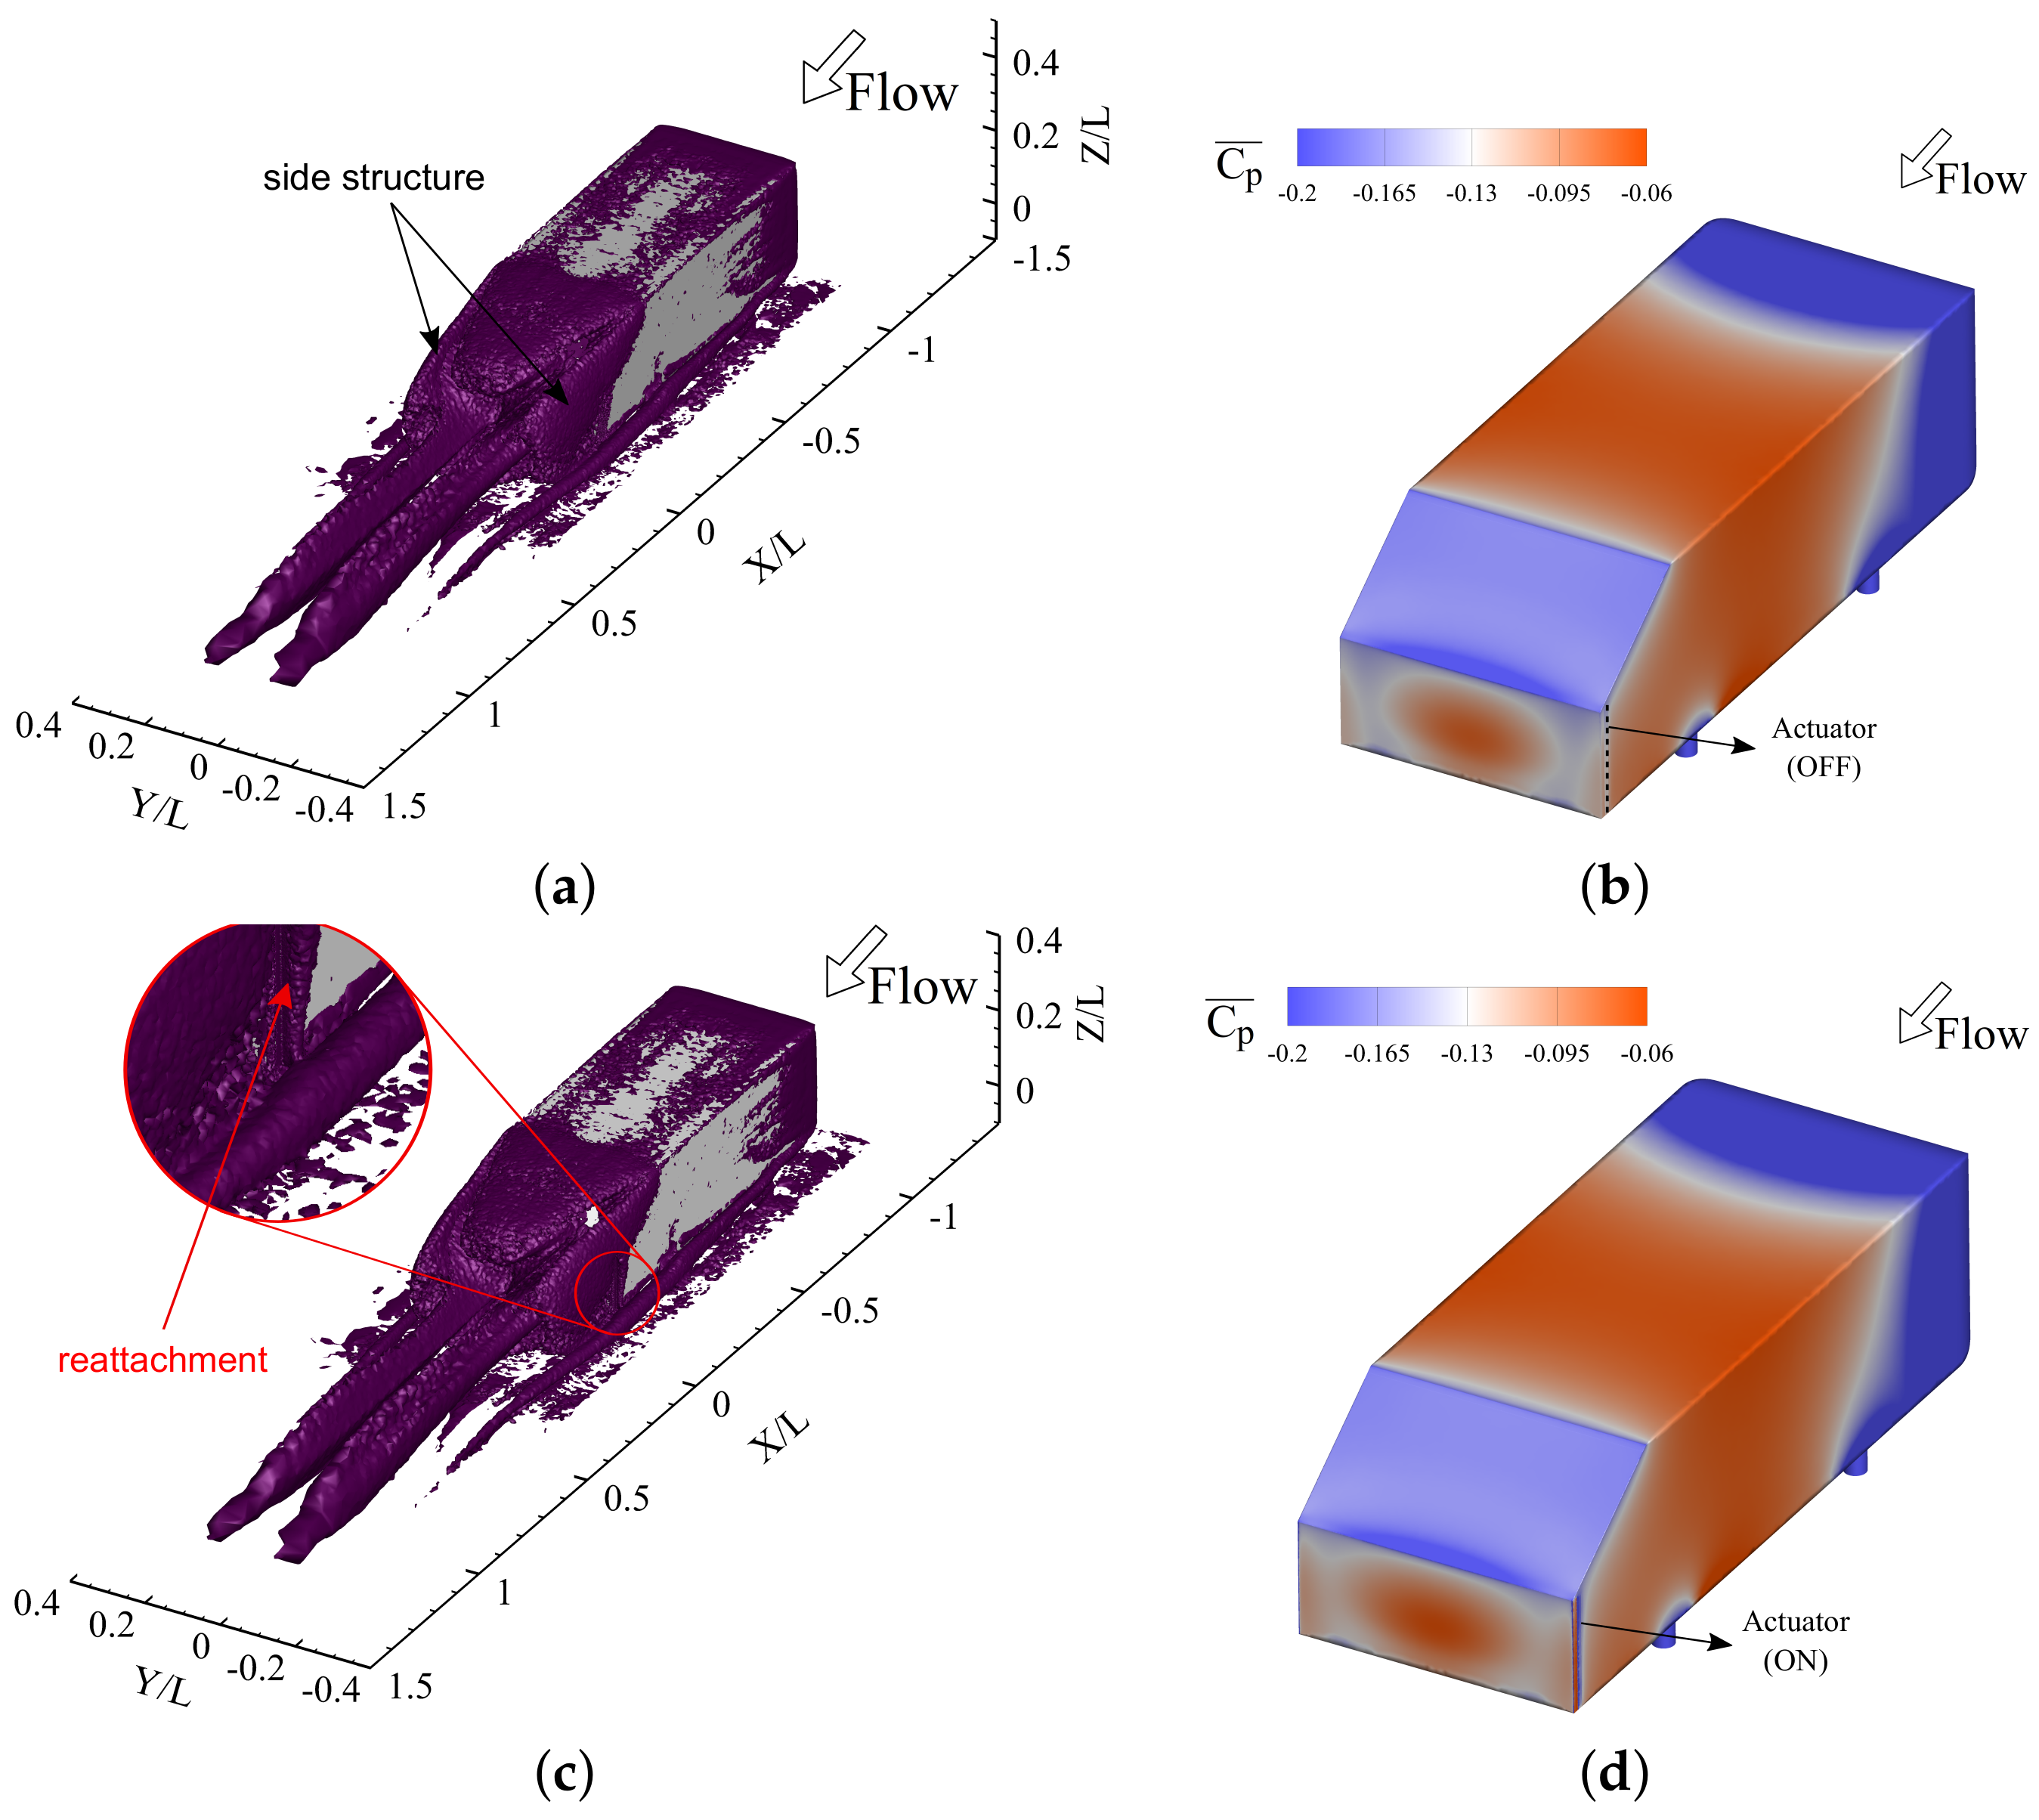
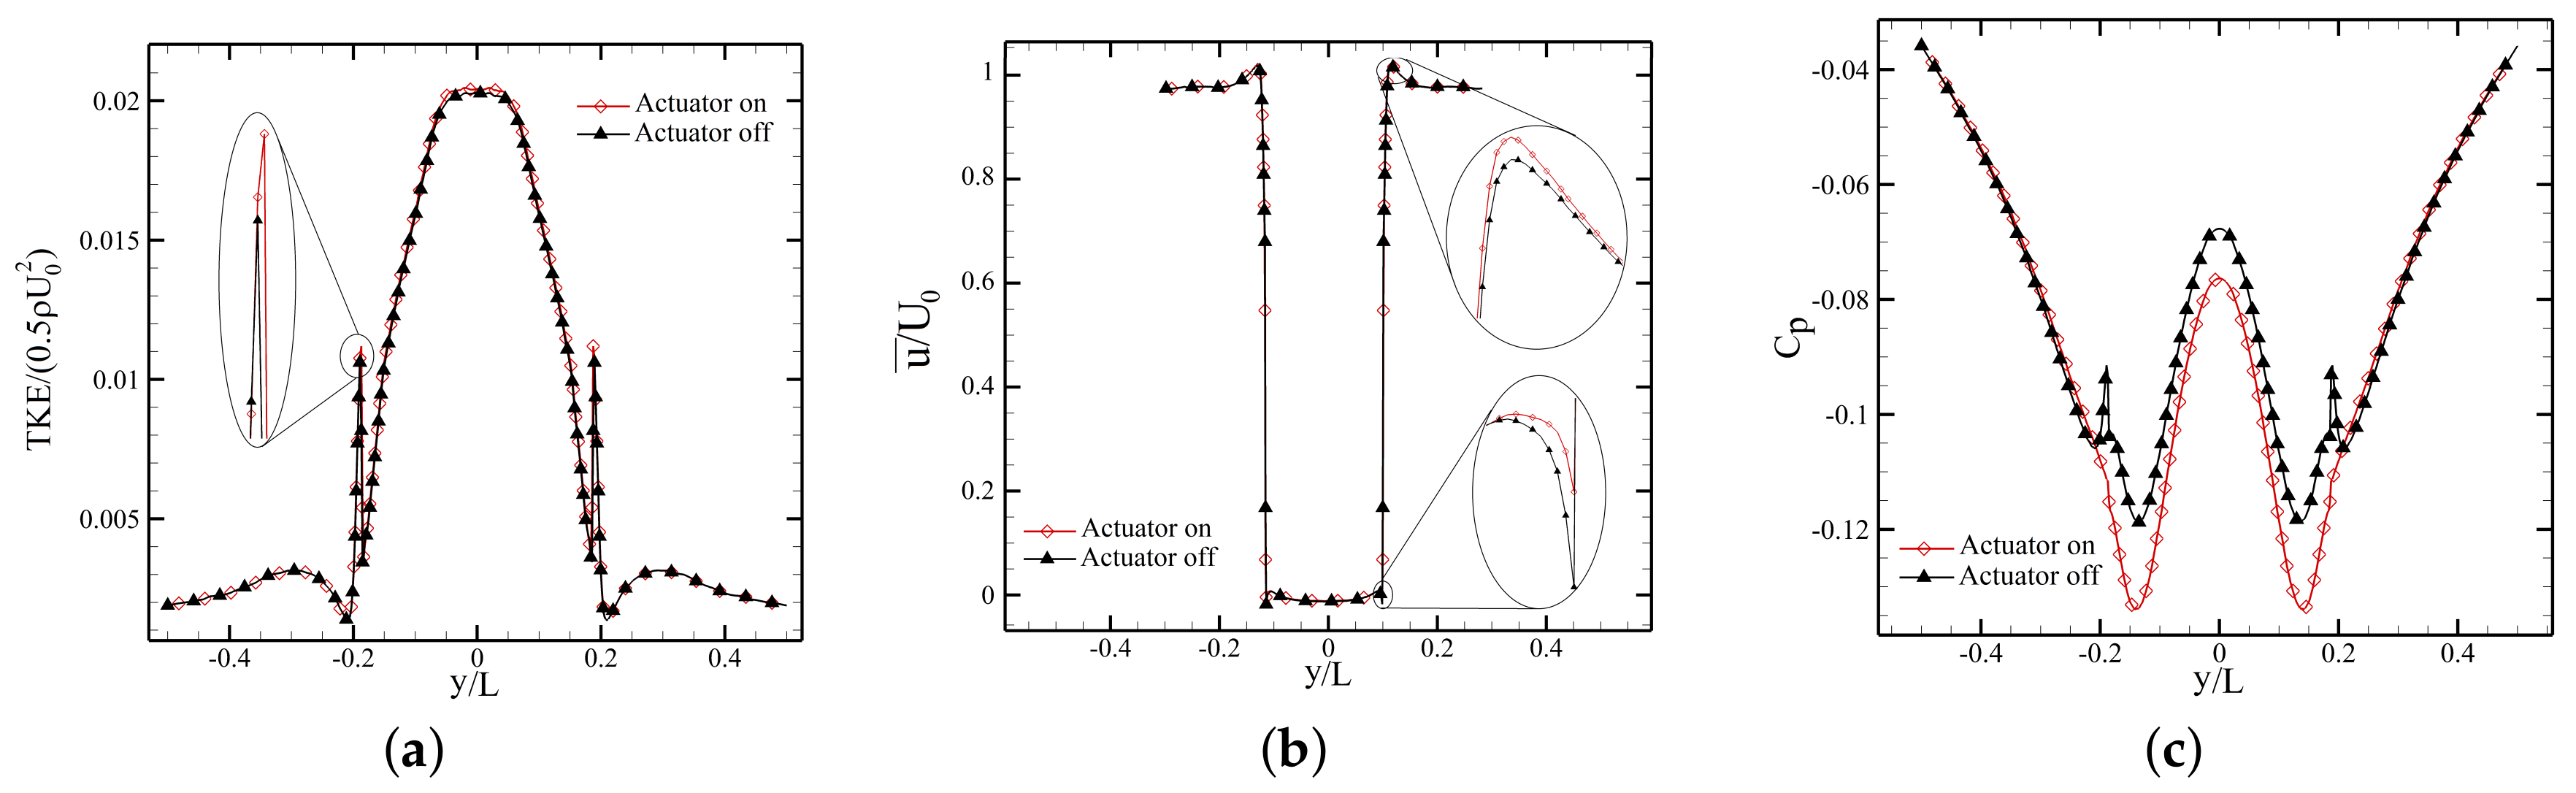
On the other hand, SDBD actuator on the side surfaces (case 5) does not significantly change the shape of 3D structures or the surface pressure on the slant surface (see Figure 16). To illustrate the reason for the small drag reduction in case 5, the distributions of turbulent kinetic energy, streamwise velocity and pressure coefficient at the near wake region ( and ) are plotted in Figure 17. Evidently, the DBD actuators on the side surfaces increased turbulence kinetic energy and streamwise velocity at the edge of the wake. The side SDBD actuators increased the flow entrainment from the freestream to the wake region, which led to alternation of pressure distribution in the wake region (see Figure 17c), although the shape of the wake structure remained the same (see Figure 16).
5.2. Experiments
Experimental drag measurements were carried out at . The combination of case 2 and case 5, which showed the most significant improvements in simulations, were used to determine the effect of implementing multiple configurations. The experimental results are presented in Table 7. Here, the "drag reduction" is calculated based on the difference in of the current study and that of the Ahmed body with no actuators. The "actuator drag reduction" provides the reduction in due to the active actuator, and thus it is calculated based on the difference in with the actuator being placed but remaining inactive. To investigate the repeatablity of the experimental results, all experiments were repeated three times, and the values in Table 7 are the averaged values from all experiments.
The results suggest that the placement of actuators reduces drag by 3.0–6.1%. The experimental results suggest that the characteristic of the separation bubble on the ramp has a significant effect on the Ahmed body drag force. Therefore, case 2 was a proper location for an SDBD actuator since it directly changed the size of the separation bubble and ramp pressure distribution. We examined operating case 2 and case 5 simultaneously. However, utilizing multiple configuration of actuators did not substantially change the performance in drag reduction. The drag reduction due to actuators running at 12 kV was compared to multiple arrangements and case 2 in Table 7. It is also notable that increasing the peak to peak voltage led to improvements in the actuator performance.
6. Conclusions
The performance of an active flow control around an Ahmed body model with and slant angles has been studied using a single dielectric barrier discharge (SDBD) actuator. This study focused on finding the best locations and applied voltages of the SDBD actuators in order to reduce drag on an Ahmed body, which is a simplified car model. The effect of implementing the actuators with multiple arrangements on aerodynamic performance of the body was also investigated. Numerical simulations have been carried out at a Reynolds number of (freestream velocity of 10 m/s) with the applied voltages of 8, 10 and 12 kV, and at Reynolds number of (freestream velocity of 40 m/s) with the applied voltage of 12 kV. The experimental tests were performed at the Reynolds number of with the applied voltages of 12 kV for the best location and with the applied voltages of 8, 10 and 12 kV for multiple arrangements. The combination of numerical and experimental results suggests that utilizing SDBD actuators operated in an effective condition can significantly improve the aerodynamic performance of ground vehicles by up to at low Reynolds numbers. However, due to the small amount of the body force exerted by SDBD actuators, their effectiveness decreases with increasing Reynolds numbers. Thus, other configurations of these actuators are needed for to-scale automobiles.
It was also apparent that the locations of actuators could significantly affect their performances in controlling flow around an Ahmed body. For the Ahmed body, the beginning part of the slant surface is the best location that leads to the most significant impact on the flow, and thus the drag. This aerodynamic improvement for case 2 is attributed to the reattachment of the separated flow on the slant surface, which leads to surface pressure increase on the slant and pressure. Furthermore, it is shown that the side SDBD actuators increase the streamwise velocity and turbulent kinetic energy at the edge of the near wake region and change the pressure distribution of inside the wake.
It is shown that increasing the applied voltage would improve the performance of the actuators in this case. However, there is a limitation on increasing this parameter, which is consistent with previous observations in the literature [5]. It was also determined that using different arrangements of actuators would not have any significant effect compared to the placement of a single actuator. However, multiple arrangements require more operational power, which leads to a relatively lower efficiency compared to single actuators.
Author Contributions
The conceptualization, methodology, validation, formal analysis, investigation and software, S.K. and A.Z.; data curation, writing—original draft preparation and visualization, S.K. and A.Z.; writing—review and editing, supervision, project administration and funding acquisition, M.M. and A.H. All authors have read and agreed to the published version of the manuscript.
Funding
This study has received support from the Canada First Research Excellence grant through the University of Alberta Future Energy Systems Institute.
Conflicts of Interest
The authors declare no conflict of interest.
References
- Choi, H.; Lee, J.; Park, H. Aerodynamics of Heavy Vehicles. Annu. Rev. Fluid Mech. 2014, 46, 441–468. [Google Scholar] [CrossRef]
- Bruneau, C.H.; Creusé, E.; Depeyras, D.; Gilliéron, P.; Mortazavi, I. Coupling active and passive techniques to control the flow past the square back Ahmed body. Comput. Fluids 2010, 39, 1875–1892. [Google Scholar] [CrossRef]
- Bideaux, E.; Bobillier, P.; Fournier, E.; Gilliéron, P.; El Hajem, M.; Champagne, J.; Gilotte, P.; Kourta, A. Drag reduction by pulsed jets on strongly unstructured wake: Towards the square back control. Int. J. Aerodyn. 2011, 1, 282–298. [Google Scholar] [CrossRef]
- Prakash, B.; Bergada, J.M.; Mellibovsky, F. Three dimensional analysis of ahmed body aerodynamic performance enhancement using steady suction and blowing flow control techniques. In Proceedings of the Tenth International Conference on CFD (ICCFD10), Barcelona, Spain, 9–13 July 2018. [Google Scholar]
- Corke, T.C.; Enloe, C.L.; Wilkinson, S.P. Dielectric Barrier Discharge Plasma Actuators for Flow Control. Annu. Rev. Fluid Mech. 2010, 42, 505–529. [Google Scholar] [CrossRef]
- Boucinha, V.; Weber, R.; Kourta, A. Drag reduction of a 3D bluff body using plasma actuators. Int. J. Aerodyn. 2011, 1, 262–281. [Google Scholar] [CrossRef]
- Do, H.; Kim, W.; Mungal, M.; Cappelli, M. Bluff Body Flow Separation Control Using Surface Dielectric Barrier Discharges. In Proceedings of the 45th AIAA Aerospace Sciences Meeting and Exhibit, Reno, NV, USA, 8–11 January 2007; p. 939. [Google Scholar]
- Khalighi, B.; Ho, J.; Cooney, J.; Neiswander, B.; Corke, T.C.; Han, T. Aerodynamic drag reduction investigation for a simplified road vehicle using plasma flow control. In Proceedings of the Fluids Engineering Division Summer Meeting—American Society of Mechanical Engineers, Washington, DC, USA, 10–14 July 2016. [Google Scholar]
- Forte, M.; Jolibois, J.; Pons, J.; Moreau, E.; Touchard, G.; Cazalens, M. Optimization of a dielectric barrier discharge actuator by stationary and non-stationary measurements of the induced flow velocity: Application to airflow control. Exp. Fluids 2007, 43, 917–928. [Google Scholar] [CrossRef]
- Littlewood, R.P.; Passmore, M.A. Aerodynamic drag reduction of a simplified squareback vehicle using steady blowing. Exp. Fluids 2012, 53, 519–529. [Google Scholar] [CrossRef] [Green Version]
- Ebrahimi, A.; Movahhedi, M. Power improvement of NREL 5-MW wind turbine using multi-DBD plasma actuators. Energy Convers. Manag. 2017, 146, 96–106. [Google Scholar] [CrossRef]
- Shadmani, S.; Mousavi Nainiyan, S.M.; Mirzaei, M.; Ghasemiasl, R.; Pouryoussefi, S. Experimental Investigation of Flow Control over an Ahmed Body using DBD Plasma Actuator. J. Appl. Fluid Mech. 2018, 11, 1267–1276. [Google Scholar] [CrossRef]
- Guilmineau, E.; Deng, G.; Leroyer, A.; Queutey, P.; Visonneau, M.; Wackers, J. Assessment of hybrid RANS-LES formulations for flow simulation around the Ahmed body. Comput. Fluids 2018, 176, 302–319. [Google Scholar] [CrossRef]
- Menter, F.R. Two-equation eddy-viscosity turbulence models for engineering applications. AIAA J. 1994, 32, 1598–1605. [Google Scholar] [CrossRef] [Green Version]
- Lanfrit, M. Best Practice Guidelines for Handling Automotive External Aerodynamics with FLUENT; Technical Report; Fluent Deutschland GmbH: Darmstadt, Germany, 2005. [Google Scholar]
- Mohammadikalakoo, B.; Schito, P.; Mani, M. Passive flow control on Ahmed body by rear linking tunnels. J. Wind Eng. Ind. Aerodyn. 2020, 205, 104330. [Google Scholar] [CrossRef]
- Hassaan, M.; Badlani, D.; Nazarinia, M. On the effect of boat-tails on a simplified heavy vehicle geometry under crosswinds. J. Wind. Eng. Ind. Aerodyn. 2018, 183, 172–186. [Google Scholar] [CrossRef]
- Suzen, Y.; Huang, G.; Jacob, J.; Ashpis, D. Numerical Simulations of Plasma Based Flow Control Applications. In Proceedings of the 35th AIAA Fluid Dynamics Conference and Exhibit, Toronto, ON, Canada, 6–9 June 2005; pp. 2005–4663. [Google Scholar]
- Bouchmal, A. Modeling of Dielectric-Barrier Discharge Actuator: Implementation, Validation and Generalization of an Electrostatic Model. Master Thesis, Delft University of Technology, Delft, The Netherlands, 2011. [Google Scholar]
- Jayaraman, B.; Cho, Y.C.; Shyy, W. Modelling of dielectric barrier discharge plasma actuator. J. Appl. Phys. 2008, 103, 053304. [Google Scholar] [CrossRef]
- Fogaing, M.B.; Hemmati, A.; Lange, C.F.; Fleck, B.A. Performance of turbulence models in simulating wind loads on Photovoltaics modules. Energies 2019, 12, 3290. [Google Scholar] [CrossRef] [Green Version]
- Meile, W.; Brenn, G.; Reppenhagen, A.; Lechner, B.; Fuchs, A.; Akademia Baru, P. Experiments and numerical simulations on the aerodynamics of the Ahmed body. CFD Lett. 2011, 3, 32–39. [Google Scholar]
- Angelis, W.; Drikakis, D.; Durst, F.; Khier, W. Numerical and experimental study of the flow over a two-dimensional car model. J. Wind. Eng. Ind. Aerod. 1996, 62, 57–79. [Google Scholar] [CrossRef]
- Metka, M. Flow Control on the Ahmed Body Vehicle Model Using Fluidic Oscillators. In Proceedings of the ASME 2013 International Mechanical Engineering Congress and Exposition, San Diego, CA, USA, 15–21 November 2013. [Google Scholar]
Figure 1.
Computational domain (not to scale).

Figure 2.
Comparing the mean velocity profiles at and for the the grid quality study at .

Figure 3.
Distribution of mean on the Ahmed body surfaces at Reynolds number of .

Figure 4.
Schematic of dielectric barrier discharge (DBD) actuator.

Figure 5.
Geometry of the Ahmed body.

Figure 6.
Different locations of single dielectric barrier discharge (SDBD) on the surface of the Ahmed body.
Figure 6.
Different locations of single dielectric barrier discharge (SDBD) on the surface of the Ahmed body.

Figure 7.
Picture of the Ahmed body used in experiments.

Figure 8.
Streamlines in the symmetry plane for slant angle .

Figure 9.
Profiles of the streetwise velocity component in the wake region of slant angle of the Ahmed body.
Figure 9.
Profiles of the streetwise velocity component in the wake region of slant angle of the Ahmed body.

Figure 10.
Velocity distribution of an SDBD actuator at zero freestream velocity.

Figure 11.
Velocity vector plot over actuator region for slant angle case 2. (a) actuator off, (b) actuator on.
Figure 11.
Velocity vector plot over actuator region for slant angle case 2. (a) actuator off, (b) actuator on.

Figure 12.
Streamlines on the symmetry plane for slant angle and . (a) Actuator off, (b) case 1, (c) case 2, (d) case 5.
Figure 12.
Streamlines on the symmetry plane for slant angle and . (a) Actuator off, (b) case 1, (c) case 2, (d) case 5.

Figure 13.
Streamlines on the symmetry plane for slant angle and : (a) actuator off; (b) case 2.

Figure 14.
Pressure coefficient profile in the rear and slanted surface at , before (clean) and after (case 2) actuators.
Figure 14.
Pressure coefficient profile in the rear and slanted surface at , before (clean) and after (case 2) actuators.

Figure 15.
Isosurface plot of and contours of surface pressure for case 2 with the slant angle of . For (a,b) the SDBD actuator is off, and for (c,d) the SDBD actuator is on.
Figure 15.
Isosurface plot of and contours of surface pressure for case 2 with the slant angle of . For (a,b) the SDBD actuator is off, and for (c,d) the SDBD actuator is on.

Figure 16.
Isosurface plot of and contours of surface pressure for case 5 with the slant angle of slant angle of . For (a,b), the SDBD actuator is off, and for (c,d) the SDBD actuator is on.
Figure 16.
Isosurface plot of and contours of surface pressure for case 5 with the slant angle of slant angle of . For (a,b), the SDBD actuator is off, and for (c,d) the SDBD actuator is on.

Figure 17.
(a) Turbulent kinetic energy, (b) streamwise velocity and (c) coefficient of pressure for case 5 at , (near wake) and .
Figure 17.
(a) Turbulent kinetic energy, (b) streamwise velocity and (c) coefficient of pressure for case 5 at , (near wake) and .


Table 1.
Comparison of drag coefficients based on different spatial grid distributions at .
| Name | Slant Angle | |||
|---|---|---|---|---|
| Grid 1 | 0.292 | − | ||
| Grid 2 | 0.280 | |||
| Grid 3 | 0.277 | |||
| Grid 1 | 0.280 | − | ||
| Grid 2 | 0.267 | |||
| Grid 3 | 0.266 |
Table 2.
Comparing the numerical setup with the literature at .
| Study | Slant Angle | Method | |
|---|---|---|---|
| Present Study | Numerical SST | 2.80 | |
| Guilmineau et al. [13] | Numerical SST | 3.21 | |
| Meile et al. [22] | Experimental | 2.99 | |
| Angelis et al. [23] | Experimental | 2.85 | |
| Present Study | Numerical SST | 2.67 | |
| Guilmineau et al. [13] | Numerical SST | 2.99 | |
| Meile et al. [22] | Experimental | 2.79 | |
| Angelis et al. [23] | Experimental | 2.58 |
Table 3.
Comparison of the experimental and numerical .
| Study | Experimental | Numerical | |
|---|---|---|---|
| Without Actuator | 3.30 | 3.03 | |
| Actuator Off | 3.20 | 3.06 | |
| Actuator On | 3.00 | 2.86 |
Table 4.
The maximum velocity and body force magnitude generated by an SDBD actuator at zero freestream velocity.
Table 4.
The maximum velocity and body force magnitude generated by an SDBD actuator at zero freestream velocity.
| Present Study | Bouchmal [19] | Suzen et al. [18] | |
|---|---|---|---|
| Maximum velocity [m/s] | 0.93 | 0.93 | 1 |
| Body Force Magnitude [N/m] | 1456 | 1444 | 1250 |
Table 5.
Numerical results at a frequency of 4.5 kHz and at for an Ahmed body with a slant angle of 25. Here, denotes the drag reduction, and denotes the actuator drag reduction (+ sign indicate reduced drag).
Table 5.
Numerical results at a frequency of 4.5 kHz and at for an Ahmed body with a slant angle of 25. Here, denotes the drag reduction, and denotes the actuator drag reduction (+ sign indicate reduced drag).
| Study | Status | V (kV) | ||||||
| No Actuator | - | - | 3.03 | - | - | 2.87 | - | - |
| Case 1 | OFF | - | 3.04 | −0.33% | - | 2.85 | +0.60% | - |
| Case 1 | ON | 8 | 3.02 | +0.33% | +0.66% | 2.83 | +1.40% | +1.20% |
| Case 1 | ON | 10 | 3.06 | −0.99% | −0.66% | 2.91 | −1.40% | −2.00% |
| Case 1 | ON | 12 | 3.10 | −2.31% | −1.98% | 2.93 | −2.20% | −2.80% |
| Case 2 | OFF | - | 3.06 | −0.99% | - | 2.87 | 0.00% | - |
| Case 2 | ON | 8 | 3.03 | 0.00% | +0.99% | 2.86 | +0.30% | +0.30% |
| Case 2 | ON | 10 | 3.00 | +0.99% | +1.98% | 2.85 | +0.70% | +0.70% |
| Case 2 | ON | 12 | 2.85 | +5.61% | +6.60% | 2.78 | +3.10% | +3.10% |
| Case 3 | OFF | - | 3.02 | +0.33% | - | 2.91 | −1.50% | - |
| Case 3 | ON | 8 | 3.02 | +0.33% | 0.00 % | 2.92 | −1.70% | −0.20 % |
| Case 3 | ON | 10 | 3.02 | +0.33% | 0.00% | 2.92 | −1.70% | −0.20% |
| Case 3 | ON | 12 | 3.01 | +0.66% | +0.33% | 2.93 | −2.10% | −0.60% |
| Case 4 | OFF | - | 3.00 | +0.99% | - | 2.93 | −2.10% | - |
| Case 4 | ON | 8 | 3.01 | +0.66% | −0.33% | 2.94 | −2.40% | −0.30% |
| Case 4 | ON | 10 | 3.00 | +0.99% | 0.00% | 2.95 | −2.80% | −0.70% |
| Case 4 | ON | 12 | 3.00 | +0.99% | 0.00% | 2.95 | −2.90% | −0.80% |
| Case 5 | OFF | - | 3.01 | +0.66% | - | 2.87 | 0.00% | - |
| Case 5 | ON | 8 | 3.00 | +0.99% | +0.33% | 2.87 | 0.00% | 0.00% |
| Case 5 | ON | 10 | 2.98 | +1.65% | +0.99% | 2.86 | +0.30% | +0.30% |
| Case 5 | ON | 12 | 2.95 | +2.64% | +1.98% | 2.84 | +1.00% | +1.00% |
Table 6.
Drag reduction at with actuator frequency at 4.5 kHz.
| Study | Slant Angle | |||
|---|---|---|---|---|
| Case 2 | 2.86 | 3.06 | +6.50% | |
| Case 2 | 2.78 | 2.87 | +3.14% | |
| Multi-Configuration | 2.89 | 3.03 | +4.62% | |
| Multi-Configuration | 2.84 | 2.90 | +2.12% |
Table 7.
Experimental results at for slant angle .
| Study | Status | V (kV) | |||
|---|---|---|---|---|---|
| No Actuator | - | - | 0.33 | - | - |
| Case 2 | OFF | - | 0.32 | +3.00% | - |
| Case 2 | ON | 12 | 0.30 | +9.10% | +6.10% |
| Multi-Config. | OFF | - | 0.32 | +3.00% | - |
| Multi-Config. | ON | 8 | 0.31 | +6.10% | +3.10% |
| Multi-Config. | ON | 10 | 0.31 | +6.10% | +3.10% |
| Multi-Config. | ON | 12 | 0.30 | +9.10% | +6.10% |
Publisher’s Note: MDPI stays neutral with regard to jurisdictional claims in published maps and institutional affiliations. |
© 2020 by the authors. Licensee MDPI, Basel, Switzerland. This article is an open access article distributed under the terms and conditions of the Creative Commons Attribution (CC BY) license (http://creativecommons.org/licenses/by/4.0/).
Share and Cite
MDPI and ACS Style
Karimi, S.; Zargar, A.; Mani, M.; Hemmati, A. The Effect of Single Dielectric Barrier Discharge Actuators in Reducing Drag on an Ahmed Body. Fluids 2020, 5, 244. https://doi.org/10.3390/fluids5040244
AMA Style
Karimi S, Zargar A, Mani M, Hemmati A. The Effect of Single Dielectric Barrier Discharge Actuators in Reducing Drag on an Ahmed Body. Fluids. 2020; 5(4):244. https://doi.org/10.3390/fluids5040244
Chicago/Turabian StyleKarimi, Saber, Arash Zargar, Mahmoud Mani, and Arman Hemmati. 2020. "The Effect of Single Dielectric Barrier Discharge Actuators in Reducing Drag on an Ahmed Body" Fluids 5, no. 4: 244. https://doi.org/10.3390/fluids5040244