
Reducing Aerodynamic Drag on Flatbed Trailers for Passenger Vehicles Using Novel Appendable Devices

School of Mechanical and Materials Engineering, University College Dublin, D04 PR94 Dublin, Ireland
*
Author to whom correspondence should be addressed.
Fluids 2023, 8(11), 289; https://doi.org/10.3390/fluids8110289
Submission received: 25 September 2023
/
Revised: 24 October 2023
/
Accepted: 25 October 2023
/
Published: 27 October 2023
(This article belongs to the Special Issue Aerodynamics and Aeroacoustics of Vehicles, 3rd Edition)
Abstract
:This article presents a study on the aerodynamic drag of a generic dual-axle flatbed trailer and explores ways to reduce the drag using appendable drag-reducing devices. The primary sources of drag originated from the van and trailer’s rear, along with the trailer’s wheels. The most-effective initial device for reducing drag was a full trailer underside cover, which offered a 7% drag reduction. Additionally, ladder racks, dropsides, and rear gates were studied, and it was found that protruding ladder racks significantly increased drag. Rear gates added large amounts of drag and should be removed and stored when not needed. The study also explored novel mid-section devices that increased the van’s base pressure and reduced drag. An axle test revealed that drag for single-, dual-, and triple-axle trailers was very similar in direct flow, but different in yawed flow. A drawbar length test showed a near-linear relationship between drawbar length and drag, manifesting as a 1.7% change in drag per 250 mm change in drawbar length. Several novel modifications were made to the trailer, including fitting six unique appendable devices, which offered a total 7.3% drag reduction. A novel rear van device known as the multi-stage converging cavity was introduced, which reduced drag by nearly 18%. When all the devices were used together, a total 25% drag reduction was observed for the van–trailer combination.
1. Introduction
As of Q2 2023, a considerable knowledge gap exists within the literature on van–trailer aerodynamics. With a global effort under way to transition the world’s transport sector to electric vehicles, it is ever more important to understand the aerodynamics of van–trailer combinations and explore options for novel drag reduction as fears mount within the consumer market that electric vehicles are not suitable for towing due significant range detriment. The Irish government under their ambitious 2021 climate action plan aim to half Greenhouse Gas (GHG) emissions by 2030 and achieve net zero by 2050 [1]. As of 2021, the Irish transport sector accounts for approximately 20% of the country’s GHG emissions [1], highlighting the need for continued work on and research into drag reduction technology. Aerodynamic drag is the most-dominant resistance force opposing a ground vehicle’s motion when travelling at speeds above 80 km/h [2]. In general, four forces oppose a ground vehicle in motion, namely acceleration resistance, gradient resistance, rolling resistance, and air resistance. Vehicles with large drag coefficients are particularly affected when travelling at highway and motorway speeds ranging from 80–120 km/h. EU law requires that vehicles towing a trailer are to restrict their speeds to 80 km/h or less. When a van and trailer are travelling at 80 km/h, or above, the resistance due to aerodynamic drag is well above half the vehicle’s total resistance. Drag reduction through the application of appendable devices can play a key role in reducing fuel consumption and improving driving range for electric vehicles, particularly when towing a trailer. As a general rule of thumb, a 20% drag reduction would materialise as a 10% fuel savings when travelling at highway speeds [3].
Flatbed trailers are used to transport a variety of large or irregularly sized cargo and usually consist of a large bed supported by one to three axles. It is also common for flatbeds to be fitted with drop sides, rear gates, and front faces with mounting/tying bars. While the aerodynamics of these trailers largely depend on their cargo, theoretically, they may spend half their time unloaded while returning to their starting location. Few studies exist within the literature outlining the aerodynamics of this type of trailer when towed by vans, and none detail how their drag can be reduced through the application of appendable devices. Some research exists on van–trailer aerodynamics for box trailers; however, this combination’s drag is significantly different from that of a flatbed, as the box trailer and van can benefit largely from interference drag between the vehicles in the gap area, which reduces this combination’s drag. This article aimed to inform both consumers and trailer manufacturers of the drag saving potential for flatbed trailers using appendable devices. These aftermarket devices are fit to a vehicle to alter the flow regime around the vehicle, which subsequently reduces drag. Many such devices have already been outlined within the literature; however, their adoption within the transport sector has been scarce. The rear of a vehicle is a location highly suited for an appendable device, yet many trucks, buses, and vans operate without one. It is envisaged that, in 30 years’ time, such devices may be mandatory through government legislation as the need to meet climate action targets necessitates their application on all road vehicles.
2. Literature Review
In 2022 [4], Pudell and Edelmann studied the drag changes experienced on an electric sedan and SUV when towing four different types of trailers. They showed that the SUV reported smaller drag increases compared to the sedan due to the enhanced slip-streaming effect present on the trailer behind the SUV, with a 250% increase for the sedan and a 120% drag increase for the SUV when towing a box trailer. A similar work by Atif et al. [5] studied two box trailers and varied parameters such as the vehicle gap distance, trailer roof height, and diffuser angles. Both trailers were towed by the same estate-style car. They found that the gap distance significantly affected the wake region between the car and trailer, and the reduced gap distance offered lower drag due to favourable interference drag. This effect diminished as the gap distance increased. In 2018 [6], on-road testing with a 1.9 L TDI Skoda Octavia and a 136 kg single-axle trailer was performed to investigate variations in fuel consumption. The results for a constant speed test showed that towing the trailer at 90 km/h caused an approximate 30% increase in fuel consumption. The author noted that, when the top cover for the trailer was removed, fuel consumption rose and asserted that the reason for the rise was due to increased drag force, brought on by the air filling the trailer’s internal space and impeding its motion. Chow in 2022 [7] highlighted that driving cycles such as the NEDC and the newer WLTP do not correctly characterise vehicles that carry out long-haul journeys, due to the small amount of time the tests spend at highway speeds. For example, the NEDC would assert that a 10% reduction in drag would only materialise as a 2% fuel savings. In reality for long-distance, highway-speed driving, the effect of a 10% reduction should be between 2% and 3.5%, given that the journey’s average speed sits between 70 and 100 km/h. Similarly, Fontaras et al. [8] offered heavy criticism of the NEDC for its neglect of factors influencing CO emissions and estimated that real-world emissions are between 30 and 50% higher than those predicted by the NEDC tests. A reference was made to a 2014 study [9], in which an SUV towed a box trailer and a near 100% increase in fuel consumption was observed when travelling at 100 km/h. In 2021, Ventura et al. [10] evaluated the potential benefits of applying add-on aerodynamic devices to flatbed trailers on trucks and outlined average annual fuel savings per tractor-trailer. They concluded that these add-on devices are a worthwhile economic strategy for reducing GHG emissions in the freight sector. Other studies [11,12,13,14] have considered the drag reduction potential for large tractor-trailers using appendable devices such as gap fairings, side skirts, boat tails, corner vanes, and general flow deflectors, all highlighting the fuel savings achievable through their practical implementation. The most-applicable device outlined within the literature is the boat tail, as it substantially reduces drag on the vehicle’s rear surfaces. Many articles have been published that explore its use on tractor-trailers along with its optimisation through designed experiments. Hoffman et al. [15] combined a conventional boat tail with vortex generators and active flow control to realise substantial drag reductions for the rear of a bluff body, while [16] experimented on a boat tail fit to a generic van shape in crossflow and observed that the optimised boat tail not only reduced drag, but also reduced wake instabilities in a crosswind, improving driving stability and fuel economy. Most articles on large tractor-trailers have some relevance to smaller van–trailer combinations like those for vans and flatbed trailers; however, while the devices can be applicable to flatbeds, there is still a need for more-specific devices tailored to smaller trailers. This article attempts to bridge this gap by contributing new novel drag-reducing devices for flatbed trailers, specifically highlighting areas in need of drag reduction, and quantifying the effectiveness of each device.
3. Computational Setup and Numerical Methodology
3.1. Governing Equations
The airflow over ground vehicles can be effectively modelled using a continuum approach as only the macroscopic interactions are of interest, with any given fluid element being the average of a large number of fluid particles in both space and time. Air was modelled as an isothermal Newtonian fluid with constant viscosity and density. The constant density assumption was justified as the investigated flows had Mach numbers below 0.3, minimising compressibility effects. The governing equations that form the basis for CFD simulations are the Navier–Stokes equations (Equations (1) and (2)), which are derived from the principles of mass and momentum conservation. For steady incompressible flow, the transient term goes to zero in Equations (1) and (2). The body force term is also set to zero. In Equations (1)–(5), is the velocity component in the direction, is the fluid density, P is pressure, t is time, and is viscosity.
These two equations are then decomposed into fluctuating and mean components, as per Equation (3), to arrive at the Reynolds-Averaged Navier–Stokes (RANS) equations. The CFD results detailed throughout this article were realised using ANSYS Fluent, which solves the Reynolds-Averaged Navier–Stokes (RANS) equations detailed below in Equations (4) and (5) with the help of turbulence models such as the SST model [17], where k is the turbulent kinetic energy and is the specific rate of dissipation in this two-equation turbulence model. Widespread CFD simulations are made affordable in the academic and industrial sectors due to the application of the Reynolds-Averaged Navier-Stokes equations, which offer very reasonable numerical results to the governing equations without the need for more-advanced hybrid-Large Eddy Simulations (LESs) or LESs.
Fluent also produces force measurements for the simulated geometry once the pressure is calculated at each cell in the vicinity of the geometry. It is common practice when designing and comparing vehicles to express the forces and moments on a vehicle in terms of dimensionless coefficients. The formulas for the two main force coefficients used throughout this article are detailed in Equations (6) and (7). and are the drag and lift coefficients, respectively, where “V” is the free-stream velocity, while and are the respective drag and lift forces, which are computed from the CFD simulations. The “A” term in the formulas represents the projected frontal area of the vehicle. Note that a 0.001 change is referred to as a 1 drag count change.
3.2. CFD Methodology and Setup
3.3. Domain Setup
All ground vehicle geometries were modelled using Solidworks 2021 and were imported into Ansys Spaceclaim for domain setup and sizing. A domain sized 4L in front, 12L behind, 5H above, and 5W to the side was formed around the geometry in which L, W, and H are the respective geometric length, width, and height. For the majority of the simulations, L = 10 m, W = 2.25 m, and H = 1.875 m. All vehicle surfaces were modelled as stationary walls, while the ground was set as a moving no-slip wall, the inlet a velocity inlet, and the outlet a pressure outlet. The wheels were set as moving walls with the rotating boundary condition applied to model their rotation. The model was split in half to save on size along its symmetry plane. The symmetry plane, along with the two sky surfaces, was given the symmetry boundary condition. For crosswind studies, the symmetry condition along the symmetry plane was removed, and a full-size model was studied. Additionally, two inlets and two outlets were used along with additional domain sizing, particularly on the model’s leeward side.
3.4. Mesh and Solver Settings
All models were meshed using Ansys Fluent’s in-built meshing tool. The surface mesh consisted of 1–8 mm elements on bulk surfaces, with smaller elements used on finer features. The inflation layer consisted of 8 layers with a first cell height of 0.1 mm to ensure a y+ less than 5 over each model’s surface. In general, the y+ was much closer to 1 than 5 over the bulk of the model. A poly-hexcore volume mesh was grown throughout the fluid domain with elements closest to the model being sized at 22 mm. Two coarser refinement regions of 30 mm and 42 mm existed outside this finer region. The wake regions consisted of 45 mm elements. The remainder of the domain was restricted to a max element of size 256 mm. The SST turbulence model was used to model turbulence throughout the domain. The steady-state, pressure-based, coupled, pseudo-transient solver was used with a density of 1.2215 kg/m and a = Pas. The velocity inlet was set to 22 m/s, while the pressure outlet was set to a 0 Pa gauge. The moving ground was set to 22 m/s in the flow direction, while the wheels rotated around their centres according to . All solver schemes were second-order. Simulations were run for 1250 iterations, with the aerodynamic coefficients being averaged over the last 250 iterations. Once set up, case files were exported to 48-core HPC clusters for solving. The simulations ran for approximately 24 h each with the entire study consuming 55,000 CPU hours.
3.5. Reynolds Number Sensitivity Study
The results from Table 1 show that, from a speed of 60 km/h or more, the value for the baseline van and trailer was constant. For slower speeds such as 40 km/h, higher drag coefficients are reported due to an increased amount of viscous-related effects and the reduced inertial momentum of the flow. This resulted in some increased flow separation and, hence, increased the values [18]. The baseline model referenced was FBT1, which is detailed at the start of the Results Section.
3.6. Mesh Sensitivity Study
Table 2 outlines the results of the mesh sensitivity study and confirms that the 37-million-cell mesh used on the baseline van and trailer was sufficiently fine. All meshes report the same value with a max deviation of 0.65%, highlighting the high quality of the meshes. No coarser mesh was used as reducing the cell count further below 25.3-million would risk solver issues, as there is a minimum mesh resolution required to correctly use the SST turbulence model.
3.7. Validation Study
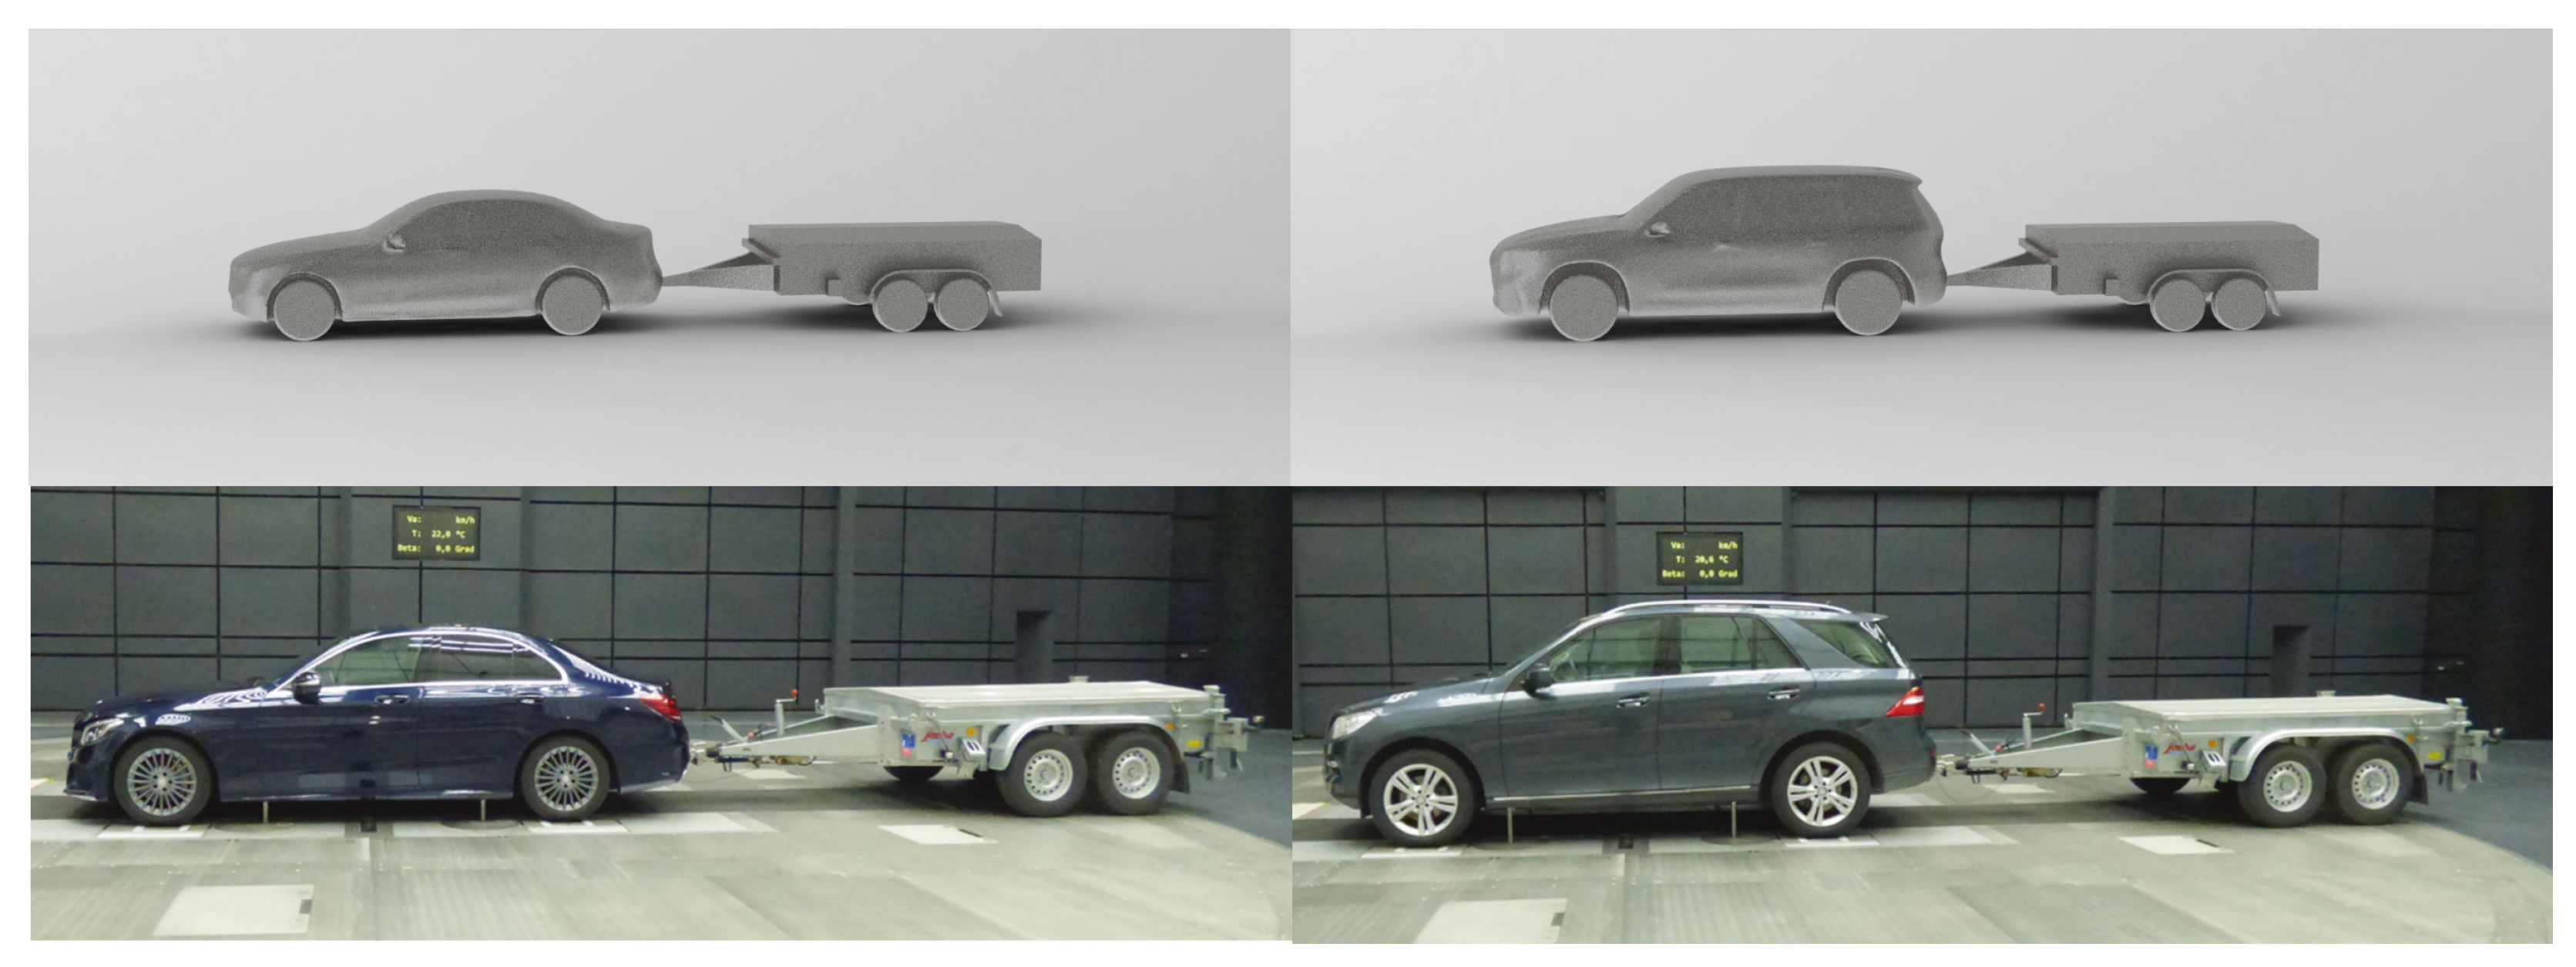
Published material related to full-scale wind tunnel testing of trailers designed for passenger cars is scantly found in the literature. Considerable difficulty arises when simulating the wheel rotation of the trailer and the ground motion under it. Most tunnels have four tracks designated for the four wheels of the tow vehicle and a fifth track that runs under the tow vehicle, but may not run long enough under the trailer. There are also issues around the mounting of the trailer to ensure it does not transmit any of the air load it experiences to the ground when the wind tunnel is running. In 2022, engineers from Mercedes tested the aerodynamic influence of trailers on battery electric vehicles, including the testing of a generic flatbed trailer when connected to a Mercedes-Benz C-Class and a GLE SUV [4]. A CFD study to replicate the wind tunnel testing performed by Mercedes on the Sedan and SUV was carried out, the results of which are detailed in Table 3. The simulated geometry along with the real geometry used in wind tunnel testing can be seen in Figure 1.
Very good agreement is seen between the CFD and wind tunnel results for all combinations with the exception of the sedan-only variant having the largest percentage difference of 13.8%. This larger deviation is attributable to the smoother shape of the simulated geometry versus that of the sedan used in the wind tunnel experiments. For example, the smooth underside and smooth wheels devoid of ventilation drag are the reasons for the CFD simulation reporting a smaller drag value. Overall, the results showed that the CFD methodology used throughout this work has an acceptable level of validation with full-scale wind tunnel testing performed on vehicle–trailer combinations.
4. Results and Discussion
4.1. Flatbed Trailer 1.0
To effectively investigate the aerodynamics of flatbed trailers, a generic model for a flatbed trailer was established that closely represented the majority of flatbeds in operation in Ireland and the U.K. Flatbed Trailer 1.0 (FBT1) was a twin-axle, torsion suspension trailer with a 3.7 m × 1.92 m bed raised 670 mm off the ground. The trailer was attached to a generic electric van model. Figure 2 outlines FBT1’s geometry. Note that the wheels of both the trailer and van use slick tires with alloy covers to improve aerodynamics and to remove the requirement for sliding mesh or moving reference frame modelling. The aerodynamic results for FBT1 are outlined in Table 4.
For reference, the standalone van had a drag coefficient of 0.331 and a lift coefficient of −0.323. Note that the frontal area for the van–trailer combination was approximately equal to that of the standalone van, which was the case for all configurations to follow unless stated otherwise. Therefore, all drag reductions will be discussed explicitly in terms of % reduction and not drag area (A). When attached, the trailer increases the body’s drag by 40.79%, while also significantly reducing the amount of downforce generated by the combination. This downforce reduction is due to the trailer bed’s upper surface experiencing an uplifting force due to the fast-moving flow above it and the underside experiencing stagnation, inducing high underside pressure.
To help understand the increase in drag, Figure 3 is presented, which shows the drag force accumulation along the combination’s length. As expected, there was a large contribution from the van’s front; however, the rear surfaces of both the van and trailer were shown to have similarly substantial contributions, with the van rear carrying 25% and the trailer rear 9% of the total drag. This observation highlights the need for appendable drag-reduction devices on all rear surfaces. Other areas suited for drag reduction devices include the trailer’s drawbar and face, along with the trailer’s wheels and axle package. The primary cause of drag on the rear surfaces is the under-pressured wake that follows them. Figure 4 clearly highlights the extent of the wakes present on FBT1 and gives an outline of the magnitude of the under-pressure near the rear surfaces.
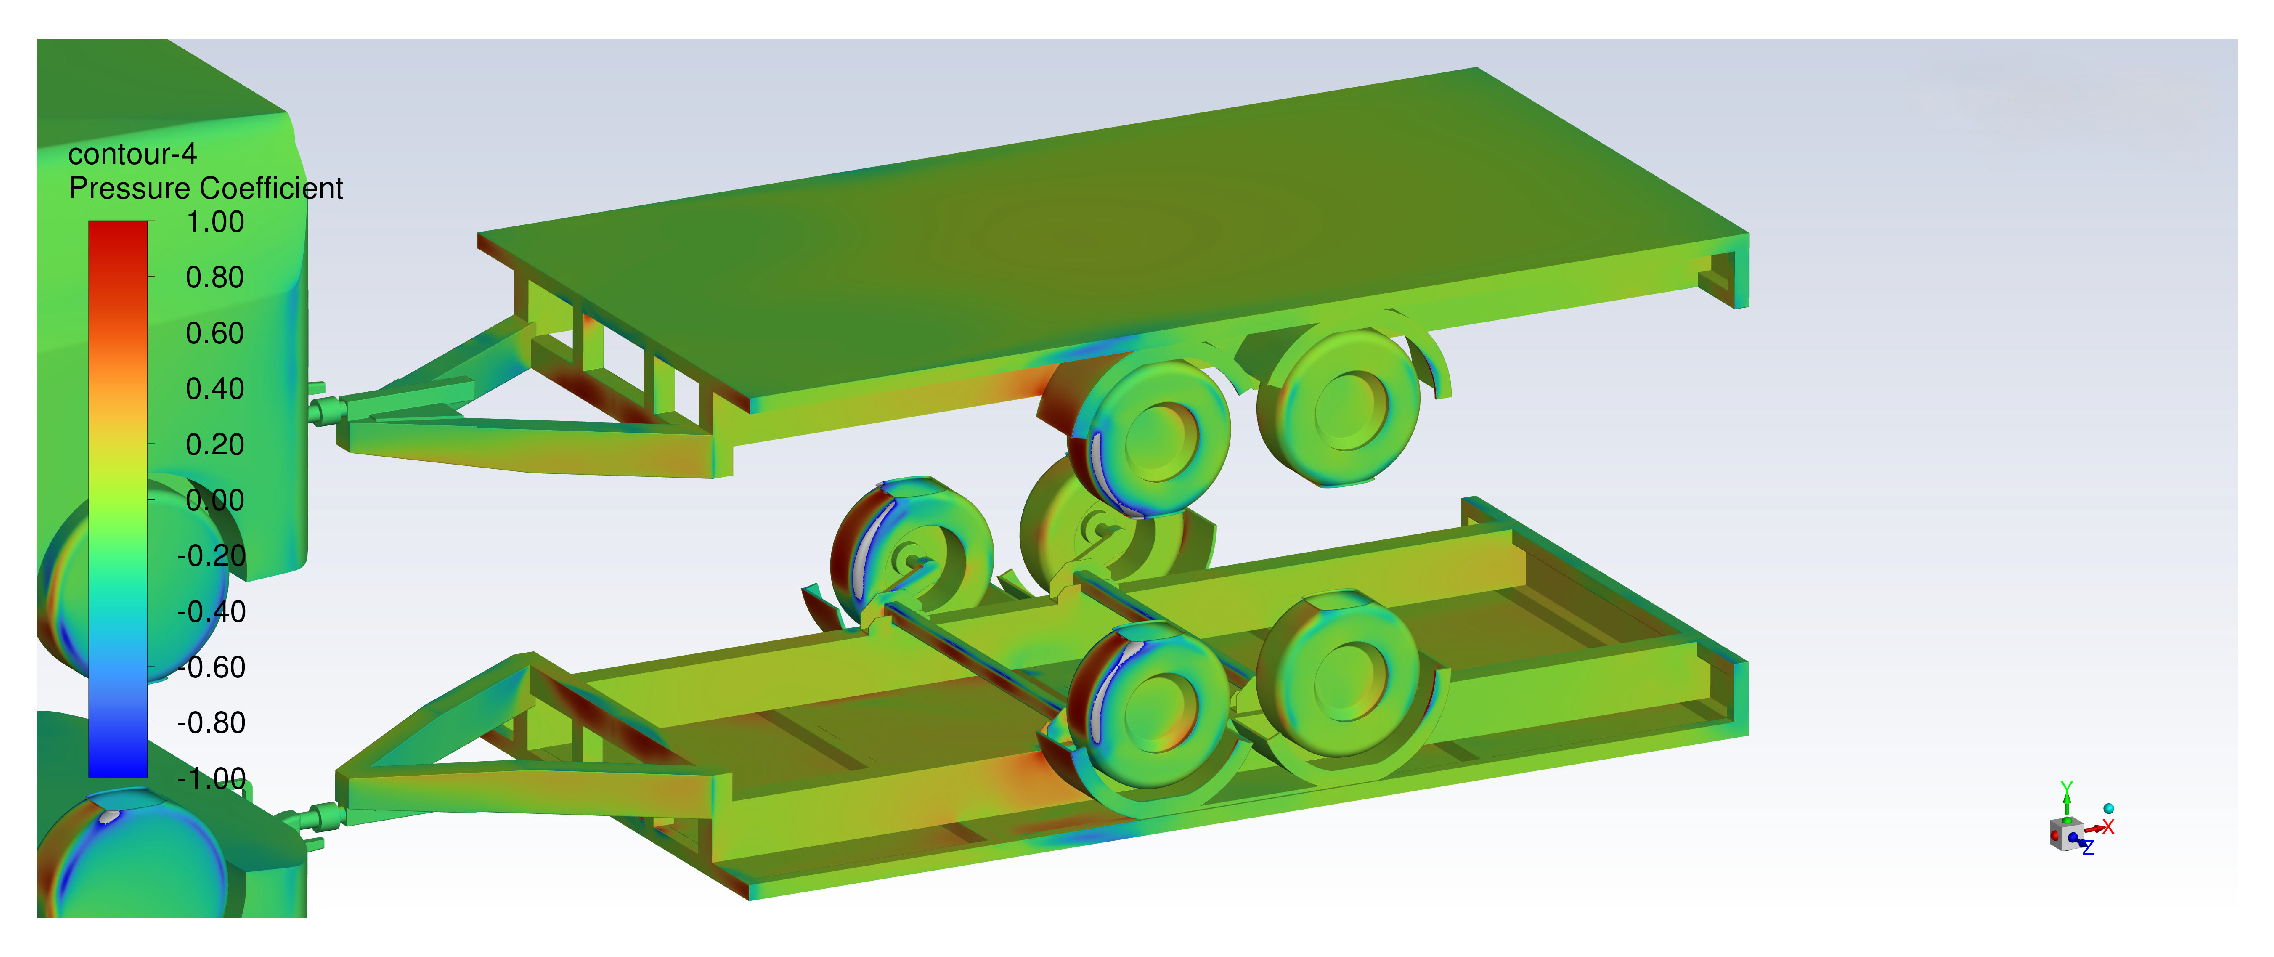
The drag force generated at the trailer’s wheels and at the trailer front was primarily due to flow stagnation; Figure 5 highlights the high surface pressures brought about by the stagnation and makes clear the need for flow-deflection devices ahead of trailer wheels to ensure flow stagnation is minimised. Similarly, the trailer’s drawbar should have a sufficient aerodynamic design that endeavours to mitigate stagnation, while sufficiently directing the flow into a region in which the drag on components further downstream will also be minimised. Figure 6 shows how, under the current drawbar design, a large portion of the flow makes its way up through the drawbar. This is not necessarily a bad design, as it allows for some flow to avoid stagnating on the trailer’s underside.
Another point of interest observable from Figure 4 is the size and shape of the hole the van punches through the air and leaves above the trailer bed. This is of huge importance when it comes to loading the flatbed trailer. For stability, it may be the case that the load should be placed directly above the axles; however, for drag reduction, the load should be placed as far forward on the trailer bed to ensure it falls within the punched hole as much as possible. This can also benefit overall drag reduction as any flow stagnation on the load’s face may interfere with the rear wake of the van and cause a positive drag-reducing interference effect.
To further analyse how the flow transverses the flatbed trailer, Figure 7 is given to highlight the lack of flow attachment existing along the trailer’s surfaces, accompanied by regions with slow-moving, stagnant, or reversed flow. Regions highlighted in blue describe the detached or slow-moving flow. At the front of the trailer bed, a very large, low-pressure zone exists in which considerable amounts of reversed flow occur; Figure 6 can also be used to identify this. Further downstream, the flow begins to wrap inwards and initiates a region of faster-moving attached flow on top of the trailer bed. Similarly, underneath the trailer, the flow suffers from large amounts of separation and stagnation. This highlights the need for a smooth undertray that will help guide the flow, while ensuring it maintains momentum to prevent detachment or flow reversal, which additionally increases trailer downforce.
The remaining flow features worthy of discussion on FBT1 are the vortex structures produced by the trailer. Figure 8 uses an isosurface of the Q-criterion to highlight the largest vortices present on FBT1. Most notable is the large area of wrapping flow coming up through the drawbar in which the flow moves from either side up towards the centre of the drawbar and out over the bed. This makes a case for a new drawbar design that helps prevent the generation of these turbulent structures by fitting a smooth undertray to the drawbar’s underside. The remaining structures are very typical of the geometry with highly turbulent vortices being produced by the mirrors, the A-pillars, and the wheels. Once again, the need for appendable devices around the trailer wheels is necessary to reduce drag and to also reduce the intensity and prevalence of these turbulent structures.
4.2. Initial Geometry Modifications
The initial aero-development of FBT1 consisted of three geometry modifications detailed in Figure 9. To understand the effect the trailer’s mudguards had on its drag coefficient, they were removed to see if any reduction could be realised. Mudguards are a legal requirement for trailers with exposed wheels as they play a key role in protecting other road users from foreign soiling originating from the trailer’s wheels. The mudguards also play a key role in protecting the trailer from self-soiling. Table 5 shows that the removal of the mudguards did not reduce the drag coefficient significantly, reporting only a two count drag reduction. This was because, when the mudguards were removed, the drag on the trailer’s front wheels and rear face increased by approximately 2% each, which offset the lost 4% contribution previously observed for the mudguards on FBT1. Therefore, there was no major drag benefit from the removal of mudguards.
The aero drawbar design was another modification that offered no significant drag reduction. This was because the smooth underside of the new drawbar enabled large amounts of flow to move quickly under the drawbar, curl up, and then, stagnate on the underside of the trailer. This increased drag on the underside, while also decreasing downforce due the increased high pressure underneath the trailer bed. This drag increase was then offset by the drag reduction experienced on the trailer face due to the newly shaped upper drawbar surface. This underscores a crucial point that, when utilising a sleek drawbar undertray, it is essential to have a smooth trailer underbody as well to prevent enhanced underside stagnation. It was, therefore, previously advantageous that a large amount of the flow moved up through the drawbar and out over the bed, avoiding the underside, as seen in FBT1.
The best-performing initial modification was underside covered, in which a 6.9% drag reduction was observed, accompanied by a 47.4% increase in downforce. Here, the deficiencies of the aero drawbar were amended, and the fast-moving underside flow was prevented from stagnating on the underside beams. Unlike for passenger vehicles, fitting a smooth undertray to a trailer is often very feasible, and as the device can offer a near 7% drag reduction when the trailer is both loaded and unloaded, it would be wise for EU regulators to consider making such a device mandatory in the construction of all new flatbed trailers.
4.3. Front Face Changes and Added Panelling
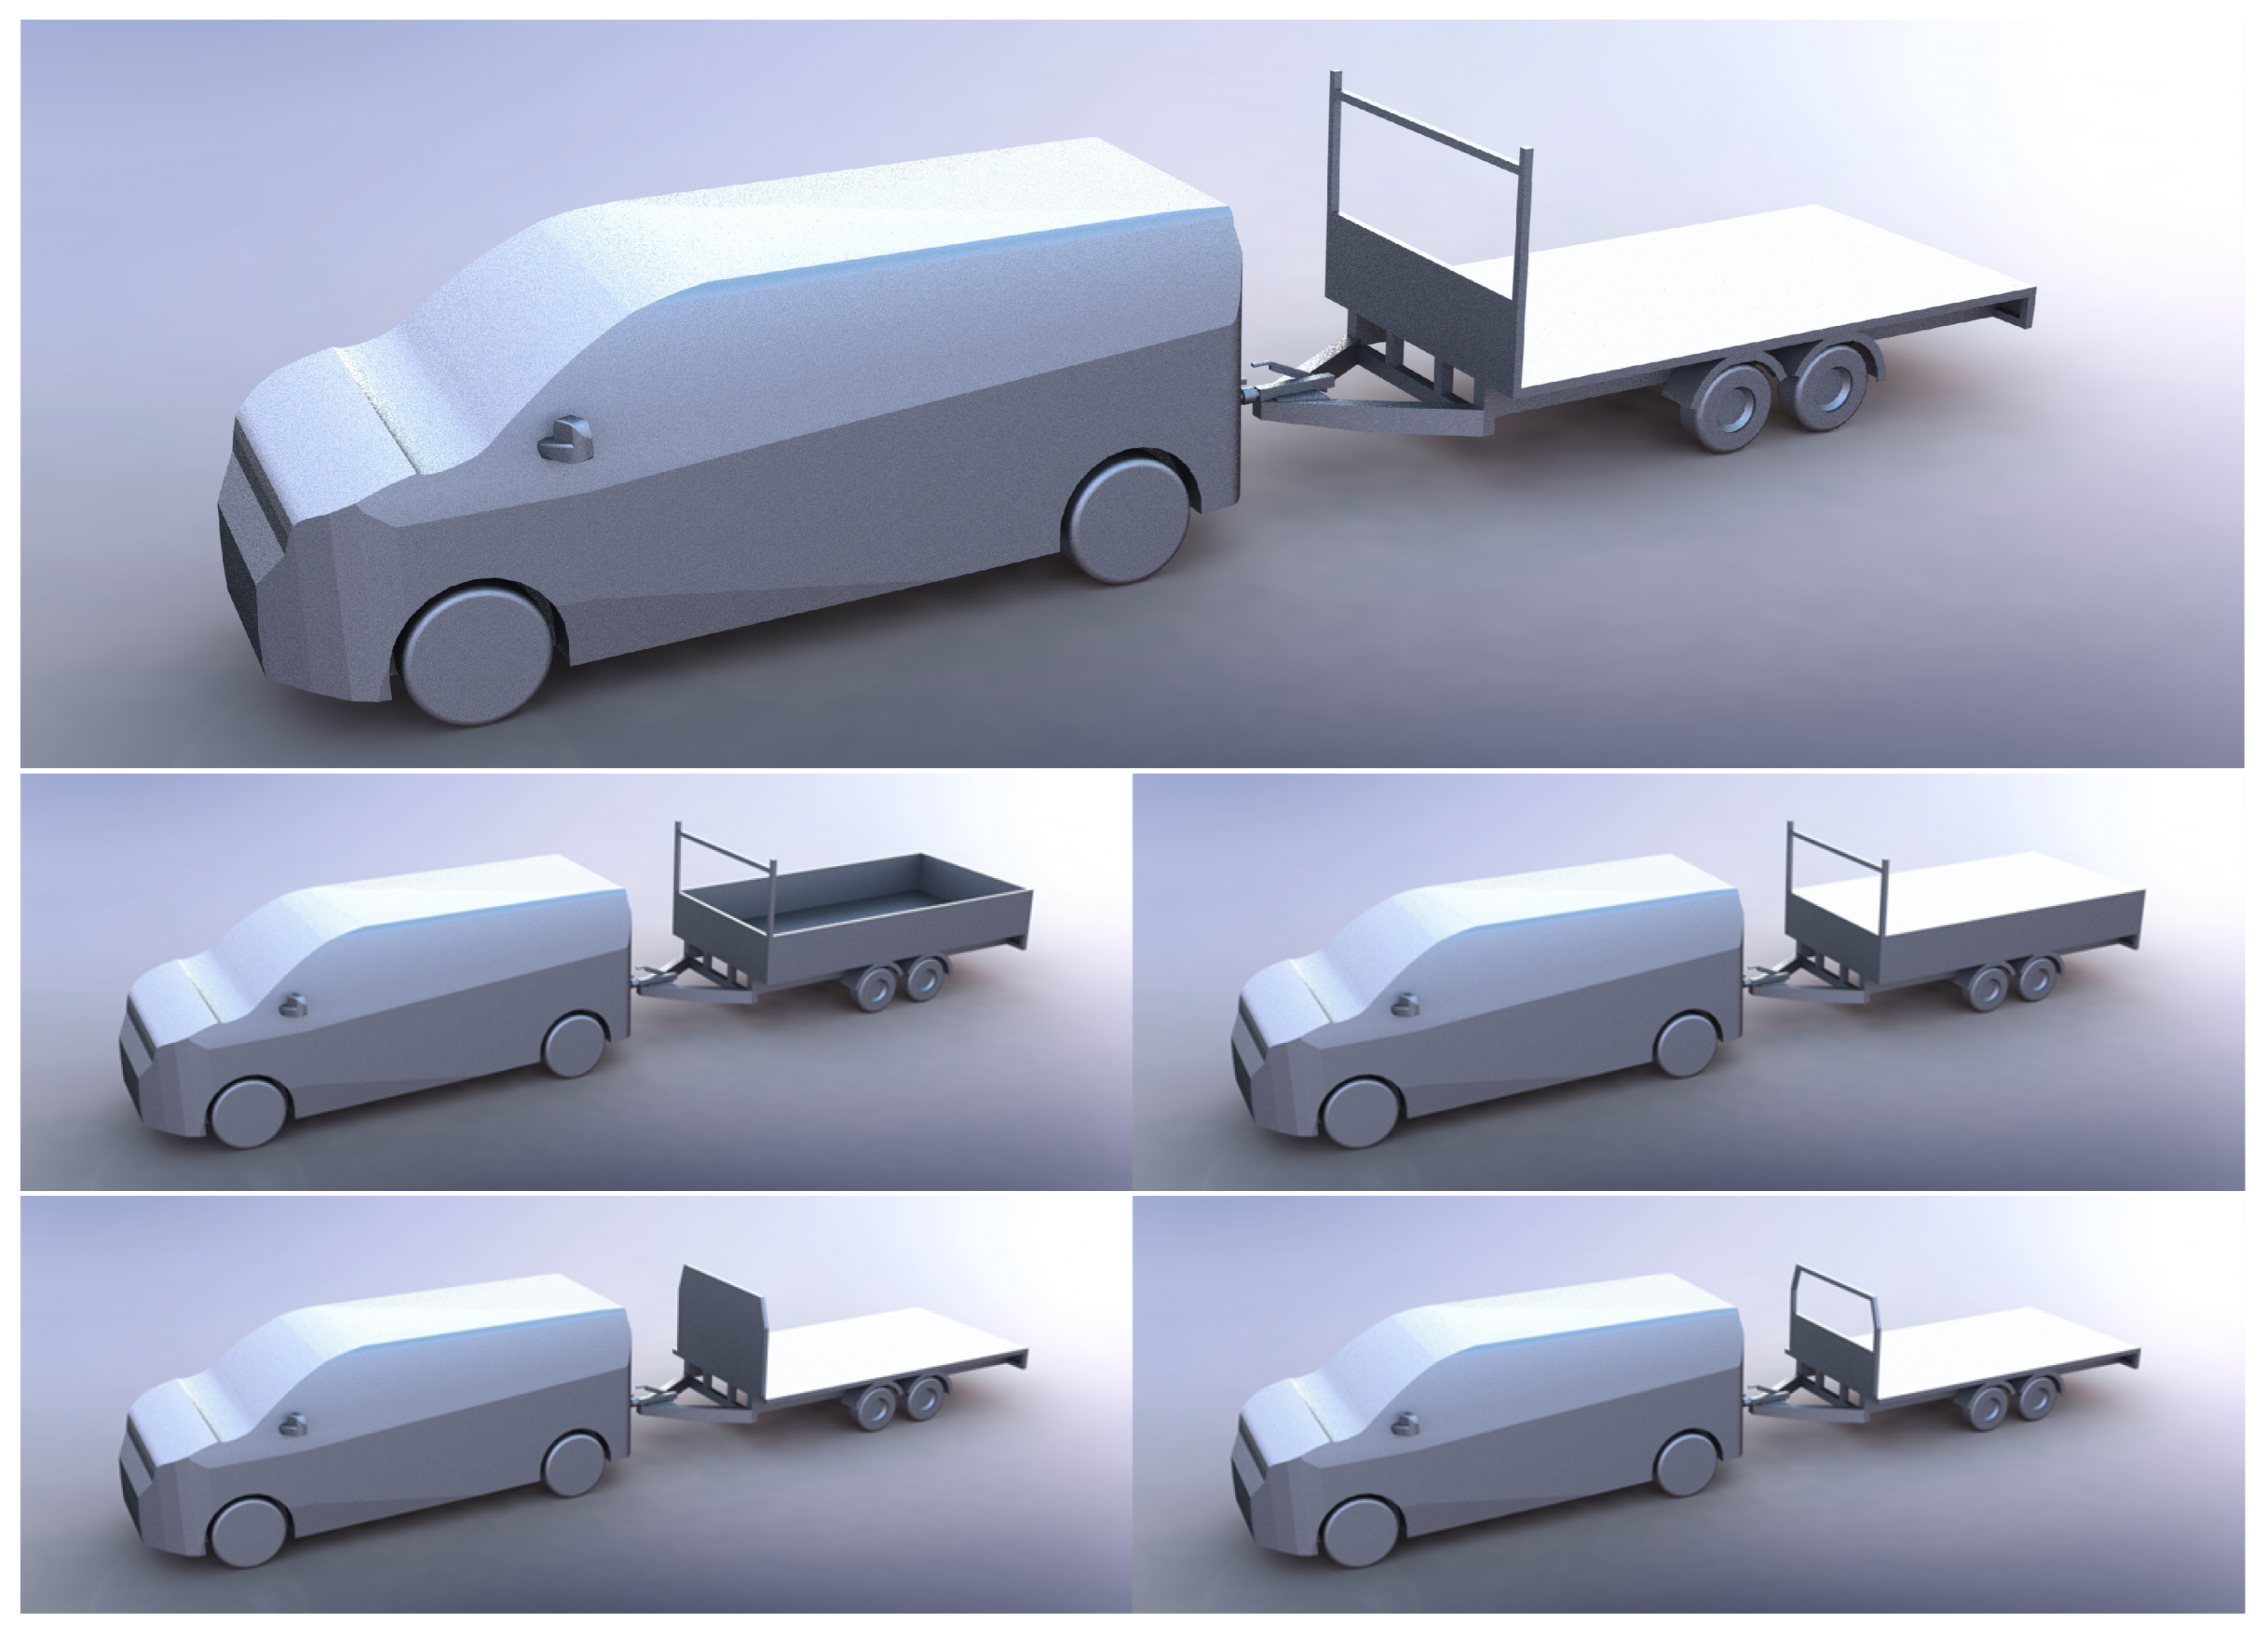
It is common for flatbed trailer manufacturers to offer configuration options for their trailers such as ladder racks, rear gates, and droppable sides. For users in the construction sector, the Ladder Rack Face (LRF) with a Dropside and Rear Gate (D&RG) trailer configuration is a common choice. To better understand the aerodynamic attributes of these modifications, five new simulations were carried out with their results and geometries detailed in Figure 10 and Table 6. Note that the area of the LRF, LRF with D&RG, and LRF with D&RG with cover all had a slightly increased frontal area of 2.88% with regard to the baseline FBT1 simulation. This was due to the protruding side posts of the ladder rack.
A substantial 27% drag increase was observed for the LRF as the fast-moving flow leaving the van’s latter surfaces collided heavily with the outer frame of the ladder rack. Interestingly, the biggest contributor to the additional drag was the top section of the ladder rack, even though it had a relatively small area in comparison to the larger lower panel. With the addition of the dropsides and the rear gate, the drag coefficient was seen to increase by another six counts. One would have expected a much larger increase when considering the increased rear area added by the rear gate along with the potential for further stagnation on the rear gate’s front face. When the drag distributions per component were evaluated for each of the five simulations, it was found that only three components had observable drag changes, and these were, namely, the trailer rear, the trailer front, and the van rear. All other components had approximately the same drag value across all five configurations. Figure 11 details a bar chart outlining the observed drag changes for the three components.
Using Figure 11, the net six count drag increase between the LRF and LRF with D&RG can be easily explained. As expected with the addition of the rear gate, a huge drag increase was observed for the trailer rear, totalling 73 counts. However, in the presence of the dropsides, the drag force on the trailer’s front face reduced as they prevented the flow from wrapping behind the ladder rack and mitigated the wake effects behind it. Hence, a 32 count drag reduction was observed. Finally, the addition of the drop sides also affected the shape of the stagnation zone ahead of the trailer face, which positively interfered with the van rear, offering a 26 count reduction due to the positive interference drag. When these effects were combined, the drag increase incurred due to the rear gate was substantially offset. This highlights the importance of using dropsides when rear gates or ladder racks are fitted. Another interesting configuration not studied would have been the LRF with just the drop sides and the rear gate removed. Based on the current results, the end-user could expect a 73 count drag reduction if he/she removed his/her rear gate and stored it inside the van or trailer when not needed. This simple geometry modification amounts to a 12% drag reduction, which, in the context of extending an EV’s towing range, is crucial. In terms of downforce, the LRF experienced a reduction due to the low-pressure wake existing behind the ladder rack face, resulting in an uplifting force on the trailer bed. The LRF with D&RG saw improved downforce compared to the LRF configuration as the slight stagnation on the rear gate generated a downward force combined with the dropsides, helping the flow avoid the top of the trailer bed, which ensured no fast low-pressure flow could move over it. The LRF with D&RG with cover is a design in which a mountable cover that can roll up for storage is fit atop the dropsides and rear gate. The cover design offered a 20 count drag reduction when compared to the LRF with D&RG as the drag force on the trailer rear was significantly mitigated. The cover design also experienced a downforce reduction due to the suction force from the flow that moved above it. This means that any practical implementation of the cover should ensure appropriate mounting to prevent it from lifting off when travelling at high speeds.
The alt front face configuration only incurred a 2.58% drag increase on the baseline FBT1; this interesting result highlighted the importance of having any vertical bed features confined within the wake of the van. The alt front face was completely shadowed by the van, and its solid face ensured that any stagnation or flow buildup on the face interfered with the van’s wake, producing a positive drag reduction. Figure 11 shows clearly how the drag on the trailer’s front face was 48 counts less than the LRF, and the drag on the van’s rear was 35 counts less. However, the most-interesting finding is reserved for how the alt face hollow configuration had a 36 count (7.72%) drag increase when compared to the solid alt front face. The expected result would be that the hollow section in the face would have reduced flow stagnation and, hence, reduced overall drag. Through the observation of Figure 11, this was indeed the case as the trailer front experienced a 29 count drag decrease on the alt front face; however, the overall drag increase was down, due to the reduced interference drag between the van and trailer in the gap, due to the presence of the hollow. This highlights the importance of enabling interference effects within the gap to attain favourable drag reduction. Other areas in which the solid config of the alt front face outperformed the hollow were on parts such as the drawbar, the van’s back wheels, the trailer’s front wheels, and the mudguards. The drawbar and the van’s back wheel both benefited from the interference drag, while the mudguards and trailer wheels experienced reduced drag due to the increased stagnation on the solid face bending or diverting the flow around the trailer more, hence helping some of the flow avoid their faces. Figure 12 shows how the flow took a very different path under the trailer for the solid face config versus that of the hollow config, in which the flow was less deflected. The increased deflection benefited the drag reduction on the aforementioned parts.
4.4. Novel Mid-Section Devices
Based on the previously detailed drag-reduction potential for flow interference within the gap between the van and trailer, three novel mid-section devices were proposed to try and utilise the drag savings for FBT1. NMD1 was the first in which a foldable device was attached to the drawbar, which incorporated a unique rear baffle surface to mitigate against wake drag. Figure 13 demonstrates NMD1’s design, and Table 7 outlines the six count drag reduction offered by the device. NMD2 and NMD3 utilise a different approach to reducing drag in the mid-section by trying to redirect flow leaving the top surface of the van into the van’s wake. When reviewing the drag reductions shown in Table 7, note that the frontal area for NMD2 increased by 0.18% and by 1.73% for NMD3. Both of these devices offer appreciable reductions with considerable room for further improvement following future aerodynamic development. NMD2 could be considered the more-practical device as its design does not restrict the opening or closing of the van doors, whereas NMD3 requires the plates to be mounted on a hinge mechanism that allows the plates to move out of the opening path of the doors. NMD2 could also facilitate height adjustments to its vertical stands that enable its usage on any towing vehicle; this is to ensure the leading edge of the device is always set to the same height above the trailing edge of the tow vehicle’s roof. NMD3 has the advantage of being a universal ground vehicle device and could be fit to any van or truck without the need for a trailer. Figure 14 outlines how NMD2 redirected the flow into the van’s wake, which increased the base pressure on the van’s rear.
4.5. Number of Axles Test
An important consideration a trailer manufacturer may have when designing a new trailer is how many axles should the trailer have. Generally, little concern is directed towards the drag changes that may be incurred by adding more or fewer wheels to the trailer. The main considerations generally include load and stress distribution requirements along with handling and braking ability. This study took the dual-axle FBT1 trailer and reconfigured it as a single- and triple-axle equivalent while maintaining all other parameters such as bed area and trailer structure (see Figure 15). Reviewing the results of Table 8, it is interesting to observe that there was no drag increase incurred when upgrading a trailer from dual-axle to triple-axle. This was due to the drafting effect experienced by any additional wheels, in that they fell into the wake of the wheels ahead, experiencing reduced frontal stagnation. It is also interesting to note that the highest drag force was experienced by the single-axle variant in which the flow had much time to curl inwards and stagnate on the front of the single wheels, incurring increased drag in comparison to the others in which their leading wheel was positioned further upstream. As all three variants had approximately the same value, it can be concluded that there were no major drag benefits or penalties incurred when increasing or decreasing the number of axles, given the user is driving in direct flow and the wheels have fully covered hub caps with torsion suspensions units. This would not be the case for uncovered wheels, as added ventilation drag would play a key role in increasing drag. For reference, a similar study previously conducted by the authors on box trailers arrived at a similar conclusion, meaning this result is applicable to the majority of trailers towed by passenger vehicles.
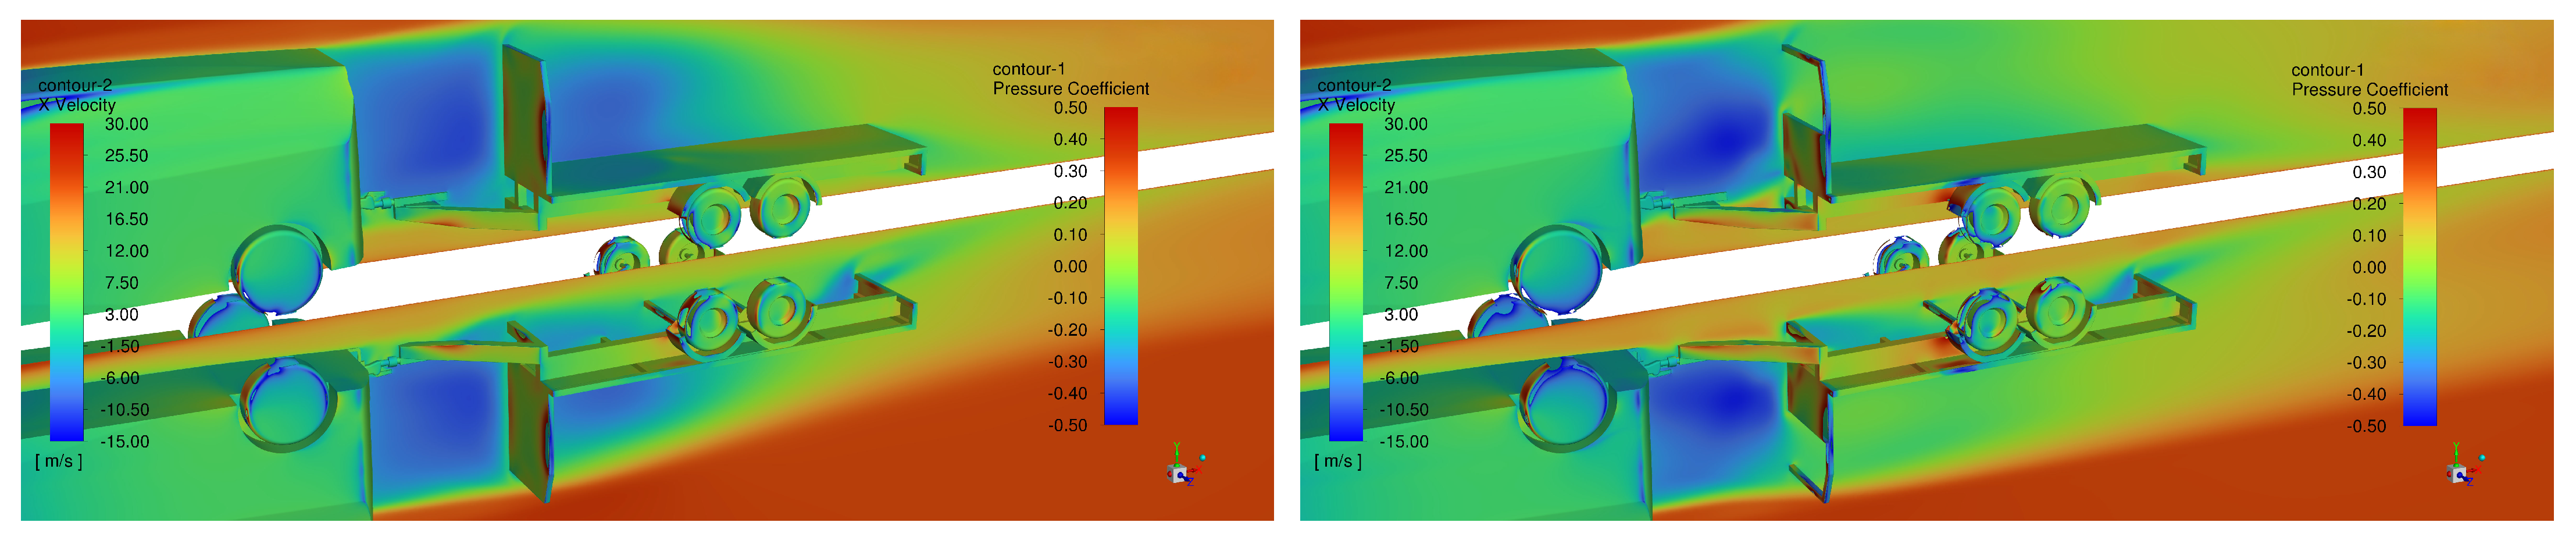
4.5.1. Crosswind Study
As the results outlined in direct flow were quite surprising, it was necessary to conduct a crosswind study to see if the same trends existed. The study conducted used a worst-case scenario of a 5 m/s crosswind coming perpendicular to the travel direction. This resulted in a flow yaw angle of = 12.8°. The reference area used for all coefficients was the same as that used for the original FBT1 simulation, while the reference length used for the moment coefficients in Table 9 was L = 1 m. The reference velocity of 22 m/s was maintained for all coefficients. As expected, when subjected to a crosswind, the drag force increased with the number of axles fit to the trailer. Once again, there was a relatively large jump between the for the single- and dual-axle configurations. Another interesting trend is that, as the number of axles increased, the downforce decreased. FBT1 when subjected to this sidewind reported a 0.565 drag coefficient, which represented a 21.24% drag increase. This highlights that flatbed trailers when subjected to crosswinds can experience enhanced drag forces. Figure 16 outlines the flow field on a plane through the wheel centres for each configuration in direct flow and in crosswind. Note how the wake regions of the trailer’s components were particularly affected in the presence of the crosswind.
4.6. Additional Geometry Modifications
This section investigated the impact of additional geometry modifications on flatbed trailers and assessed their aerodynamic influence. The changes examined included altering the bed texture, adding a full side skirt, incorporating a generic load, and installing a mesh cage on the flatbed. The goal was to quantitatively measure the effect of these modifications on drag. The full side skirt system (shown in Figure 17) did not realise the amount of drag reduction that was expected given the device’s wide adoption on tractor-trailers. Table 10 outlines just a 0.43% drag reduction for the side skirt device. This was because the side skirt blocked the escape of any flow that moved up from the ground and stagnated on the front of the wheels. While it did a good job of preventing stagnation due to flow coming from the side, this was negated due to the negative effects of increased stagnation due to underside flow. A better design would be to have a partial side skirt, in which breaks occur near the wheels to ensure the flow can escape the wheel wells. Note also how the downforce on the trailer dramatically increased when the full side skirt system was employed. This was to be expected as such systems are used commonly in racing to improve downforce. The alternative bed texture configuration consisted of numerous 8 mm-high mounds with 40 mm diameters. This configuration was proposed to see if the bed texture can affect drag notably. As shown in the results table, this was not the case, and it can be concluded that bed texture has an insignificant effect on for flatbed trailers. This conclusion is also supported by Figure 7, in which the majority of the trailer’s bed was subjected to slow-moving or detached flow.
FBT1-loaded was proposed to identify how the drag coefficient for the vehicle combination would be affected when loaded with a generic body. The load was placed in the centre of the trailer and was shadowed by the van on its sides only, being allowed to protrude considerably above the van. As a result, the frontal area for the configuration increased by 17.48%. A respectable 11.59% increase was observed; however, when combined with the frontal area increases, the drag force was seen to rise considerably. As outlined previously, when the load was shadowed fully or partially by the van, the increase could be mitigated. The downforce generated by FBT1-loaded was significantly less than that for FBT1, and this was due to the fast-moving flow travelling over the load and pulling the load up vertically from the trailer, highlighting the importance of securing lightweight loads appropriately against vertical displacement. Overall, the most-interesting result was FBT1-mesh sides, in which a huge drag coefficient increase of 40.77% was observed. Note also that there was a frontal area increase for FBT1-mesh sides of 2.62%. This outlines a very important conclusion, that employing meshed faces, sides, or gates on a trailer can considerably increase drag. Table 11 shows that 32% of the total drag force on the entire vehicle combination came from just the mesh sides. This amounted to a contribution of 210 drag counts. For EV users concerned about reduced range when towing, this is a highly significant result. Removing the mesh sides when unneeded (storing them flat on the trailer bed) will bring about substantial fuel savings.
4.7. Drawbar Length Test
One of the most-critical dimensions of any flatbed trailer is its drawbar length, with it having a significant impact and the trailer’s handling and turning circle. Shorter drawbars enable the trailer to react quickly when the towing vehicle begins to change direction, while longer drawbars have delayed reactions. For trailers in use on country roads where tighter turns may be necessary, shorter drawbars are generally preferred. The minimum drawbar length should be at least half the width of the towing vehicle plus some added clearance (100–200 mm), depending on the trailer’s front features. Longer drawbars are less sensitive to movements by the tow vehicle and are usually fit to long trailers or those intended for high-speed journeys. While most people are aware that having a longer drawbar will increase drag, they do not have a quantification for the estimated penalty per mm change in drawbar length. The original FBT1 had a drawbar length of 1350 mm. Five additional drawbar lengths were studied (Figure 18) to observe the drag variation on the vehicle combination. Table 12 and Figure 19 below outline the results. As the original drawbar on FBT1 was an A-frame construction, it was important to maintain this type of drawbar throughout the length tests; hence, for the small drawbars, an A-frame of a smaller size was used, while the longer drawbars had their tongue extended linearly.
A clear drag-increasing trend was seen for the longer drawbars, with the exception of the mid-range length drawbars, in which the drag began to plateau. A similar plateauing effect occurred for box trailers in a study previously conducted by the authors. The explanation for this effect is that, when away from the extremities of the drawbar, such as being very close to the van, or very far away, a region exists in which the flow field behind the van is quite constant. This region exists after the intense part of the wake near the van’s rear and before the region in which the flow has sufficiently wrapped around the van from both the sides and underside. The overall trend is considerably linear, with a 250 mm change in drawbar length accounting for a 7–8 count change in . This approximately equates to a 1.7% drag change per 250 mm. Note that this metric is only applicable to flatbed trailers similar to FBT1. When working with box trailers, a different metric exists, in which the change per millimetre is much higher due to the significant interference effects occurring between the van and box trailer. The explanation for the drag reduction for shorter drawbars is due to the trailer experiencing an enhanced drafting effect from the van, while the drag-increasing trend for longer drawbars is a result of increased stagnation on both the drawbar and the trailer face due to its added exposure. It is worth noting that the downforce of the combination followed a similar trend, in which shorter drawbars experienced reduced downforce. This is due to the stagnation on the trailer’s front face and drawbar generating a high-pressure zone, which is then placed underneath the van’s rear as the drawbar shortens, providing an added uplifting force to the van’s underside. In conclusion, the relationship between drag and drawbar length is linear, with drag varying noticeably, but not drastically, due to the low profile of the flatbed trailer.
4.8. Novel Aero Concept with Trailer-Fitted Devices
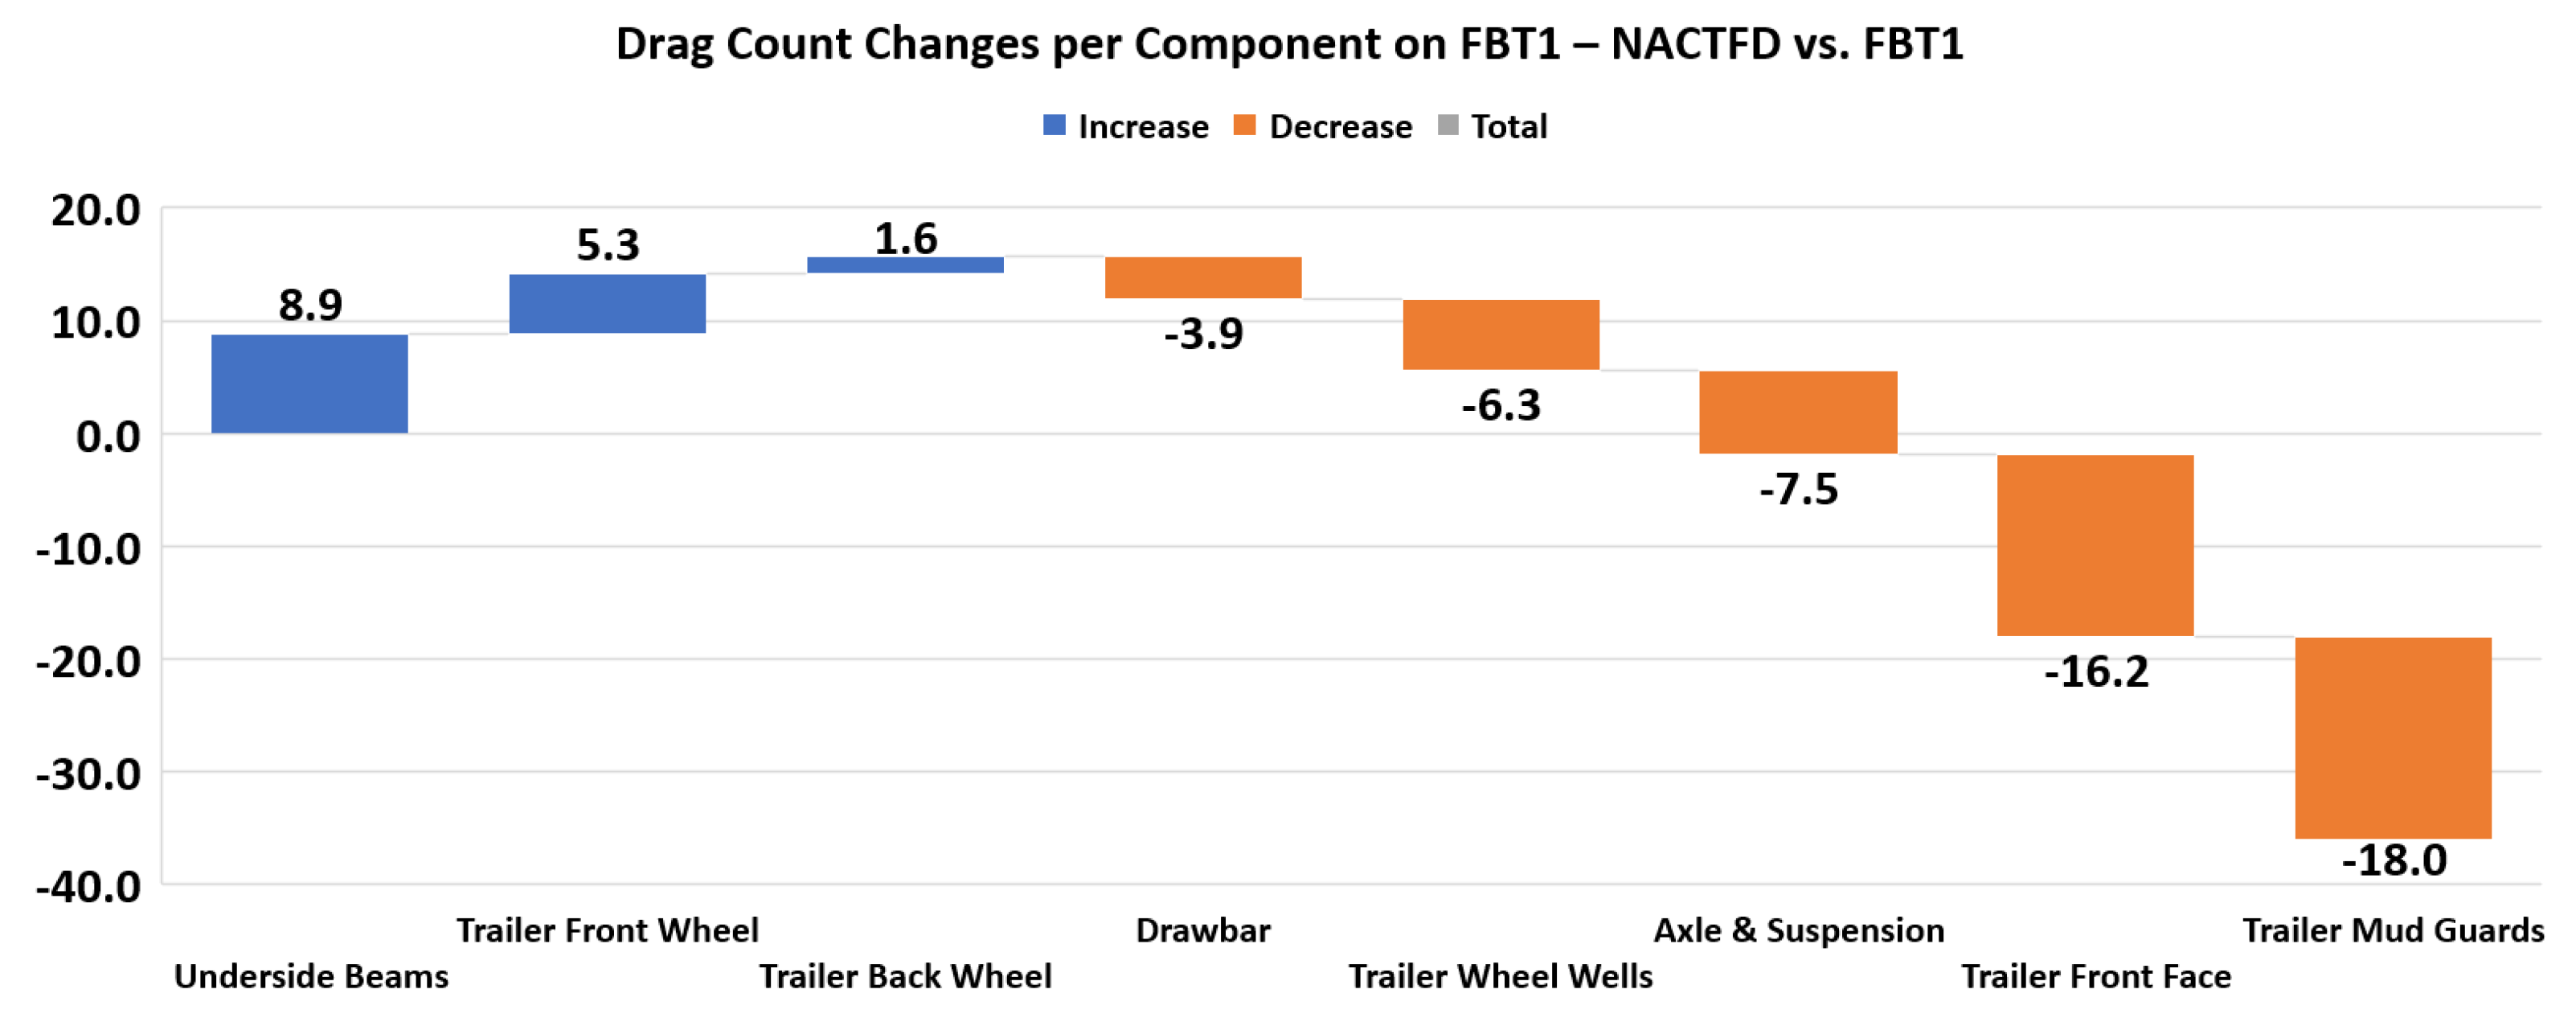
The novel aero concept with trailer-fitted devices consisted of six unique appendable devices combined with an additional aftermarket geometry modification. The six devices are outlined in the bottom image of Figure 20, while the geometry modification, which consisted of cutting out rectangular slots in the trailer’s rear face, can be seen in the top image. The devices were designed following extensive post-processing of FBT1 with in-depth analysis of high-drag zones suitable for appendable devices. The underside drawbar cover was used to prevent the flow from travelling up through the drawbar and stagnating on the trailer face, while the axle wind deflectors were fit downstream to reduce stagnation effects on the axles in the presence of the additional flow being redirected underneath by the drawbar cover. The axle wind deflectors offered an appreciable 7.5 drag count reduction (Figure 21). This drag savings was achievable under all trailer loading conditions, which outlines the effectiveness of such a simple device and the need to have it implemented on all trailers that have exposed axle packages.
The underside front deflectors combined with the rear wheel boat tails were fit to help guide the flow around the trailer’s wheels and ensure drag on the front and aft surfaces was minimised. Together, they offered a 24.3 drag count reduction, which was a combination of the drag savings on the trailer’s wheel wells and mudguards. This, however, was slightly offset by a drag increase on the front and back wheels totalling 6.9 drag counts. This increase was due to the added flow leaving the underside of the front deflector and impacting directly the bottom of the wheels, with more concentration than in the original FBT1. The underside beams also saw an 8.9 drag count increase due to similar reasons discussed previously, in which the drawbar underside cover provided added flow to the trailer’s underside, which caused increased flow stagnation on the underside’s components. The drawbar underside cover combined with the trailer face deflectors performed well at reducing front face stagnation and realised a 16.2 drag count reduction on the trailer’s front face. The trailer face deflectors were positioned and sized to cope with a high stagnation zone that occurred due to the flow wrapping around the van and hitting the sides of the trailer’s front face. Interestingly, there was no net drag change on the rear section of the trailer due to the new rear boat tail’s drag reduction offsetting the drag increase incurred by the added underside flow. A device not used that would have added notable drag reduction in conjunction with the other devices is a full undertray (discussed in Section 4.2). Overall, the combined savings produced a 34 count reduction, amounting to a 7.3% drag savings (Table 13).
4.9. Novel Aero Concept with Van-Fitted Device
As the van’s rear accounted for a significant proportion (25%) of the total drag on the van and trailer, it was necessary to fit a novel drag-reducing device to the rear to see how much drag it could negate. The Multi-Stage Converging Cavity (MSCC), shown in Figure 22, is an appendable device fixed to the doors of the van that can retract inwards along a rail system, enabling the user to open the doors when retracted. The device shown is made in halves, and when the doors open, each half moves off with the door it is attached to. The mounting mechanism along with the retracting design is not detailed here for IP reasons. The device’s working principle is to increase the base pressure on the van’s rear. It does this in two ways: firstly, it uses its length to tap into a high-pressure zone that always occurs downstream of the van, and secondly, it uses multiple converging stages to help the flow converge to a point behind the van, which also helps spread the higher pressure evenly over the entire rear surface of the van. The top image of Figure 23 highlights the first drag-reducing mechanism. The isosurface of Cp = 0.005 outlines the fringes of the high-pressure bubble that exists downstream of the rear surface. The existence of these higher-pressure zones is analogous to the flow around a cylinder, in which, downstream of the cylinder, behind the wake, a relatively high-pressure zone exists as the flow converts its kinetic energy back into pressure energy. The longest, and last, converging cavity on the MCSS punches a hole into this zone and carries the higher pressure back onto the base of the van. The highest pressure can be seen on the outer edges of the last cavity in which red surfaces are located nearest the isosurface. The converging nature of the device then allows this pressure to spread out evenly over the van’s rear and within the device. The second drag-reducing principle is shown in the bottom image, in which the converging shape did a good job of helping the flow converge to a point behind the van. Note the substantial difference between flow convergence after the van between Figure 6 and Figure 23.
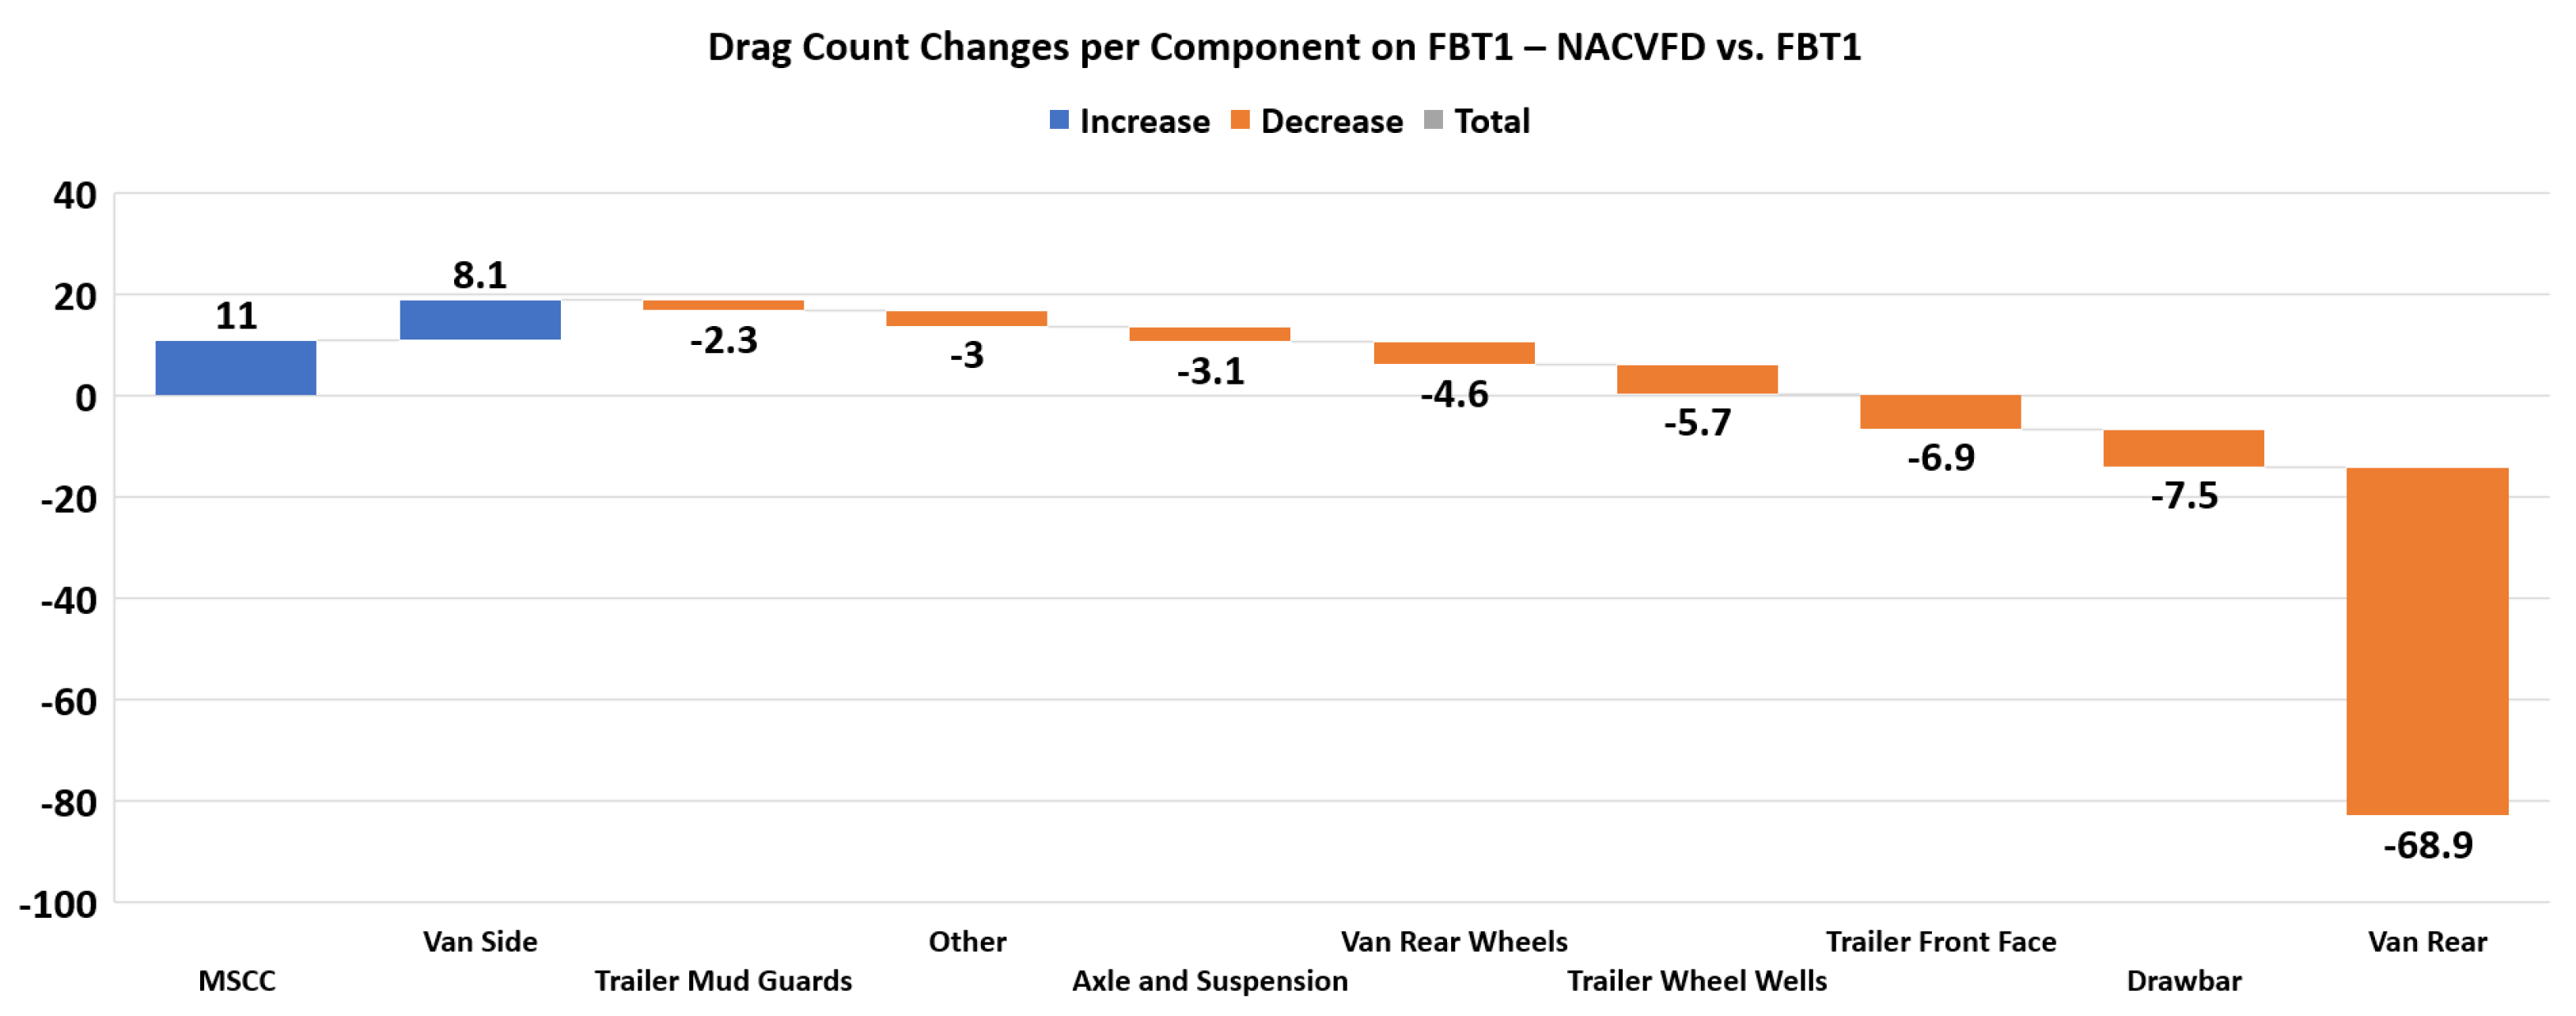
The drag-reducing ability of the device is evident from Figure 24 and Table 14, in which a near-70 count drag reduction was observed for the rear of the van. The device also enabled other components like the trailer’s drawbar and face to experience drag reductions on account of the improved flow regime around the MCSS, reducing flow stagnation on these parts. The MSCC itself reported an 11 count drag force, which could be reduced through further design optimisation, such as varying the lengths and angles of the multiple cavities. The van’s side experienced a drag increase due to the flow wrapping around the van’s side and connecting with the MCSS. Overall, the device reduced drag by a substantial 17.81%, which highlights the benefit of appending such a device, even if it adds some configuration overhead to the driver when accessing the rear. The MCSS is a universal drag-reducing appendable device, meaning it can be fit to most ground vehicles. Further research is being conducted into its application on trucks, buses, standalone vans, and other commonly used ground vehicles. FBT1-NACVFD also reported a decrease in downforce of around half that reported for the original FBT1. This was due to the fast-moving low-pressure flow existing over the top of the MCSS device, meaning the device must be well-fit to the van to ensure it is not displaced vertically due to the lifting force exerted on it by the flow. Note that over 90% of the total drag on FBT1-NACVFD was due to pressure drag and less than 10% was due to viscous drag.
Crosswind Study
Occasionally, devices that offer drag reduction in direct flow can increase drag when subjected to yawed flow generated by crosswinds or when turning. To see if this was the case for the MCSS device on FBT1-NACVFD, a crosswind study was conducted using the same conditions as those discussed in Section 4.5.1, that is a side wind of 5 m/s coming perpendicular to the travel direction, resulting in a yaw angle of = 12.8°. The results for the test are shown in Table 15 along with some 3D flow visualisation for FBT1-NACVFD in both direct and yawed flow in Figure 25.
As is evident from Table 15, FBT1-NACVFD heavily outperformed the standard FBT1 in a crosswind, in terms of both drag reduction and driving stability. It reduced FBT1’s value of 0.565 (shown in Table 9) to just 0.458, offering an impressive 18.94% drag reduction in a crosswind. This was more drag reduction than when subjected to direct flow, meaning the device will perform effectively when subjected to nearly all yawed flow experienced in year-round driving, as the yaw angle used in this study was based on a worst-case scenario. The device also reduced the side force coefficient by 10.78% and the yaw moment coefficient by 20.88%, greatly benefiting driving stability and handling.
4.10. Final Design
To conclude the Results Section, a final design that incorporated both the van and trailer fitted devices was created and is shown in Figure 26. The final design reported a drag coefficient of 0.352, which amounts to a near 25% drag reduction on the baseline FBT1 (Table 16). For reference, the standalone van had a drag coefficient of 0.331, which highlights that, when both the van and trailer utilised a wide range of appendable devices, the added drag due to the trailer can be heavily mitigated and brought close to full negation. It is worth noting that the respective drag reductions of both NACTFD (7.30%) and NACVFD (17.81%) added close to linearly on the final design to give the resulting 25% reduction.
5. Conclusions
In conclusion, a generic dual-axle flatbed trailer was studied to find ways to reduce drag using appendable devices. The initial work revealed that the majority of the drag originated from the back of the van, with notable contributions from the trailer’s wheels. Following some initial geometry modifications, a full trailer undertray was shown to offer a near 7% drag reduction. A study into the drag effects of ladder racks, dropsides, and rear gates was conducted in which large drag increases for ladder racks protruding from the van were observed, while ladder racks that shadowed the van performed better. It was demonstrated that a solid face rack could outperform a hollow rack due to the interference effects between the rack’s face and the van’s wake. Rear gates were found to add large amounts of drag and should be removed and stored when not needed. A study into some novel mid-section devices was conducted in which the best-performing devices diverted flow from the van’s roof into the wake, increasing the van’s base pressure, hence reducing drag. An axle test was performed to compare for single-, dual-, and triple-axle trailers. Interestingly, the for all versions was found near identical in direct flow, but differed in yawed flow. In direct flow, the single-axle variant had the highest .
Additional geometry modifications included a full-size skirt system, which did not reduce drag noticeably, as it prevented the flow exiting from the wheel wells. A better design would include a partial side skirt system, in which breaks at the wheels are inserted to allow the flow to vent out. An alternate bed texture was used to see if it would affect the drag coefficient of the trailer, but no noticeable reduction was observed. The most-interesting modification was the use of mesh sides and mesh gates on the trailer, in which the drag increased by a substantial 41%, highlighting that, if possible, mesh sides should be detached and stored away when not needed. A drawbar length test was conducted in which a near-linear relationship between the drawbar length and drag was observed. A change of approximately 1.7% per 250 mm change in length was noted.
Six unique appendable devices were fit to the flatbed trailer, which together offered a 7.3% drag reduction. The most-effective devices were those attached to the axle and those placed in front and behind the trailer’s wheels. To reduce the drag on the rear of the van, a new novel device known as the Multi-Stage Converging Cavity (MCSS) was introduced to reduce drag by nearly 18%. The device significantly increased the van’s base pressure and improved the flow regime around other devices in its vicinity. The MCSS was found to maintain its excellent drag reduction in a crosswind, while also enhancing driving stability. To finish, a final design using a combination of both the van and trailer devices was made that offered a 25% drag reduction, which nearly fully negated the drag additions associated with adding the flatbed trailer to the van.
Author Contributions
Conceptualisation, M.G.C.; methodology, M.G.C.; software, M.J.O. and M.G.C.; validation, M.G.C.; formal analysis, M.G.C.; investigation, M.G.C.; resources, M.J.O. and A.I.; data curation, M.G.C.; writing—original draft preparation, M.G.C.; writing—review and editing, M.G.C.; visualisation, M.G.C.; supervision, M.J.O. and A.I.; project administration, M.J.O. and A.I.; funding acquisition, M.G.C., M.J.O. and A.I. All authors have read and agreed to the published version of the manuscript.
Funding
This research was funded by The Irish Research Council Grant Number EPSPG/2022/213 and Science Foundation Ireland Grant Number 22/NCF/EI/11277. The APC was funded by Science Foundation Ireland Grant Number 22/NCF/EI/11277.
Data Availability Statement
The data presented in this study are available upon request from the corresponding author. The data are not publicly available due to the hosting costs for large datasets.
Acknowledgments
The support of UCD SONIC & ICHEC Kay for the use of their HPC resources.
Conflicts of Interest
The authors declare no conflict of interest. The funders had no role in the design of the study; in the collection, analysis, or interpretation of the data; nor in the writing of the manuscript.
Abbreviations
The following abbreviations are used in this manuscript:
| CFD | Computational Fluid Dynamics |
| RANS | Reynolds-Averaged Navier—Stokes |
| LES | Large Eddy Simulation |
| SST | Shear Stress Transport |
| HPC | High-Performance Computing |
| EV | Electric Vehicle |
| GHG | Greenhouse Gas |
| NEDC | New European Driving Cycle |
| FBT1 | Flatbed Trailer 1.0 |
| LRF | Ladder Rack Face |
| D&RG | Dropsides and Rear Gate |
| NMD | New Mid-Section Device |
| NACTFD | New Aero Concept Trailer-Fitted Devices |
| NACVFD | New Aero Concept Van-Fitted Devices |
| MCSS | Multi-Stage Converging Cavity |
References
- Ireland—Climate Action Plan. 2021. Available online: https://www.gov.ie/en/publication/6223e-climate-action-plan-2021/ (accessed on 20 October 2023).
- Wood, R.M.; Bauer, S.X.S. Simple and Low-Cost Aerodynamic Drag Reduction Devices for Tractor-Trailer Trucks. SAE Trans. 2003, 112, 143–160. [Google Scholar] [CrossRef]
- Ekman, P.; Gardhagen, R.; Virdung, T.; Karlsson, M. Aerodynamic Drag Reduction of a Light Truck—From Conceptual Design to Full Scale Road Tests; SAE International: Warrendale, PA, USA, 2016; p. 2016-01-1594. [Google Scholar] [CrossRef]
- Pudell, E.; Edelmann, C. Investigations into the Aerodynamic Influence of Trailers Towed by Battery Electric Passenger Cars. In 22. Internationales Stuttgarter Symposium; Bargende, M., Reuss, H.C., Wagner, A., Eds.; Springer Fachmedien Wiesbaden: Wiesbaden, Germany, 2022; pp. 171–182. [Google Scholar] [CrossRef]
- Atif, M.; Aliyu, A.; Mishra, R. Aerodynamic analysis of a car-trailer combination using CFD based numerical techniques: A shape optimisation and drag reduction study. Int. J. COMADEM 2022, 25, 71–79. [Google Scholar]
- Synák, F.; Rievaj, V.; Semanová, Š.; Palúch, J. The Impact of Using Trailers on the Fuel Consumption. TaC 2018, 6, 30–34. [Google Scholar] [CrossRef]
- Chow, K. Improving vehicle rolling resistance and aerodynamics. In Alternative Fuels and Advanced Vehicle Technologies for Improved Environmental Performance; Elsevier: Amsterdam, The Netherlands, 2022; pp. 459–481. [Google Scholar] [CrossRef]
- Fontaras, G.; Zacharof, N.G.; Ciuffo, B. Fuel consumption and CO2 emissions from passenger cars in Europe—Laboratory versus real-world emissions. Prog. Energy Combust. Sci. 2017, 60, 97–131. [Google Scholar] [CrossRef]
- Thomas, J.; Huff, S.; West, B. Fuel Economy and Emissions Effects of Low Tire Pressure, Open Windows, Roof Top and Hitch-Mounted Cargo, and Trailer. SAE Int. J. Passeng. Cars—Mech. Syst. 2014, 7, 862–872. [Google Scholar] [CrossRef]
- Ventura, L.M.; Jiang, Y.; Boriboonsomsin, K.; Scora, G.; Johnson, K.; Collier, S.; Yoon, S.; Durbin, T.D. Characterizing non-box trailer activity and aerodynamic devices for greenhouse gas emissions reductions. Transp. Res. Part D Transp. Environ. 2021, 93, 102763. [Google Scholar] [CrossRef]
- Kim, J.J.; Kim, J.; Hann, T.; Kim, D.; Roh, H.S.; Lee, S.J. Considerable drag reduction and fuel saving of a tractor–trailer using additive aerodynamic devices. J. Wind. Eng. Ind. Aerodyn. 2019, 191, 54–62. [Google Scholar] [CrossRef]
- Kim, J.J.; Kim, J.; Lee, S.J. Substantial drag reduction of a tractor-trailer vehicle using gap fairings. J. Wind. Eng. Ind. Aerodyn. 2017, 171, 93–100. [Google Scholar] [CrossRef]
- Khosravi, M.; Mosaddeghi, F.; Oveisi, M.; Khodayari-b, A. Aerodynamic drag reduction of heavy vehicles using append devices by CFD analysis. J. Cent. South Univ. 2015, 22, 4645–4652. [Google Scholar] [CrossRef]
- Hwang, B.G.; Lee, S.; Lee, E.J.; Kim, J.J.; Kim, M.; You, D.; Lee, S.J. Reduction of drag in heavy vehicles with two different types of advanced side skirts. J. Wind. Eng. Ind. Aerodyn. 2016, 155, 36–46. [Google Scholar] [CrossRef]
- Hoffmann, F.; Schmidt, H.J.; Nayeri, C.; Paschereit, O. Drag Reduction using Base Flaps Combined with Vortex Generators and Fluidic Oscillators on a Bluff Body. SAE Int. J. Commer. Veh. 2015, 8, 705–712. [Google Scholar] [CrossRef]
- Urquhart, M.; Varney, M.; Sebben, S.; Passmore, M. Drag reduction mechanisms on a generic square-back vehicle using an optimised yaw-insensitive base cavity. Exp. Fluids 2021, 62, 241. [Google Scholar] [CrossRef]
- Menter, F. Zonal Two Equation k-w Turbulence Models For Aerodynamic Flows. In Proceedings of the 23rd Fluid Dynamics, Plasmadynamics, and Lasers Conference, Orlando, FL, USA, 6–9 July 1993. [Google Scholar] [CrossRef]
- Schuetz, T.C. Aerodynamics of Road Vehicles, 5th ed.; SAE International: Warrendale, PA, USA, 2015. [Google Scholar] [CrossRef]
Figure 1.
Image showing the simulated sedan and SUV geometry against that used in the wind tunnel test [4].
Figure 1.
Image showing the simulated sedan and SUV geometry against that used in the wind tunnel test [4].

Figure 2.
Rendered image of FBT1’s exterior geometry and underside.

Figure 3.
Accumulated drag distribution for FBT1.

Figure 4.
Total pressure plotted and clipped along planes 0.75 m apart on FBT1 (top) and isosurface of total pressure equal to zero (bottom).
Figure 4.
Total pressure plotted and clipped along planes 0.75 m apart on FBT1 (top) and isosurface of total pressure equal to zero (bottom).

Figure 5.
Pressure coefficient along the surface of FBT1.

Figure 6.
Velocity magnitude along FBT1’s symmetry plane.

Figure 7.
Skin friction coefficient along FBT1’s surface.

Figure 8.
Q-criterion = 1500 s turbulent intensity—FBT1.

Figure 9.
Rendered images of the initial geometry modifications. No mud guards (top left), underside covered (top right), and aero drawbar (bottom left and right).
Figure 9.
Rendered images of the initial geometry modifications. No mud guards (top left), underside covered (top right), and aero drawbar (bottom left and right).

Figure 10.
Rendered images of the front face changes and added panelling. Ladder rack face (top), LRF with dropsides and rear gate (middle left), LRF with D&RG with cover (middle right), alt front face (bottom left), and alt front face with hollow (bottom right).
Figure 10.
Rendered images of the front face changes and added panelling. Ladder rack face (top), LRF with dropsides and rear gate (middle left), LRF with D&RG with cover (middle right), alt front face (bottom left), and alt front face with hollow (bottom right).

Figure 11.
Drag distribution on the trailer rear, trailer front, and van rear for the five front faces and added panelling simulations.
Figure 11.
Drag distribution on the trailer rear, trailer front, and van rear for the five front faces and added panelling simulations.

Figure 12.
X-velocity plot along the symmetry plane combined with surface pressure coefficient plot for the alt front face (left) and alt front face with hollow (right) configurations.
Figure 12.
X-velocity plot along the symmetry plane combined with surface pressure coefficient plot for the alt front face (left) and alt front face with hollow (right) configurations.

Figure 13.
Images of the three novel mid-section devices (NMD). NMD1 (top-left), NMD2 (top-right), and NMD3 (bottom).
Figure 13.
Images of the three novel mid-section devices (NMD). NMD1 (top-left), NMD2 (top-right), and NMD3 (bottom).

Figure 14.
Images showing NMD2 redirecting the flow from the top of the van into its rear.

Figure 15.
Images of the single- and triple-axle FBT1 configurations.

Figure 16.
Velocity magnitude plots for the axle configurations in direct and yawed flow.

Figure 17.
Images of the additional geometry modifications to FBT1.

Figure 18.
Image of the different drawbar lengths used in the drawbar length tests.

Figure 19.
Graph of vs. drawbar length for FBT1.

Figure 20.
Images of FBT1-NACTFD and the drag-reducing devices fit to the trailer.

Figure 21.
Chart of the drag count changes per component on FBT1-NACTFD vs. FBT1.

Figure 22.
Images of the multi-stage converging cavity (MSCC) fitted to FBT1-NACVFD.

Figure 23.
Contour plot of pressure coefficient with isosurface of Cp = 0.005 (top) and velocity magnitude plot along the symmetry plane of FBT1-NACVFD (bottom).
Figure 23.
Contour plot of pressure coefficient with isosurface of Cp = 0.005 (top) and velocity magnitude plot along the symmetry plane of FBT1-NACVFD (bottom).

Figure 24.
Chart of the drag count changes per component on FBT1-NACVFD vs. FBT1.

Figure 25.
Clip planes of total pressure in direct and yawed flow (top) with isosurfaces of total pressure = 0 Pa for direct and yawed flow (bottom).
Figure 25.
Clip planes of total pressure in direct and yawed flow (top) with isosurfaces of total pressure = 0 Pa for direct and yawed flow (bottom).

Figure 26.
Rendered image of FBT1—final design fit with both van and trailer devices.


Table 1.
Sensitivity study results for vs. Reynolds number.
| Re (10) | 0.753 | 1.13 | 1.49 | 1.7 | 1.88 | 2.26 |
|---|---|---|---|---|---|---|
| Air Speed (km/h) | 40 | 60 | 80 | 90 | 100 | 120 |
| Drag Coefficient | 0.475 | 0.467 | 0.466 | 0.4675 | 0.470 | 0.467 |
| % Change | 1.93% | 0.21% | - | 0.32% | 0.86% | 0.21% |
Table 2.
Table showing the variation of vs. cell count.
| Mesh Name | Very Coarse | Coarse | Original | Fine | Very Fine |
|---|---|---|---|---|---|
| Cell Count (millions) | 25.3 | 27.3 | 37.0 | 63.0 | 120.6 |
| Drag Coefficient | 0.4685 | 0.468 | 0.466 | 0.468 | 0.469 |
| % Change | 0.54% | 0.43% | - | 0.43% | 0.64% |
Table 3.
Results from the validation study for the Mercedes sedan and SUV.
| - | Sedan | wTrailer | SUV | wTrailer |
|---|---|---|---|---|
| CFD A (m) | 0.56 | 1.12 | 0.96 | 1.33 |
| Experiment A | 0.65 | 1.16 | 1.03 | 1.44 |
| % Difference | 13.8% | 3.4% | 6.8% | 7.7% |
Table 4.
FBT1’s drag and lift coefficients.
| Simulation Name | Drag Coefficient | Lift Coefficient |
|---|---|---|
| FBT1 | 0.466 | −0.116 |
Table 5.
Aerodynamic results for the initial geometry modifications to FBT1.
| Simulation Name | % Change | ||
|---|---|---|---|
| FBT1—No Mudguards | 0.464 | −0.43% | −0.132 |
| FBT1—Underside Covered | 0.434 | −6.87% | −0.171 |
| FBT1—Aero Drawbar | 0.464 | −0.43% | −0.070 |
Table 6.
Aerodynamic results for the front face changes and added panelling.
| Simulation Name | % Change | ||
|---|---|---|---|
| FBT1—LRF | 0.592 | 27.04% | −0.041 |
| FBT1—LRF with D&RG | 0.598 | 28.33% | −0.123 |
| FBT1—LRF with D&RG with Cover | 0.578 | 24.03% | −0.082 |
| FBT1—Alt Front Face | 0.478 | 2.58% | −0.004 |
| FBT1—Alt Front Face with Hollow | 0.514 | 10.30% | −0.060 |
Table 7.
Aerodynamic results for the novel mid-section devices.
| Simulation Name | % Change | ||
|---|---|---|---|
| FBT1—NMD1 | 0.460 | −1.29% | −0.104 |
| FBT1—NMD2 | 0.451 | −3.22% | −0.100 |
| FBT1—NMD3 | 0.447 | −4.08% | −0.064 |
Table 8.
Aerodynamic results for the number of axles test in direct flow ( = 0°).
| Simulation Name | % Change | ||
|---|---|---|---|
| FBT1—Single-Axle | 0.471 | 1.07% | −0.108 |
| FBT1 | 0.466 | — | −0.116 |
| FBT1—Triple-Axle | 0.466 | 0% | −0.144 |
Table 9.
Aerodynamic results for the number of axles test in a crosswind ( = 12.8°).
| Simulation Name | ||||||
|---|---|---|---|---|---|---|
| FBT1—Single-Axle | 0.547 | −0.209 | 0.926 | −0.664 | 0.581 | 2.045 |
| FBT1 | 0.565 | −0.171 | 0.937 | −0.669 | 0.804 | 2.122 |
| FBT1—Triple-Axle | 0.570 | −0.146 | 0.953 | −0.678 | 1.054 | 2.245 |
Table 10.
Aerodynamic results for the additional geometry modifications.
| Simulation Name | % Change | ||
|---|---|---|---|
| FBT1—Side Skirts | 0.464 | −0.43% | −0.182 |
| FBT1—Alt Bed Texture | 0.465 | −0.21% | −0.112 |
| FBT1—Loaded | 0.520 | 11.59% | −0.013 |
| FBT1—Mesh Sides | 0.656 | 40.77% | −0.138 |
Table 11.
Drag distribution on FBT1—mesh sides.
| Mesh Sides | Van Bumper | Van Rear | Trailer Rear | Trailer Front | Other | |
|---|---|---|---|---|---|---|
| % | 32% | 19% | 12% | 9% | 6% | 22% |
Table 12.
Aerodynamic results for the drawbar length tests on FBT1.
| Simulation Name | % Change | ||
|---|---|---|---|
| FBT1—850 mm | 0.458 | −1.72% | −0.100 |
| FBT1—1100 mm | 0.466 | 0% | −0.119 |
| FBT1—1225 mm | 0.468 | 0.43% | −0.120 |
| FBT1—1350 mm | 0.466 | - | −0.116 |
| FBT1—1600 mm | 0.473 | 1.50% | −0.123 |
| FBT1—1850 mm | 0.481 | 3.22% | −0.131 |
Table 13.
Aerodynamic results for the novel aero concept with trailer fitted devices.
| Simulation Name | % Change | ||
|---|---|---|---|
| FBT1—NACTFD | 0.432 | −7.30% | −0.134 |
Table 14.
Aerodynamic results for the novel aero concept with van fitted devices.
| Simulation Name | % Change | ||
|---|---|---|---|
| FBT1—NACVFD | 0.383 | −17.81% | −0.056 |
Table 15.
Aerodynamic coefficients for FBT1—NACVFD in a crosswind ( = 12.8°).
| Simulation Name | ||||||
|---|---|---|---|---|---|---|
| FBT1—NACVFD | 0.458 | −0.135 | 0.836 | −0.602 | 0.733 | 1.679 |
| % Changes vs. FBT1 | −18.94% | −21.05% | −10.78% | −10.01% | −8.83% | −20.88% |
Table 16.
Aerodynamic coefficients for FBT1—final design.
| Simulation Name | % Change | ||
|---|---|---|---|
| FBT1—Final Design | 0.352 | −24.46% | −0.133 |
Disclaimer/Publisher’s Note: The statements, opinions and data contained in all publications are solely those of the individual author(s) and contributor(s) and not of MDPI and/or the editor(s). MDPI and/or the editor(s) disclaim responsibility for any injury to people or property resulting from any ideas, methods, instructions or products referred to in the content. |
© 2023 by the authors. Licensee MDPI, Basel, Switzerland. This article is an open access article distributed under the terms and conditions of the Creative Commons Attribution (CC BY) license (https://creativecommons.org/licenses/by/4.0/).
Share and Cite
MDPI and ACS Style
Connolly, M.G.; O’Rourke, M.J.; Ivankovic, A. Reducing Aerodynamic Drag on Flatbed Trailers for Passenger Vehicles Using Novel Appendable Devices. Fluids 2023, 8, 289. https://doi.org/10.3390/fluids8110289
AMA Style
Connolly MG, O’Rourke MJ, Ivankovic A. Reducing Aerodynamic Drag on Flatbed Trailers for Passenger Vehicles Using Novel Appendable Devices. Fluids. 2023; 8(11):289. https://doi.org/10.3390/fluids8110289
Chicago/Turabian StyleConnolly, Michael Gerard, Malachy J. O’Rourke, and Alojz Ivankovic. 2023. "Reducing Aerodynamic Drag on Flatbed Trailers for Passenger Vehicles Using Novel Appendable Devices" Fluids 8, no. 11: 289. https://doi.org/10.3390/fluids8110289