Article

Measurements and Prediction of Ash Deposition in a Cyclone-Fired Boiler Operating under Variable Load Conditions

by
Gautham Krishnamoorthy
1,*,
Evan Bloom
1,
Krishnamoorthy Viswanathan
1,
Shuchita Sanjay Patwardhan
2,
David John Stadem
2 and
Steve Benson
2
1
Department of Chemical Engineering, University of North Dakota, UPSON II Room 365, 241 Centennial Drive, Grand Forks, ND 58202-7101, USA
2
Microbeam Technologies Inc., 4200 James Ray Drive, Ste. 193, Grand Forks, ND 58202-6090, USA
*
Author to whom correspondence should be addressed.
Fluids 2023, 8(12), 305; https://doi.org/10.3390/fluids8120305
Submission received: 22 September 2023 / Revised: 20 November 2023 / Accepted: 21 November 2023 / Published: 23 November 2023
(This article belongs to the Collection Challenges and Advances in Heat and Mass Transfer)

Abstract

:
Measurements of ash deposition rates were made between the secondary superheater and reheater sections of a 450 MW cyclone-fired lignite boiler as the operational load varied from 33 to 100%. Significant reductions in deposition rates with a decrease in operational load were observed. To uncover the causative mechanisms behind these observations, operational data from the power plant were used to carry out computational fluid dynamic (CFD) simulations of the boiler. After ascertaining that the gas temperatures and velocities at various sections within the boiler were being represented adequately, decoupled simulations of the ash deposition process on the deposit probe were carried out using a finely resolved boundary layer mesh. Fly ash particle size distribution (PSD) and its concentration for the decoupled calculations were determined from stand-alone cyclone barrel simulations. The ash partitioning (mass %) between the fly ash and slag was found to be ~50:50, which was in line with previous field observations, and it did not vary significantly across different cyclone loads. The predicted PSD of the deposit ash was concentrated in the size range 10–30 microns, which was in agreement with cross-sectional images of the deposit obtained from the measurements. At lower loads, sharp variations in the deposition rates were predicted in the gas temperature range 950–1150 K. The particle kinetic energy—particle viscosity-based capture methodology utilized in this study in conjunction with appropriate ash compositions, ash viscosity models and gas temperature estimates can help estimate slagging propensities at different loads reasonably well in these systems.

1. Introduction

A significant number of coal-fired boilers operate under load following conditions requiring ramp down to as low as 30–50% of their rated capacity in response to intermittent renewable energy supply. These operational variations can induce high temperature gradients and mechanical stresses on system components. In fact, 60–80% of the damage in power plants has been attributed to these cycling operations, with most of the failures resulting from thermal stresses of heat exchanger components [1]. In addition, previous studies have shown that decreasing the load may introduce maldistributions in temperature and velocity, which can exacerbate the thermal and mechanical stress on heat exchanger tubes [2,3]. Since steam velocities in the heat exchanger tubes are reduced at lower loads, the internal convective heat transfer coefficient is lower, and the rate of heat extraction may be further reduced by the non-uniformities in the heat flux and gas temperatures.
Variations in ash deposition rates with load may further compound these issues. For instance, Shi et al. [4] showed that at low load conditions (where gas velocities are as low as 6 m/s), the thermal efficiency of the boiler drops due to ash fouling. However, as the gas velocities increase with load, the ash accumulation on the heat exchanger surfaces is reduced due to erosion by the abrasive fly ash particles, thereby improving heat extraction rates. The important role played by particle kinetic energies (PKE) on the erosion process has also been demonstrated by us recently (albeit in a lab-scale furnace) in the context of Rice Husk (RH)—Natural Gas combustion in AIR and oxygen-enriched combustion scenarios (OXY70) that were also associated with nearly a three-fold reduction in gas velocities (akin to load following operations) [5]. If the fly ash particle size distribution (PSD) remained invariant, the erosion rates in AIR were significantly higher than those in OXY70 due to higher PKE, as observed by Shi et al. [4]. While the aforementioned studies [4,5] point to the important role played by PKE on erosion rates, we have been able to ascertain its importance on the deposition process on clean surfaces as well. For instance, when well characterized fly ash PSD information is available from measurements and is employed in conjunction with accurate temperature and velocity predictions in a PKE—particle viscosity (μP)-based ash capture criterion, we have found that the deposition rate and its relative variations with load or flue gas volumetric flow rates can be predicted reasonably well [6]. Building on this framework we successfully predicted deposition rate variations on clean tubes across a range of conditions encompassing a three-fold variation in flow rates and widely varying fuel and ash compositions in a lab-scale furnace [7]. In this study, we attempt to explain our measured ash deposition rates as a function of load by employing our PKE—μP-based capture criterion at a much larger scale, i.e., in the convective section of a 450 MW cyclone-fired lignite boiler. Since the gas temperatures in the vicinity of the deposit surface were similar to the lab-scale environment (~1100–1300 K at full load), a natural extension and exploration of the capture criterion across the different combustor scales was deemed to be reasonable. However, unlike the lab-scale furnace studies where nearly identical gas temperatures (but a three-fold velocity variation) between AIR and OXY70 scenarios were encountered at the deposit surface, in a full-scale boiler a drop in load is accompanied by a reduction in gas velocities as well as the temperature. Therefore, the net result of these variations may either increase or decrease deposition rates. For instance, impaction and erosion efficiencies reduce with velocity reduction, whereas capture efficiencies increase (less propensity to bounce off). On the other hand, a reduction in temperature decreases capture efficiencies due to an increase in μP. Therefore, the overall net impact of these counteracting effects needs to be assessed. To fill this knowledge gap, measurements of the ash deposition rate using a novel custom-built deposit probe were made at different loads and predictions from the PKE—μP-based capture criterion investigated in this study.
The formation of low-temperature eutectics in high-alkali coals like lignite can cause serious ash slagging and fouling issues. Therefore, from an operational standpoint, control of furnace exit gas temperatures (FEGT) and control of fuel blending have been suggested as two cost-effective options to mitigate deposition rates [8,9]. However, their relative effectiveness under low load conditions, where the gas velocities and temperatures are lower, has not been explored and is also a void this study will attempt to fill. Furthermore, both these control measures are invariably correlated as fly ash composition variations resulting from fuel blending impact deposition rates, which in turn affect heat extraction and FEGT. In fact, the cleanliness of the furnace can cause a 50–100 K variation in gas temperatures at various sections within the boiler [10,11]. Due to this strong inter-dependency of both FEGT and fuel ash composition on slagging, we follow a one-factor-at-a-time (OFAT) approach in this study, where the ash deposition variation with load is examined while fuel-fired properties and boiler cleanliness levels were maintained relatively constant. The ash deposition rate measurements were made between the secondary superheater and reheater sections of the boiler, spanning a duration where the fuel properties were relatively invariant and the water walls of the boiler were deemed to be “clean”. In summary, the novel contributions of this study are as follows:
  • Measurements of ash deposition rate in the convective pass of a full-scale 450 MW cyclone-fired boiler were made using a novel custom-built deposit probe at different loads but nearly invariant as-fired fuel properties;
  • Operational data from the power plant are used to carry out computational fluid dynamic (CFD) simulations of combustion within the boiler at different loads, and the gas temperature and velocity variations are examined at different sections of the boiler. CFD temperature predictions are compared with corresponding estimates made by the plant power based on several measured variables and water/steam side heat duties;
  • The cyclone-fired boiler has 12 cyclones associated with it. It operates at very low load conditions (<50% of its rated capacity) by judiciously turning off some of its cyclones. Therefore, our goal was also to identify through CFD simulations any potential maldistributions associated with temperature and velocity across different sections in the boiler that could result in wall damage/operational challenges;
  • We propose a critical viscosity (μcritical)- and particle kinetic energy (PKE)-based capture criterion to compute ash partitioning (ash mass % distribution between the slag and fly ash) within the cyclone barrels that aligns with previous field observations and examine any changes to the ash partitioning due to (load-related) variations in the air and fuel flow rates to the cyclone;
  • We identify operational “sweet spots” for FEGT control at different loads that minimize slagging without having an adverse effect on boiler efficiency.

2. Method

2.1. Experimental Measurements

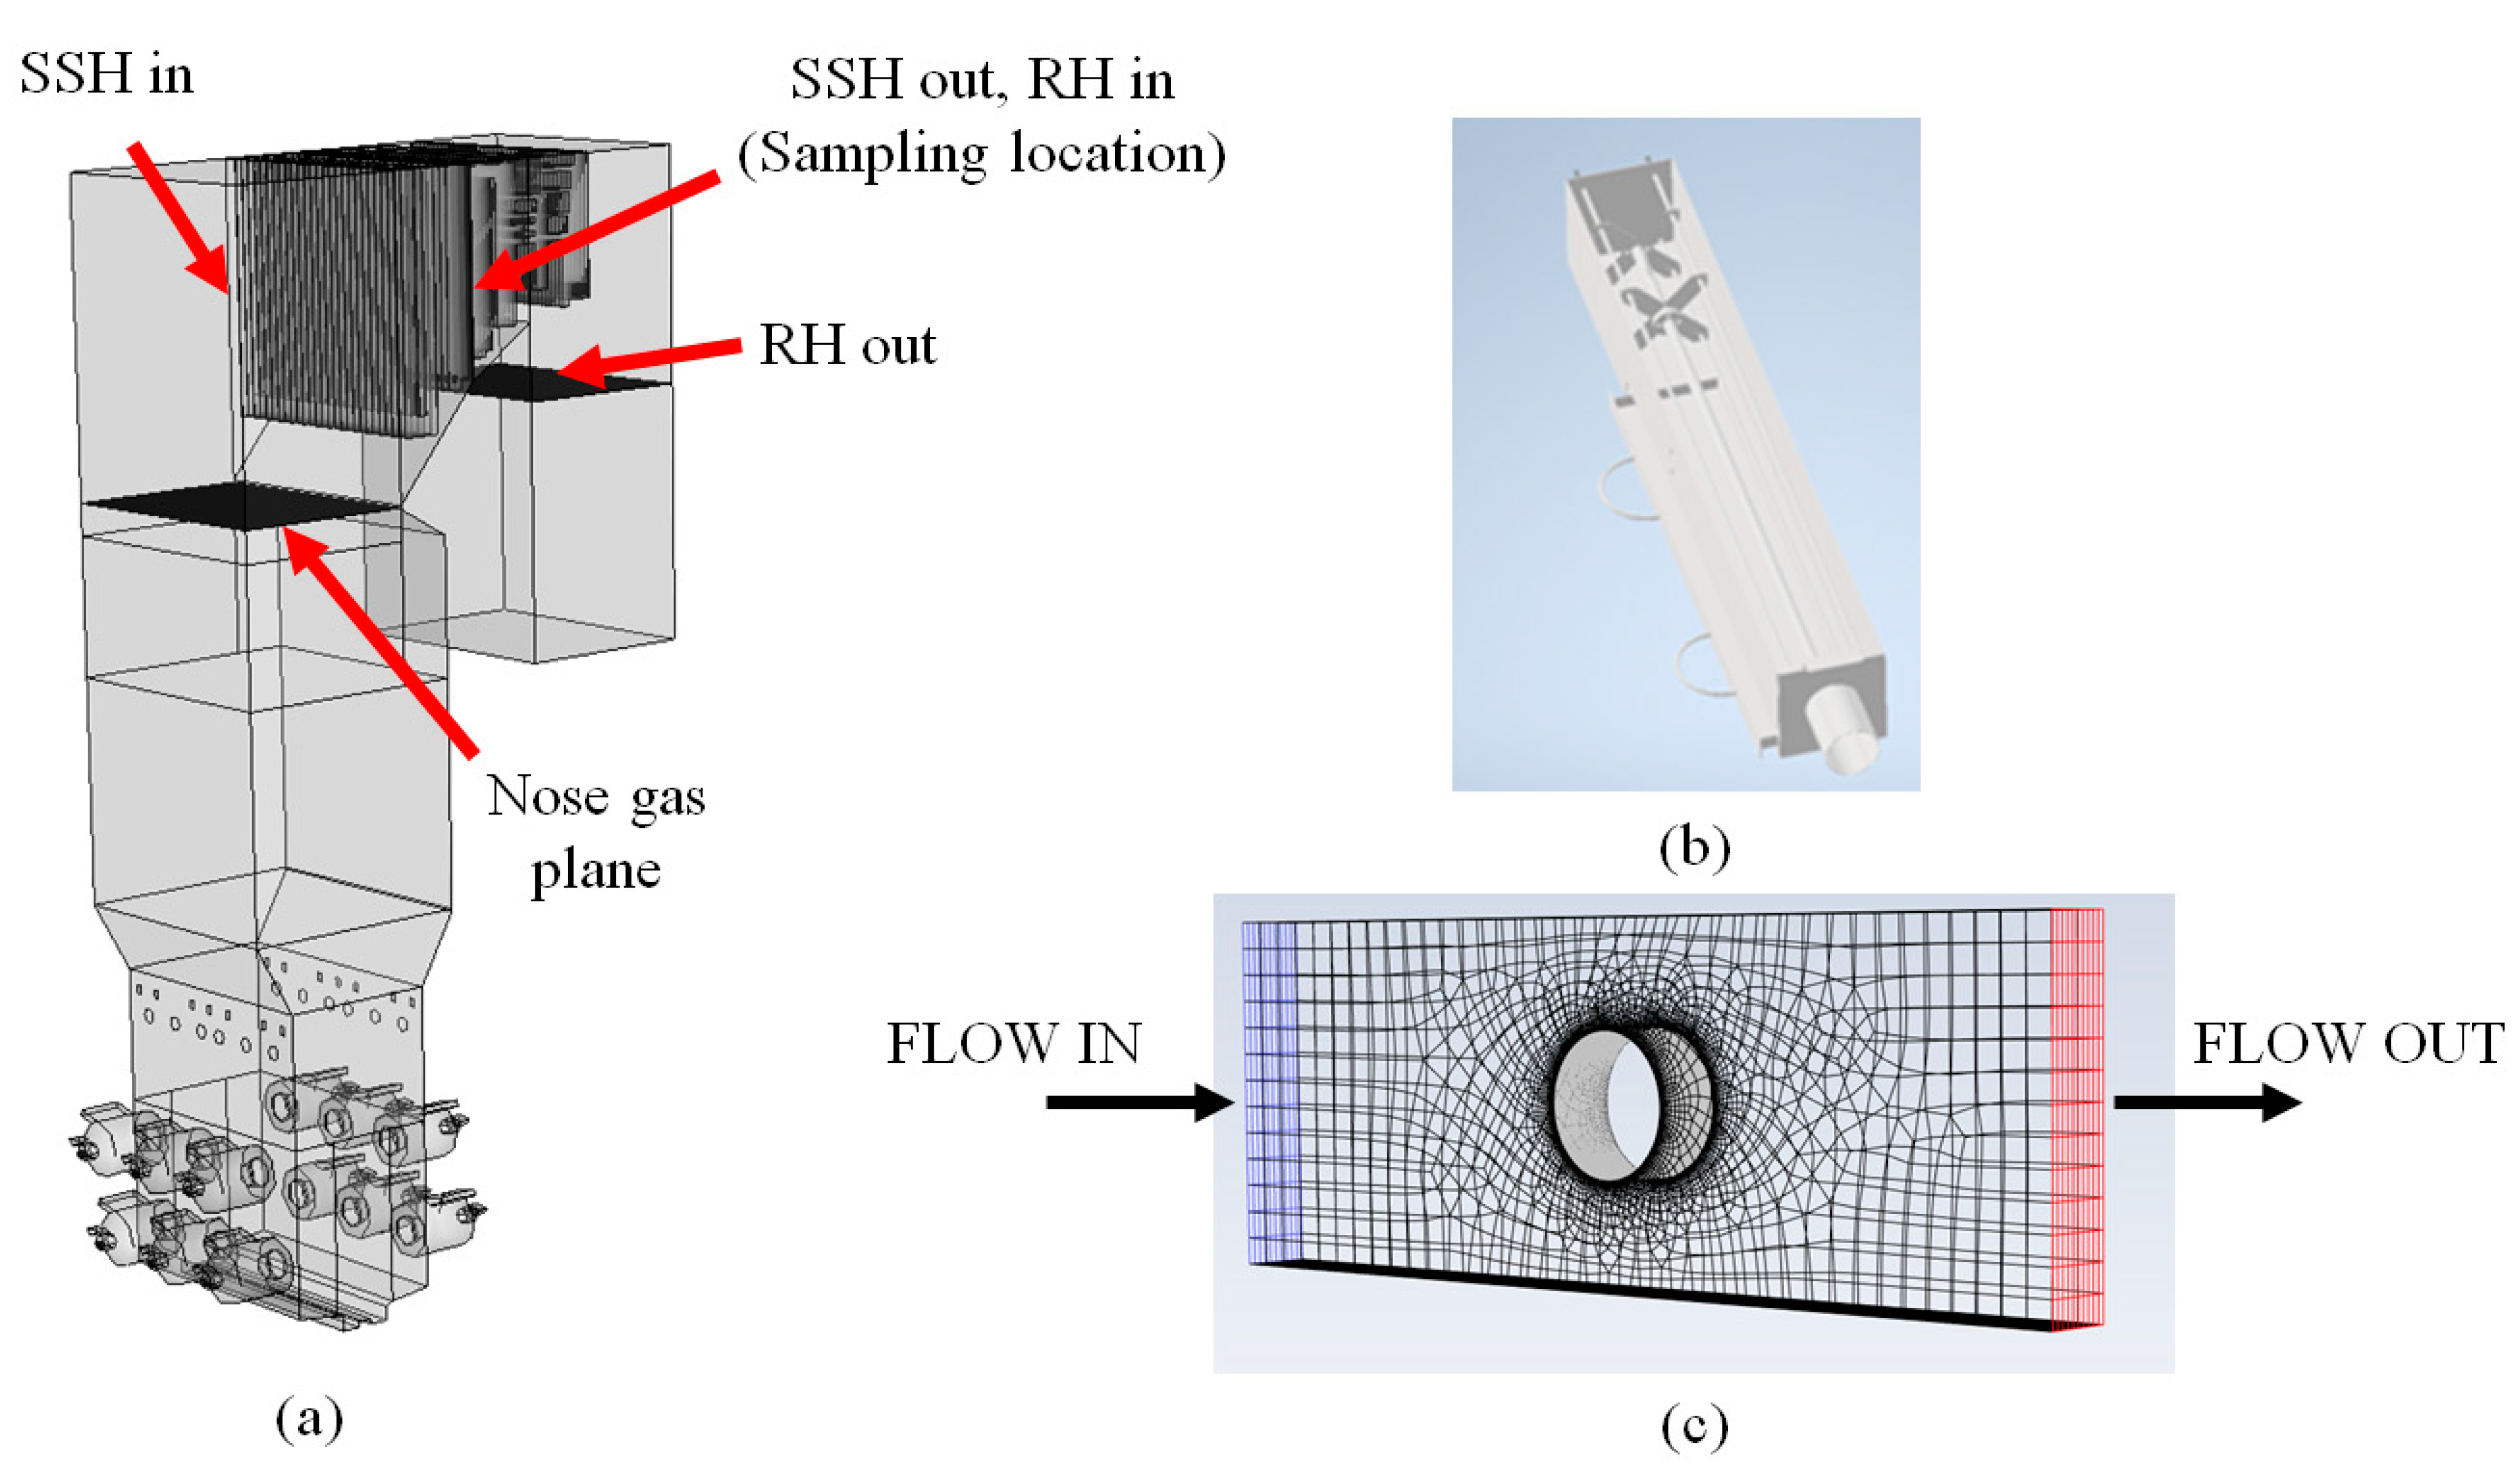
A 3D geometry representation of the 450 MW boiler investigated in this study is shown in Figure 1a. Also shown are different planes along which estimates of gas temperature were obtained from the power plant (SSH: Secondary superheater; RH: Reheater). The geometry of the custom-built deposit collection probe (1″ outside diameter, 5′ long T22 steel tube) is shown in Figure 1b. The probe was inserted horizontally through a 5.5 inch diameter port in the boiler between the secondary superheater and reheater heat exchange sections (gas temperature roughly 1150–1200 K at full load conditions) shown in Figure 1a. The probe was cooled with either air or water that was introduced at the back of the probe to maintain its surface temperature between 800 and 850 K. The boiler’s negative operating pressure creates a strong draft of outside air into the boiler when ports are opened. This draft tends to break deposits during removal of the probe due to the strong airflow combined with thermal shock. In order to minimize the loss of deposits during the probe extraction process, a sealed shell (cf. Figure 1b) was used to enclose the 5′ probe. The shell was designed to accommodate the thermocouple, air and water fittings at the back of the probe as well. Multiple design reviews were performed to ensure ease of fabrication and operation, quality of the collected deposit and specific fit to this particular boiler. Moment calculations were done to assess the suitability of support structures during operation. A custom probe holder with a handle was then built to move the probe in and out of the boiler. Rubber strips and latches were installed around the shell to create a seal while the probe was in operation. A tray was implemented to allow deposits to fall from the probe for easy removal. A 3-point thermocouple was installed inside the probe to monitor the temperatures along the 5′ length. A camera was placed in the rear interior of the shell to be able to view and record video of probe operation. The probe was extracted from the port and cooled to slightly above room temperature. Deposits formed on both the upstream and downstream sides of the probe and were collected for analysis. The edge of a scoopula was then used to scrape deposits off the probe that were collected in plastic containers. The samples were then weighed and bagged according to predetermined sample-handling procedures.
The as-fired fuel composition is summarized in Table 1. The ash composition of the parent fuel is shown in Table 2. The coal ashing procedure was performed at 750 °C according to ASTM method D3174.
Deposition rate measurements were carried out at different loads spanning several hours in duration where the composition of the coal and ash fed into the boiler were deemed to be relatively invariant. Particular attention was paid to ensure that the Na content of the parent fuel did not change significantly as this can impact the slagging propensities [12]. The base-to-acid (B/A) ratio of this coal is 0.59 as calculated using the formula
B A = Fe 2 O 3 + CaO + MgO + K 2 O + Na 2 O SiO 2 + Al 2 O 3
This may be categorized as a high-silica, high-ash, low-B/A coal. Our previous experience indicates that for coals with this characteristic, roughly 50% (by mass) of the ash in coal is captured within the slag layer, with the remaining exiting the cyclone barrels as fly ash. In addition, this generally results in a moderately thick slag layer within the cyclone barrel and can potentially result in slagging issues. A total of 54 deposit samples were collected using the ash deposition probe after the SSH region. Of the samples collected, 13 deposit samples were selected for morphological analysis as a part of this project.
Deposits collected were analyzed using scanning electron microscopy (SEM) analysis. The samples were prepared for SEM analysis by mounting a representative sample in epoxy resin. The mounted samples were cross-sectioned and polished to a fine (1 μm) finish. Some samples were obtained in small quantities. These samples were mounted on carbon stick tape. All samples were coated with carbon to provide a conductive surface for imaging. The samples were then placed in the electron microscope equipped with an X-ray microanalysis and image analysis system. Morphological analysis provides high-magnification images and chemical compositions of features of interest within the sample. Backscattered electron imaging was used for morphological analysis. The average composition of the deposit was obtained through an average of five locations of field area 5 mm2 across a cross-section of the deposit. An aggregated overall composition of the deposit sample is shown in Table 2. It is particularly noteworthy that the deposit ash is depleted in SO3 and enriched in CaO relative to the fuel ash. The partitioning of ash-forming constituents to the deposit occurs in two primary areas: (1) partitioning within the cyclone burner between slag and entrained fly ash and (2) partitioning of depositing ash materials from the entrained fly ash/flue gas onto/into the deposit. Ash partitioning in each of these areas involves a host of complex ash transformation mechanisms, including vaporization, mineral fragmentation, coalescence, nucleation and heterogeneous condensation, etc. These mechanisms are not the focus of the present paper but have been studied extensively [13,14,15,16]. The depletion of SO3 in the deposit is most likely due to the full vaporization and slow condensation of sulfur species during combustion. The enrichment of CaO in the deposit is likely due to increased partitioning of CaO-rich species to the deposit via complex particle size and composition-dependent transformations.
In lignite, the components that make up the ash consist of mineral grains and organically associated elements such as quartz, clay minerals, sulfides (pyrite), carbonates and sulfates. These ash-forming components are associated with the organic structure as well as being present as discrete mineral grains in the coal and undergo several physio-chemical transformations as they travel through the boiler. This causes the composition of the parent fuel ash to be different from that of the deposit ash in the convective pass (cf. Table 2). At the same time, quartz and clay minerals are the primary contributors to ash-related problems, such as erosion (quartz), wall slagging and convective pass fouling. Physical cleaning can remove the extraneous silica and clay particles; however, the organically bound alkali and alkaline-earth elements, such as sodium, calcium and fine clays, cannot be removed easily by cleaning/soot-blowing process [17].
The key total flow rates to the boiler associated with different loads are summarized in Table 3. In order to maintain an exit O2 concentration of 3 mol % (dry basis) as obtained from the plant operational data necessitated cold air ingress of 9% by mass (OFA air/cyclone air + OFA air) that was also sent in through OFA ports. This is a reasonable value which results from the boiler operating at a negative back pressure and the age of the unit. In addition, 35 mass % flue gas recirculation (flue gas recirculation/total flue gas flow rate) was used to reduce temperature and control NOx. These values are in reasonable agreement with values associated with other units reported in the literature [18,19,20]. The cyclone-fired boiler has 12 cyclones associated with it as shown in Figure 1a. It operates at very low load conditions (<50% of its rated capacity) by judiciously turning off some of its cyclones. However, some variation in the air-to-fuel flow rates to the cyclone barrels are seen with load and are summarized in Table 4. The fuel–air equivalence ratio [Φ] at the cyclone (Table 4) and the OFA mass flow rate together affect FEGT and NOx formation [21,22,23]. While the variations in the ash partitioning with coal B/A has been relatively well understood for this cyclone, based on operational experience, one of the goals of this study was to ascertain any ash-partitioning variations with Φ ratio at a fixed coal B/A resulting from the changes to the gas velocities and temperatures within the cyclone barrel.
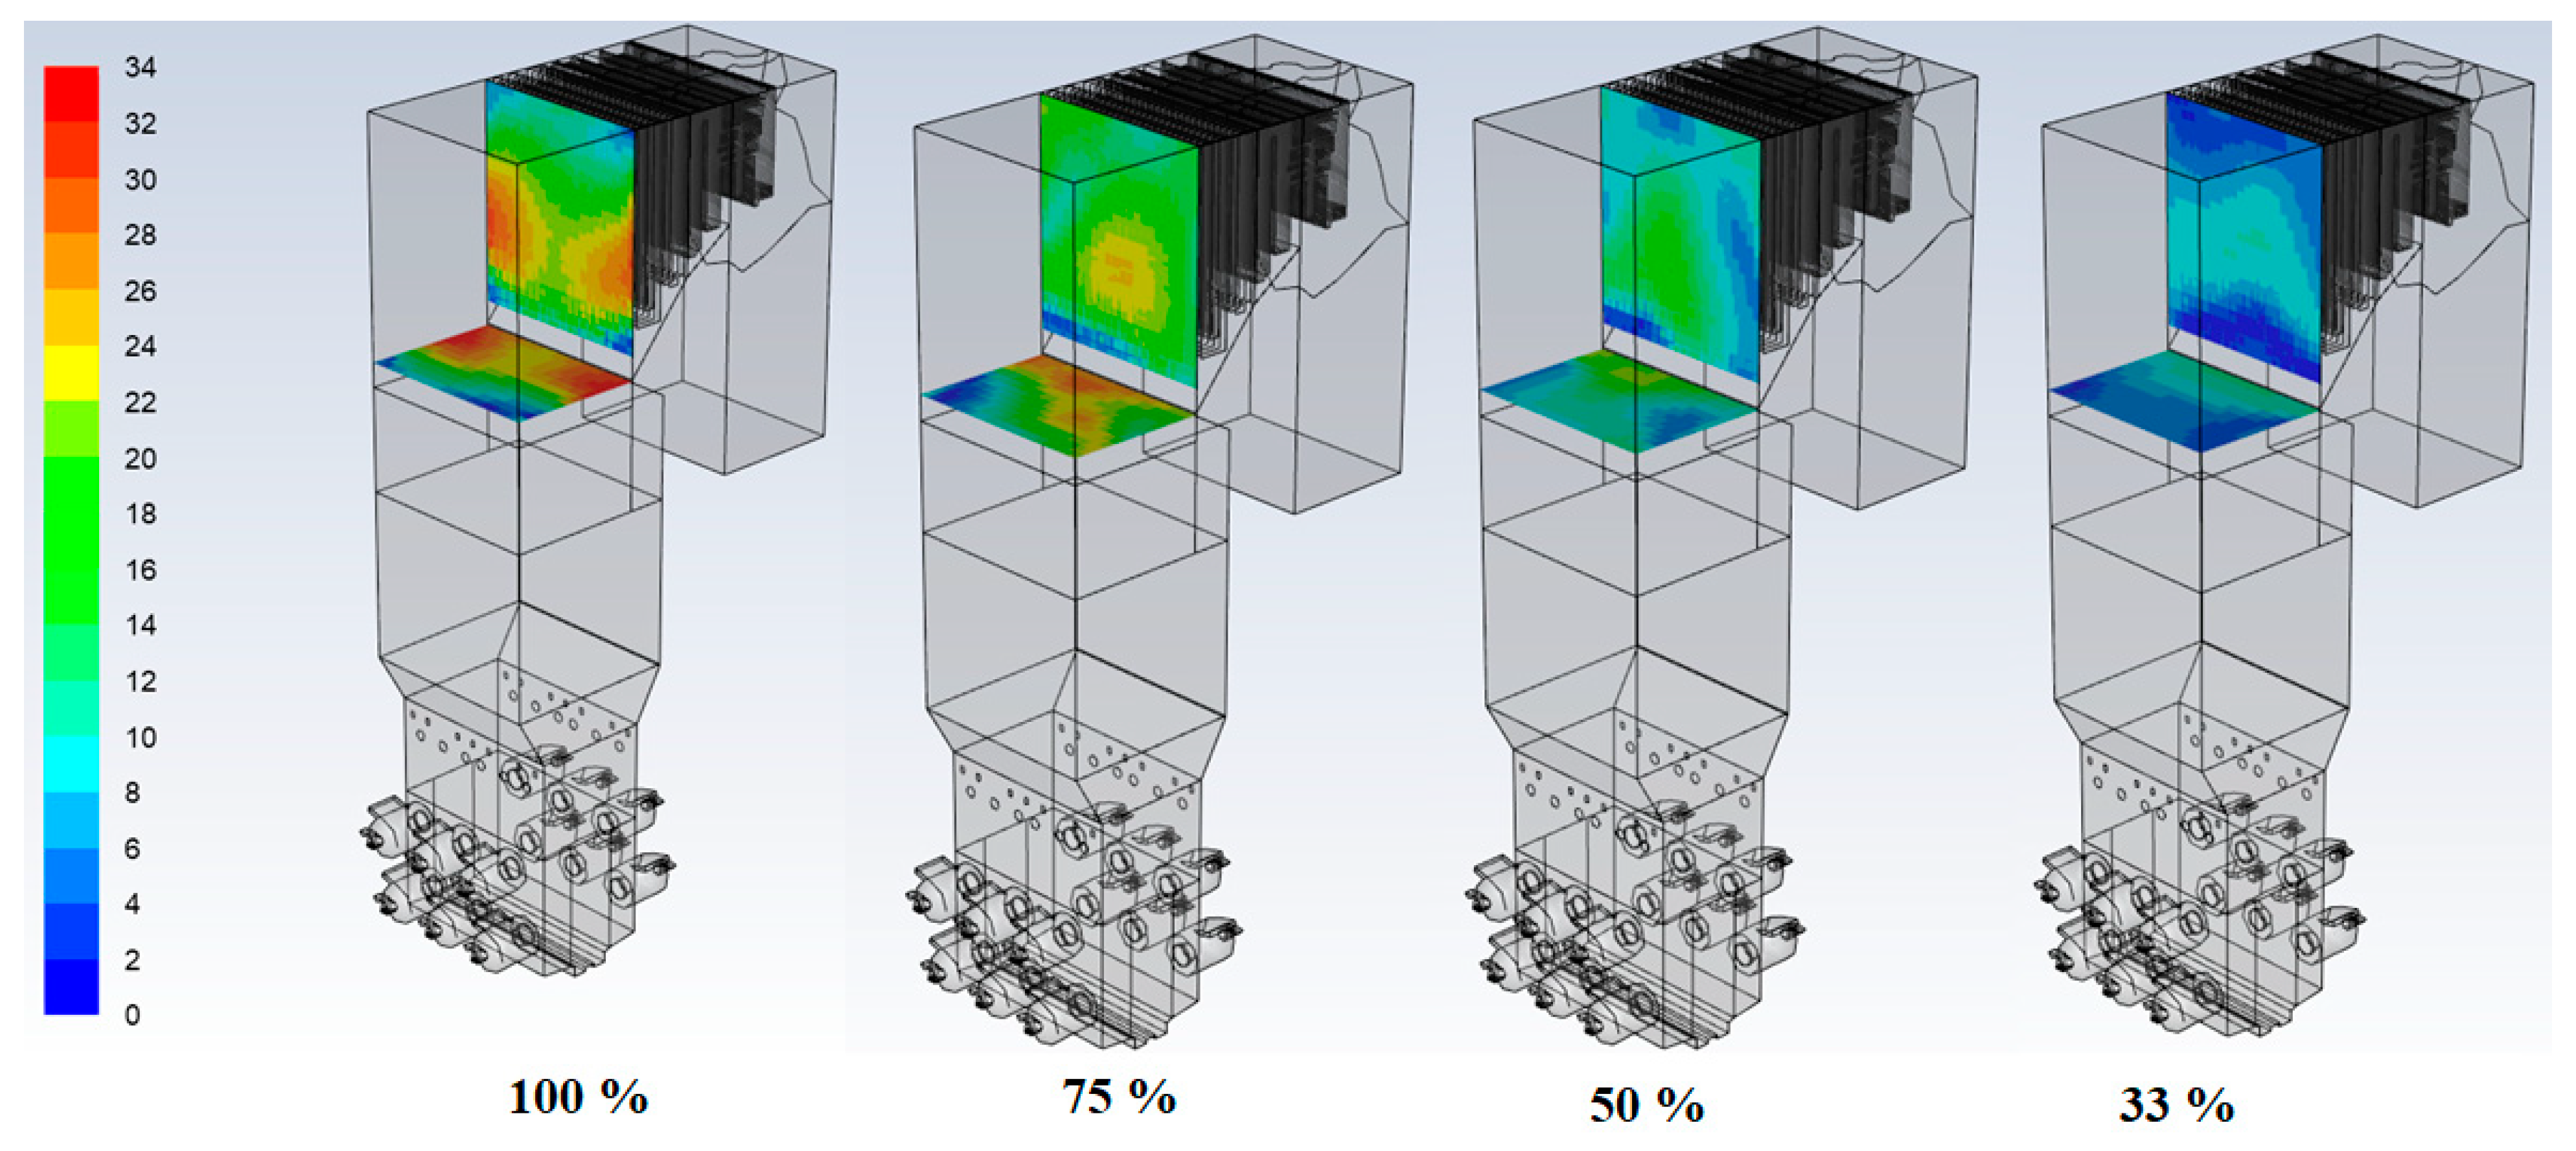
The gas temperature profiles along different sections of the plant play an important role in the ash deposition process and were estimated at different loads by performing an energy balance employing the following variables: the flue gas flow rates, measured excess O2, flue gas temperature at the economizer exit, coal heating values and water/steam energy balance. The water/steam side heat duties of the boiler and tube banks were estimated using the measured feed-water flow rates and spray attemperator flows to obtain the temperature profiles from the furnace exit gas temperature plane and between each tube bank (secondary superheater, primary superheater and economizer). These gas temperatures estimated by the power plant using actual operational data are denoted as “Boiler Model” and are compared against CFD predictions in this study.

2.2. Combustion Simulations

Numerical simulations of ash deposition require highly refined boundary layer grids around the depositing surface to enable accurate prediction of particle impaction. In addition, highly resolved simulations of the cyclone barrels are needed to capture particles at the wall slag layer and determine the ash partitioning between the slag and fly ash. However, resolving the boundary layers associated with the deposit probe and the cyclone barrels and employing them in conjunction with a fully coupled combustion simulation of the entire boiler would make the simulations computationally prohibitive. Therefore, decoupled combustion simulations were carried out across different geometries as follows:
  • Full-scale simulations of the cyclone boiler (shown in Figure 1a): The primary purpose here was to obtain reasonable estimates and distributions of the gas velocities and temperatures at various sections of the boiler (especially in the vicinity of the sampling location). The reasonableness of our predictions was ascertained through corresponding predictions/measurements obtained from the power plant. We also wanted to identify potential non-homogeneities and maldistributions that may result during load-following operations.
  • Highly resolved simulations of combustion within the cyclone barrel with a critical viscosity (μcritical)- and particle kinetic energy (PKE)-based capture criterion with the goal of identifying the fly ash partitioning and its PSD at the outlet of the cyclone. The parent fuel PSD at the inlet of the cyclone barrel was obtained from the power plant and was fit to a Rossin–Rammler distribution, as shown in Figure 2a.
  • Fly ash PSD, its concentration, gas temperatures and velocity information obtained from the aforementioned simulations were employed to make deposition rate predictions on the probe shown in Figure 1c. For this, we ensured that the boundary layer surrounding the ash probe was of sufficient resolution (as per the criteria set forth in [24]) to ensure accurate particle impaction predictions; i.e., we ensured that the size (Δ) of the numerical cells adjacent to the cylindrical probe of diameter D was well within the constraint   Δ   0.3240 D / 4 R e .
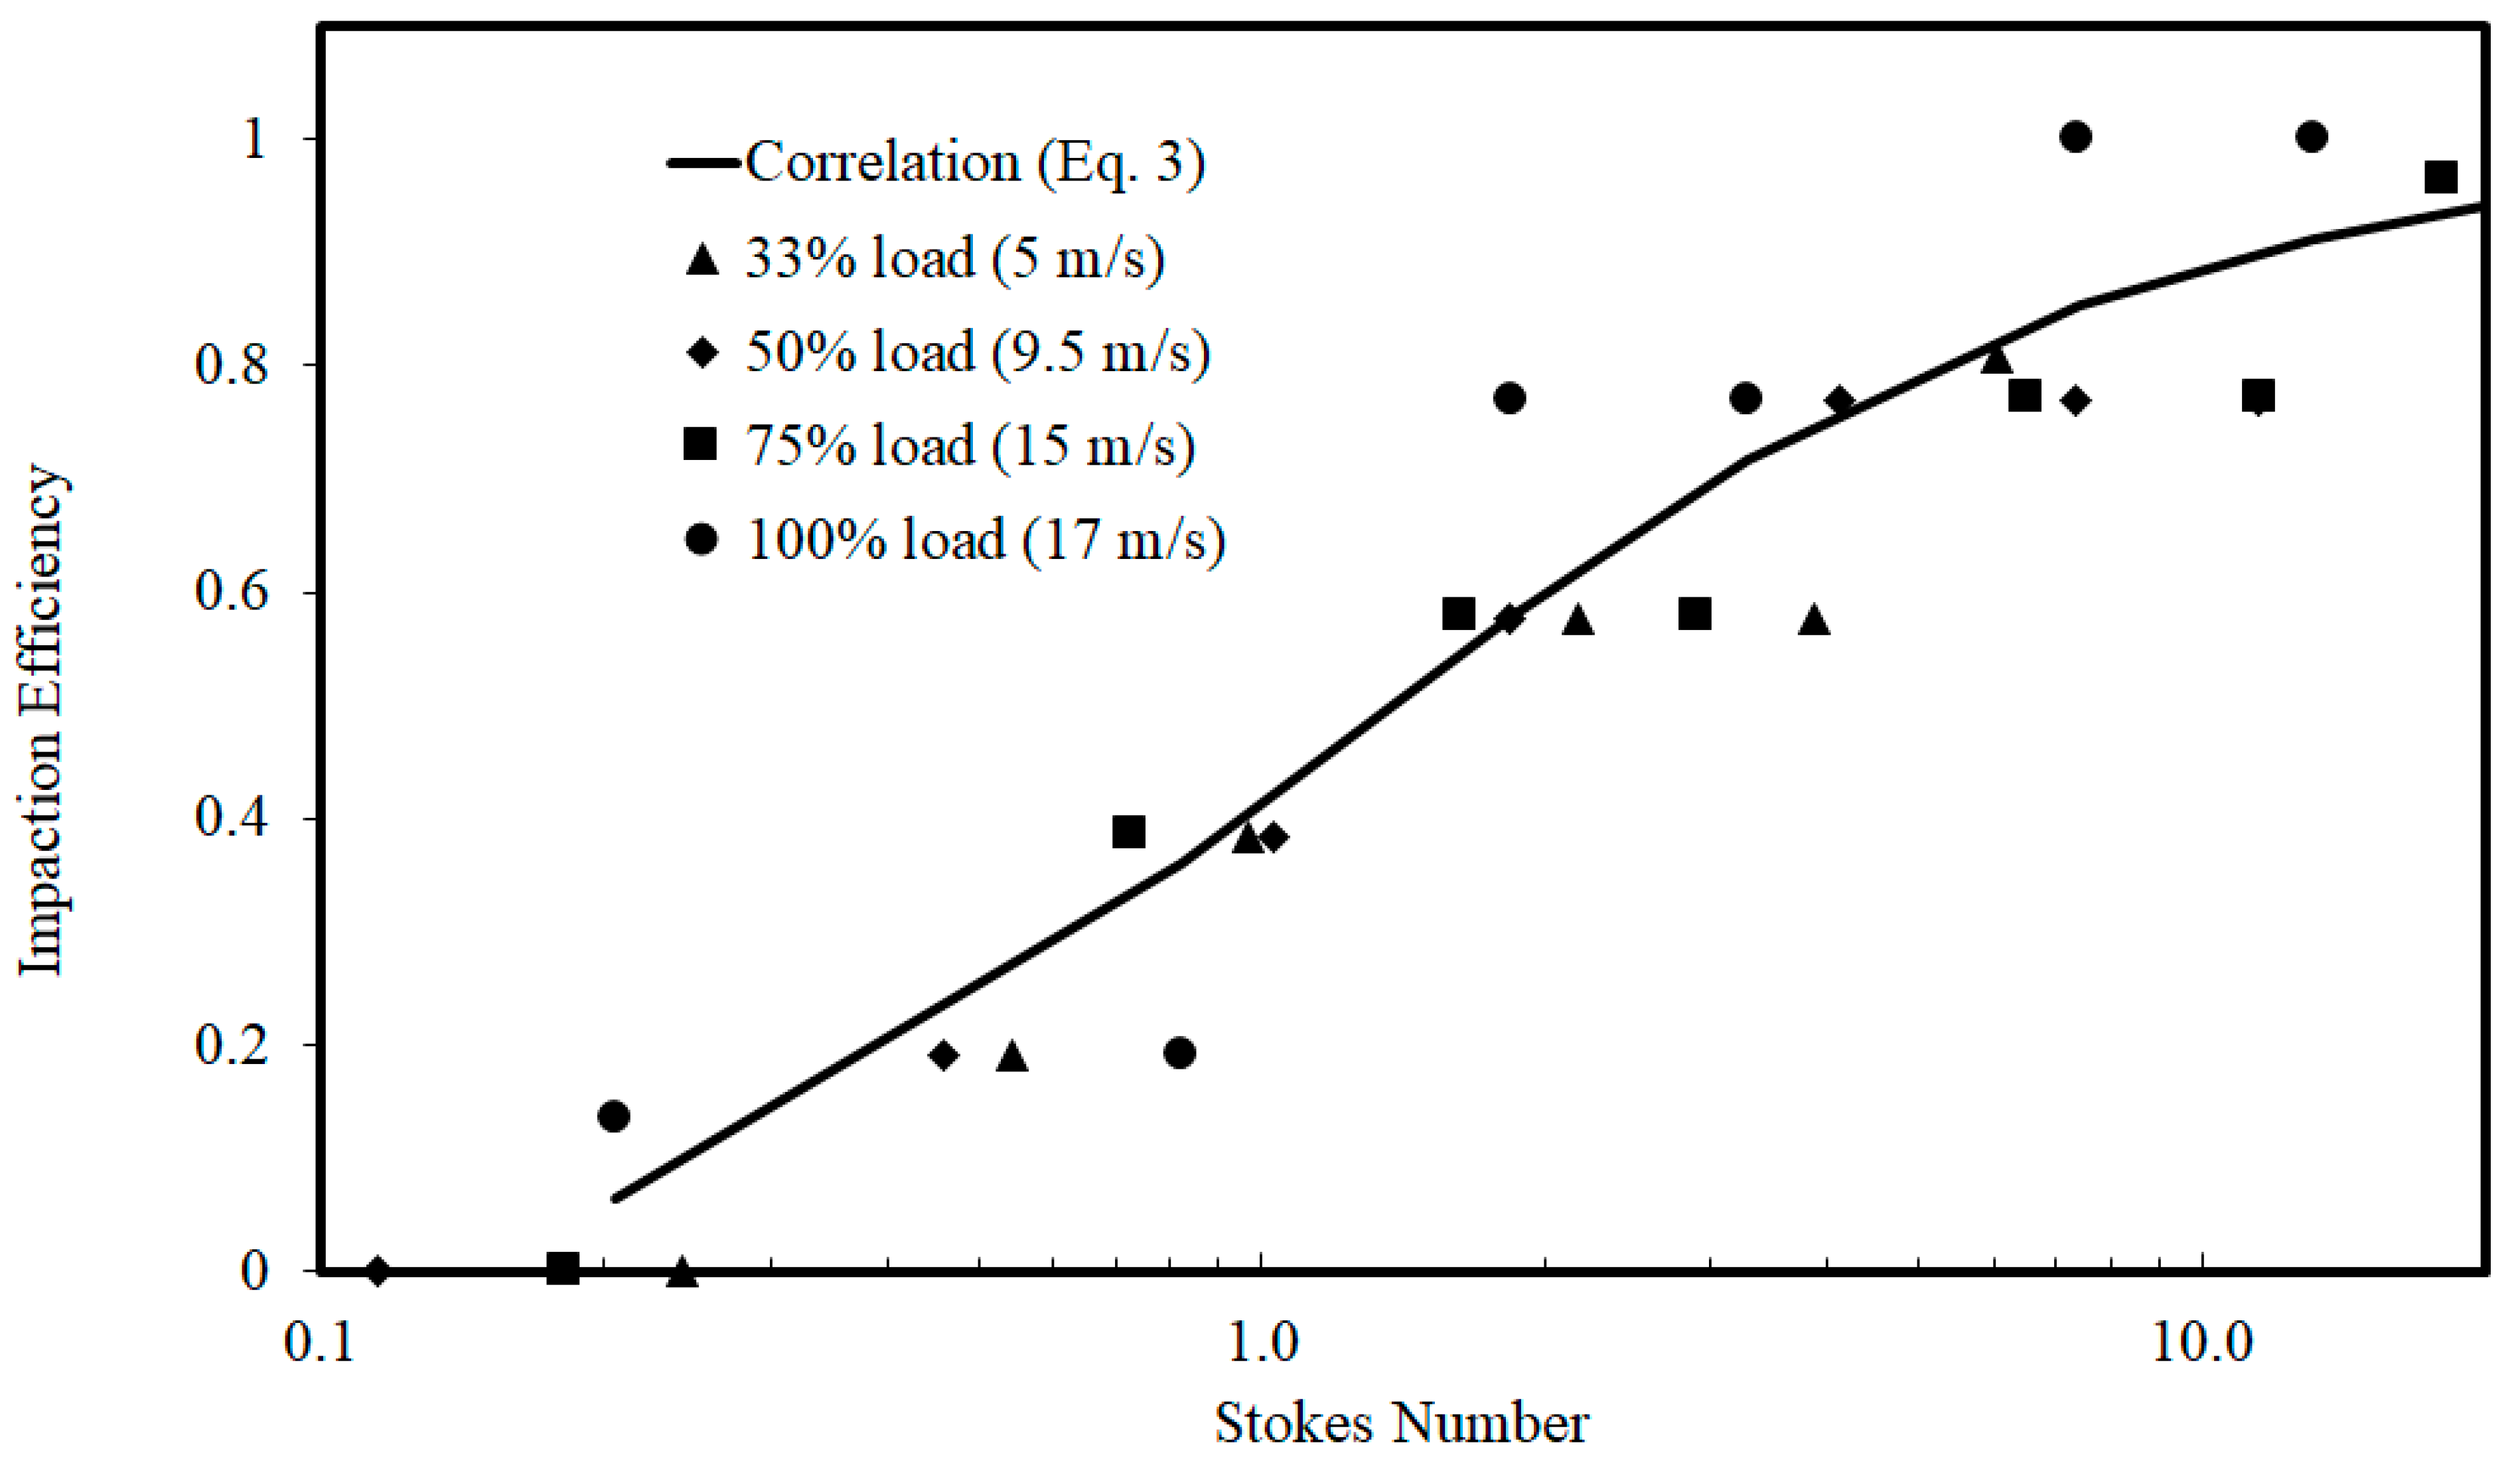
Further validation regarding the adequacy of the boundary layer grid surrounding the deposit probe was established as follows. A particle Stokes number (Stk) can be computed based on the particle velocity near the probe (Vp—assumed to be equal to the average gas velocity obtained from the full boiler simulations) in conjunction with the particle diameter (dp), particle density (ρp), (estimated to be 2500 kg/m3 for the fly ash), gas viscosity (μg) and probe diameter (dc) as
S t k = ρ p d p 2 V p 9 μ g d c
An impaction efficiency (ηimpaction) was then computed as the ratio of the overall arrival rate of particles onto the deposition surface to the mass flux of the particles at the projected surface in front of the deposition surface. The numerically predicted ηimpaction was then compared against established correlations in the literature as a function of Stk as in [25]:
η i i m p a c t i o n = [ 1 + 1.34 ( Stk 0.1238 ) 1 + 0.034 ( Stk 0.1238 ) 2 + 0.0289 ( Stk 0.1238 ) 3 ] 1
All the simulations were carried out in ANSYS FLUENT v 19 [26]. The walls of the boiler were set to a temperature of 700 K (boiler skin temperatures generally range from 600 to 800 K) and an emissivity of 0.7 corresponding to a clean state. Mixed boundary conditions were imposed along the walls of the heat exchanger zone and were assigned a heat transfer coefficient of 5000 W/m2-K. A steam side fluid temperature of 600 K was imposed that matched the steam temperature profiles across different sections obtained from the power plant reasonably well. A heat transfer coefficient (~O (103)) is well representative of clean tubes with very little deposits [11]. While the transport processes in the fluid phase were resolved in an Eulerian grid, the particle trajectories were computed in a Lagrangian reference frame.
Table 5 provides a summary of the various modeling options invoked in this study. Also referenced are additional radiative property modules that were developed and utilized in this study as user-defined functions to predict gas and particle heat transfer accurately under the different conditions. The importance of utilizing accurate composition-dependent particle properties in full-scale boiler simulations has been highlighted in Laubscher and Rousseau [27], while the need to use non-gray gas radiative property models has been emphasized in Nakod et al. [28].
In this study, a critical particle viscosity-based capture criterion was adopted, where the capture probability (Pstick) equals unity if the particle viscosity (in Pa-s) ( μ p )   is lower than the critical viscosity ( μ p , c r i t i c a l ) :
P stick = 1   if   μ p   μ p , c r i t i c a l
Pstick is zero otherwise. The following relationship between PKE and critical viscosity ( μ p , c r i t i c a l ) proposed by Kleinhans et al. [29] was adopted to model the capture process at the deposit probe:
μ p , c r i t i c a l = 5 × 10 12 PKE 1.78
While the relationship in Equation (5) was originally formulated based on data sets associated with sub-bituminous coal ash in lab-scale (lower velocities) cylindrical probe deposition measurements [30,31], the reasonableness of this correlation in predicting deposition rates of silica-rich RH ash has been demonstrated by us previously [5,6,7]. Since particle viscosity of this lignite fly ash was within the corresponding range of values encompassed by the bituminous coal ash and RH ash as shown in Figure 3, the reasonableness of Equation (5) in this study was deemed to be valid. Since a similar sticking criterion was not readily available from the literature that is associated with the strongly swirling flows within the cyclone, the particle capture within the slag layer was modified as
μ p , c r i t i c a l = 5 × 10 6 PKE 1.78
Deposition propensities of fly ash may also be estimated based on an equilibrium-based approach that uses fly ash compositions and temperature to estimate the melt fractions and liquidus temperatures of the fly ash [32,33]. However, the potential for using a PKE-critical viscosity criterion for predicting deposition rates encompassing wide variations in fly ash compositions has been demonstrated by us previously and was adopted in this study. However, prediction accuracies when adopting this criterion is contingent upon employing accurate fly ash PSD, resolving the flow accurately near the deposition surface (boundary layer grid) and having a reasonable estimate of the fly ash temperature (since μ p  varies sharply with temperature).
Figure 3. Fly ash particle viscosity variations based on parent fuel ash compositions, calculated based on the model proposed by Senior and Srinivasachar [34] for bituminous coal [6], sub-bituminous coal [7], rice husk [5] and lignite (this study).
Fluids 08 00305 g003
This resulted in ash partitioning characteristics that were in agreement with field observations and boiler operations, as shown in Table 6. In spite of the total air flow rate and air/fuel variations with cyclone load (cf. Table 4), the ash partitioning (% of total ash captured in slag layer) did not vary significantly with load. Therefore, a 50–50% (by mass) partitioning (slag layer:fly ash) of the incoming ash was assumed across all loads to assign the ash flow rate in the deposit probe simulations. However, it is worth mentioning that the B/A ratio (cf. Equation (1)) can have a significant impact on the slag to fly ash partitioning and significantly impact this ratio and the slag composition [35,36].
In Figure 4b, the sticking criterion (Equations (5) and (6)) are represented as a function of particle viscosity ( μ p ) 
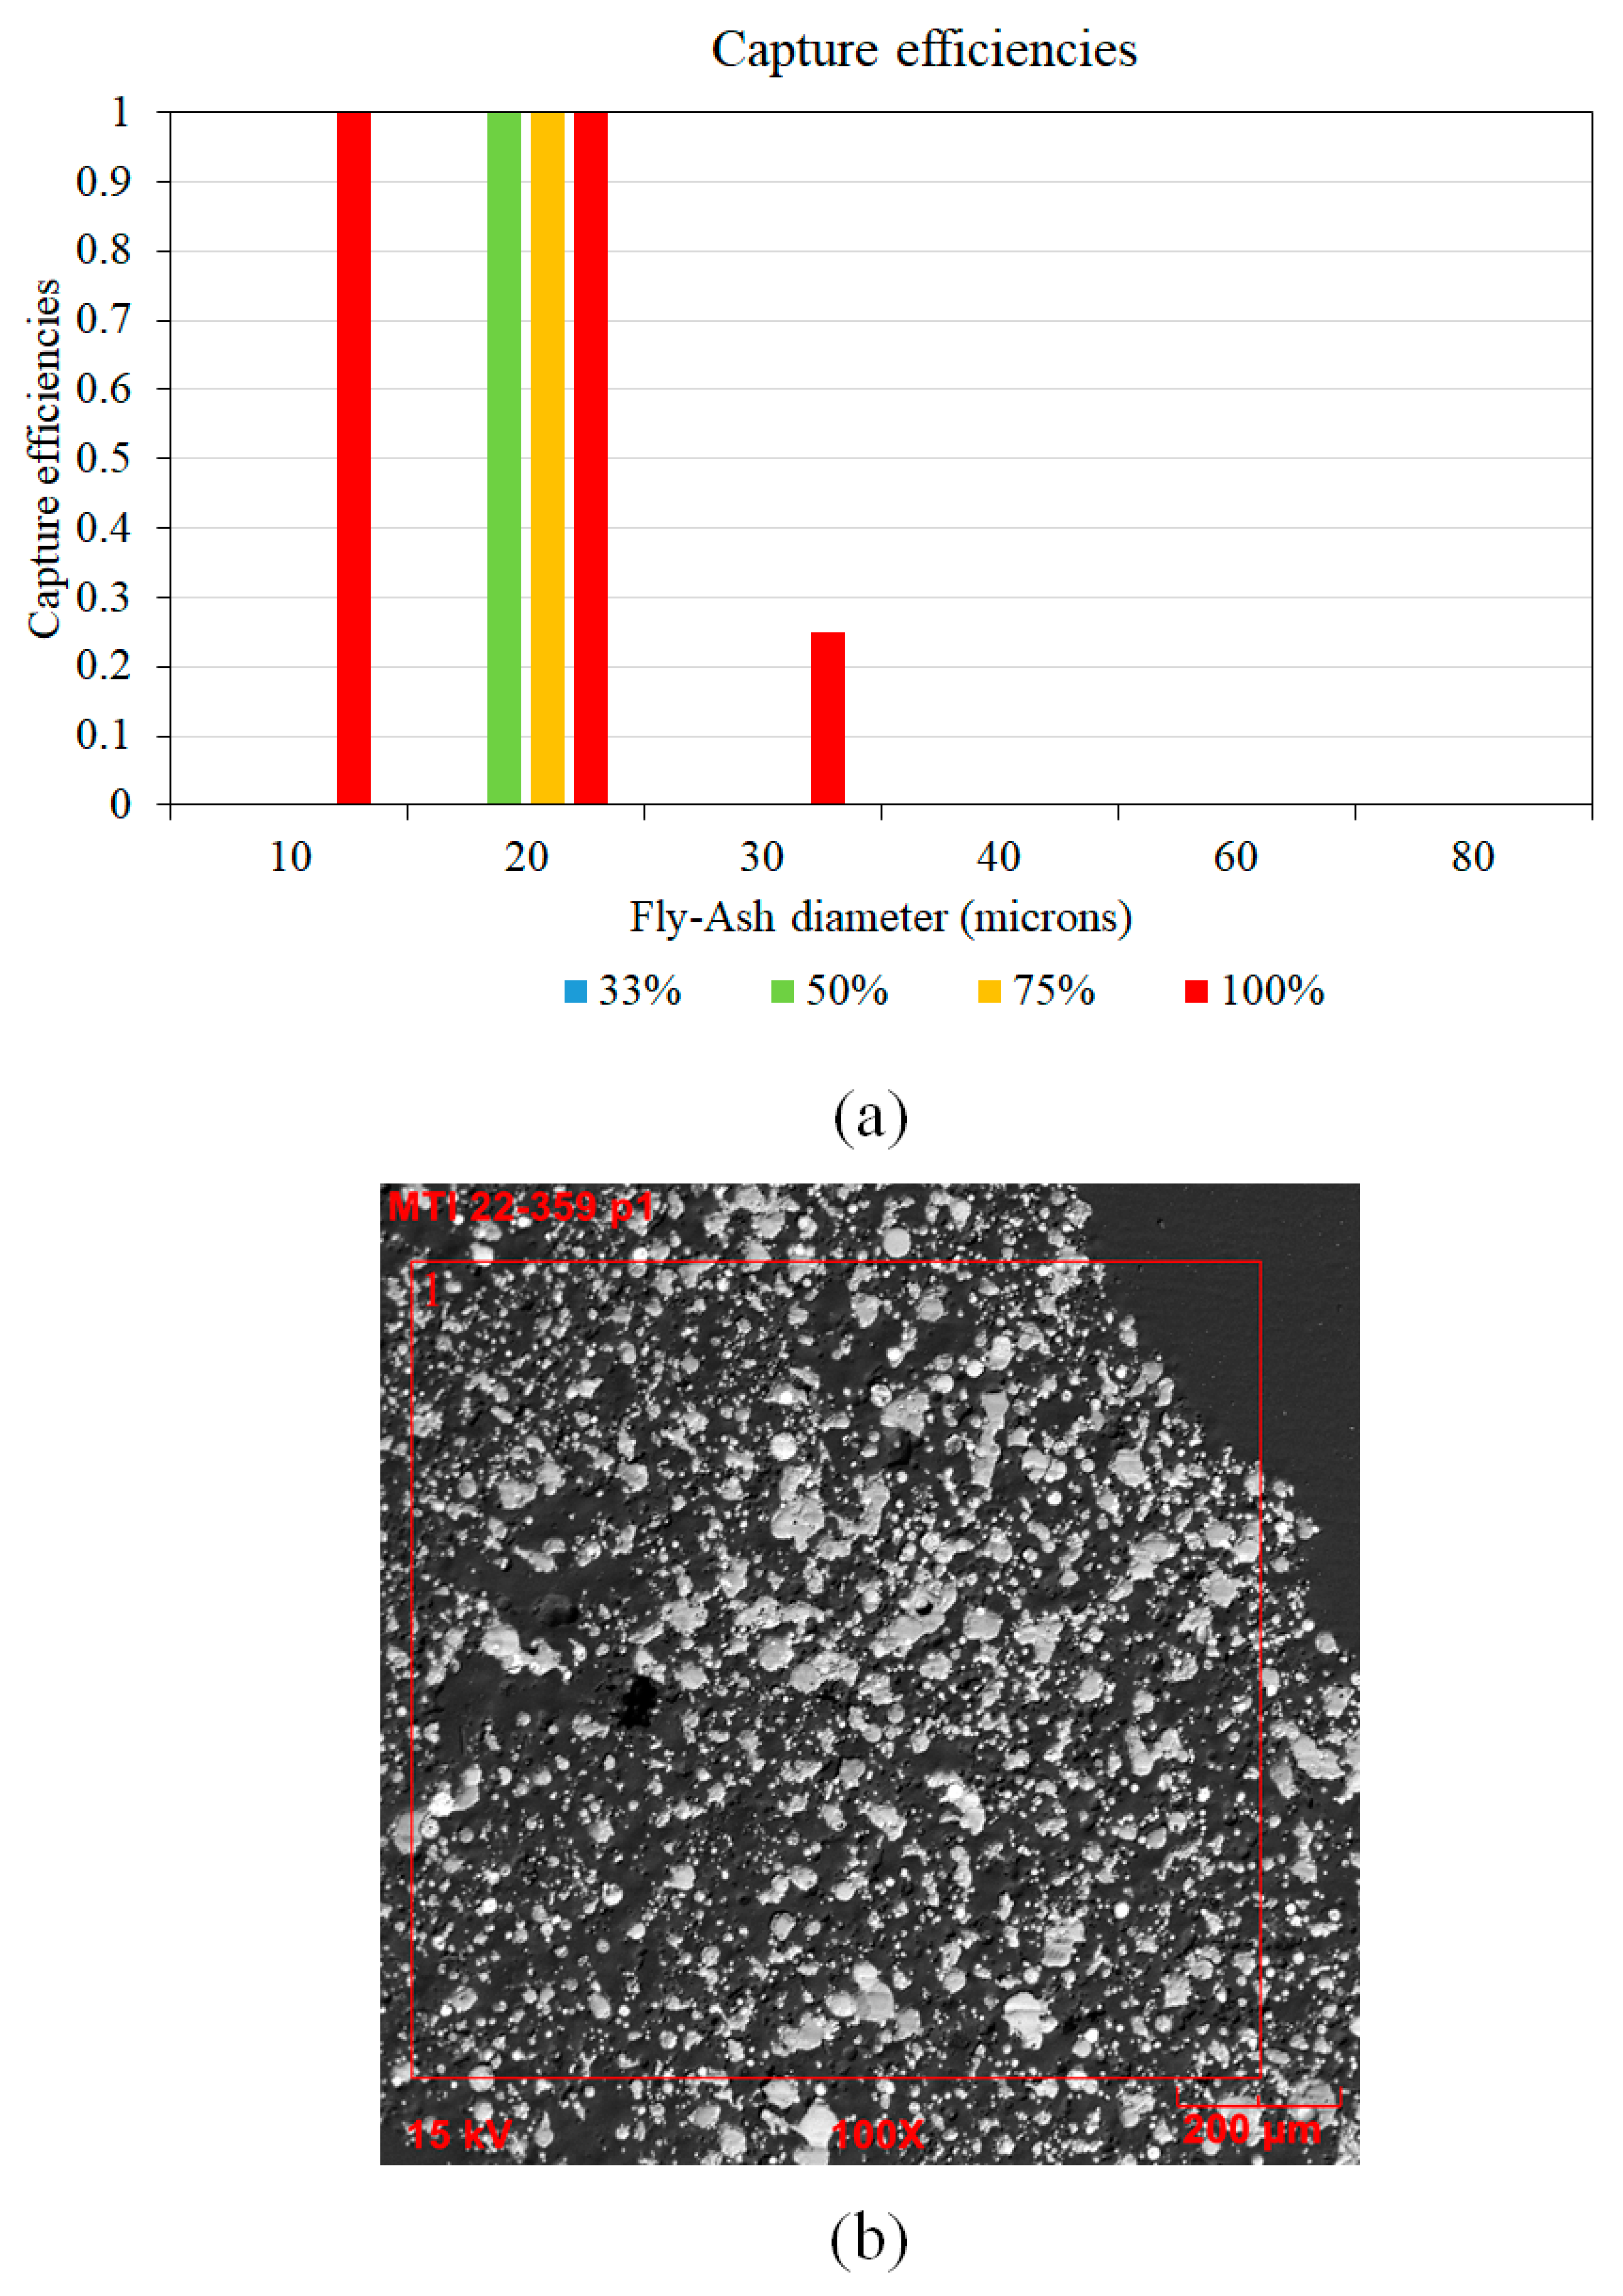
and particle kinetic energy (PKE) as diagonal lines defining the sticking and rebounding conditions. The fly ash PSD exiting the cyclone (Figure 2b) were then sampled and fit to a Rosin–Rammler functional form and then employed as the fly ash PSD in the deposit probe simulations. The reasonableness of this PSD will be shown later via comparisons with cross-sectional images of the deposit. Particle trajectories (colored by particle diameter) shown in Figure 5 indeed confirm that most of the particles exiting the cyclone are less than 40 microns in size.
Two different models were explored in this study to model the compositional and temperature dependencies of the particle viscosity. The particle viscosity in the high-temperature region within the cyclone barrel was computed based on the model proposed by Urbain and summarized in Urbain et al. [37] and Vargas et al. [38]. However, the inaccuracies associated with the Urbain model for viscosity prediction in the low-temperature convective pass regions of boilers were highlighted by Senior and Srinivasachar [34]. Therefore, to compute the slagging rates on the deposition probe (cf. Figure 1c), the particle viscosity was computed based on the relationships proposed by Senior and Srinivasachar [34]. Both models are presented here in a succinct manner. The particle viscosity μP (Pa-s) is a function of particle temperature Tp and two composition-dependent model constants “A” and “B”:
μ = AT p exp ( 1000 B T p )
The model constant “B” is first calculated from the mass fractions of different metal oxide (MxOy) constituents of the ash [34,37]:
B = f ( M x O y )
where the metal oxide (MxOy) compositions of the bulk ash of the parent fuel (coal) were employed to estimate the constant B. The model constant “A” is then estimated from “B” using different functional forms as per Urbain et al. [37]:
A = f ( B )
and Senior and Srinivasachar [34]:
A = f ( B , N B O / T )
where NBO/T is the ratio of non-bridging oxygen atoms (NBO) to the tetrahedral oxygen atoms in the glassy silica network of the ash. NBO/T was determined as a function of metal oxide (MxOy) compositions of the bulk ash of the parent fuel (coal). In the Senior and Srinivasachar [34] model, two sets of constants A and B are computed corresponding to high-temperature and low-temperature data sets employed in their formulation. Correspondingly, two sets of particle viscosity (cf. Equation (4)) are initially computed for each particle when employing this model, and the larger of the two values is assigned to μP. The parent fuel composition was employed to compute the particle viscosities in the high-temperature regions within the cyclone barrel, whereas the deposit ash composition was employed for viscosity determination in the convective pass (cf. Table 2). The difference between the two is shown in Figure 4a, where nearly an order-of-magnitude difference in viscosities is noticeable in the temperature region of interest (1000–1200 K) in this study.

3. Results and Discussion

3.1. Gas Temperature and Velocity Variations with Load

The average gas temperatures across different planes (cf. Figure 1a) within the boiler as a function of load are shown in Figure 6. The solid black line is the average (mean) gas temperatures obtained at the different planes from the numerical simulations. Next, the standard deviations (std. dev) of gas temperatures at the different planes were computed and are represented by two dashed lines at one standard deviation above and below the mean, respectively. The corresponding estimates of the gas temperature from the boiler model are shown as data points. As anticipated, gas temperatures across a plane are higher at higher loads. The gas temperatures decrease when moving from the nose gas to the reheater (RH) outlet due to heat extraction from the heat exchanger tubes. The decrease (slope) in gas temperature from CFD in the plane across the different sections is in general agreement with the slopes obtained by the boiler model across all four loads. This helps ensure that the heat transfer coefficients employed as thermal boundary conditions on the heat exchanger tubes in our simulations were adequate. Finally, a reasonable agreement between the CFD predictions and boiler model estimates are obtained at the plane SSH-OUT, where the ash deposition measurements were carried out. In Figure 6, the standard deviation in temperature decreases as the gas travels from the nose gas plane and travels through the heat exchange zones. These variations are in line with similar observations in simulations of other boiler units [10]. The closely spaced heat exchanger surfaces (cf. Figure 1a) act as flow straighteners and likely mitigate any turbulence-associated non-homogeneities in the velocity and temperature fields. In order to assess if there were any blatantly observable flow maldistributions as a function of load (due to selective turning off of the cyclone barrels), contours of the temperature and velocity distributions at the nose gas section and the entrance to the secondary superheater are shown in Figure 7 and Figure 8, respectively. With warmer colors representing higher magnitudes, a clear reduction in temperature and velocity magnitudes with load is observable. Data across each plane shown in Figure 1a were extracted, and the coefficient of variation (standard deviation/mean) of gas temperatures and velocities were computed and reported in Table 7 and Table 8, respectively. Coefficient of variation (COV) is a measure of the variability from the mean value, with a higher coefficient of variation indicating a potential maldistribution and a COV of zero associated with a fully homogeneous field. Table 7 shows an increase in temperature variations at the nose gas and SSH in planes at 50% and 33% loads. However, these values recover as they pass through the convective pass and reach similar values at the RH out plane. However, no such variation with load is noted in Table 8 for velocities. The COV at the “RH out” plane is higher since this is right after a sharp turn associated with the flow field (cf. Figure 1a).
Residence time particle track figures were created in ANSYS Fluent to gain a better understanding of particle flow behavior in the boiler. This is shown in Figure 9, where particles with a diameter of 25 microns were tracked from the cyclone to the economizer outlet. A total of 25 microns was roughly the average particle diameter used for the probe simulations (cf. Figure 2b). The particle residence time increases with a reduction in load due to lower gas velocities (Figure 8). Based on the temperature predictions shown in Figure 6 and Figure 7, ash deposition rate calculations across a range of temperature were explored at different loads, as reported in Table 9. The temperature range was specifically selected to encompass modeling uncertainties and boiler cleanliness levels (which can significantly impact the heat absorption and result in gas temperatures that are 50–75 K higher when the walls are dirty [10,11]). The corresponding velocities, gas properties and ash flow rates employed in the ash simulations are reported in Table 10, based on the flow field predictions shown in Figure 8.

3.2. Ash Deposition Prediction Variations with Load

Before computing the deposition rates and capture process, it is first important to ascertain that the boundary layer grid around the deposit probe (cf. Figure 1c) is of an adequate resolution to model particle impaction accurately. Impaction efficiencies (ηimpaction) are a function of Stk (cf. Equation (2)), and various correlations have been proposed (via measurements and well-resolved simulations) to model this variation. One such variation represented by Equation (3) is shown as a bold line in Figure 10. As noted, a sharp variation in ηimpaction is observed for Stk between 0.1 and 10. Based on the flow parameters reported in Table 10, fly ash particles having diameters between 10 and 80 μm (across all loads) are anticipated to be at Stk between 0.1 and 10. Since this diameter range encompasses approximately 75% (by mass) of the fly ash employed in the deposit probe simulations (Cf. Figure 2b), ηimpaction were assessed at different Stk by employing monodisperse particles in the size range 10–100 μm, varying the gas velocities between 5 and 17 m/s. Figure 10 shows the results from the simulations indicating that the probe is adequately resolved to capture the impaction rates. Next, for the flow parameters shown in Table 10 and the fly ash PSD shown in Figure 2b, the capture criterion (cf. Equation (5)), the deposition rates at each load were predicted at the maximum and minimum temperatures reported in Table 9 and as shown in Figure 11. While this temperature range captures the deposition rate at full load conditions reasonably well, a sharp variation in deposition rate is observed at lower loads. Lowering the temperature even further continue to result in negligible deposition rates at 33%, 50% and 75% load conditions. These results show that lower FEGT and its associated lower ash fusion temperatures are important variables influencing the deposition process at different loads [39]. The ash softening temperature for this coal is in the range 1500–1600 K, and since a good rule of thumb to mitigate slagging is to have a nose gas temperature that is 300–350 K lower than the ash softening temperature, we notice that this condition is being accomplished at low load conditions (cf. Figure 6b). In order to further ascertain the validity of our capture criterion, the predicted PSD of the deposit ash was determined from the simulations and is reported in Figure 12. Figure 12a shows that across all loads, the capture criterion (cf. Equation (5)) predicts that only particles in the 10–30-micron diameter range are likely to be captured. A cross-sectional image of the deposit, showing deposits of different sizes shown in Figure 12b, indeed confirms this, showing several particles within this size range with a few larger particles likely resulting from sintering. These results are also in agreement with the results of Yang et al. [40], who showed that the highest deposition efficiencies were associated with fly ash particles in the size range 20–30 μm at velocities encountered in a full-scale boiler (~20 m/s). While this study highlights FEGT control as a relatively inexpensive approach in terms of capital to control slagging under load-following operations, we will investigate the effects of fuel blending operations (widely varying Na content) on the deposition rate and strength while maintaining identical FEGT (load) during the next phase of this study.

4. Conclusions

A significant number of coal-fired power plants are required to decrease the operating load as a result of intermittent power availability from wind or solar sources. Low load conditions introduce a number of operational challenges, such as decreased efficiency, velocity and temperature maldistributions, degradation of system components due to cycling and a potential increase in ash deposition rates. The overall goal of this study was to improve our understanding of fireside ash deposition in a 450 MW cyclone-fired lignite boiler as the operational load varied from 33 to 100%, thereby allowing for more efficient operations under these conditions. To accomplish this goal, measurements of ash deposition rates were made between the secondary superheater and reheater sections of the boiler. Next, an ash deposition model was developed, refined and used in conjunction with computational fluid dynamic simulations (CFD) in an attempt to match the field test measurements as well as to ascertain the causative mechanisms behind the observed variations with load. The deposition rate measurements were taken between the secondary superheater and reheater sections of the boiler. The following conclusions can be drawn from this study:
  • Operational data from the power plant was used to carry out computational fluid dynamic (CFD) simulations of combustion within the boiler. Adequate agreement was obtained between the CFD-predicted gas temperatures and corresponding estimates obtained from the power plant’s in-house boiler model across different sections of the boiler as well as at different loads. This established the adequacy of various combustion models (turbulence, kinetics), radiative transfer models and thermal boundary conditions along the heat exchanger surfaces employed in the simulation.
  • Since the boiler operates at low loads (<50% of its rated capacity) by judiciously turning off some of its 12 cyclones, coefficients of variation associated with temperature and velocity across different sections in the boiler were computed from the CFD simulations across different loads. No significant maldistribution was noted, confirming that the current cyclone/boiler operational protocol being followed at the power plant was adequate.
  • Decoupled simulations of the ash impaction and deposition process on the probe were carried out using a finely resolved boundary layer mesh in conjunction with a critical viscosity (μP)- and particle kinetic energy (PKE)-based capture criterion. The adequacy of the boundary layer mesh size was established by demonstrating that the predicted impaction efficiencies (ηimpaction) across the range of particle Stokes numbers (Stk) expected to prevail in these scenarios (0.1 < Stk < 20) were in reasonable agreement with established correlations.
  • The composition- and temperature-dependent particle viscosity to assess particle capture was computed using measured deposit ash composition and ash viscosity relationships that were deemed to be valid in the low-temperature fouling regime (Senior and Srinivasachar [34]) where the deposition measurements were made.
  • Fly ash particle size distribution (PSD) and its concentration for the decoupled calculations were determined from stand-alone cyclone simulations. Again, a μP–PKE-based capture criterion, where the parent fuel composition in conjunction with an appropriate ash viscosity relationship that was deemed to be valid in the high-temperature slagging regime [29], was used to model the particle capture within the cyclone slag layer. The ash partitioning between the fly ash and slag was found to be ~50:50, in line with previous field observations for this parent fuel ash composition, and it did not vary significantly across different cyclone loads.
  • The predicted fly ash PSD from the outlet of the cyclone simulations were then employed in the deposition probe simulations. The results show that fly ash in the size range 10–30 microns had the highest propensity for capture at the deposit probe. This was indeed confirmed from the cross-sectional images of the deposit that showed several (unsintered) particles in this size range.
  • Employing particle kinetic energy—particle viscosity-based capture criterion in conjunction with appropriate ash compositions and temperature-dependent viscosity models, the simulations were able to qualitatively replicate the measured reduction in deposition rate with decrease in load. However, at lower loads where the gas temperature is between 950 and 1150 K, even a 50 K variation in gas temperature can cause a significant variation in deposition rates. Therefore, for the parent fuel characteristics investigated in this study, gas temperature is likely the most significant variable influencing deposition rate variations with load within this boiler.

Author Contributions

Conceptualization, G.K. and S.B.; Validation, K.V. and S.S.P.; Formal analysis, E.B., K.V., S.S.P. and D.J.S.; Investigation, G.K., E.B. and D.J.S.; Resources, G.K. and S.B.; Data curation, E.B., K.V., S.S.P. and D.J.S.; Writing—original draft, G.K.; Project administration, G.K. and S.B.; Funding acquisition, G.K. and S.B. All authors have read and agreed to the published version of the manuscript.

Funding

This research was funded through the University Coal Research Program being administered by DOE-NETL (Award Number: DE-FE0031741).

Data Availability Statement

All relevant data is contained within the article.

Conflicts of Interest

The authors declare no conflict of interest.

Nomenclature

AUrbain viscosity empirical parameter
Bviscosity models empirical parameter
PKEparticle kinetic energy
ReReynolds number (dimensionless)
Stkparticle Stokes number
ttime (s)
Ttemperature (K)
uvelocity (m/s)
Greek Symbols
μ c r i t i c a l critical sticking viscosity (kg/m−s)
μ p particle viscosity (kg/m−s)
ρ density (kg/m3)
Subscripts
gdenotes gas phase
pdenotes particle

References

  1. Lefton, S.A.; Besuner, P. The cost of cycling coal fired power plants. Coal Power Mag. 2006, 2006, 16–20. [Google Scholar]
  2. Laubscher, R.; Rousseau, P. CFD study of pulverized coal-fired boiler evaporator and radiant superheaters at varying loads. Appl. Therm. Eng. 2019, 160, 114057. [Google Scholar] [CrossRef]
  3. Majdak, M.; Grądziel, S. Influence of Thermal and Flow Conditions on the Thermal Stresses Distribution in the Evaporator Tubes. Energy 2020, 209, 118416. [Google Scholar] [CrossRef]
  4. Shi, Y.; Wang, J.; Liu, Z. On-line monitoring of ash fouling and soot-blowing optimization for convective heat exchanger in coal-fired power plant boiler. Appl. Therm. Eng. 2015, 78, 39–50. [Google Scholar] [CrossRef]
  5. Krishnamoorthy, G. Particle Size Distribution and Its Impacts on Ash Deposition and Radiative Transfer during Oxy-Combustion of Rice Husk–Natural Gas. Methane 2023, 2, 218–240. [Google Scholar] [CrossRef]
  6. Krishnamoorthy, G. Aerodynamic influences on the outer ash deposition rates during oxy-coal combustion. Clean. Chem. Eng. 2022, 3, 100057. [Google Scholar] [CrossRef]
  7. Krishnamoorthy, G.; Nguyen, N.D. Modelling Outer Ash Deposition Rates in Second Generation Atmospheric Pressure Oxy-Fuel Combustion Systems. Combust. Sci. Technol. 2023, 195, 3440–3455. [Google Scholar] [CrossRef]
  8. Tang, C.; Pan, W.; Zhang, J.; Wang, W.; Sun, X. A comprehensive review on efficient utilization methods of High-alkali coals combustion in boilers. Fuel 2022, 316, 123269. [Google Scholar] [CrossRef]
  9. Sun, P.; Wang, C.; Zhang, M.; Cui, L.; Dong, Y. Ash problems and prevention measures in power plants burning high alkali fuel: Brief review and future perspectives. Sci. Total Environ. 2023, 901, 165985. [Google Scholar] [CrossRef] [PubMed]
  10. Chudnovsky, B.; Talanker, A.; Berman, Y.; Saveliev, R.; Perelman, M.; Korytnyi, E.; Davidson, B.; Bar-Ziv, E. Prediction of performance from PRB coal fired in utility boilers with various furnace and firing system arrangements. In Proceedings of the ASME Power Conference, Chicago, IL, USA, 13–15 July 2010; Volume 43505, pp. 27–34. [Google Scholar]
  11. Wang, H.; Zhang, C.; Liu, X. Heat transfer calculation methods in three-dimensional CFD model for pulverized coal-fired boilers. Appl. Therm. Eng. 2020, 166, 114633. [Google Scholar] [CrossRef]
  12. Tufte, P.H.; Gronhovd, G.H.; Sondreal, E.A.; Selle, S.J. Ash Fouling Potentials of Western Subbituminous Coal as Determined in a Pilot Plant Test Furnace (No. CONF-760469-5); Energy Research and Development Administration, Grand Forks Energy Research Center: Grand Forks, ND, USA, 1976. [Google Scholar]
  13. Raask, E. Mineral Impurities in Coal Combustion: Behavior, Problems, and Remedial Measures; Hemisphere Pub. Corp.: London, UK, 1985. [Google Scholar]
  14. Walsh, P.M.; Sarofim, A.F.; Beer, J.M. Fouling of convection heat exchangers by lignitic coal ash. Energy Fuels 1992, 6, 709–715. [Google Scholar] [CrossRef]
  15. Beer, J.M.; Sarofim, A.F. Transformation of Coal Mineral Matter during Pulverized Coal Combustion. Technical Report MIT-EL 92-008, MIT Energy Lab. 1992. Available online: https://dspace.mit.edu/handle/1721.1/27224 (accessed on 1 November 2023).
  16. Benson, S.A.; Jones, M.L.; Harb, J.N. Ash Formation and Deposition. In Fundamentals of Coal Combustion for Clean and Efficient Use; Elsevier: Amsterdam, The Netherlands, 1993; pp. 299–373. [Google Scholar]
  17. Benson, S.A.; Sondreal, E.A. Gasification of Lignites of North America; North Dakota Industrial Commission: Dickinson, ND, USA, 2022.
  18. Bhatt, M.S. Effect of air ingress on the energy performance of coal fired thermal power plants. Energy Convers. Manag. 2007, 48, 2150–2160. [Google Scholar] [CrossRef]
  19. Belošević, S.; Tomanović, I.; Crnomarković, N.; Milićević, A.; Tucaković, D. Numerical study of pulverized coal-fired utility boiler over a wide range of operating conditions for in-furnace SO2/NOx reduction. Appl. Therm. Eng. 2016, 94, 657–669. [Google Scholar] [CrossRef]
  20. Belošević, S.; Sijercic, M.; Crnomarković, N.; Stankovic, B.; Tucakovic, D. Numerical prediction of pulverized coal flame in utility boiler furnaces. Energy Fuels 2009, 23, 5401–5412. [Google Scholar] [CrossRef]
  21. Stopford, P.J. Recent applications of CFD modelling in the power generation and combustion industries. Appl. Math. Modell. 2002, 26, 351–374. [Google Scholar] [CrossRef]
  22. Zhu, T.; Ning, X.; Tang, C.; Wang, L.; Deng, L.; Che, D. Numerical investigation on combustion and NOx formation characteristics under deep-staging conditions within a cyclone barrel. Fuel 2022, 313, 122714. [Google Scholar] [CrossRef]
  23. Wang, W.; Sun, Y.; Huang, Z.; Liao, Y.; Fang, F. Numerical Simulation of NOx Emission Characteristics of a Cyclone Boiler with Slag-Tap Furnace. ACS Omega 2020, 5, 29978–29987. [Google Scholar] [CrossRef]
  24. Weber, R.; Schaffel-Mancini, N.; Mancini, M.; Kupka, T. Fly ash deposition modelling: Requirements for accurate predictions of particle impaction on tubes using RANS-based computational fluid dynamics. Fuel 2013, 108, 586–596. [Google Scholar] [CrossRef]
  25. Israel, R.; Rosner, D.E. Use of a generalized Stokes number to determine the aerodynamic capture efficiency of non-Stokesian particles from a compressible gas flow. Aerosol Sci. Technol. 1982, 2, 45–51. [Google Scholar] [CrossRef]
  26. ANSYS, Inc. ANSYS Fluent Theory Guide. Release 19.1; Online manual resource; ANSYS Inc.: Canonsburg, PA, USA, 2018. [Google Scholar]
  27. Laubscher, R.; Rousseau, P. Numerical investigation on the impact of variable particle radiation properties on the heat transfer in high ash pulverized coal boiler through co-simulation. Energy 2020, 195, 117006. [Google Scholar] [CrossRef]
  28. Nakod, P.; Krishnamoorthy, G.; Sami, M.; Orsino, S. A comparative evaluation of gray and non-gray radiation modeling strategies in oxy-coal combustion simulations. Appl. Therm. Eng. 2013, 54, 422–432. [Google Scholar] [CrossRef]
  29. Kleinhans, U.; Wieland, C.; Frandsen, F.J.; Spliethoff, H. Ash formation and deposition in coal and biomass fired combustion systems: Progress and challenges in the field of ash particle sticking and rebound behavior. Prog. Energy Combust. Sci. 2018, 68, 65–168. [Google Scholar] [CrossRef]
  30. Srinivasachar, S.; Helble, J.J.; Boni, A.A. An experimental study of the inertial deposition of ash under coal combustion conditions. In Proceedings of the Symposium (International) on Combustion, Orléans, France, 22–27 July 1990; Elsevier: Amsterdam, The Netherlands, 1991; Volume 23, pp. 1305–1312. [Google Scholar]
  31. Schulze, K.; Hofmeister, G.; Joeller, M.; Scharler, R.; Obernberger, I.; Korbee, R.; Cieplik, M. Development and evaluation of a flexible model for CFD simulation of ash deposit formation in biomass fired boilers. In Proceedings of the International Conference “Impacts of Fuel Quality on Power Production”, EPRI Report (No. 1014551), Snowbird, UT, USA, 29 October–3 November 2007; pp. 7–95. [Google Scholar]
  32. Fakourian, S.; McAllister, Z.; Fry, A.; Wang, Y.; Li, X.; Wendt, J.O.; Dai, J. Modeling ash deposit growth rates for a wide range of solid fuels in a 100 kW combustor. Fuel Process. Technol. 2021, 217, 106777. [Google Scholar] [CrossRef]
  33. Cai, Y.; Tay, K.; Zheng, Z.; Yang, W.; Wang, H.; Zeng, G.; Li, Z.; Boon, S.K.; Subbaiah, P. Modeling of ash formation and deposition processes in coal and biomass fired boilers: A comprehensive review. Appl. Energy 2018, 230, 1447–1544. [Google Scholar] [CrossRef]
  34. Senior, C.L.; Srinivasachar, S. Viscosity of Ash Particles in Combustion Systems for Prediction of Particle Sticking. Energy Fuels 1995, 9, 277–283. [Google Scholar] [CrossRef]
  35. Hu, X.; Zhang, Z.; Wu, X.; Fan, H.; Li, Z.; Kong, C.; Jiang, Y.; Guo, X. Sodium capture mechanism by simulated silica/aluminosilicate slag at high temperatures. Fuel 2022, 328, 125344. [Google Scholar] [CrossRef]
  36. Hu, S.; Ni, Y.; Yin, Q.; Wang, J.; Lv, L.; Cen, K.; Zhou, H. Research on element migration and ash deposition characteristics of high-alkali coal in horizontal liquid slagging cyclone furnace. Fuel 2022, 308, 121962. [Google Scholar] [CrossRef]
  37. Urbain, G.; Bottinga, Y.; Richet, P. Viscosity of liquid silica, silicates and alumino-silicates. Geochim. Cosmochim. Acta 1982, 46, 1061–1072. [Google Scholar] [CrossRef]
  38. Vargas, S.; Frandsen, F.J.; Dam-Johansen, K. Rheological properties of high-temperature melts of coal ashes and other silicates. Prog. Energy Combust. 2001, 27, 237–429. [Google Scholar] [CrossRef]
  39. Available online: https://www.powermag.com/typical-causes-of-slagging-and-fouling-problems-in-boilers/ (accessed on 5 June 2023).
  40. Yang, X.; Szuhánszki, J.; Tian, Y.; Ingham, D.B.; Ma, L.; Pourkashanian, M. Understanding the effects of oxyfuel combustion and furnace scale on biomass ash deposition. Fuel 2019, 247, 36–46. [Google Scholar] [CrossRef]
Figure 1. (a) 3D geometry of the 450 MW boiler; (b) deposit probe geometry; (c) the mesh employed in the deposition rate simulations.
Fluids 08 00305 g001
Figure 2. The modeled particle size distribution (PSD) of (a) the parent coal (based on measurements) at the cyclone inlet; (b) fly ash (from CFD predictions) at the exit of the cyclone.
Fluids 08 00305 g002
Figure 4. (a) Ash dynamic viscosity (cf. Equation (7)) based on two different models (Urbain et al. [37]; Senior and Srinivasachar [34]); (b) PKE—particle viscosity-based captured criterion employed within the cyclone barrel and on the deposit probe with lines demarcating particle capture/bounce off.
Fluids 08 00305 g004
Figure 5. Particle tracks within the cyclone barrel (with associated capture), colored by particle diameter in [m] at various loads: (a) 50%, (b) 75% and (c) 100%.
Fluids 08 00305 g005
Figure 6. Average gas temperatures across different planes within the boiler as a function of load: (a) 33%, (b) 50%, (c) 75% and (d) 100%.
Fluids 08 00305 g006
Figure 7. Contours of gas temperature (in K) across the nose gas plane and the inlet to the SSH plane at different loads.
Fluids 08 00305 g007
Figure 8. Contours of velocity (m/s) across the nose gas plane and the inlet to the SSH plane at different loads.
Fluids 08 00305 g008
Figure 9. Particle tracks colored by residence time (in seconds) of 25-micron fly ash particles at different loads.
Fluids 08 00305 g009
Figure 10. Variation in impaction efficiencies with Stokes number in the deposition rate simulations.
Fluids 08 00305 g010
Figure 11. Average deposit flux (g/m2-h) variation with boiler load. The minimum and maximum temperatures correspond to the values reported in Table 9.
Fluids 08 00305 g011
Figure 12. (a) Normalized capture efficiencies as a function of diameter at different loads; (b) a cross-sectional image of the deposit, showing deposits of different sizes.
Fluids 08 00305 g012
Table 1. Proximate and ultimate analysis (as fired) of the fuel investigated in this study.
Proximate Analysis (wt.%)Ultimate Analysis (wt.%, Dry Ash Free)
Fixed carbon26.47C75.66
Volatiles28.75H5.11
Ash 10.31N1.23
Moisture34.47O18.00
HHV (MJ/kg) 15.83
Table 2. Parent fuel and deposit ash composition (weight %, including SO3).
CompoundParent FuelDeposit Ash
Na2O5.41.0
MgO3.51.2
Al2O313.014.7
SiO238.848.5
P2O50.10.6
SO315.01.4
Cl0.00.3
K2O1.70.5
CaO11.623.3
TiO20.50.1
Cr2O30.00.5
Fe2O38.66.8
BaO0.80.0
Table 3. Key flow rates to the boiler at different loads.
LoadCoal (kg/s)Primary Air (kg/s)Secondary Air (kg/s)Tertiary Air (kg/s)OFA *
(kg/s)
100%7855.23007.675
75%6555.22767.670
50%4535.5175.57.645
33%2620.8100.87.626
* Over-fire air.
Table 4. Key flow rates to the cyclone barrel at different loads.
Cyclone Load50%75%100%
Total air flow rate per cyclone (primary + secondary + tertiary), kg/s18.5328.3330.23
Coal flow rate, kg/s3.85.76.6
Fuel–air equivalence ratio [Φ]1.091.071.16
Table 5. A complete summary of the various modeling options utilized in this study.
Physics Being ModeledModeling Option
Particle devolatilization (heterogeneous)Constant rate (50, 1/s)
Char oxidation (heterogeneous)Kinetic/Diffusion limited
Volatile combustion (homogeneous) to form products: CO, H2O, N2, SO2Finite rate/Eddy dissipation
CO oxidation to form CO2 (homogeneous)Finite rate/Eddy dissipation
TurbulenceRealizable k-epsilon [full boiler simulations], Reynolds stress model [cyclone barrel simulations], SST K-Omega [simulations of deposition on probe]
Particle drag lawMorsi–Alexander
Model describing radiative transportDiscrete ordinates
Particle radiative propertyVariable Kabs and Kscat [28] *
Gas-phase radiative propertyPerry (5gg) [28] *
Slag, fly ash deposit modelingParticle kinetic energy—critical viscosity criterion [29] *
* These models were implemented as user-defined functions (UDFs) in ANSYS FLUENT.
Table 6. Ash partitioning (mass %) and PKE (J) of the captured particles within the cyclone barrel at different loads.
Cyclone Load50%75%100%
% Total ash captured in slag layer524650
% Captured particles with PKE < 1 × 10⁻⁶ J211917
% Captured particles with PKE > 1 × 10⁻⁴ J243235
% 1 × 10⁻⁶ J < PKE < 1 × 10⁻⁴ J554948
Table 7. Coefficient of variation (gas temperature) at different planes.
Load100%75%50%33%
Nose gas plane5.83 × 10−25.20 × 10−26.15 × 10−27.08 × 10⁻²
SSH in4.73 × 10−24.61 × 10−25.77 × 10−26.47 × 10⁻²
SSH out4.58 × 10−24.36 × 10−24.41 × 10−24.68 × 10⁻²
RH out3.43 × 10−23.63 × 10−23.55 × 10−23.22 × 10⁻²
Table 8. Coefficient of variation (velocity) at different planes.
Load100%75%50%33%
Nose gas plane0.470.390.360.43
SSH in0.340.260.330.43
SSH out0.270.260.230.34
RH out0.610.600.630.66
Table 9. Range of gas temperatures at SSH outlet employed in the ash deposition simulations.
Boiler Load %Minimum T
(K)
Maximum T
(K)
339501000
5010001050
7511001150
10011501200
Table 10. Range of parameters employed in the deposition rate simulations.
Load Scenario33%50%75%100%
Ash density2500250025002500
Ash velocity (m/s)59.51517
Gas viscosity (kg/m−s)4.6 × 10−54.6 × 10−54.6 × 10−54.6 × 10−5
Probe diameter (m)0.050.050.050.05
Gas density (kg/m3)0.370.330.280.28
Total boiler ash flow (kg/s)2.684.646.708.00
Actual cross-sectional area of the deposit plane in the boiler (m2)172172172172
Inlet area employed in the deposition simulation (m2)3.4 × 10−33.4 × 10−33.4 × 10−33.4 × 10−3
Ash flow rate (kg/s) in the deposition simulation based on 50–50% ash partitioning2.5 × 10−54.3 × 10−56.3 × 10−57.5 × 10⁻⁵
Disclaimer/Publisher’s Note: The statements, opinions and data contained in all publications are solely those of the individual author(s) and contributor(s) and not of MDPI and/or the editor(s). MDPI and/or the editor(s) disclaim responsibility for any injury to people or property resulting from any ideas, methods, instructions or products referred to in the content.

