Article

The Use of Uncertainty Quantification and Numerical Optimization to Support the Design and Operation Management of Air-Staging Gas Recirculation Strategies in Glass Furnaces

Dipartimento di Ingegneria Meccanica, Energetica, Gestionale e dei Trasporti (DIME), Università degli Studi di Genova, Via Montallegro 1, 16145 Genoa, Italy
*
Author to whom correspondence should be addressed.
Fluids 2023, 8(2), 76; https://doi.org/10.3390/fluids8020076
Submission received: 3 January 2023 / Revised: 13 February 2023 / Accepted: 15 February 2023 / Published: 18 February 2023

Abstract

:
The reduction in energy consumption and the increasingly demanding emissions regulations have become strategic challenges for every industrial sector. In this context, the glass industry would be one of the most affected sectors due to its high energy demand and emissions productions, especially in terms of NOx. For this reason, various emission abatement systems have been developed in this field and one of the most used is the air staging system. It consists in injecting air into the upper part of the regenerative chamber on the exhaust gases side in order to create the conditions for combustion that reduces NOx emissions. In this work, the combined use of CFD with data analysis techniques offers a tool for the design and management of a hybrid air staging system. Surrogate models of the bypass mass flow rate and uniformity index in the regenerative chamber have been obtained starting from DoE based on different simulations by varying the air mass flow rate of the two injectors located in a bypass duct that connects the two regenerative chambers. This model allows a UQ analysis to verify how the uncertainty of the air injectors can affect the bypass mass flow rate. Finally, an optimization procedure has identified the optimal condition for the best bypass mass flow rates and uniformity of the oxygen concentration in the chamber. High values of the mass flow rate of the pros injector and medium-low values for the cons injectors are identified as operating parameters for best conditions.

1. Introduction

A glass production plant is very energy-demanding, reaching temperatures over 2000 [K] in order to melt the raw material and obtain a high-quality glass [1]. In Italy, the glass industry energy demand is about 5% of the total industrial consumption (1.33 Mtoe) without the addition of all the related activities (transport, packaging, etc.); its environmental impact is, therefore, significant (greenhouse effect, etc.). In the first decade of the 2000s, it has been estimated that this sector in the EU25 required a 7.8 GJ average per year and has produced 0.57 tons of CO2 per ton of saleable product [2]. International climate agreements, such as the recent COP26, have imposed strict regulations for energy consumption reduction, but above all for the related pollutant emissions [3,4]. In this context, the glass industry sector also requires the development of specific strategies to reduce its environmental impact. Preheating the combustion air through regenerative chambers is the main strategy. They are built upon a series of refractory bricks, that are used to store heat when hot gases from combustion flow; this process has reached 70% of thermal efficiency and it allows a recovery of about 1500 kJ per kg of glass [5,6,7,8]. The University of Genova, partner in the EU Funded PRIMEGLASS Life project, has contributed to developing numerical models for the regenerative chambers design [9]. Another strategy to further exploit the residual heat of the exhausted gases is to preheat the glass raw material. In fact, the gases still have a temperature of the order of 500 [°C] that would otherwise be wasted. Several industrial sectors, like steel or cement production, have raw material preheating systems [10] and a specific research activity has been performed to test the strategy for glass raw material [11].
New European rules have imposed strict regulations on NOx emissions in many industrial fields, including glass production [12]. The formation mechanisms of this thermal pollutant are well described by the Zeldovich theories and its extensions [13,14,15] when high-temperature reactions are involved. However, the maximum temperature reduction in the combustion process is not sufficient to decrease the NOx production; local air-fuel distribution (oxygen concentration), the nitrogen presence and the residence time of the chemical species at high-temperatures are additional aspects to be considered. Long-term studies in different engineering areas (internal combustion engines and power generation plants) have already demonstrated methods to reduce chemical emissions: primary and secondary [16]. The primary methods modify the design parameters of the combustion process, such as the exhaust gas recirculation (EGR) and staged combustion. The secondary methods consist of post-treatment of the combustion gases with chemical treatment, such as the urea injection, to reduce the NOx emissions. Within the framework of the Life PRIMEGLASS projects, two primary methods have been studied: the Waste Gas Recirculation system (WGR) and hybrid air staging [17,18]; both are applied to regenerative glass production plants. The WGR system is based on recirculation of a portion of exhaust gas taken from the regenerative chamber during the hot phase and injected into the lower part of the regenerative chamber on the air side, through a forced fan system. The portion of recirculated gas allows partial diluting of the air concentration in order to reduce the NOx formation. This system has been studied by several authors mainly in automotive applications [19,20,21] and the specific strategy for glass furnaces has been developed [22,23,24].
The air staging (AS) consists in injecting air into the upper part of the regenerative chamber on the fumes side in order to reduce the NOx. The combustion is set with a low value of oxygen to lower the NOx formation, but a high content of CO is obtained as a result. The combustion is completed in a secondary phase outside the combustion chamber and inside the top chamber at a lower temperature using the air staging system. Mainly three different air staging types exist: cold air staging (where the cold air at ambient temperature is injected in the chamber), the hot air staging (where the hot air flows naturally through a U-shaped duct from the adjacent chamber) and the hybrid air staging (that combines the two methods). Numerous authors in several industrial sectors have studied the air staging technique. For example, investigations on air staging and fuel staging have been carried out with an electrically heated tube reactor [25]. Experiments with a newly designed controlled multiple air staging technology in grate firings have shown a considerable reduction in NOx emissions [26]. Experiments were carried out on an electrically heated multi-path air inlet one-dimensional furnace to assess NOx emission characteristics of an overall air-staged (also termed air staging along furnace height) combustion of bituminous coal [27]. Recent studies have shown the success of the air staging also to reduce the emissions from the combustion of problematic fuels in small scale combustion systems [28]. Biedermann revised the data on air staging based on experiments with nine automated boiler technologies and concluded that significant reductions in both NOx and particulate emissions are possible if low primary air ratios are used [29]. Different biomass fuels have been burnt in a small-scale biomass boiler to investigate the effect of air staging on emissions [30]. Numerical approaches have been published to model the system with a 600 MWe tangentially fired pulverized-coal boiler configured with the deep-air-staging combustion technology [31]. A numerical model has been proposed to demonstrate that the emissions at the outlet of the combustion chamber are greatly reduced if the deep air staged combustion with the burner stoichiometric ratio of 0.75 is adopted [32]. A CFD simulation method has been proposed to identify the optimal geometric parameters related to air staging in a wood pellet boiler [33].
CFD simulations combined with the use of data analysis techniques can be a useful tool to improve the understanding of flow structures in industrial components, to identify design features, to optimize their performance and to support the operation management. In the latter use the numerical tools became part of the Artificial Intelligence field. Different approaches can be developed using surrogate models based on response surface methodologies for the above purposes [34]. In this paper, CFD simulations have been used to study the hybrid air staging system in the regenerative chambers of glass production plants in order to reduce the NOx emissions. First, the flow structure in this system is shown for a baseline case. Then, a simulation dataset (DOE) has been built by varying design parameters like air mass flow rate from the pros and cons injectors. Starting from the DOE, surrogate models have been obtained to build system response surfaces in a given operating range. A sensitivity analysis on the uncertainty that stems from injectors mass flow rate has been also performed. Finally, an optimization process has supported the optimal configuration for the system operating condition.

2. Layout of the Glass Production Plant with Regenerative Chamber and the Hybrid Air Staging

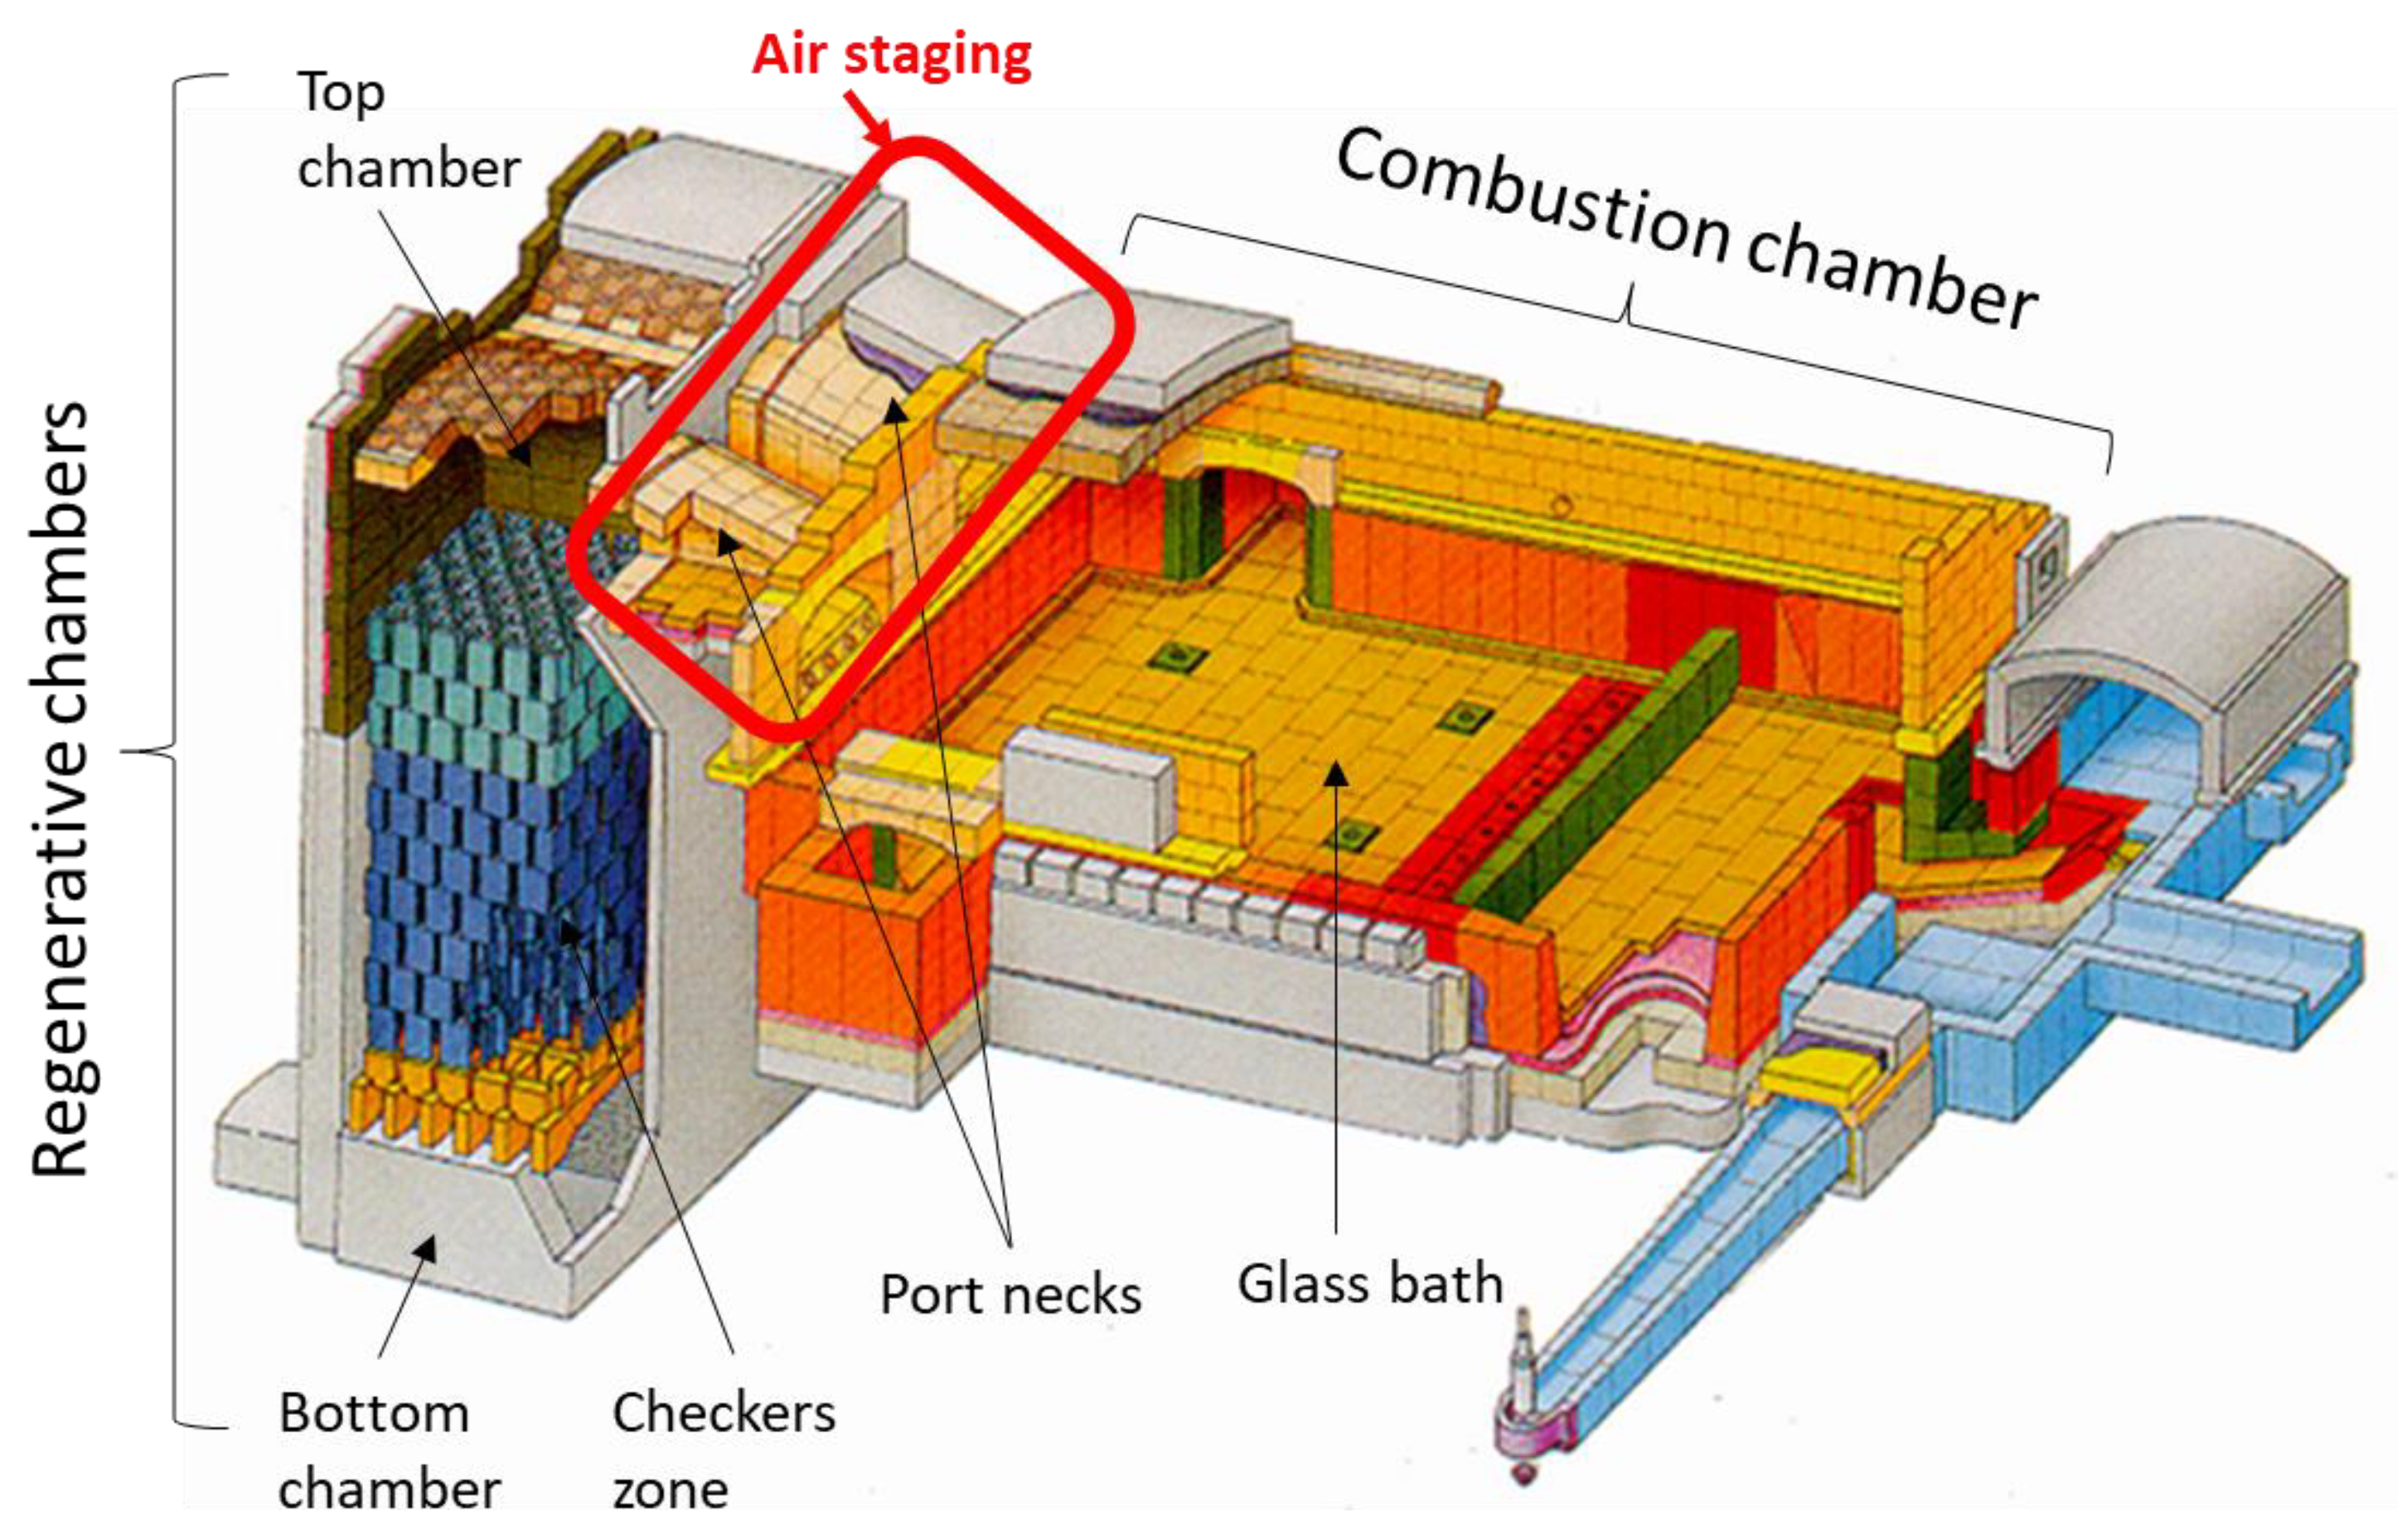
The glass furnace considered for this research is the regenerative End-Port, which is composed essentially from a combustion chamber and two regenerative chambers to recover the heat from the exhaust gases. A typical plant layout is in Figure 1. The combustion chamber, made of refractory material, allows the raw material to be melted by the combustion processes fueled by natural gas; in fact, the glass bath must reach temperature between 1700–1800 [K] and the exhaust gases generally have a high energy content (temperature between 1400–1500 [K]). The two regenerative chambers (a Martin-Siemens original idea) alternately feed with air (cold phase) or exhaust gases (hot phase) with twenty minutes cycles. The regenerative chambers, that can exceed ten meters height, consist of three main areas: bottom chamber, checkers zone and top chamber. The checker’s zone is filled with material bricks assembled in a modular way with different shapes in order to absorb the heat of the waste gas during the hot phase and release it to the incoming air during the cold phase. The top of the regenerative chambers conveys the pre-heated air for the combustion and the exhaust gas through the Port necks.
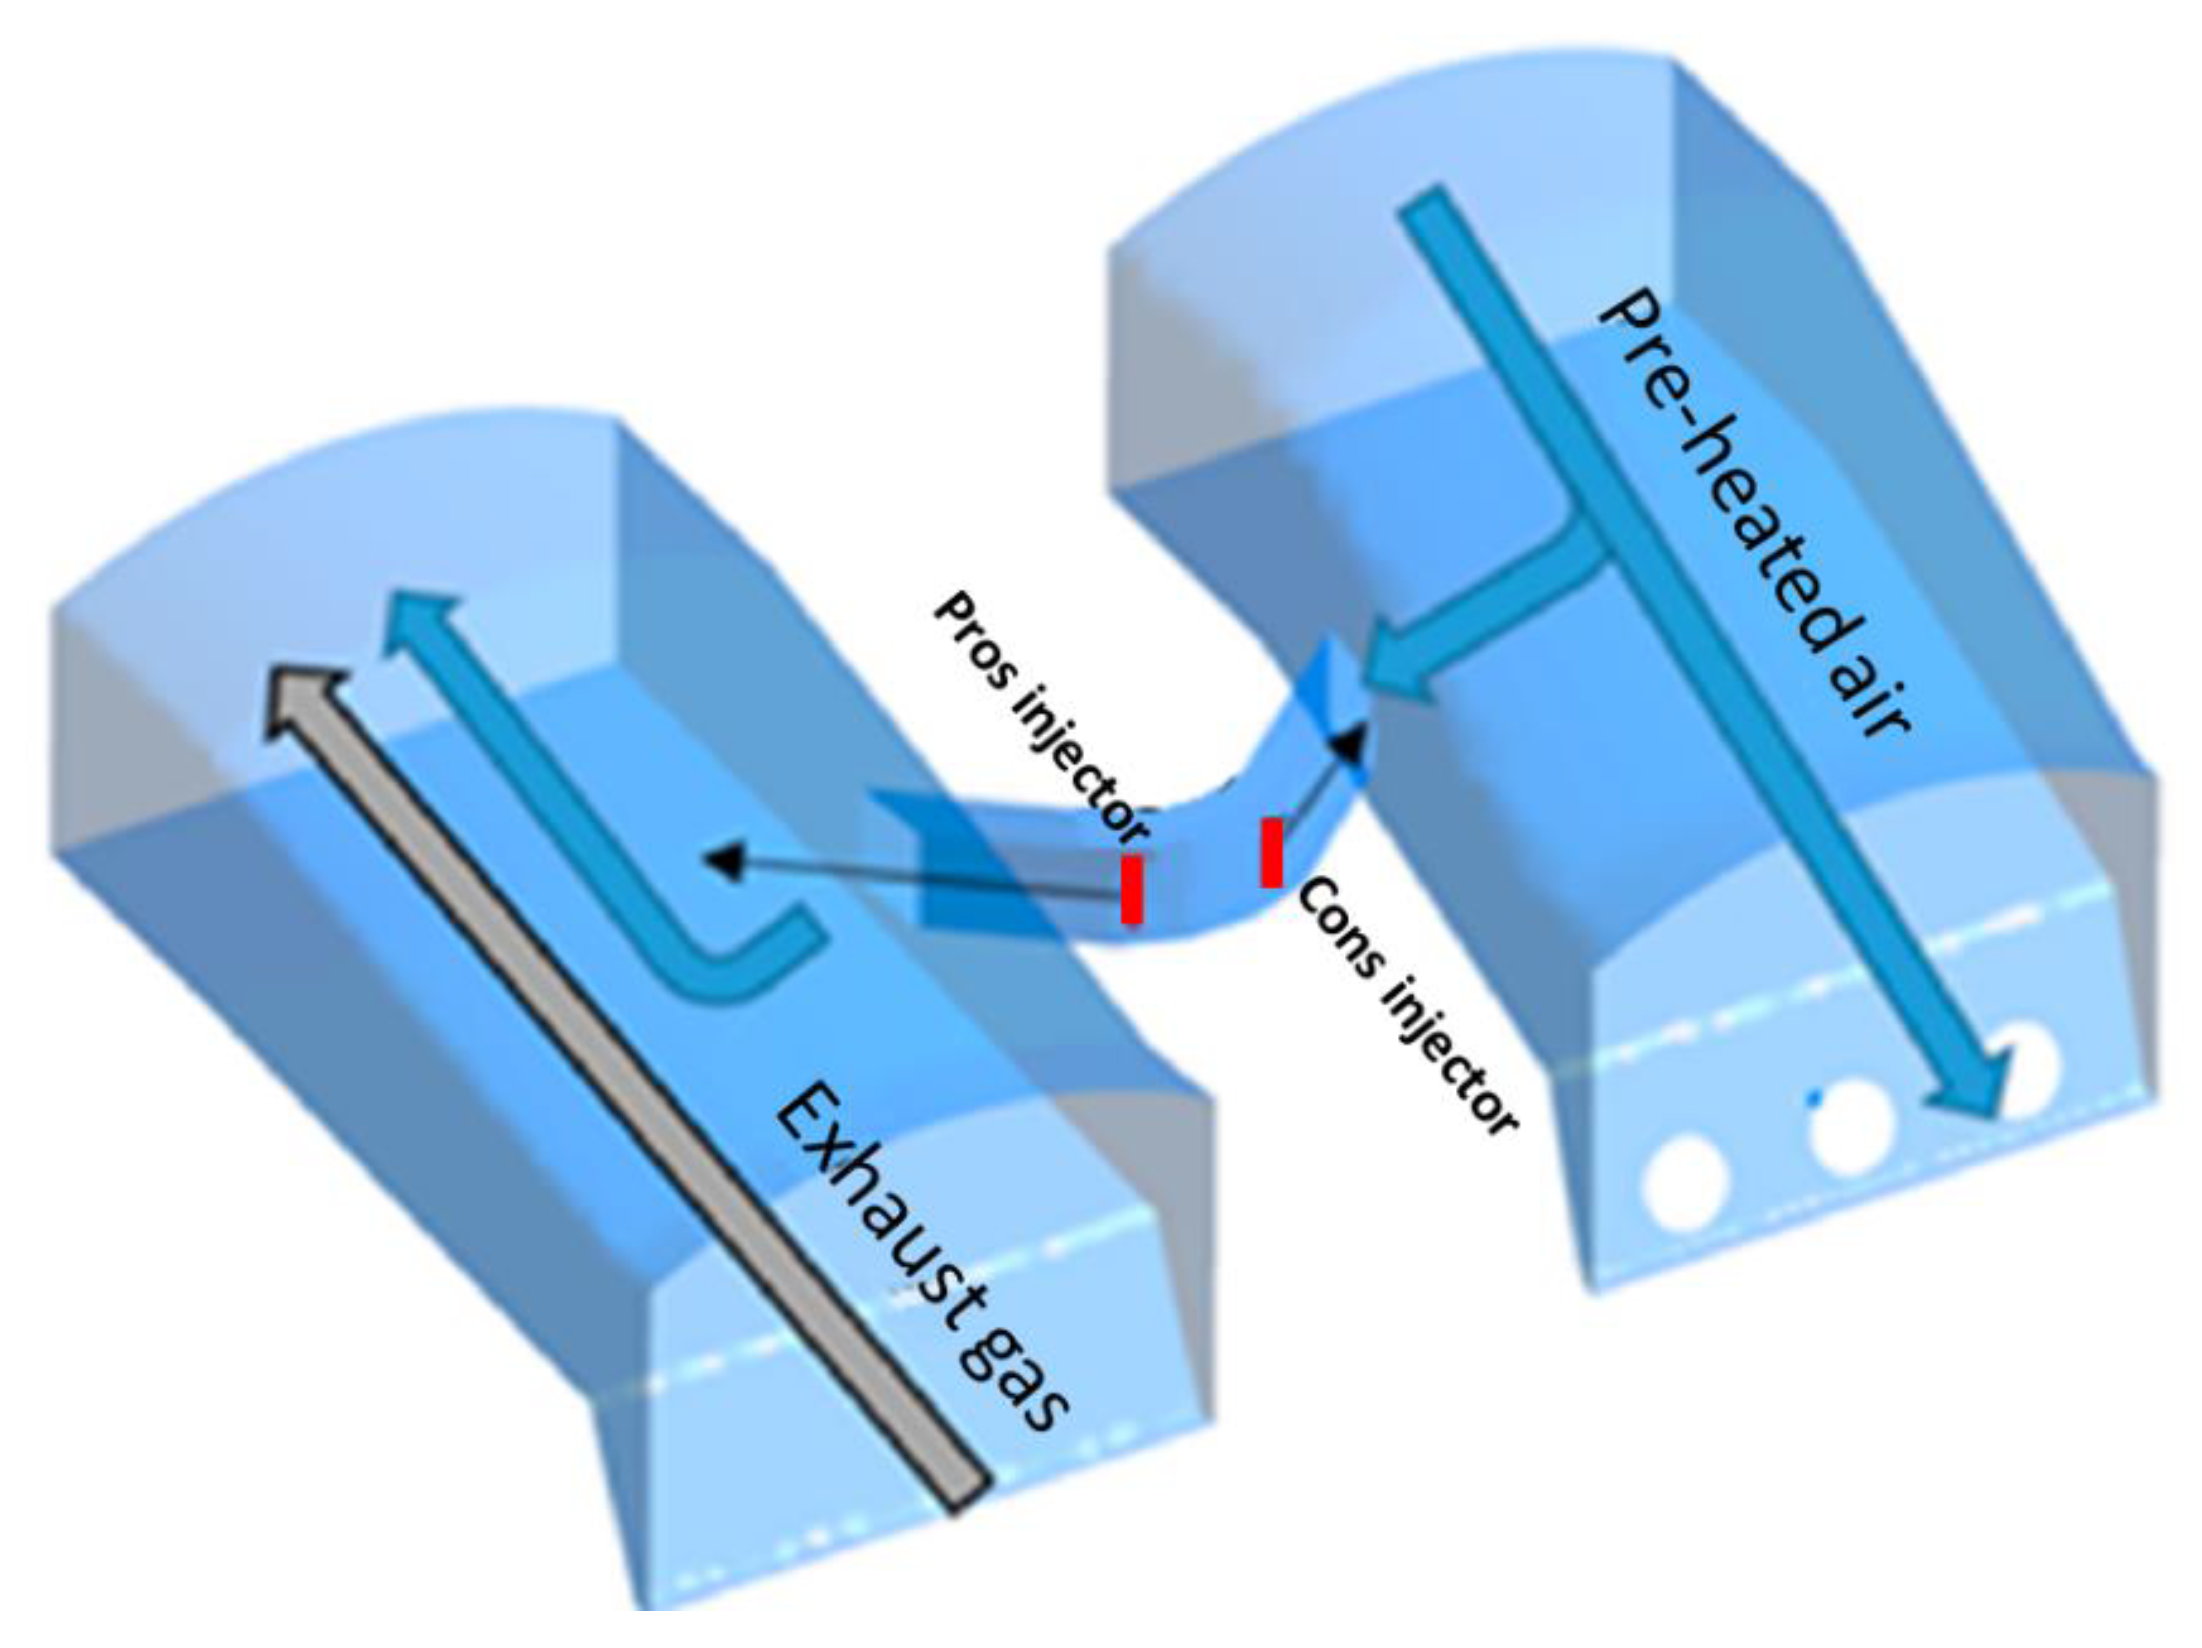
The hybrid air staging system (whose position in the plant is shown in Figure 1 by the red rectangle, while its operating scheme is explained in 
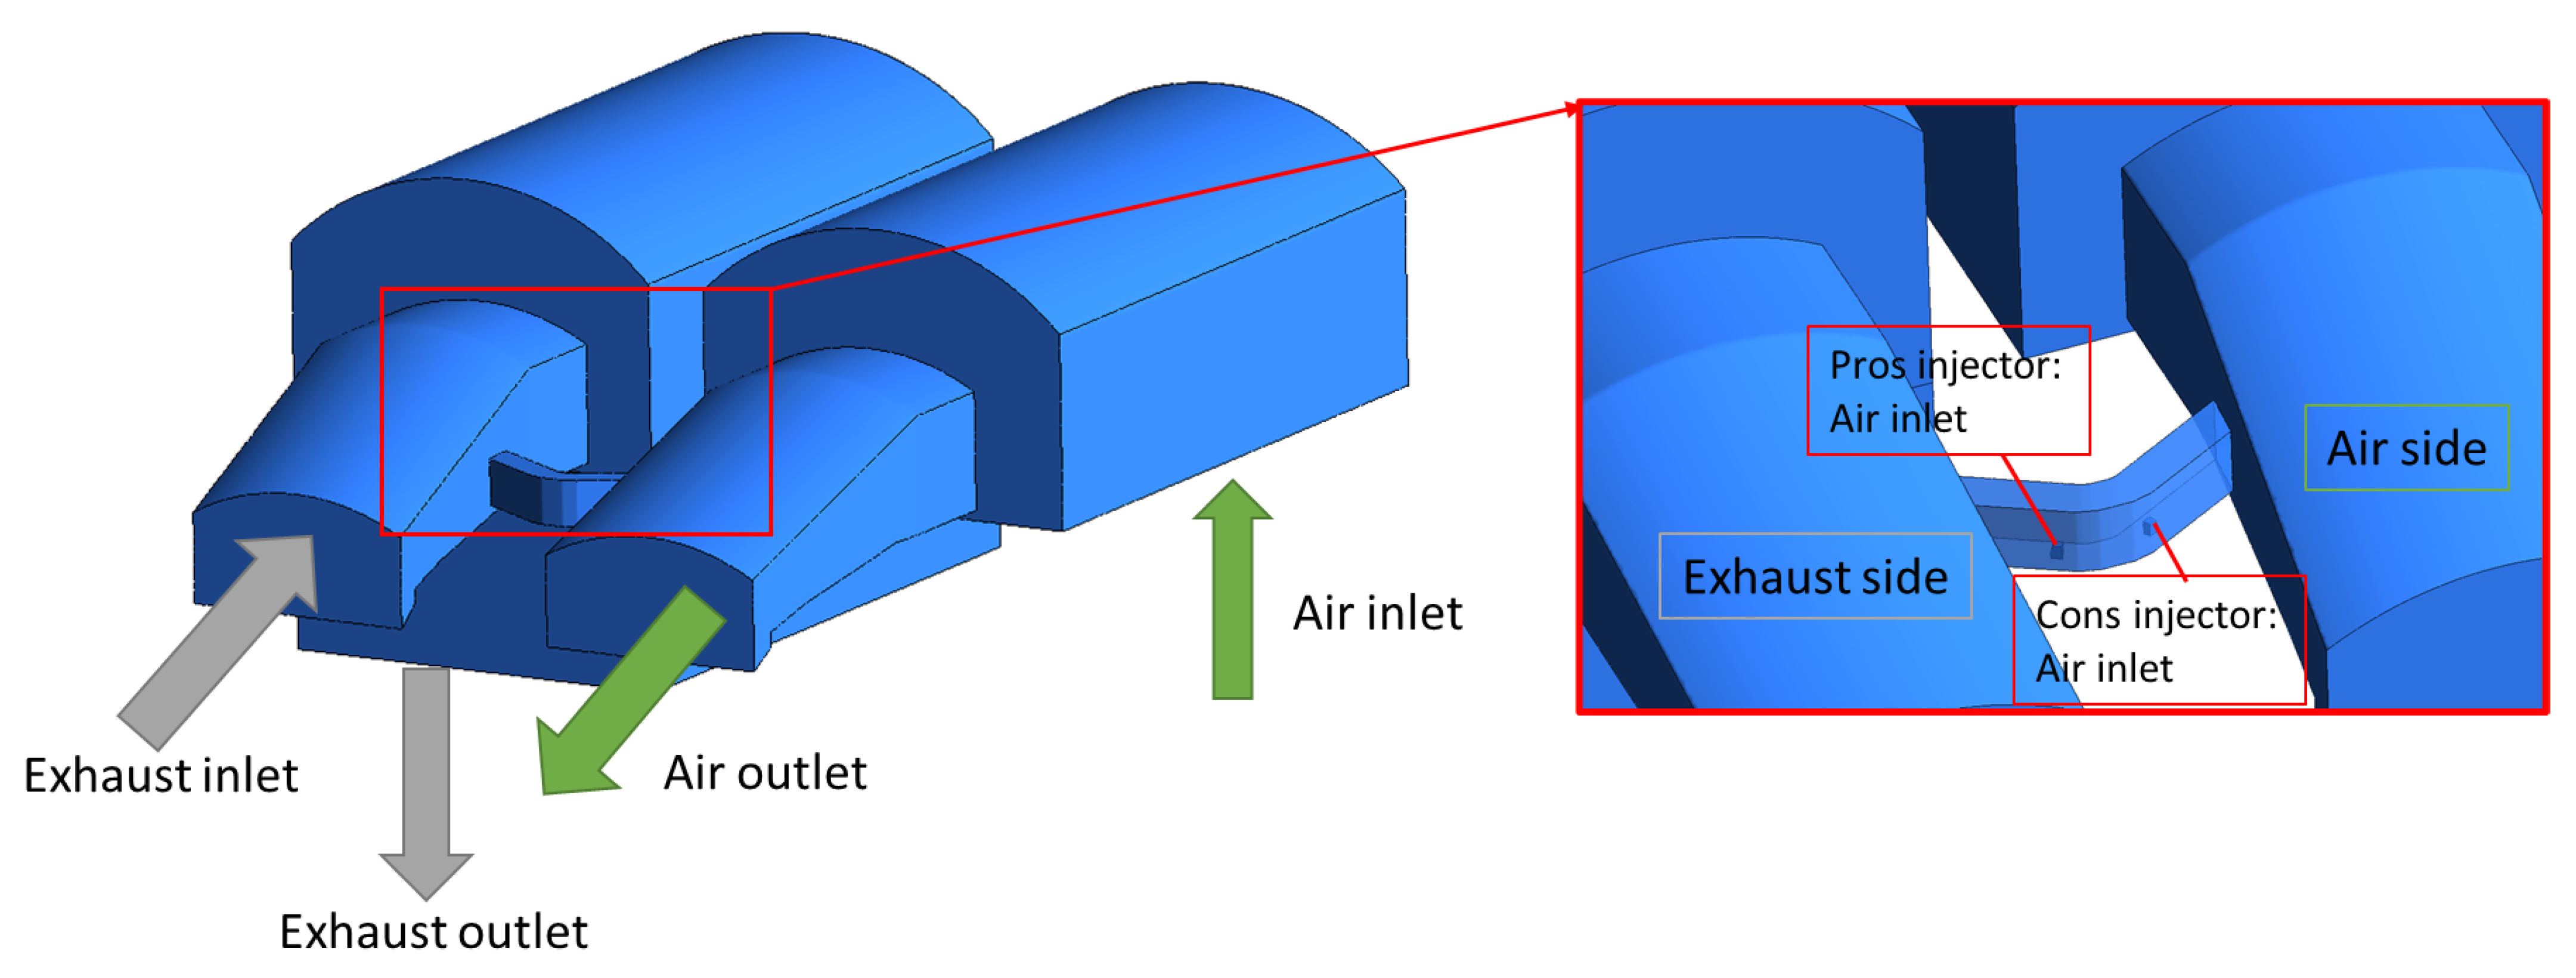
Figure 2) is placed between the two Port necks in order to provide the recirculation of a preheated air portion, coming from the top chamber of the regenerator (side air), inside the exhaust gases (that are allocated in the top chamber on the fumes side). The recirculated air flows through a bypass duct between the two chambers and is controlled by the air jets at ambient temperature from the injectors, which also affects its mixing. The injectors are alternatively called pros and cons injectors, in accordance with the air/fume’s cycles of the regenerator.

3. Numerical Model

3.1. Governing Equations

The mathematical problem is set by the Reynolds-averaged Navier–Stokes equations. The conservation of mass and momentum take the Eulerian conservative divergence form:
ρ t + · ( ρ u ) = 0
( ρ u ) t + · ( ρ u × u ) = P + · τ + S M
where τ is the tensor of the normal and tangential stress due to viscosity and SM is the momentum source. The turbulence closure adopted to model the momentum source (the Reynolds stress tensor) is the standard k-ε [35,36]. This model has been applied on different industrial fluid dynamic applications [37,38]. The additional transport equations of the model are:
t ( ρ k ) + x i ( ρ k u i ) = x j [ ( μ + μ t σ k ) k x j ] + G k + G b ρ ε Y M + S k
t ( ρ ε ) + x i ( ρ ε u i ) = x j [ ( μ + μ t σ ε ) ε x j ] + C 1 ε ε k ( G k + C 3 ε G b ) C 2 ε ρ ε 2 k + S ε
In these equations, Gk represents the generation of turbulent kinetic energy due to the mean velocity gradients; Gb is the generation of turbulent kinetic energy, due to buoyancy; YM represents the contribution of the fluctuating dilatation in compressible turbulence to the overall dissipation rate; while Sk and Sε are source terms. The turbulent (or eddy) viscosity µt is computed by combining k and ε:
µ t = ρ C μ k 2 ε
The following standard model coefficients have been adopted: C1ε = 1.44, C2ε = 1.92, Cµ = 0.09, σk = 1.0 σε = 1.3. These values have been selected in accordance with Ansys Fluent, the commercial software adopted for the following model set-up [39].

3.2. CFD Model

The CFD model has been set up through the commercial software Ansys Fluent. The calculation domain consists of the top chambers of the regenerative chambers, which include the bypass duct and the air injectors, but also a portion of the checkers zone for the exhaust gases side equipped with cruciform shape checkers. The U-shaped bypass duct has two injectors inside. This reduced geometrical model is representative of the portion of interest for the work purpose. The geometric characteristics of the regenerative chamber are reported in Table 1.
The computational domain has been discretized with an unstructured mesh using tetrahedral elements in the upper part of the regenerator, including the bypass duct and the two injectors, due to the geometry complexity. A series of mesh densities has been set to refine the duct area; in top chambers, a maximum cell size of 60 [mm] has been imposed, while in the bypass duct a maximum of 28 [mm] and a minimum near the injectors of 12 [mm]. At the walls the mesh is clustered with prism layers to satisfy the y+ value around 30, in order to ensure activation of the wall functions; the prism layer consists of 8 layers where the first cell has a size of 0.3 [mm], a growth rate of 1.2 and an average aspect ratio of 20. Figure 3 shows a cut-plane of the volume elements of this zone, with a zoom on the bypass duct. The checker’s zone has been discretized with a structured hexahedral grid. Both parts of the computational domain have been generated with Ansys ICEM CFD with a global mesh of 11 million cells. This grid has been set up and selected after a sensitivity analysis carried out in previous works [11,23].
The turbulence model is the standard k-ε with scalable wall functions; this model offers good results with a stronger numerical stability when high turbulence jets are present inside industrial components [40]. The air and the exhaust gases are treated as gas mixtures with related properties and the set of transport equations of the chemical species is solved. In addition, the energy equation is activated. The portion of the checkers zone has been modelled as a porous domain; the source terms for momentum and energy governing equations to model flow resistance and heat transfer are set as described in [9]. Figure 4 shows the different boundary conditions imposed in the various patches. In the regenerative chamber on the air side, an inlet condition has been set with a uniform mass flow rate equal to 4.185 [kg/s], a temperature T = 1563 [K] and with a chemical composition of 21% oxygen and 79% nitrogen. An outlet conditions at ambient pressure has been imposed from its relative tower. On the other hand, from the tower of the fumes side an inlet condition has been set with a mass flow rate equal to 5.036 [kg/s], a temperature T = 1773 [K], and a chemical composition with 2% oxygen, 11.5% water vapor, 19.5% carbon dioxide and the remaining percentage of nitrogen. The simulations have been carried out keeping constant the operating conditions of the furnace (inlet/outlet conditions, air/exhausted gases). The operating conditions of air staging have been varied by changing the distribution of the total inlet mass flow rate of the two injectors from the design condition, where the distribution is about 92% for the pros injectors and the 8% for the cons injectors. The walls have been modelled as adiabatic with no-slip. An interface between the fluid and the porous domain is set between the top chamber and the checkers zone (for the exhaust side).
The steady simulations have been solved with the SIMPLE scheme and all the equations were solved with second order numerical schemes.

4. Flow Analysis—Baseline Case

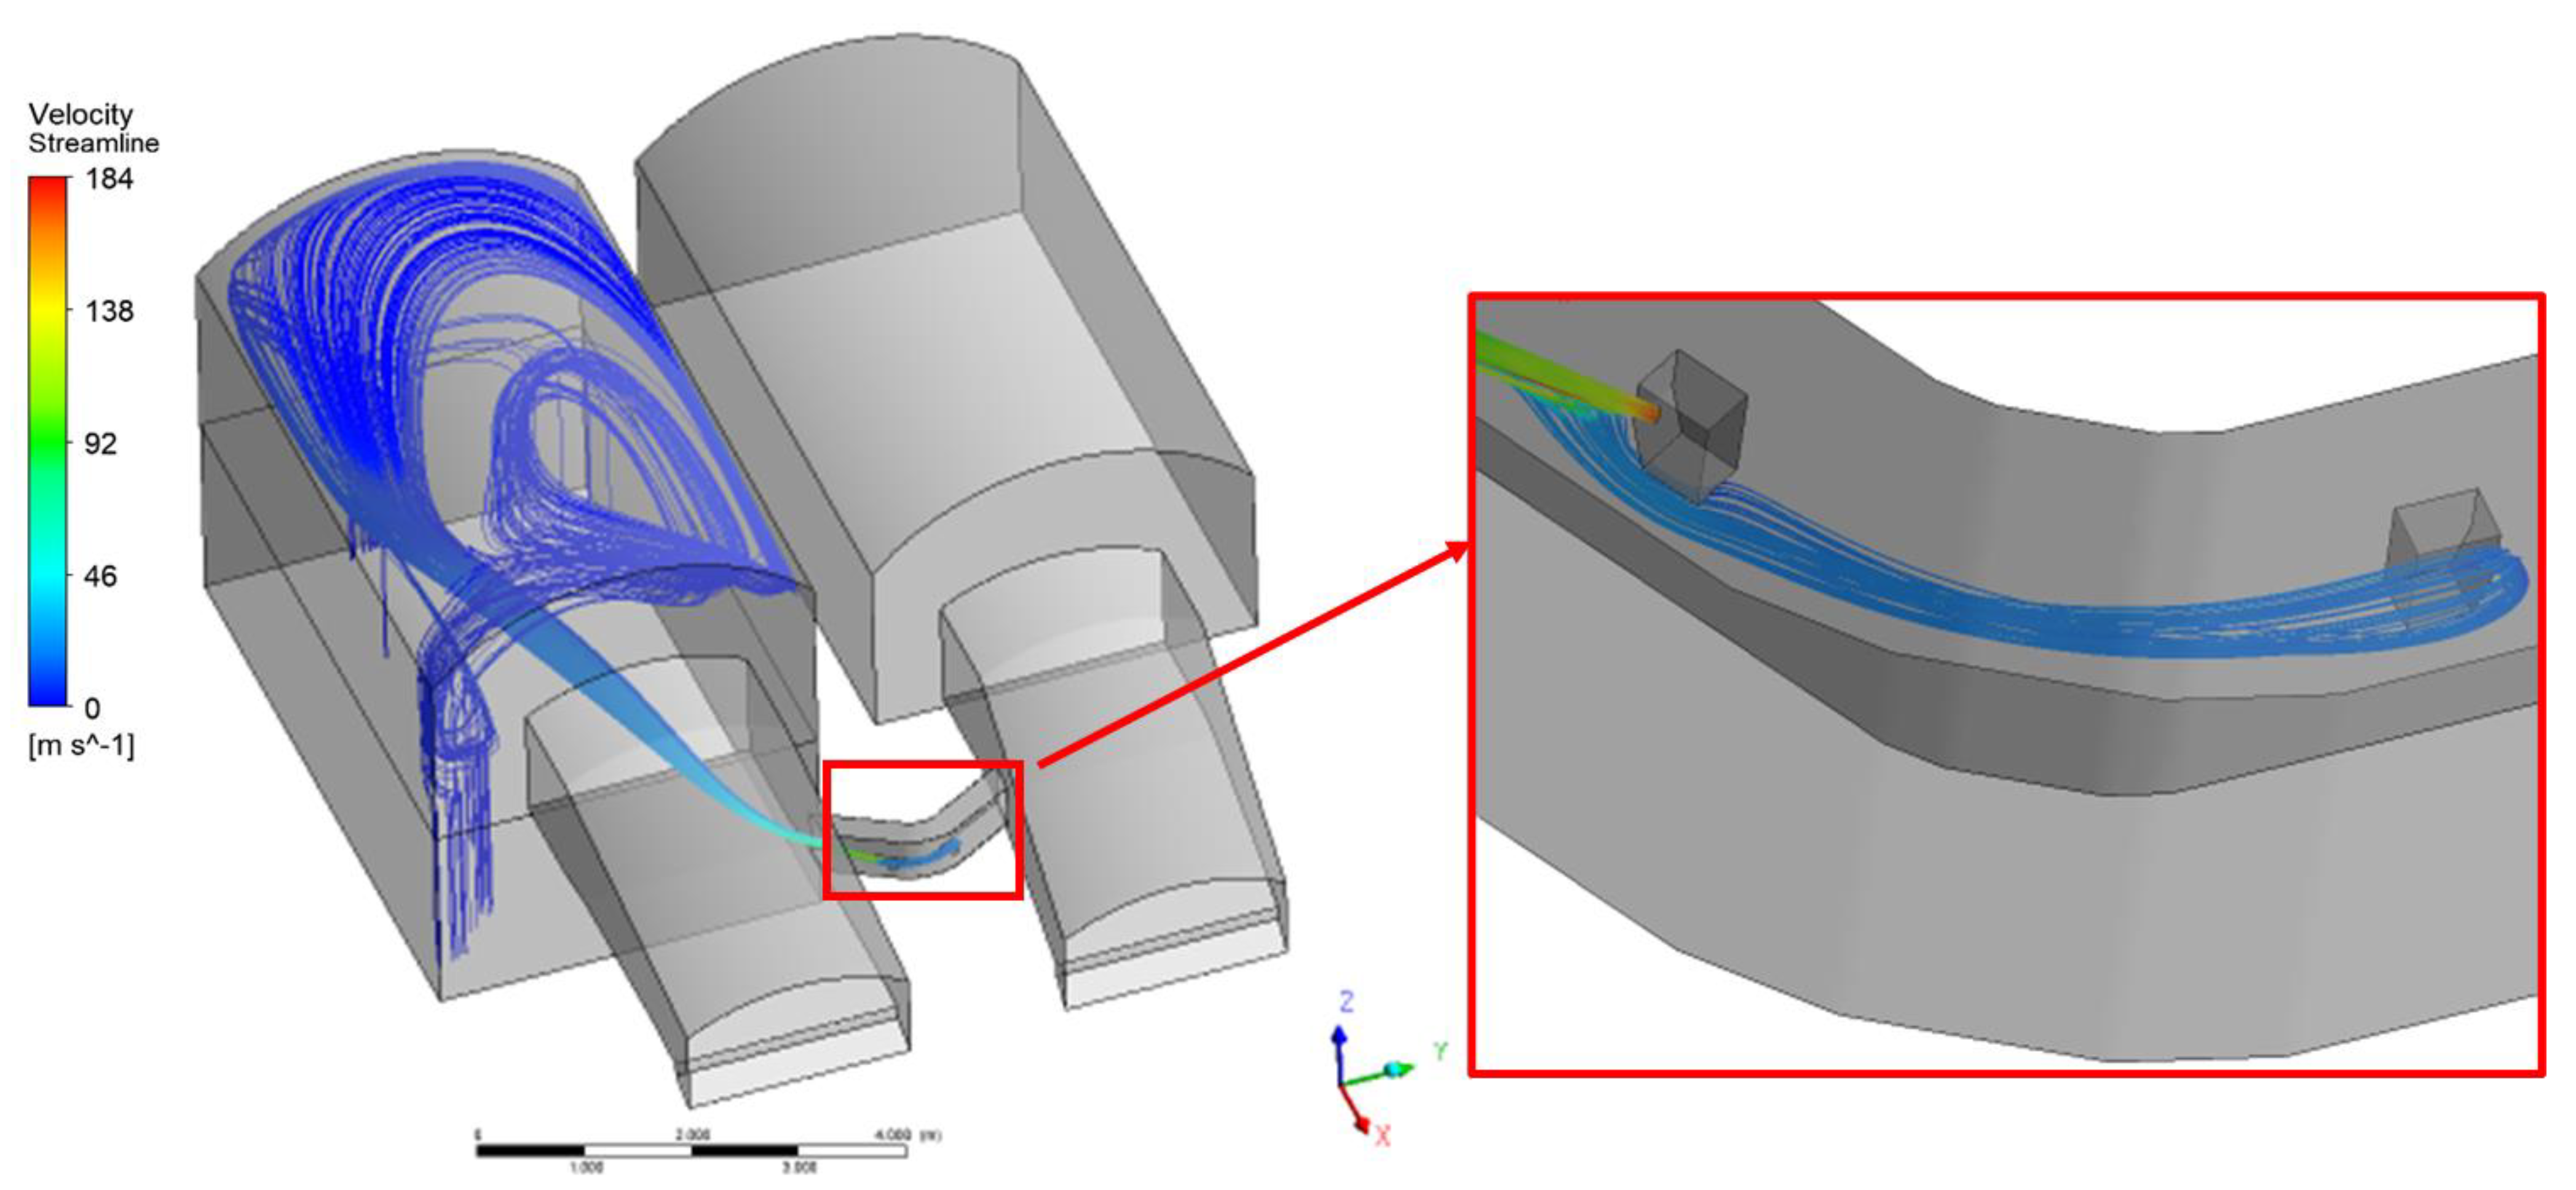
The hybrid air staging is a gas recirculation strategy operated at the port neck level. A set of two injectors, as previously described, are present in order to be able to control both the flow of recirculated gas and the mixing in the chamber. It is clear that for a given geometry of the furnace and regenerative chamber, the air mass flow through the injectors should be optimized. This section shows the flow structure of the reference case (baseline). Figure 5 shows the velocity streamlines generated by the two injectors.
The cons injector (right) is activated with the aim of cooling the gases contained in the top chamber, while the pros injector (left) activates the recirculation of the flow by entraining it into the chamber and by enhancing the flow mixing. 
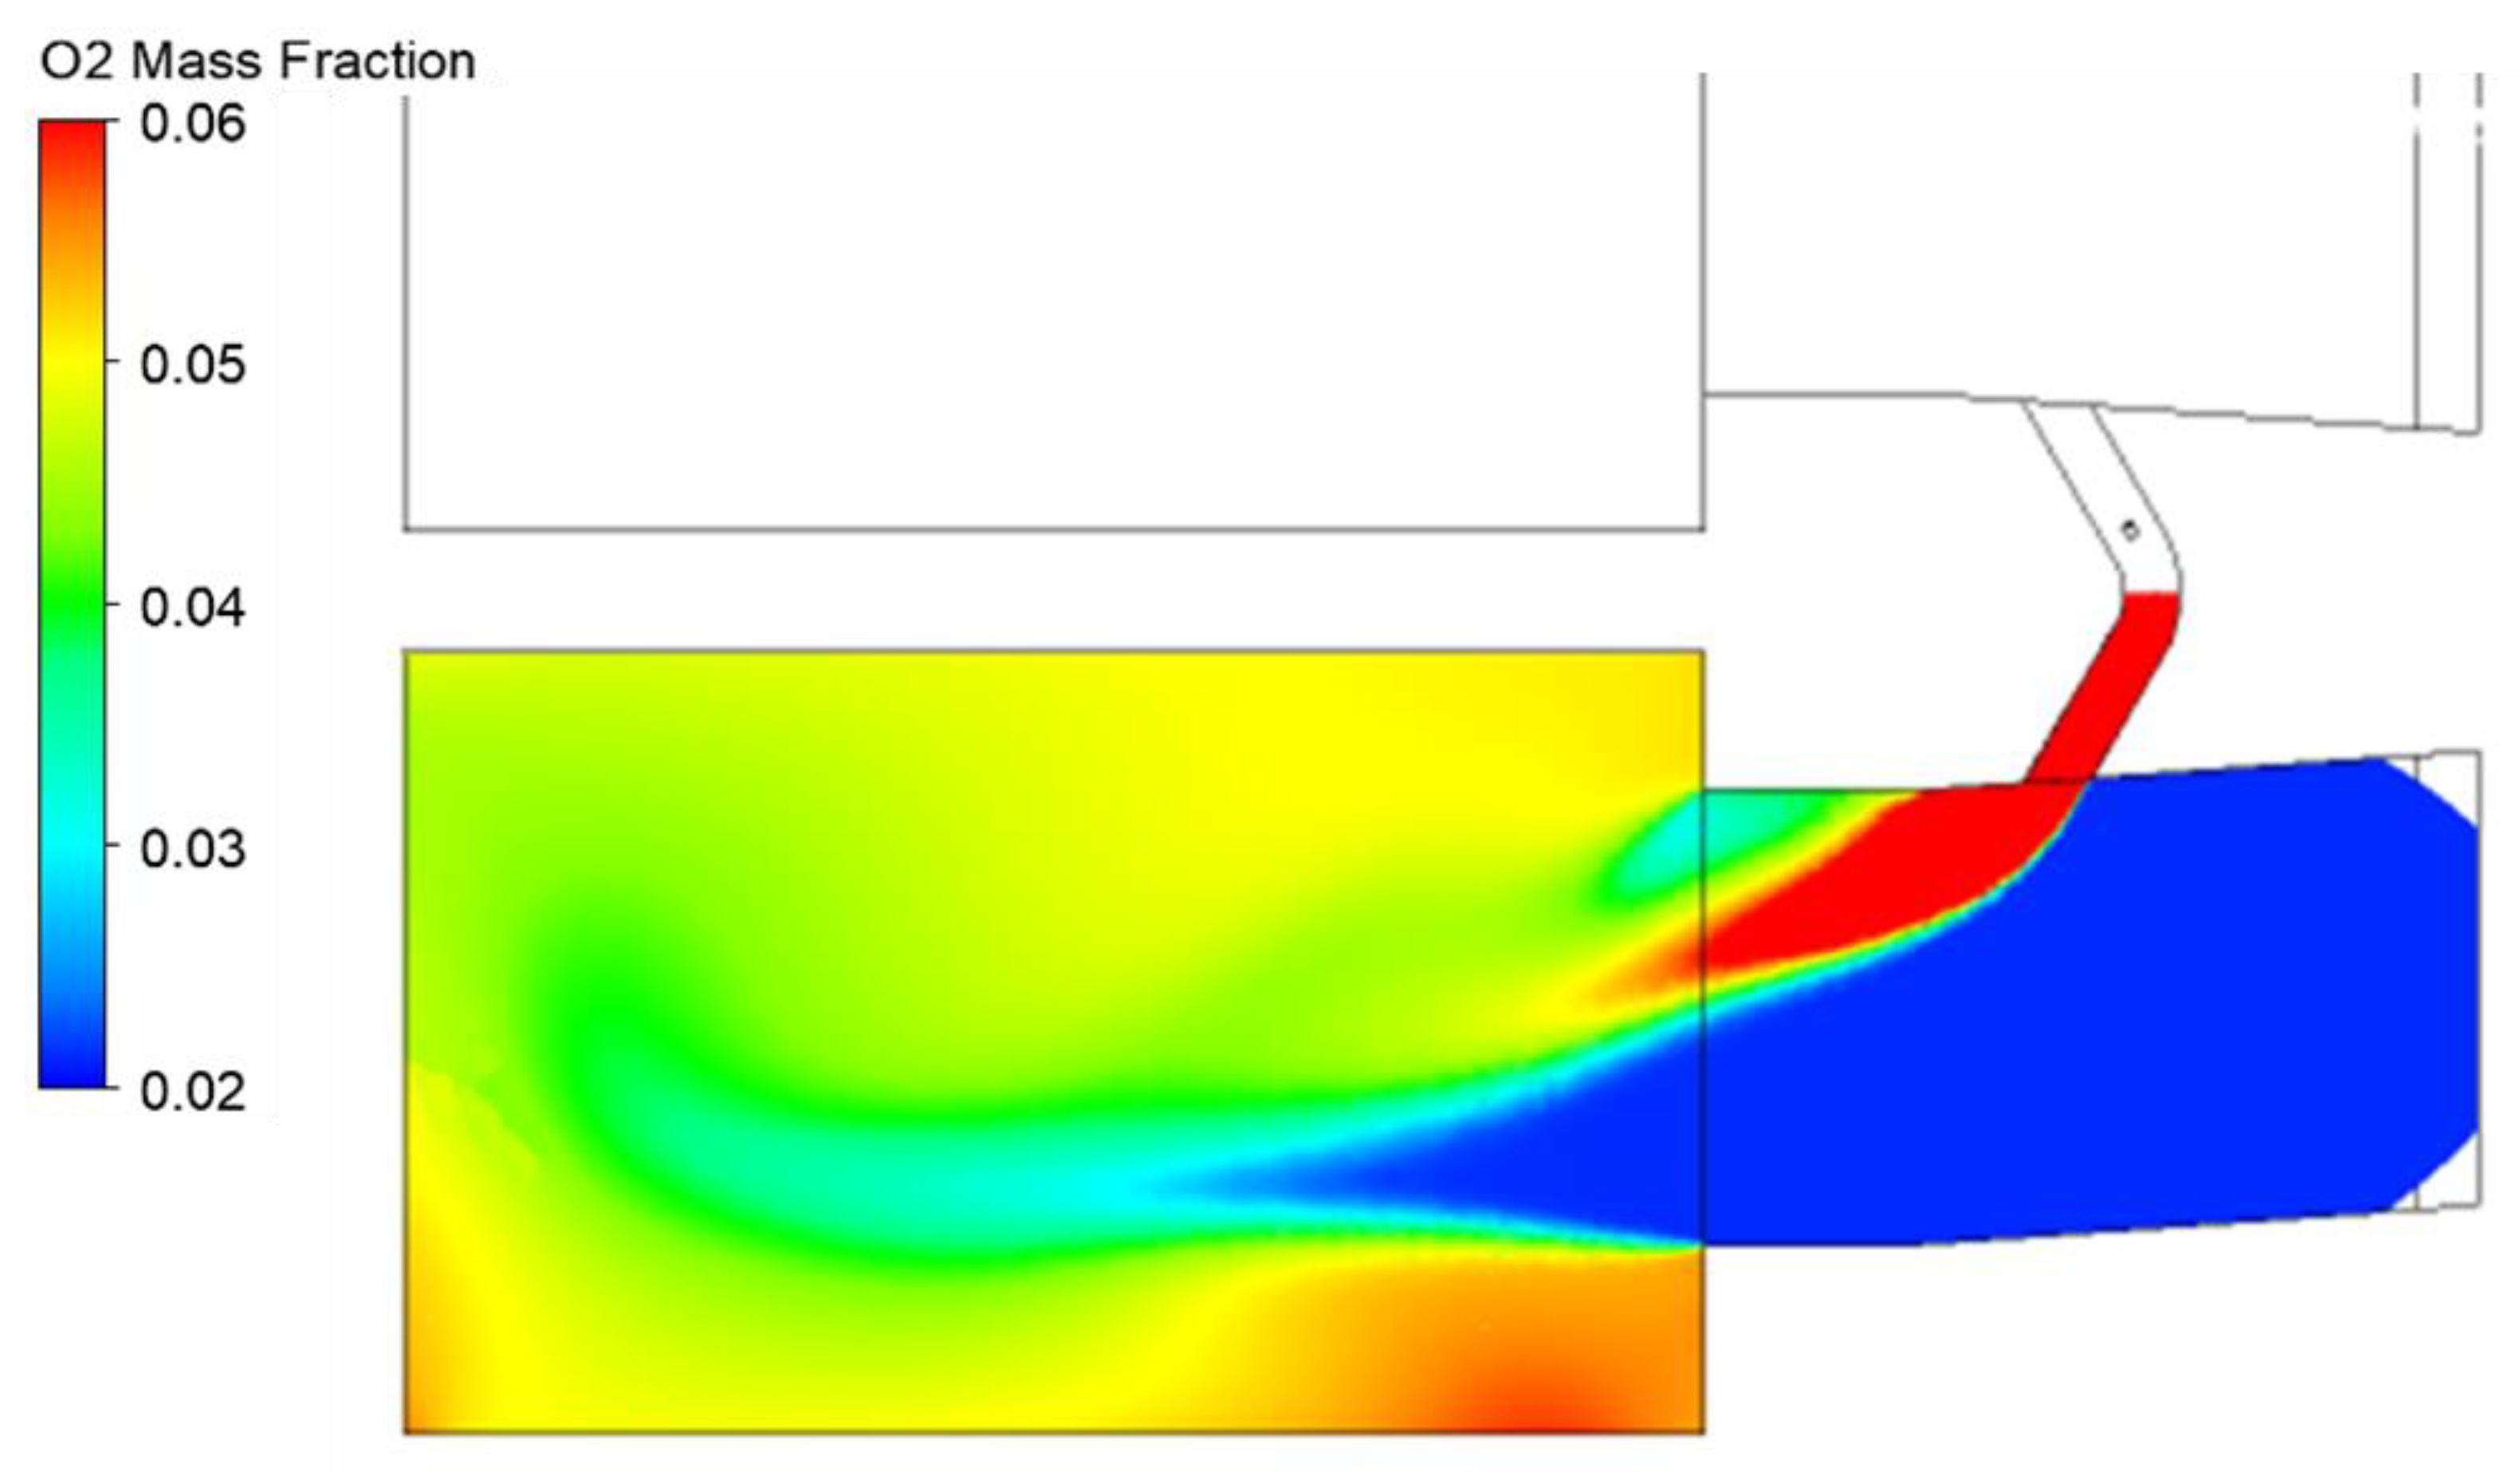
Figure 6 shows the contour of the oxygen concentration in a section of the top chamber, while Scheme 1 reports the respective values in a set of sectors that discretize the same above control surface.
For the baseline condition, the mass flow rate through the bypass duct is equal to 0.517 [kg/s] and gives an oxygen concentration between 0.04 and 0.05 almost everywhere. Therefore, it is strategic to be able to optimize this flow structure and evaluate the effectiveness of the system, by varying some operating parameters, to get the above distribution as uniform as possible with the lowest overall additional air mass flow rate.

5. Surrogate Models

Due to the considerable size of the computational domains and the phenomena complexity, the simulations require significant computational resources. The development of an appropriate surrogate model for the system response can support the optimization phases to dramatically reduce the overall time required. The surrogate model is built from a Design of Experiment (DoE) technique used to identify a set of simulations carried out in a given operating range. The choice of points within the range is generally entrusted to a random sampling technique that allows uniform coverage. One of the best and most used techniques is the Latin Hypercube Sampling (LHS) [41,42,43,44].
The surrogate model has been created from the DoE dataset using the Gaussian Process (GP), also known as Kriging [41]. It effectively builds a response surface system in the predetermined operating range. Therefore, by interrogating the surrogate model it is possible to obtain the system response in a negligible time compared to the time required by a fully 3D CFD run. The surrogate model is particularly useful to perform sensitivity analysis in the uncertainty quantification process or for design optimization.
The set of simulations have been carried out by keeping constant the operating conditions of the furnace (constant inlet/outlet for air/exhaust gases) and by varying the operating condition of the Air Staging with a different inlet mass flow rate repartition in the two injectors. The mass flow rate through the bypass duct has been chosen as the system response in this phase, since dilution effectiveness of the exhausted gases increases with the recirculated mass flow rate.
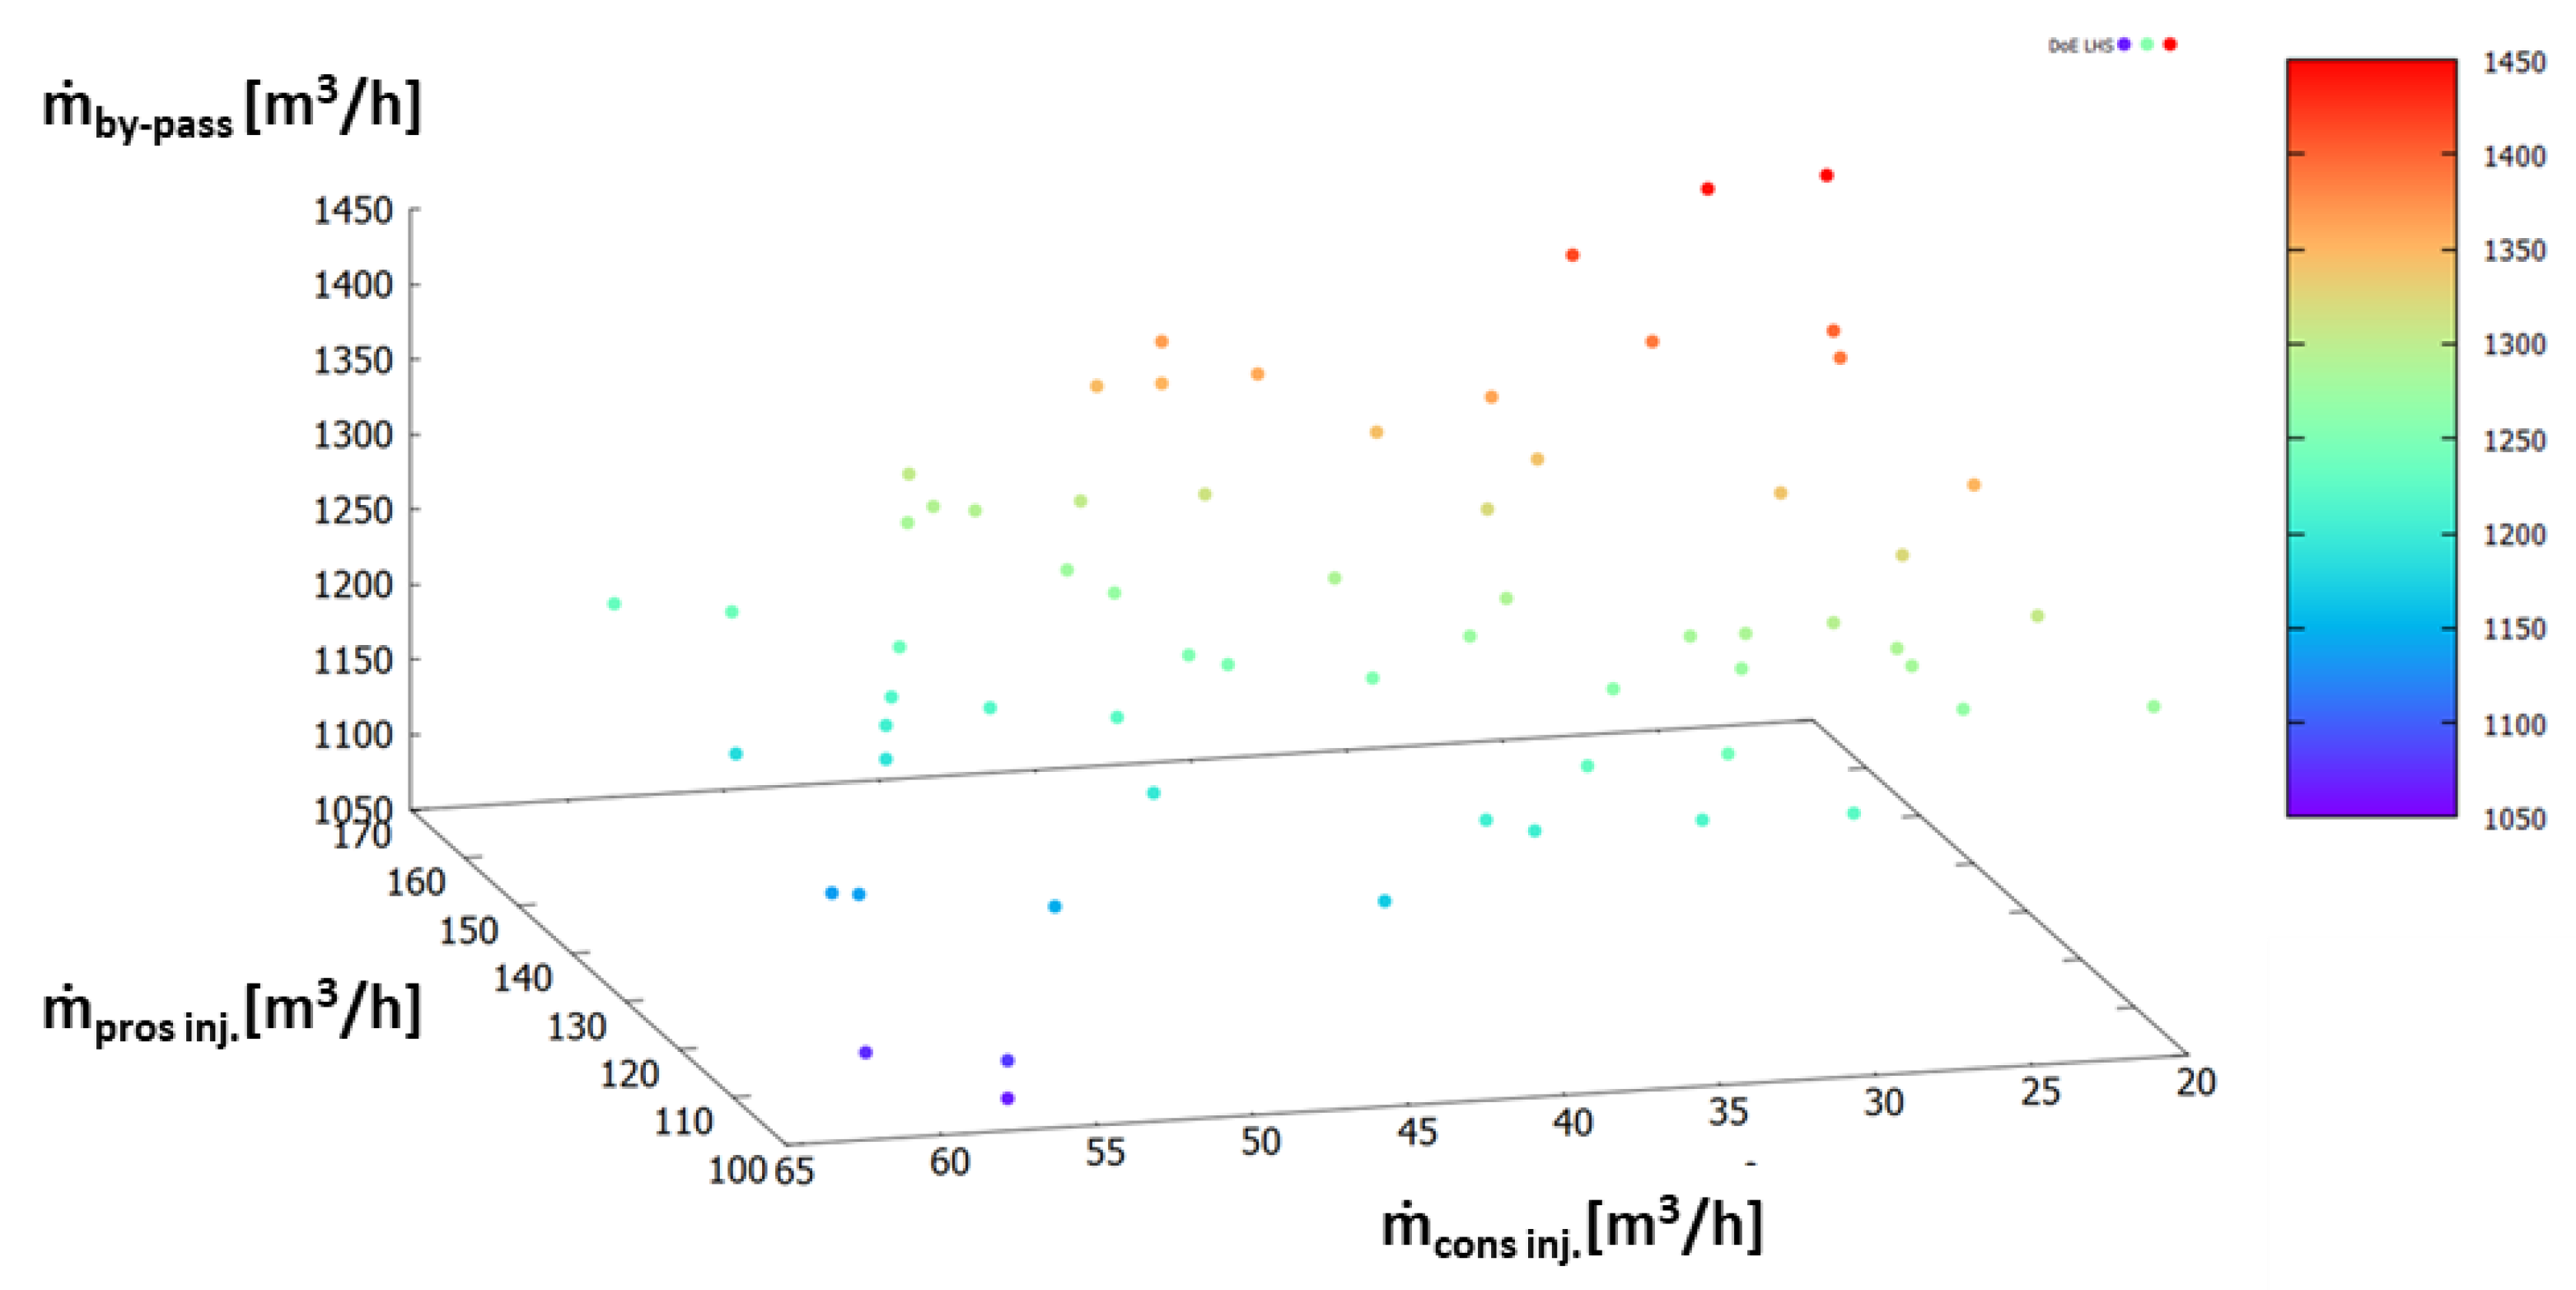
The construction of the metamodel has been performed through the joint use of Ansys Fluent (for the CFD simulations) and Dakota software for the DoE construction and for the response surface setup. The input variables are the air mass flow rate injected by the pros (ṁpros) and cons (ṁcons) injectors in an operating range between 100–160 [m3/h] and 20–60 [m3/h], respectively. Using the LHS method, 64 cases have been simulated to evaluate the mass flow rate in the bypass duct. Figure 7 shows the point of the DoE considered with the output value from a combination of the two mass flow rates in the injectors.
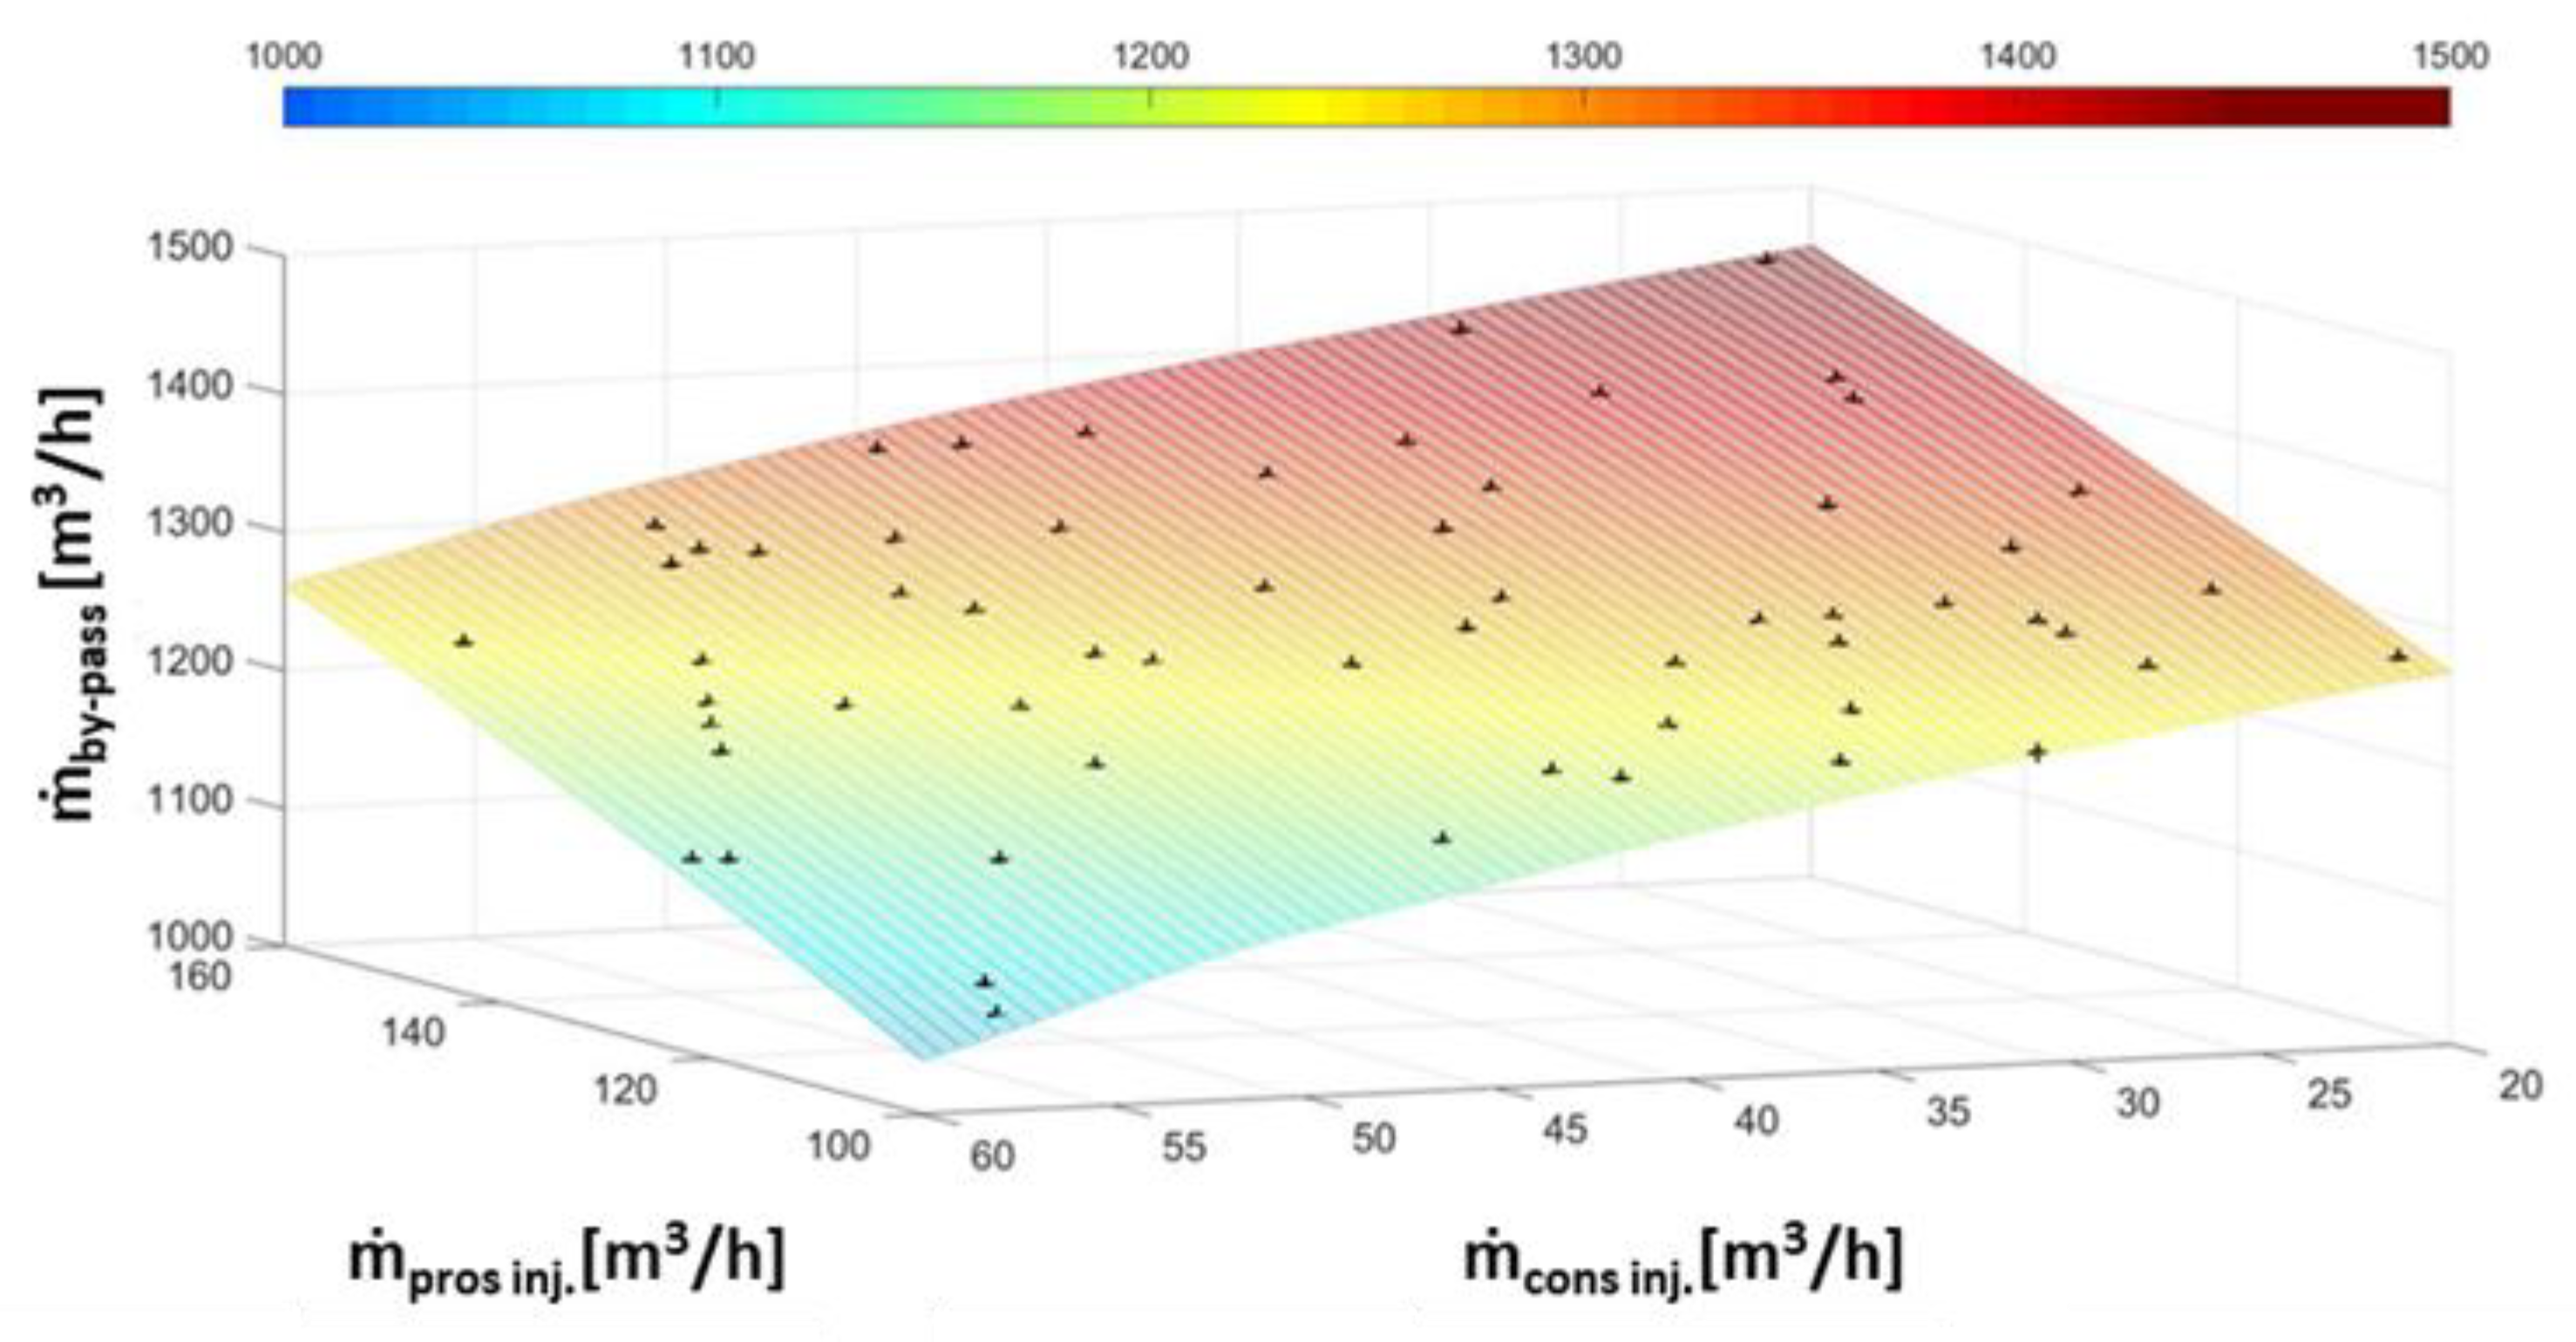
It is evident that the LHS method has a very good coverage of the design space. Using the above data, the surrogate model using the GP method has been built. The response surface obtained from the GP is shown in Figure 8 where the data from the DoE are added as points. The accuracy of the surrogate model can be checked qualitatively by observing that all the DoE points lie perfectly on the surface but also quantitatively.
Using the Dakota software, the quality of the surrogate model is quantified with the Leave-one-out Cross validation (also called Prediction Error Sum of Squares PRESS) [41]. In Table 2 have been reported the values of the mean square error (rms), average error and maximum error. The accuracy of the surrogate model is confirmed, and it can be used for the following analysis on Uncertainty Quantification and Optimization.

6. Uncertainty Quantification Analysis—UQ

The surrogate model estimates the response of the system in a very short time and with negligible computational effort compared to a 3D CFD run. This is essential to perform the UQ analysis that normally requires a large number of simulations. The UQ considers the input variables as probabilistic variables, i.e., as defined by an average value, by a standard deviation (which represents the uncertainty as a first approximation) as well as by a probability density function (pdf) associated with the variables. The purpose is to evaluate how uncertainty propagates in the physical system (or through simulations) and how it affects the output variables. A validated approach has been adopted by following previous work [45]. In this case, the two mass flow rates of the injectors have been considered as probabilistic input parameters with their pdfs and their impact on the output variable (bypass mass flow rate) has been analyzed.
The analysis has been divided into two steps: a uniform pdf for the input variables in the first and a normal distribution centered in the intervals mean values in the second.

6.1. Uniform Distribution

The two mass flow rates can be considered with a uniform probability distribution within the range 110–150 [m3/h] for ṁpros and 20–60 [m3/h] for ṁ
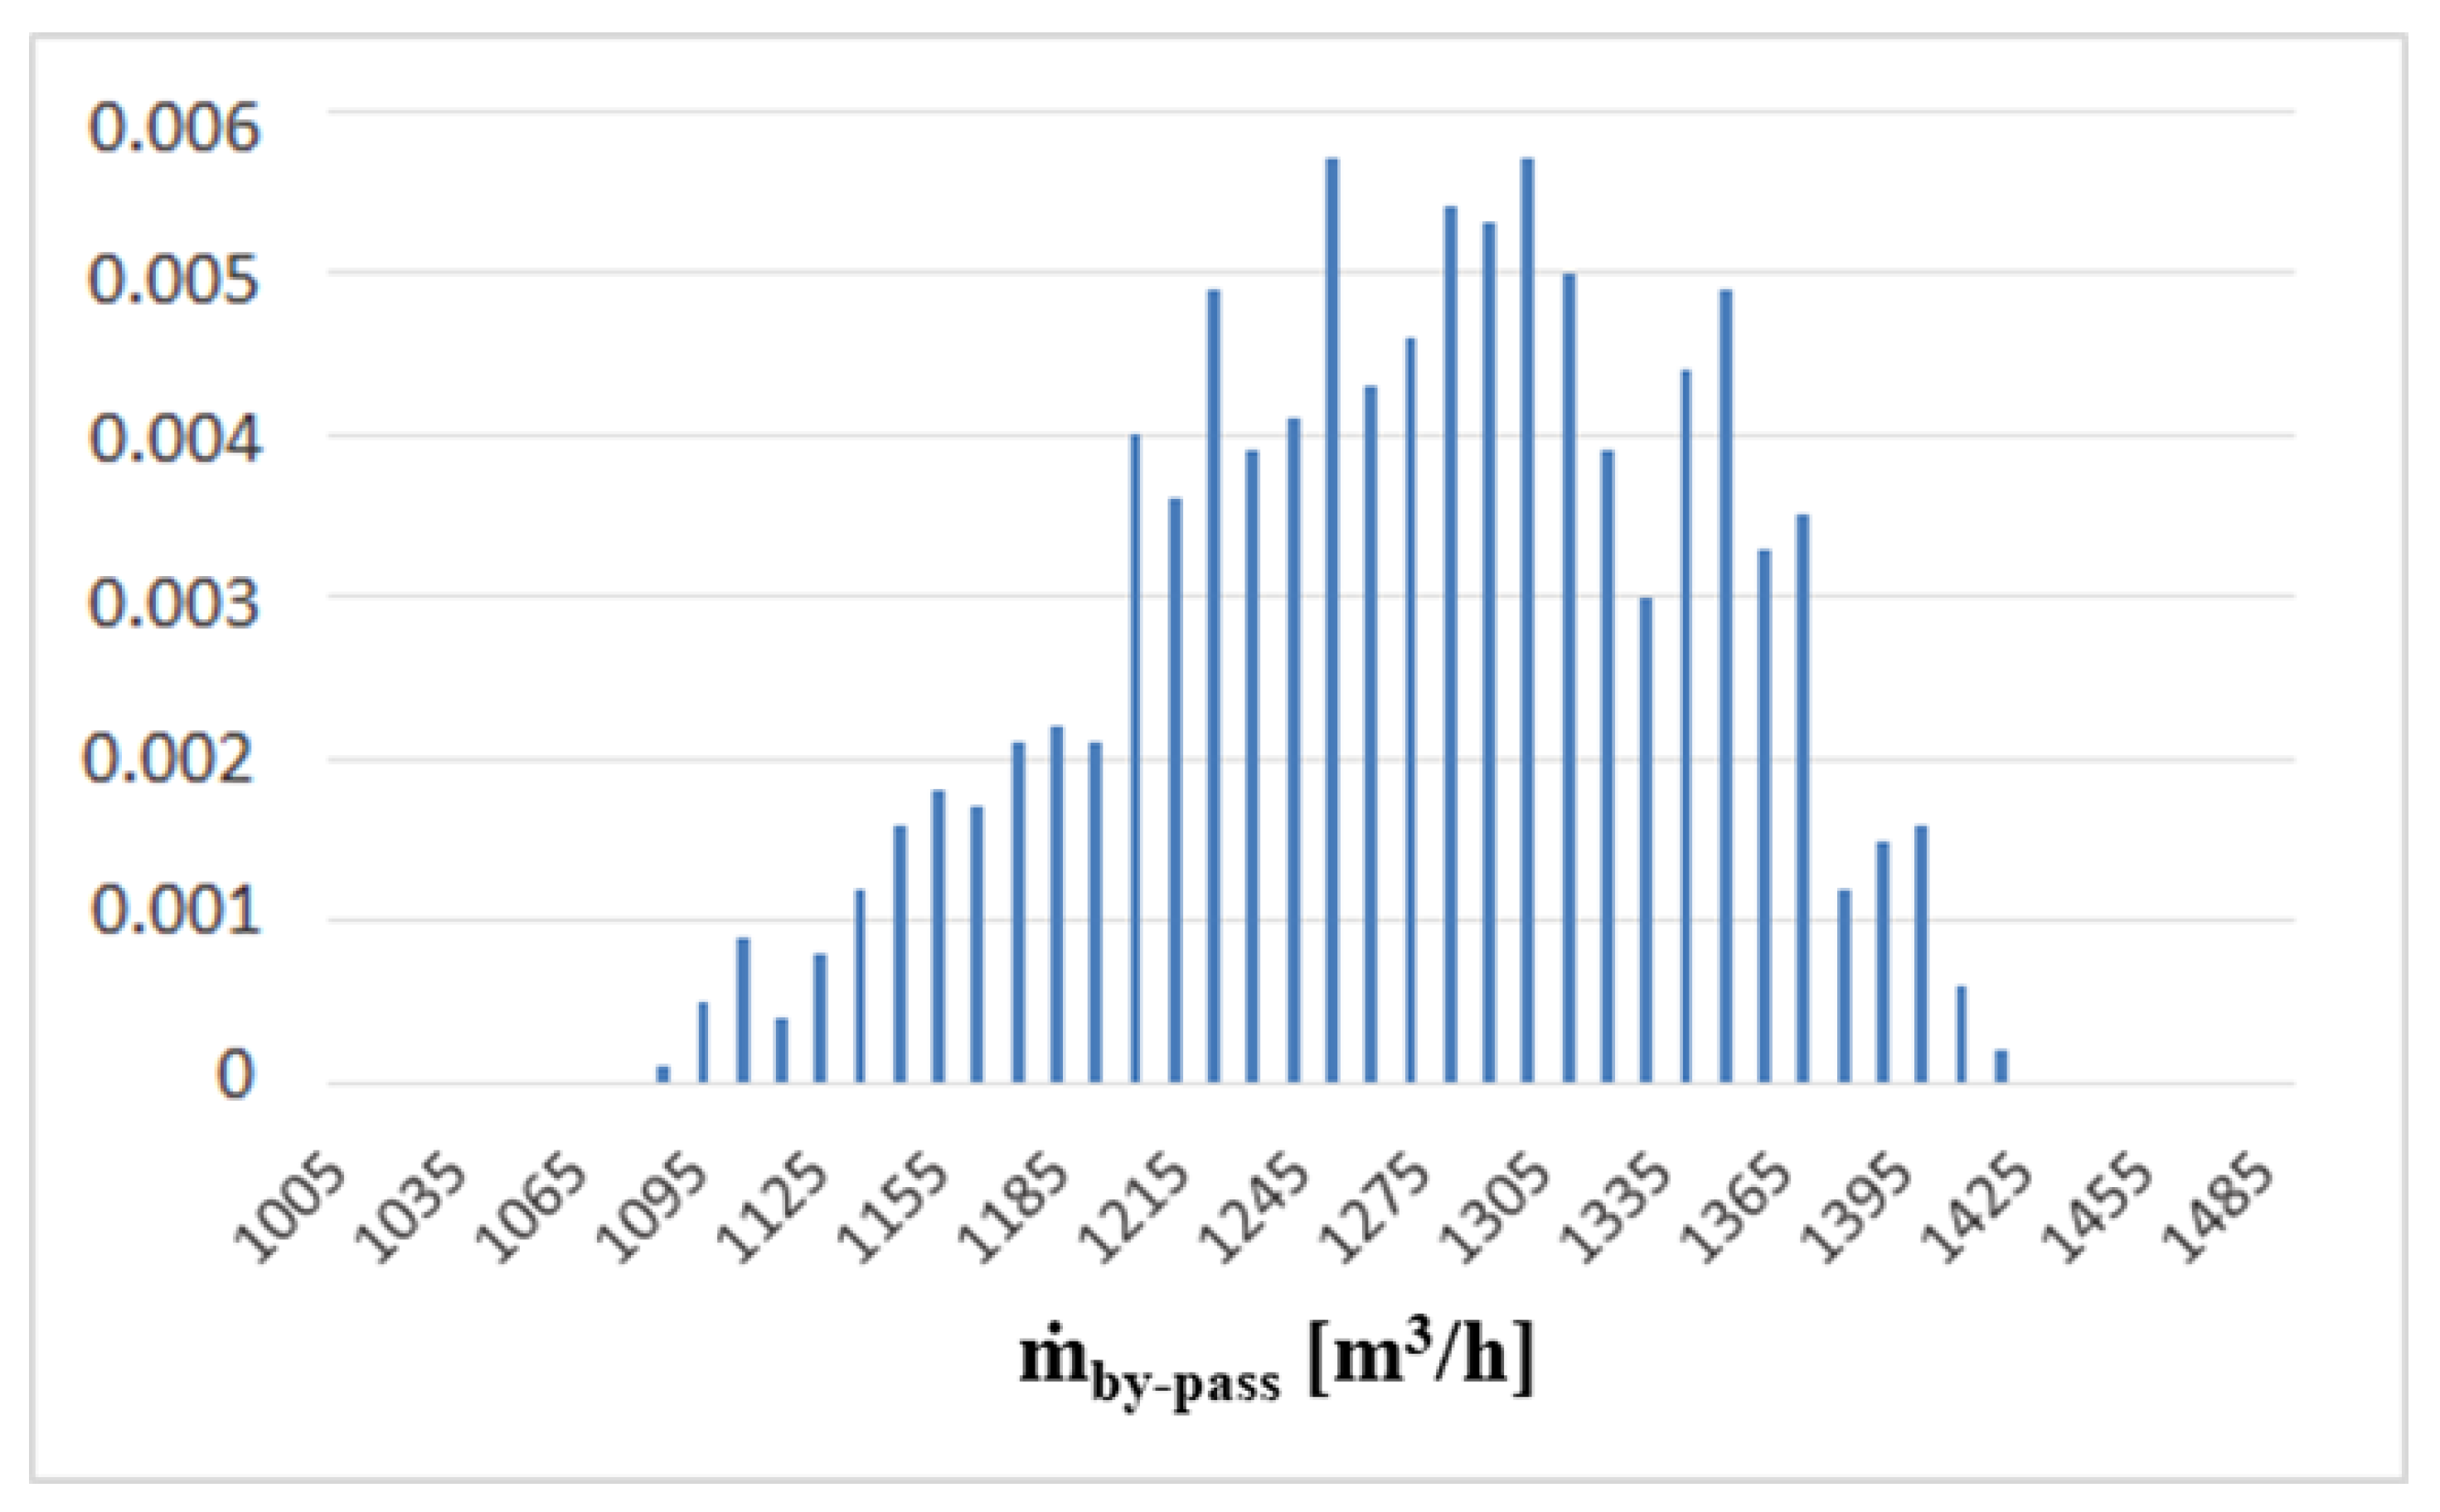
cons. A significant number of samples are obtained using the LHS method directly on the surrogate model. In this case 1000 samples were considered. The result of the probability distribution of the bypass flow rate (output variable) is represented by the histograms in Figure 9.
It can be noticed that the distribution of the uncertainty of the bypass mass flow rate is different from the uniform distribution of the two input variables. In fact, there is a higher probability for the central values of the variation range, showing a limited range of possible values subjected to uncertainty.

6.2. Normal Distribution

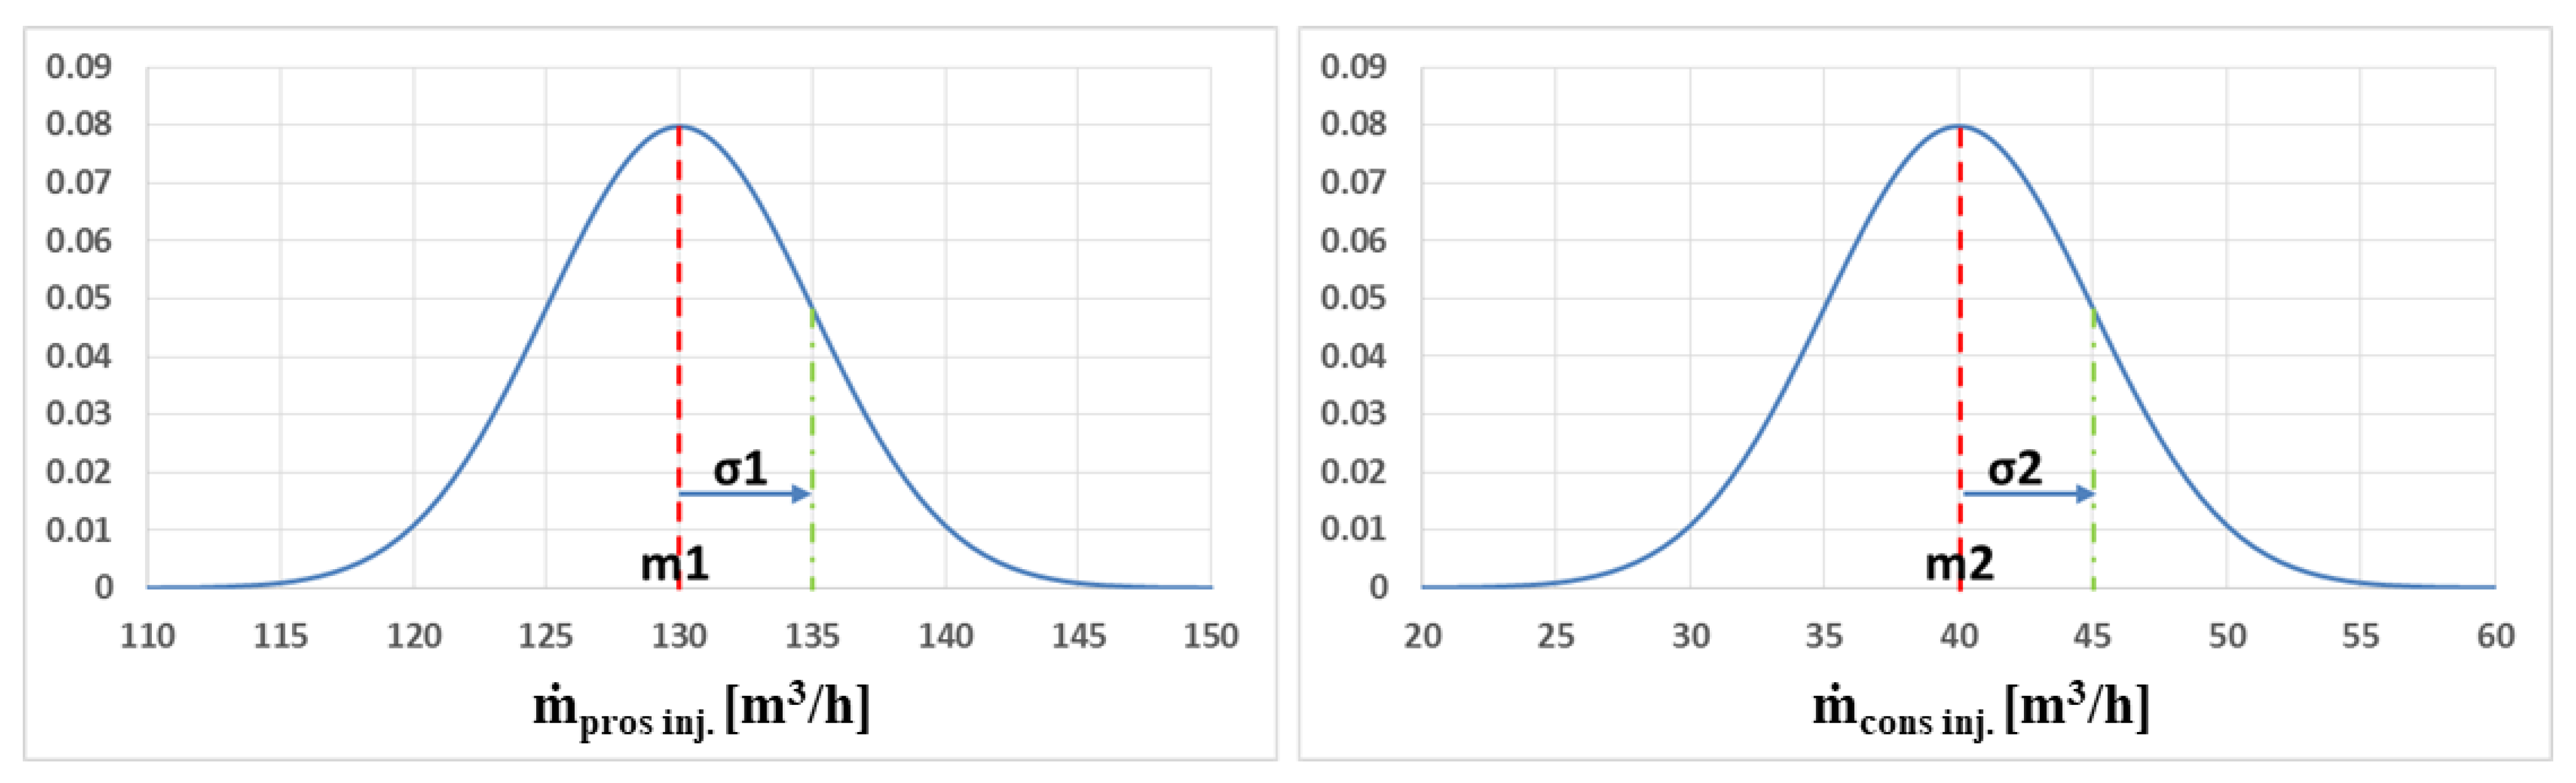
The input variables uncertainty is modelled with a normal distribution as depicted in Figure 10, with mean and standard deviations defined in 
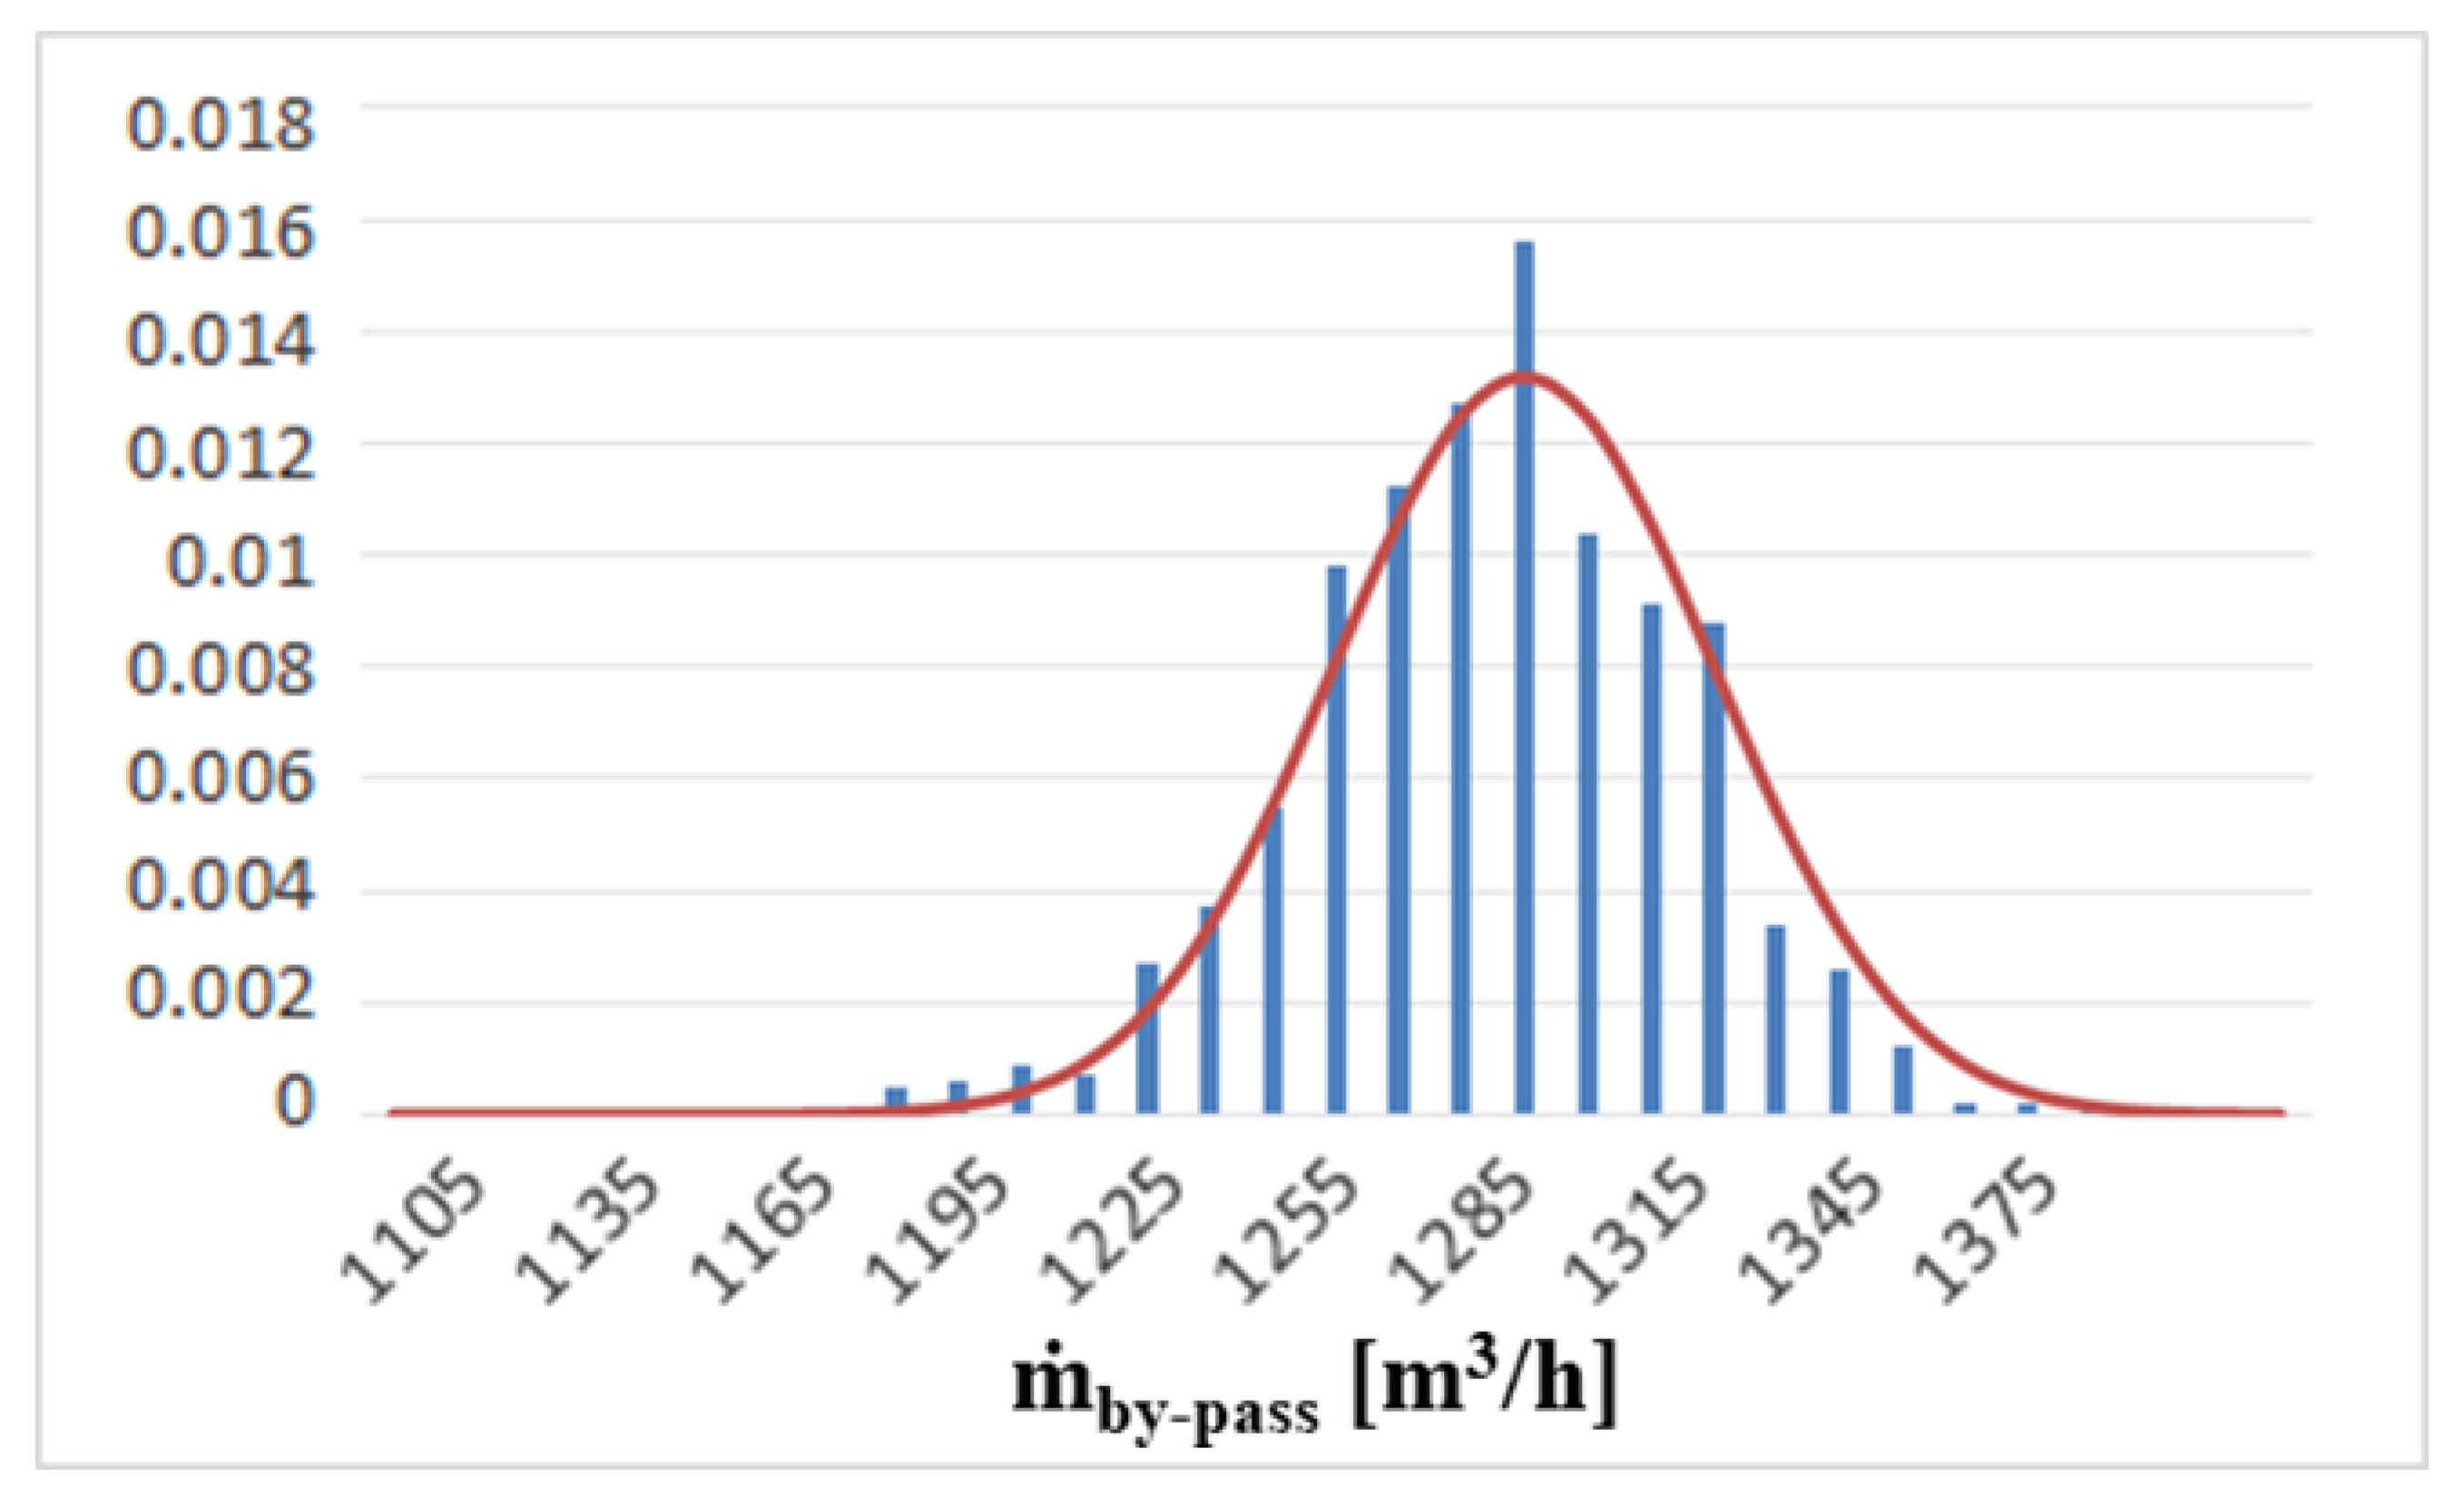
Table 3. The resulting output distribution for the bypass mass flow rate is represented by the histograms in Figure 11.
It can be noticed that the distribution almost fits the corresponding normal pdf (represented by the red curve). However, the uncertainty associated to the system response is very low if compared to the standard deviation σ associated to input variables (see Table 4).
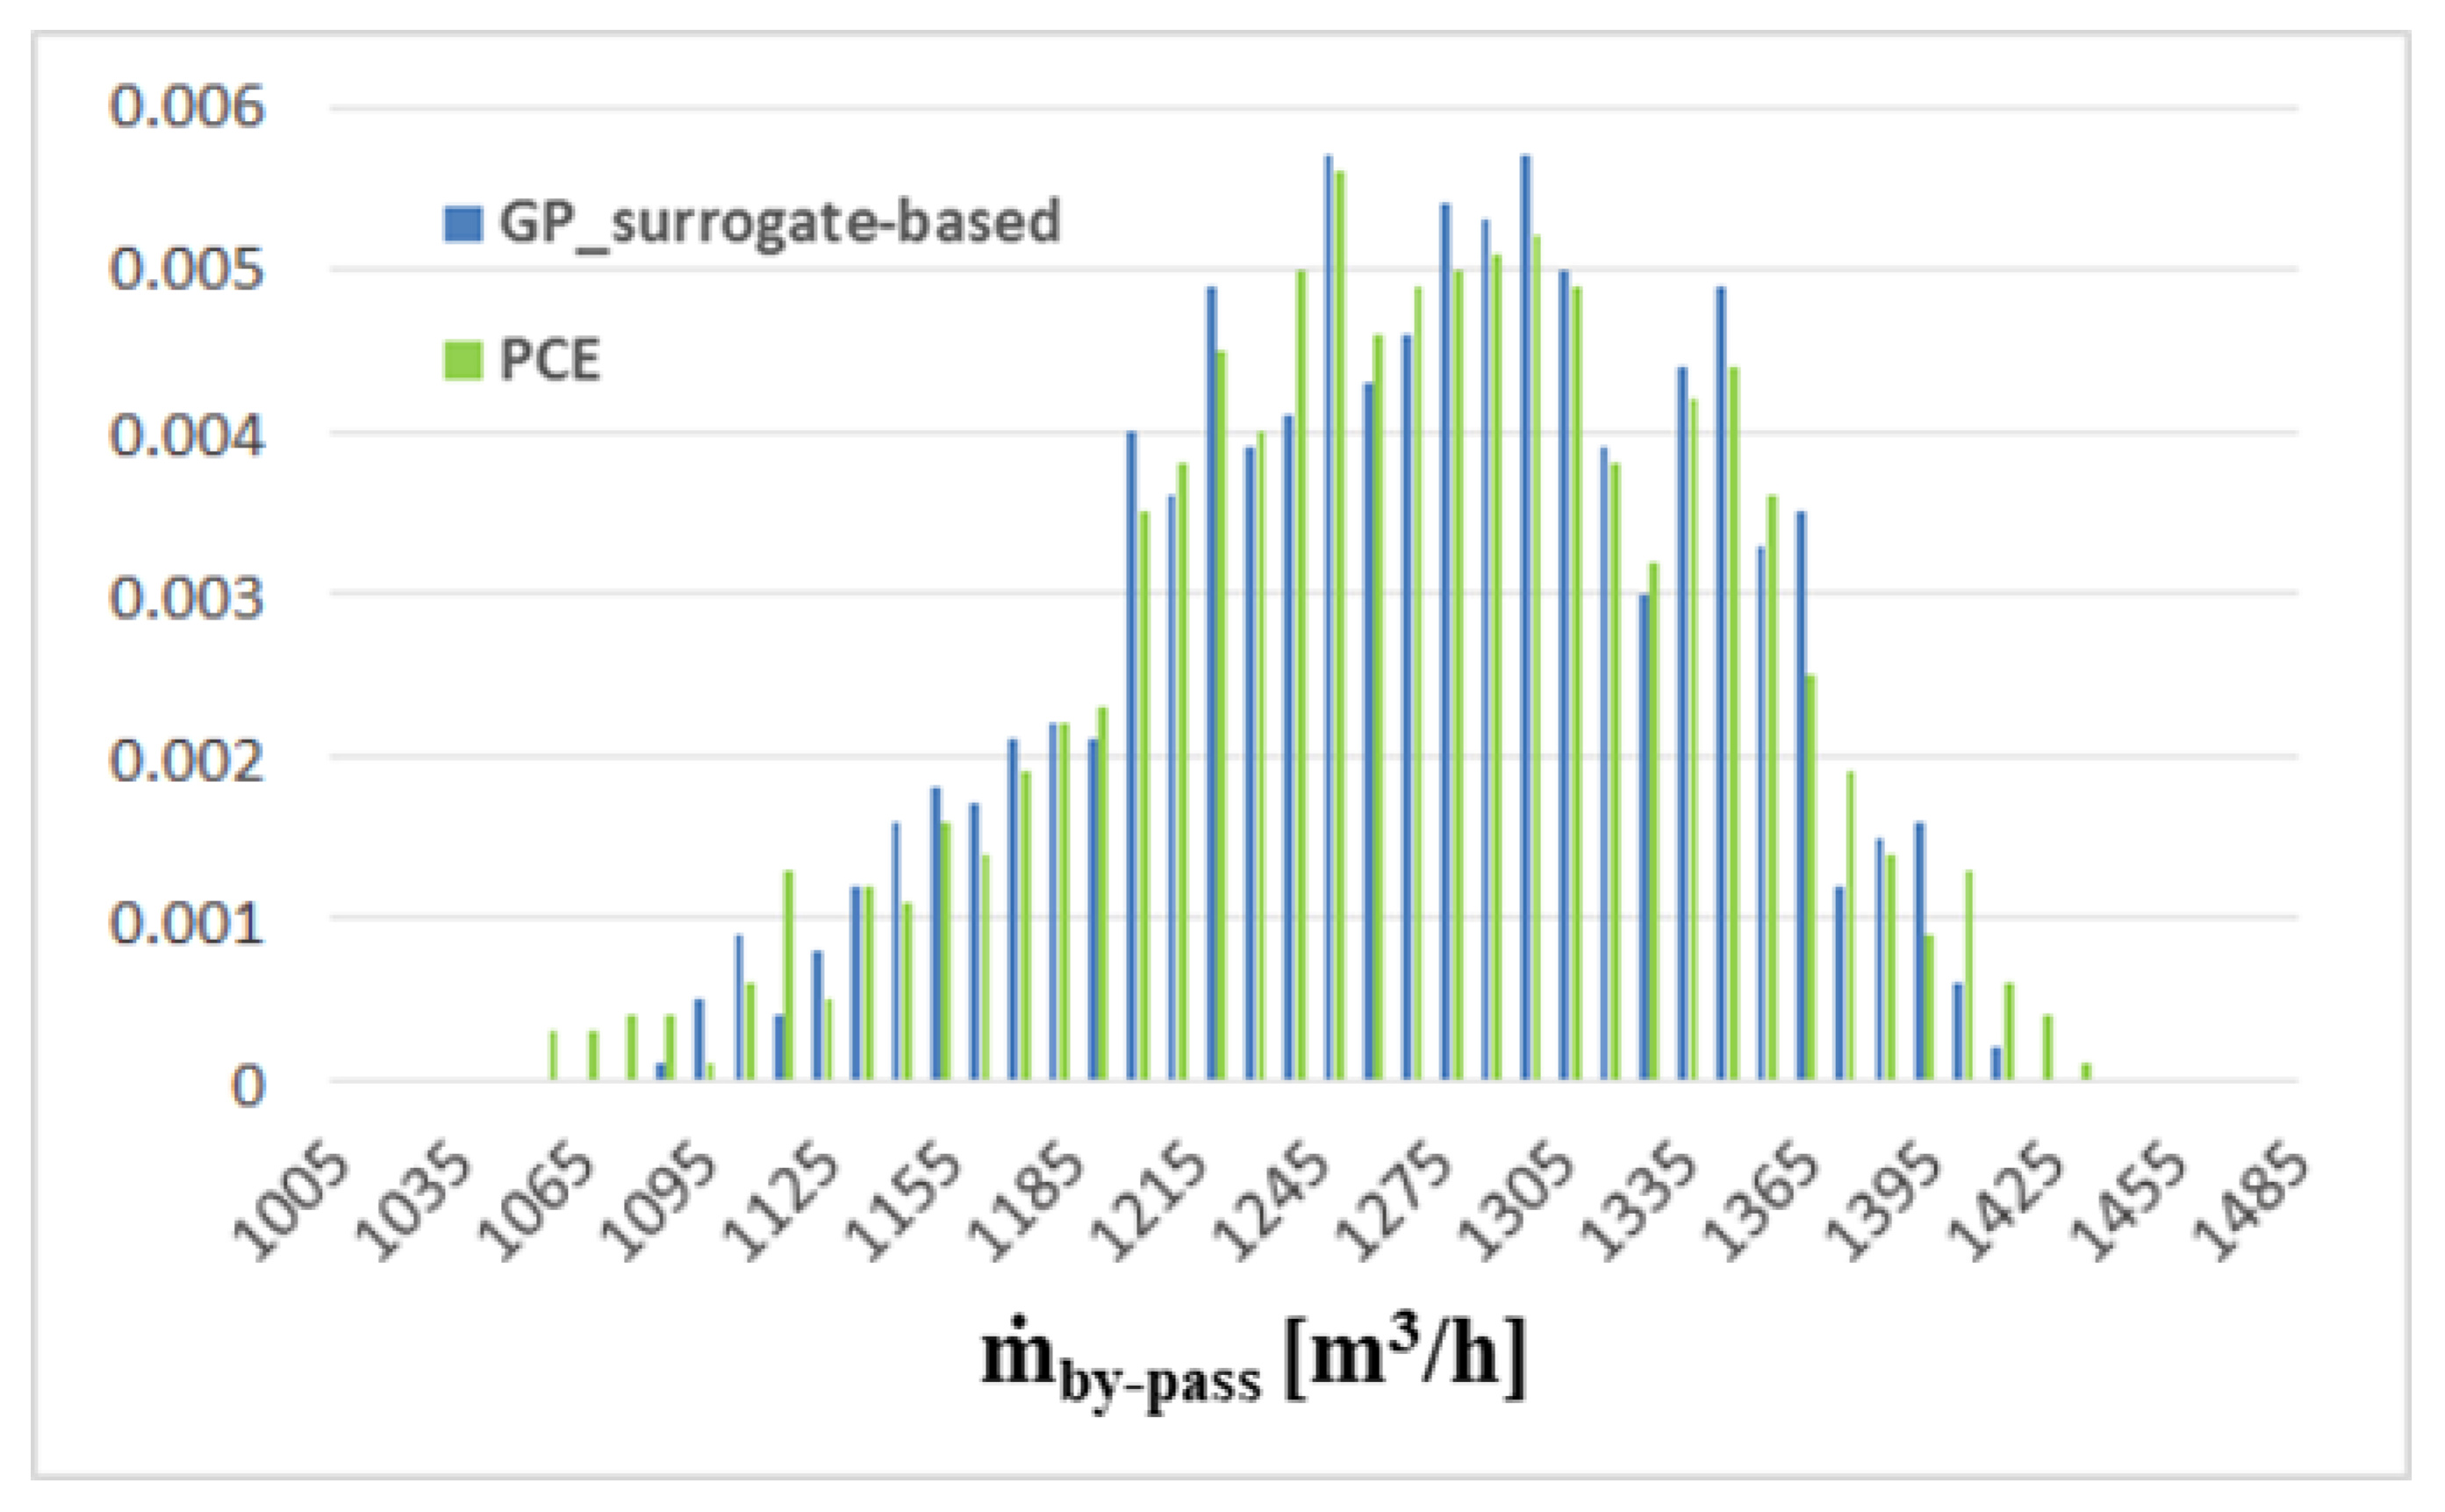
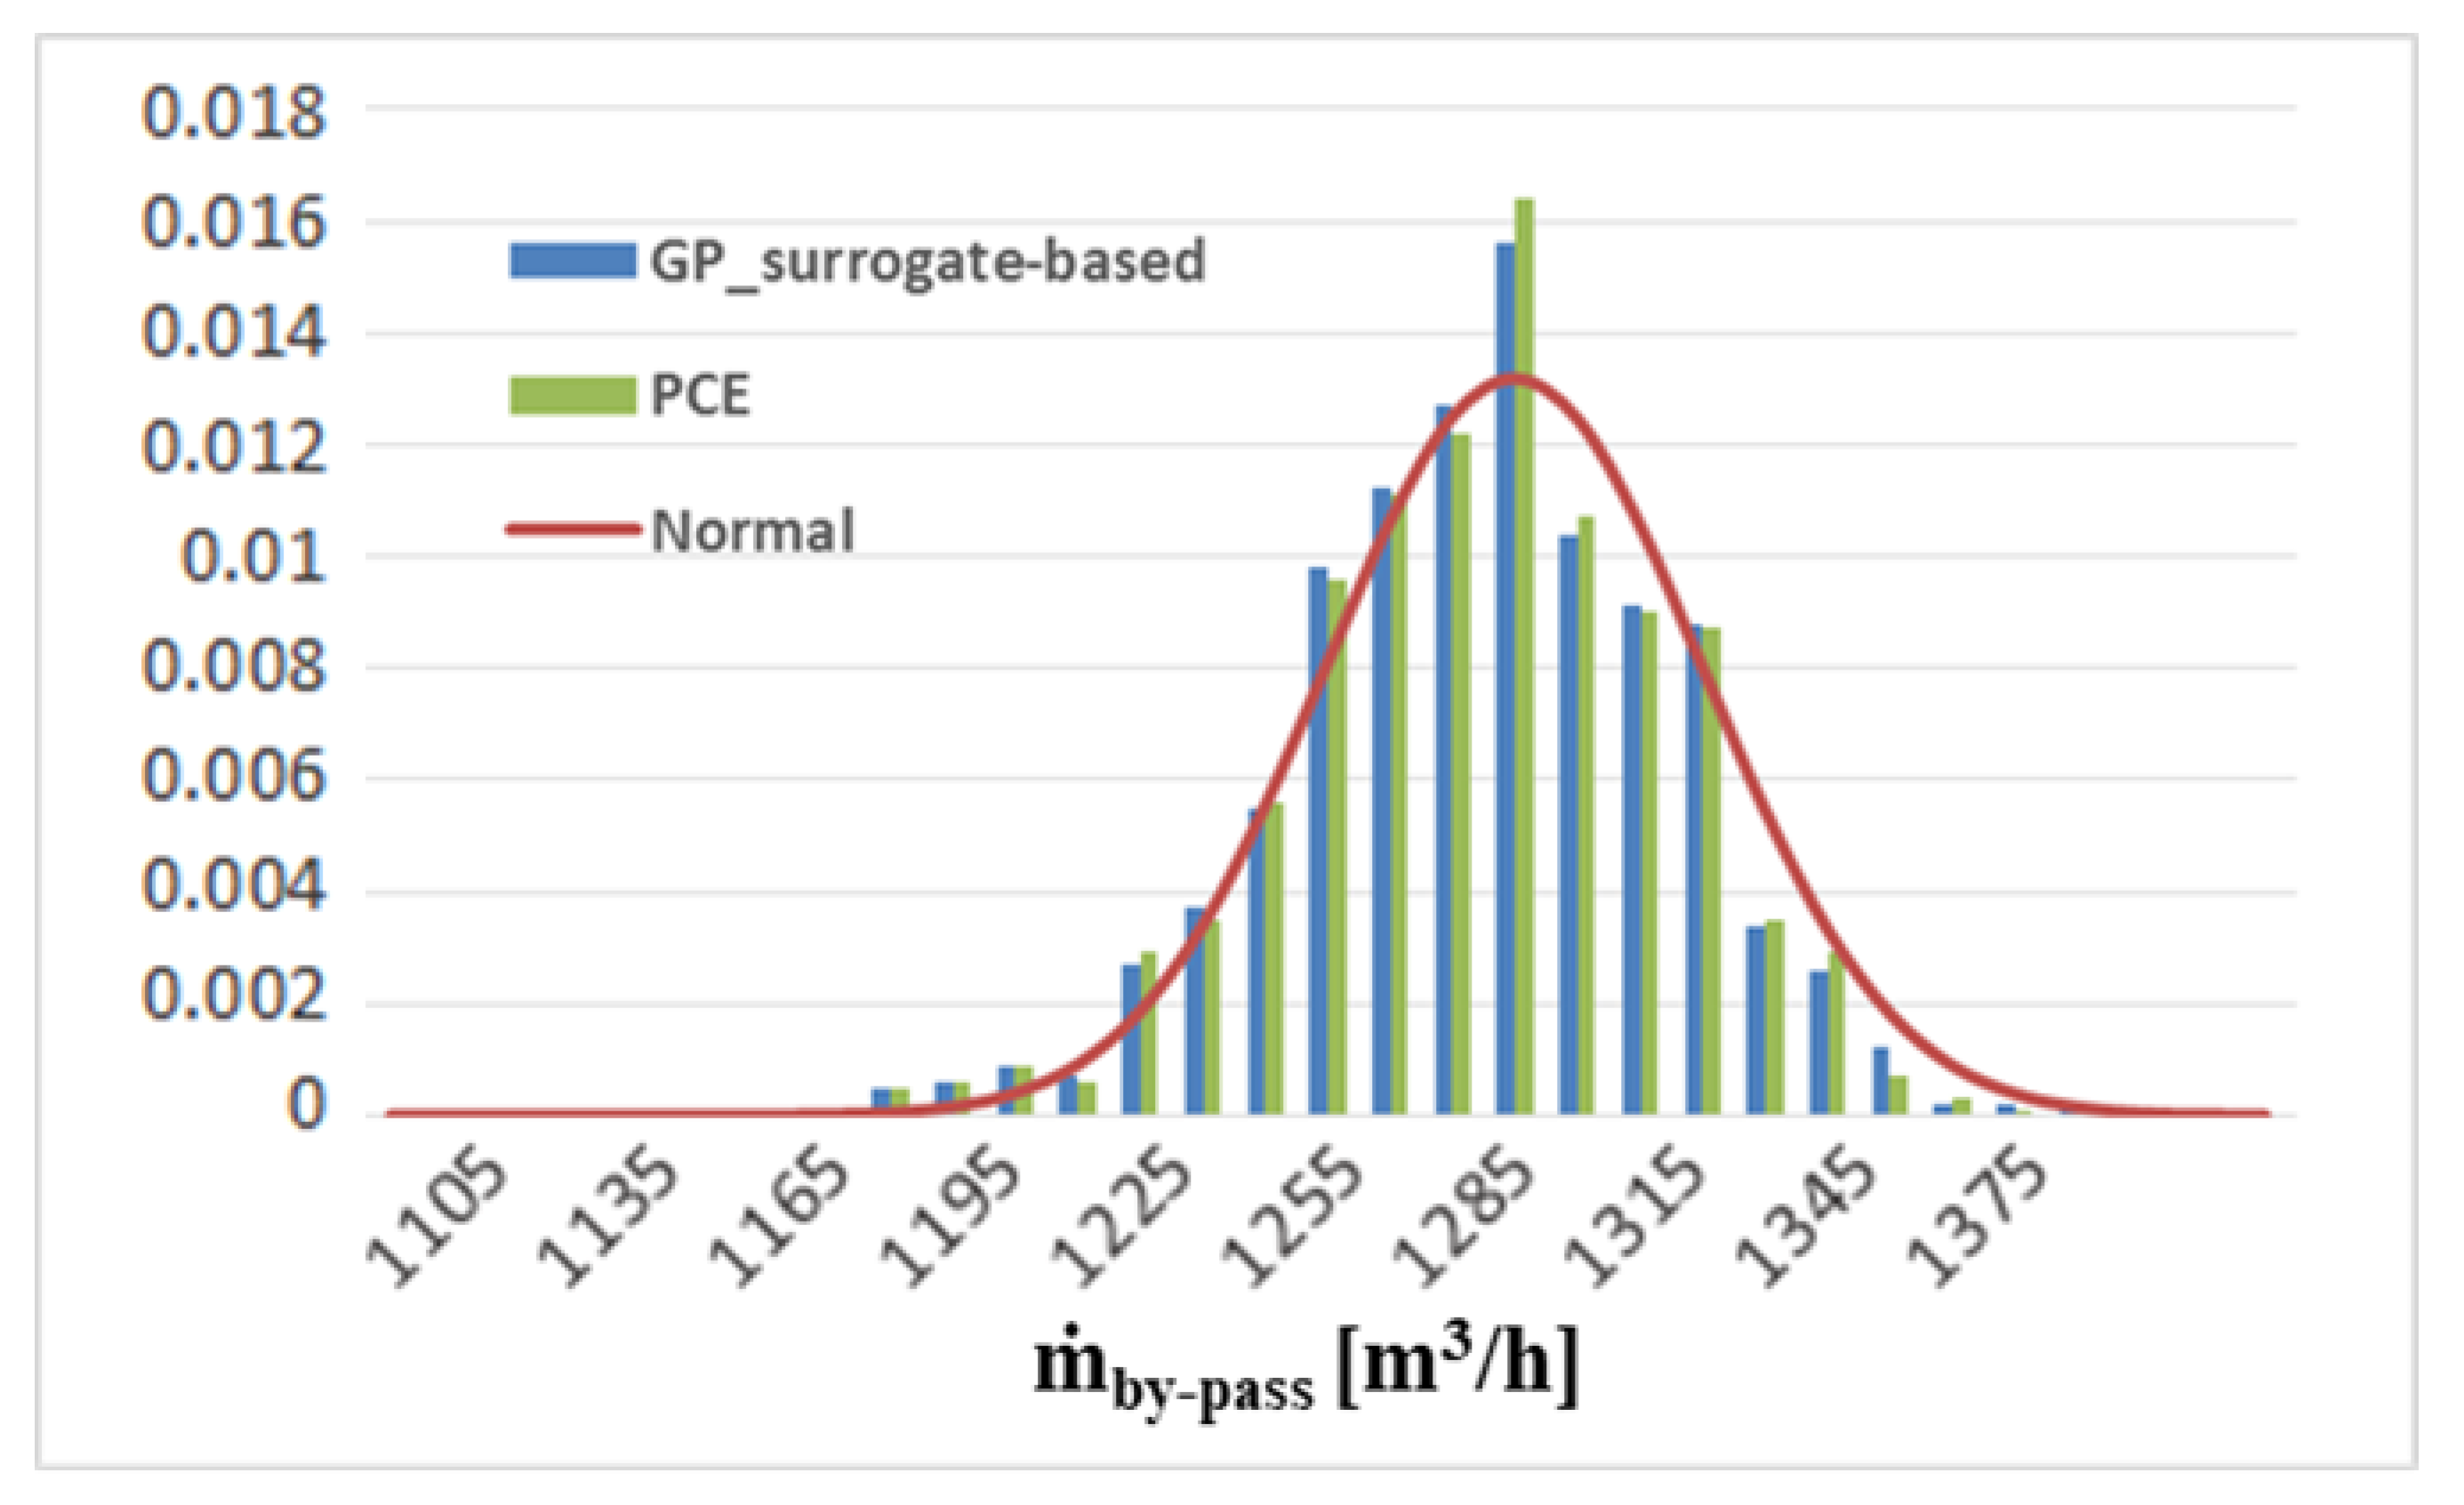
An alternative method to create a surrogate model to perform the UQ analysis involves the use of Polynomial Chaos Expansions (PCE): it is based on the approximation of the response through a base of orthogonal polynomials, known as the Wiener-Askey scheme, which determines an optimal basis for multiple continuous probability distributions [41]. In general, the PCE method is advantageous when the number of variables is limited because the same results can be obtained with much less simulations from the high-fidelity case (fully 3D CFD). Only 16 CFD simulations were considered (half of those used for the GP), to set up the PCE and the UQ analysis was carried out on the surrogate model obtained with a series of 1000 samples. The results obtained for the uniform and normal distribution of the two input variables are presented in Figure 12 and Figure 13 and compared with the previous results. The results are essentially identical in both cases confirming the higher efficiency of the PCE approach with respect to standard response surfaces (kriging) generated from a rich (time consuming) DoE.
From the UQ analysis emerged that the uncertainty on the mass flow rates of the air injectors, which represent the inputs of the CFD simulations, marginally affects the mass flow rate in the bypass duct. In fact, from the probability distributions it can be seen that, especially in the case of input normal distribution, the percentage of uncertainty on the ṁbypass is very limited, making the most probable values limited to a narrow range. The Polynomial Chaos method gave the same results in terms of probability distribution but with a number of CFD simulations necessary much lower.

7. Optimization Process to Support System Operation Management

When evaluating the performance of the air staging system, it is also necessary to consider the effect that it has on the flow distribution at the inlet section of the stacks. It is important to evaluate the uniformity of the flow and chemical composition. To quantify the above aspect a uniformity index γ has been introduced as suggested by Om Ariara Guhan C.P. et al. [46]. In the above work the index is defined with the aim of evaluating the uniformity of the flow within an exhaust gas after-treatment system of an internal combustion engine. The equation used at a discrete level to calculate the index is represented in Equation (6):
γ = 1 1 2 i | U i U a v g | A i A 0 U a v g
In the above reference case, the flow velocity is considered, in our case it is readjusted using the oxygen concentration values on the inlet discretized section of the stacks. The formulation is then adjusted as in Equation (7).
γ O 2 = 1 1 2 i | O 2   i O 2   a v g | A i A 0 O 2   a v g
where: O2i is the concentration of O2 on the i-th discretization surface, O2avg is the average concentration over the entire stack entrance surface, Ai is the i-th surface into which the control surface has been divided and A0 is the total stacking entrance area. The checkers inlet zone has been discretized as previously shown in Scheme 1.
An optimization strategy has been developed to support the optimal operation setting of the system in terms of injected mass flow rates. The final goal is to minimize the total injected air mass flow (minimize the energy consumption and thermal problems) and to maximize the flow uniformity (oxygen distribution) at the checkers inlet section, in order to reach the best performance for the pollution reduction system. First, a multi-objective optimization was carried out using the response surfaces obtained for the bypass mass flow rate and the γO2 coefficient. The algorithm used for optimization is a standard multi-objective genetic algorithm available in the Dakota platform.
The resulting Pareto sets for the optimal values of the two goals are reported on the respective response surfaces in Figure 14 and Figure 15 with red cross symbols, while in Figure 16 are reported the populations obtained from optimization and Pareto Front. The optimal conditions are reached towards the boundaries of the surfaces for high values of the flow rate of the pros injector (always around the maximum value of 160 [m3/h]) and medium-low values of the flow rate against the main stream.
Multi-objective optimization allows us to evaluate the best performance of the system by considering the two combined contributions of the uniformity index and the bypass flow rate. It is clear that the air staging system works in optimal conditions for high values of the flow rate of the pros injector and at the same time medium-low values for the cons.
The optimization carried out led to the use of the maximum mass flow rate of the injector in favor of the flow. However, this scenario can be costly, since the m ˙ p r o involves the highest external compressed air contribution, which in fact is one of the most important system life management costs. To take also this aspect into account, a cost function has been introduced that this time (unlike bypass and γO2) must be minimized. The expression of the cost function is represented in Equation (8) and considers the flow rates of the injectors weighted with a coefficient (higher for the pros injector):
F c o s t = ( φ 1   m ˙ p r o + φ 2   m ˙ c o n s )
where φ1 and φ2 are, respectively, 1.0 and 0.5, because the pros injector is more important because it drives the flow into the bypass duct.
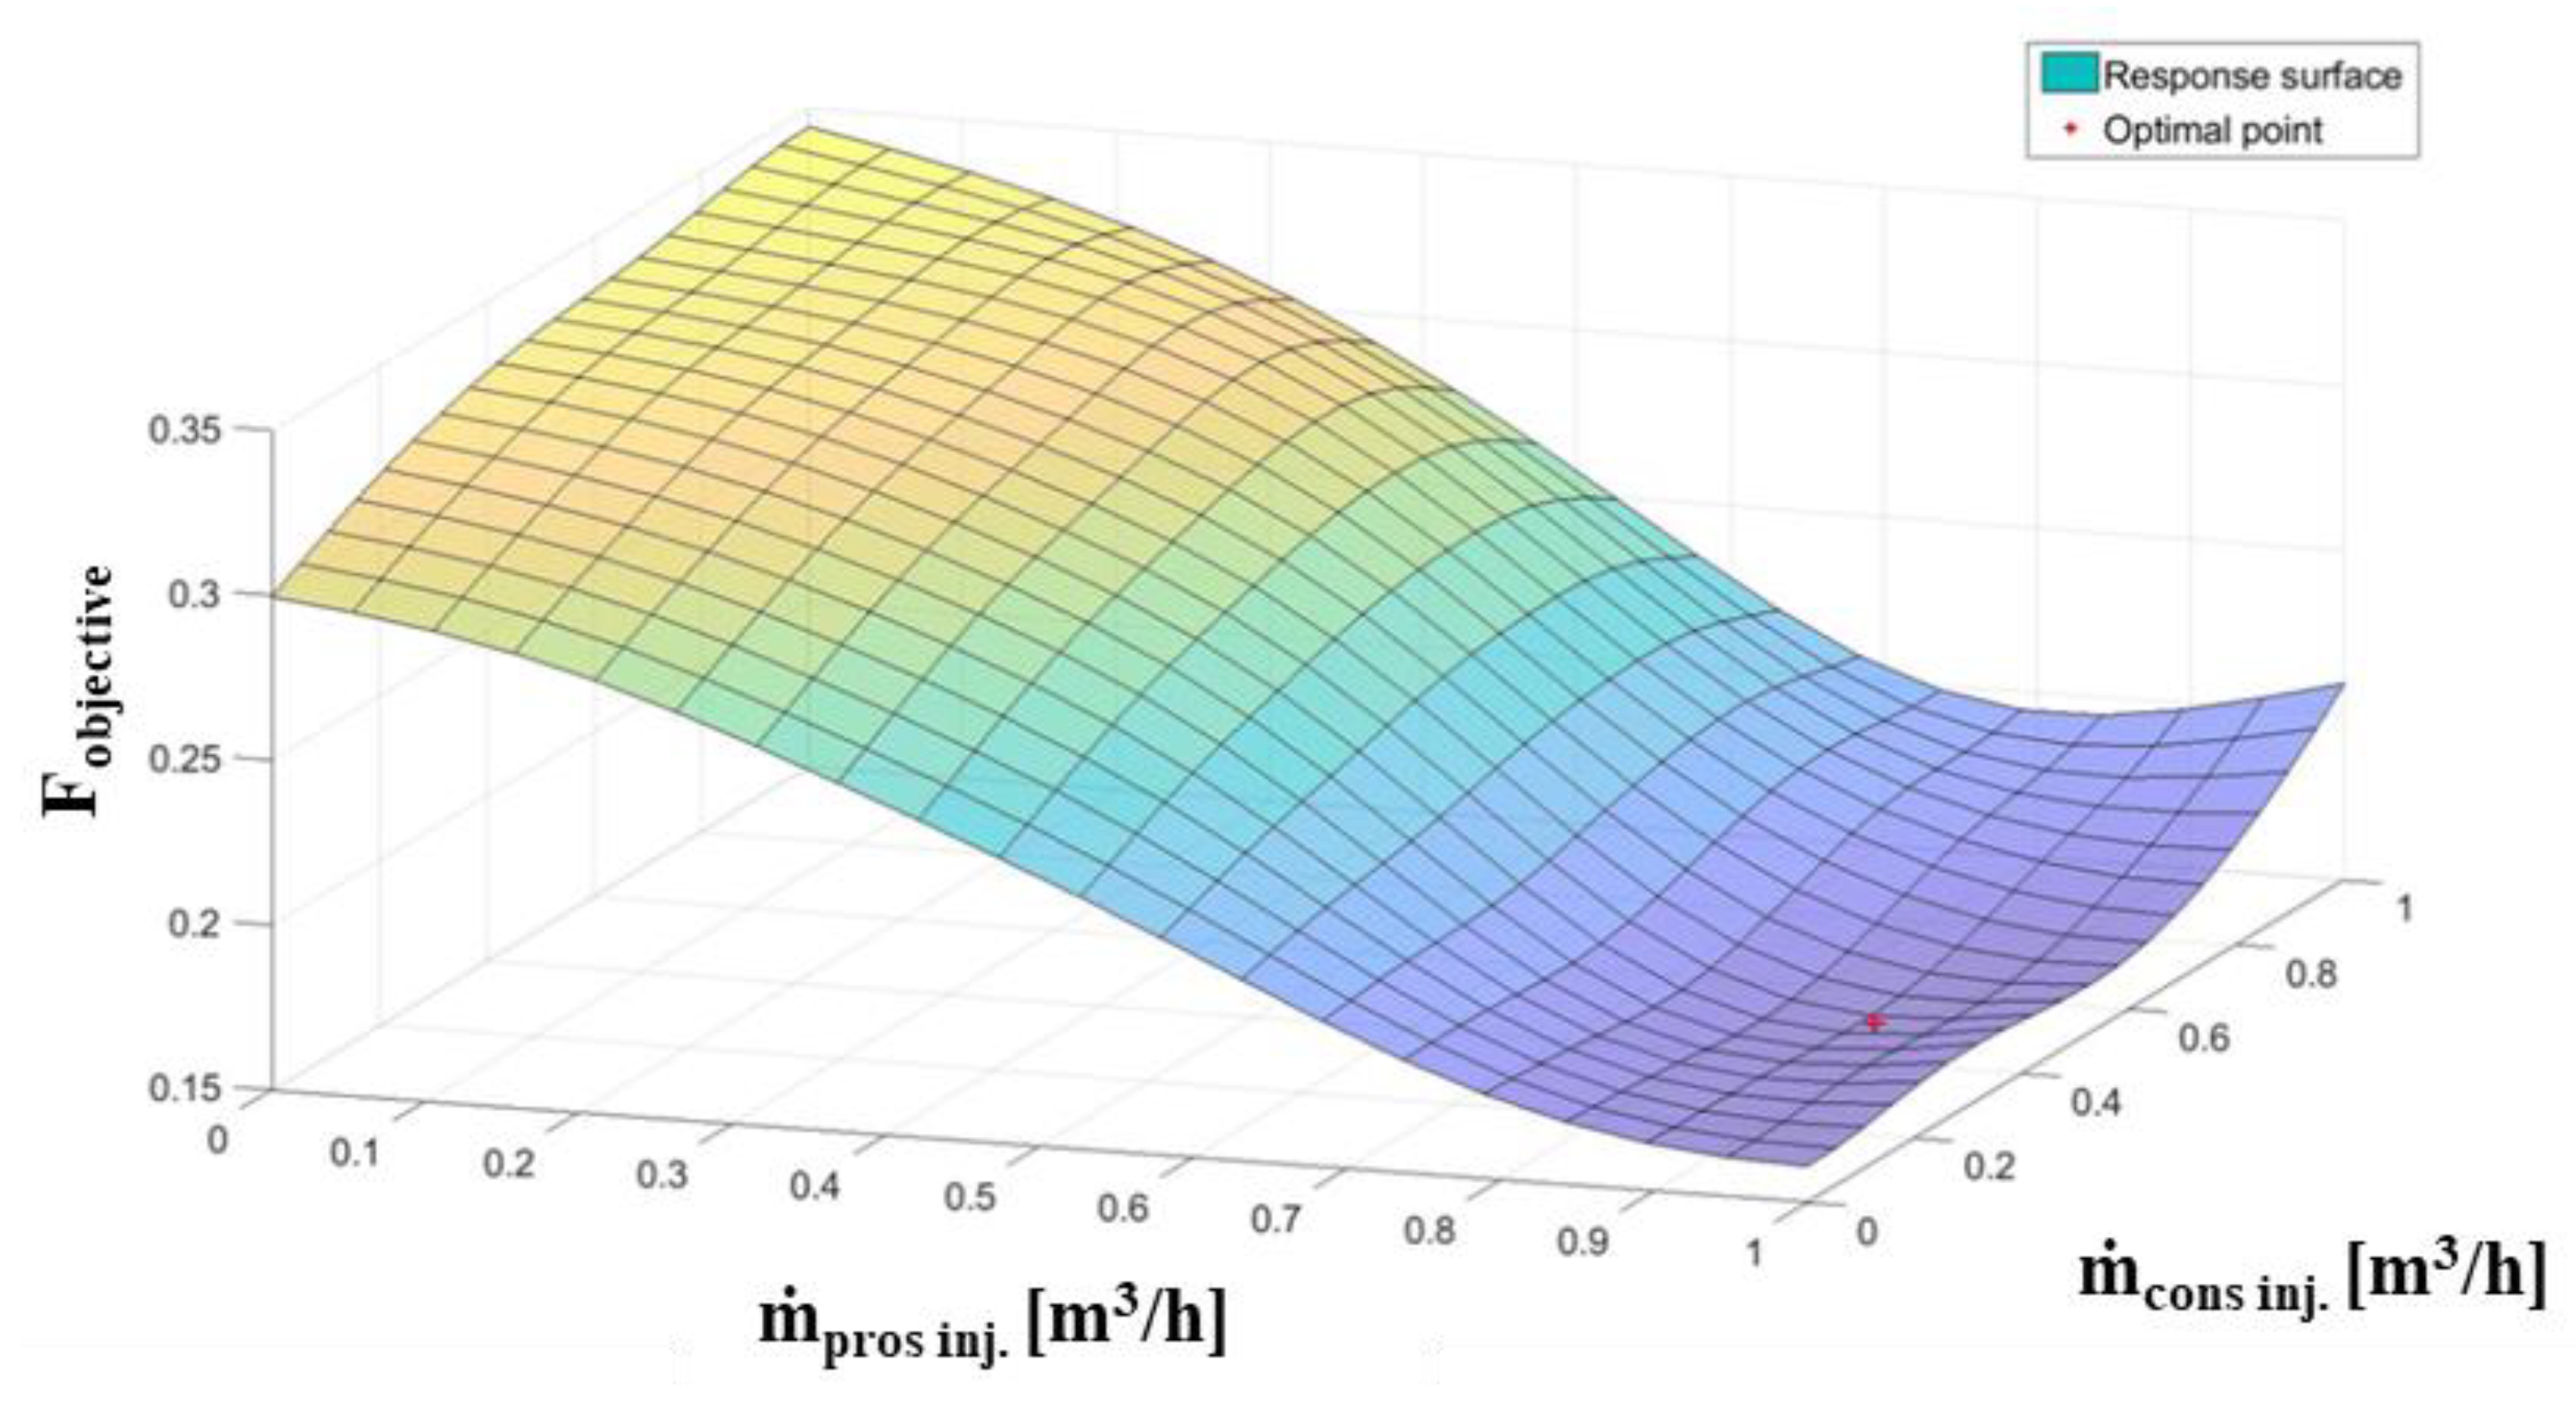
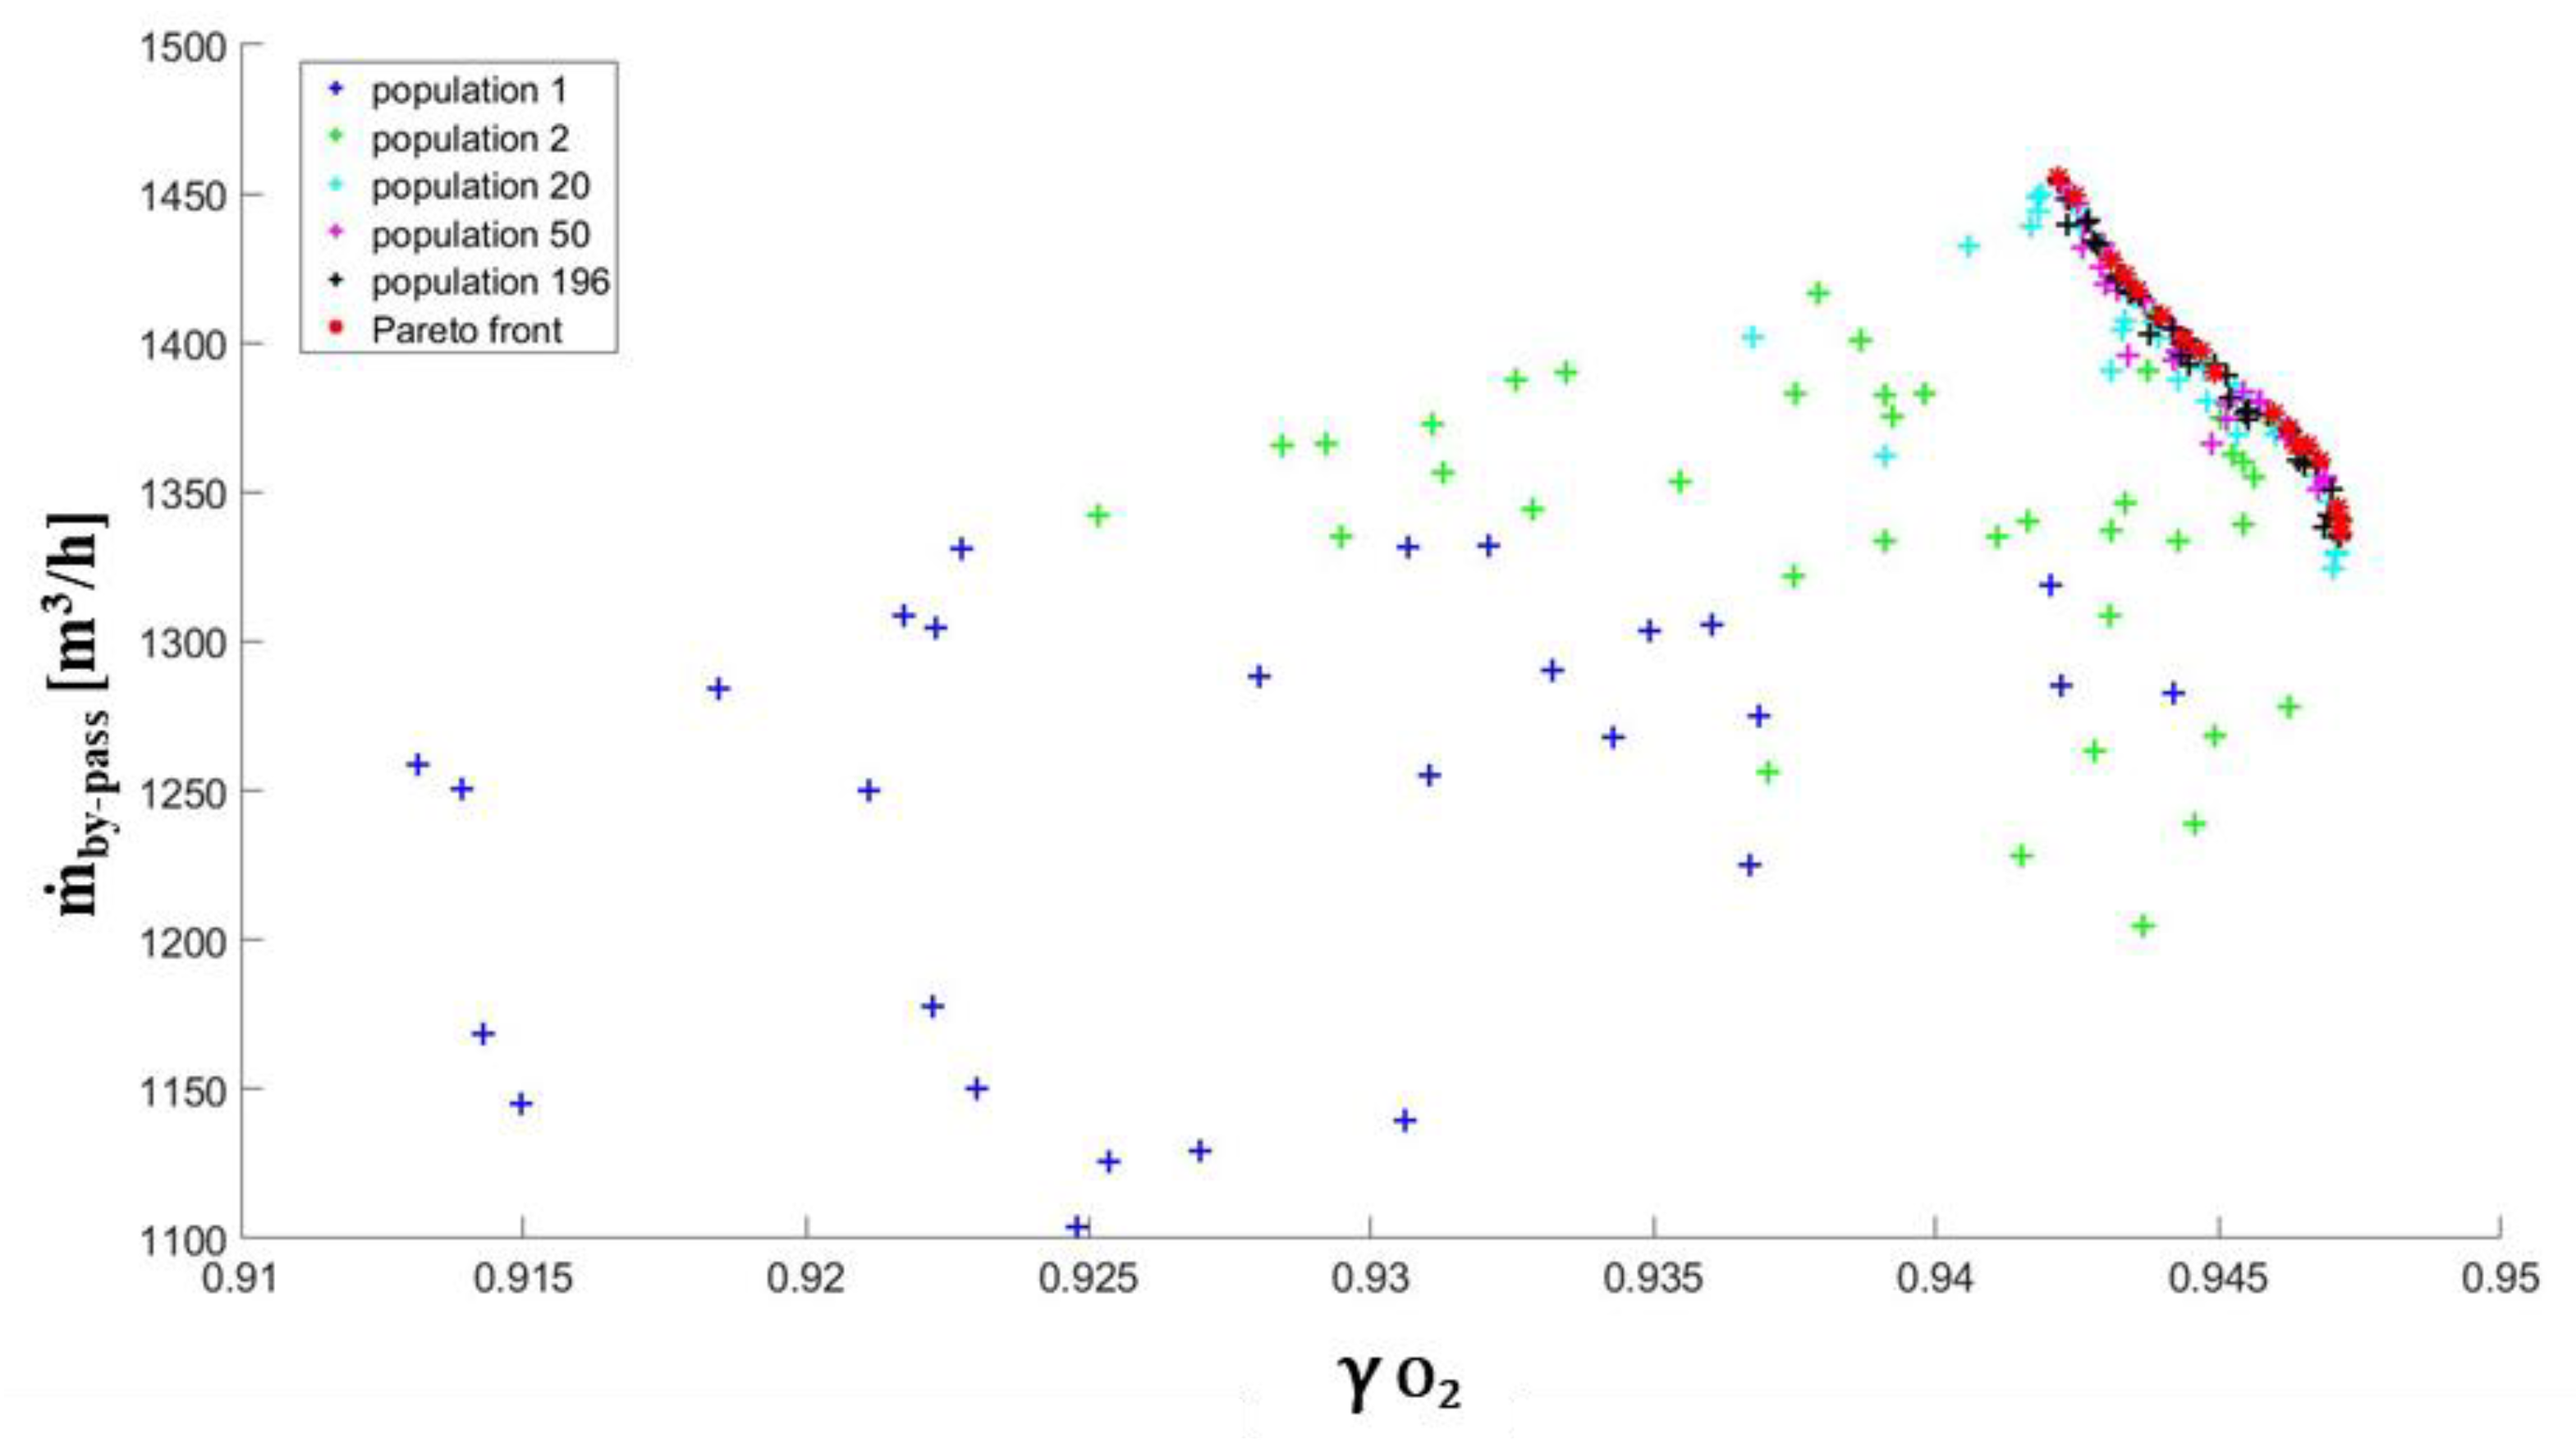
A multi objective optimization process with three distinct objectives is difficult to tackle and it is particularly cumbersome to interpret and understand the results and to select the optimum on the resulting Pareto set. Therefore, a single objective optimization has been performed after the definition of the appropriate objective function obtained as a linear combination of the three concurring goals, Fobjective in Equation (9). The weights in the linear combination are set by the user to give more space to a selected goal if required. In particular, ξ1 = 0.9, ξ2 = 0.2 and 
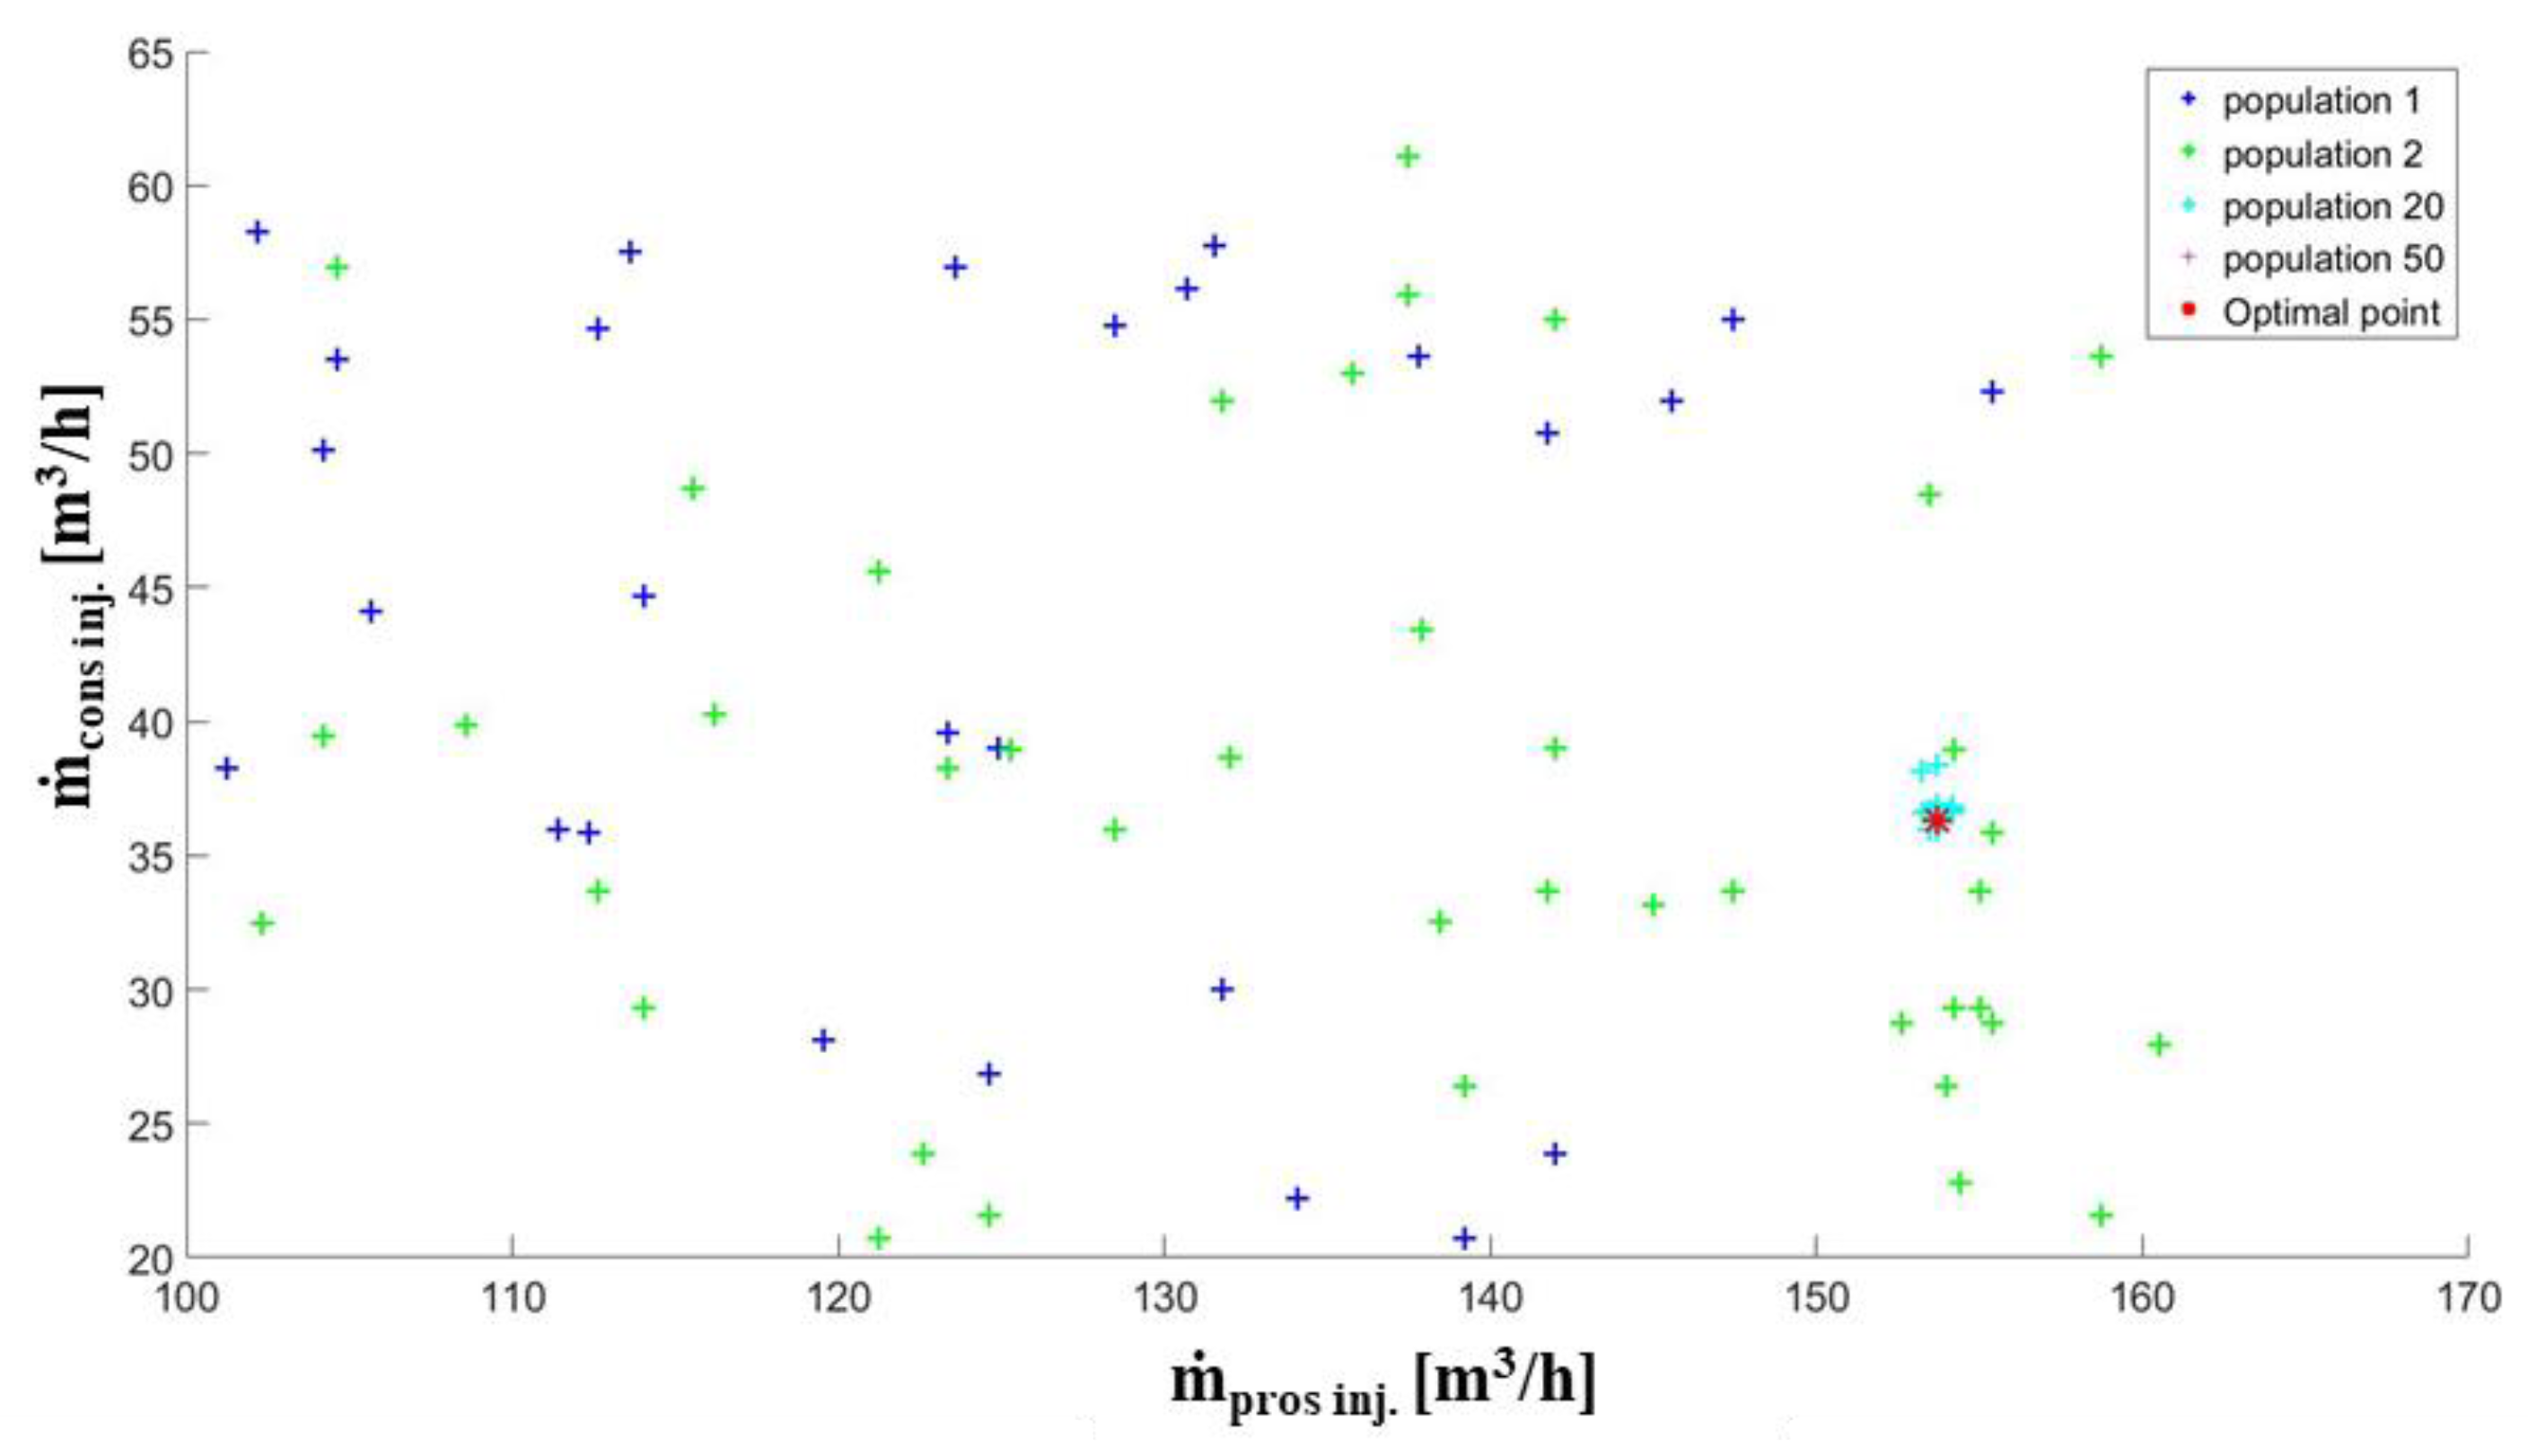
ξ3 = 0.6; the oxygen uniformity index is more important for its influence in the regenerator to mix the exhaust gases for the pollutant reduction. The cost function is introduced because of the injectors mass flow rate to control the flow in the bypass duct. In this case, a genetic algorithm was used. After the generation of 58 starting populations (Figure 17) the optimization converged to the optimal result represented in Figure 18 and Table 5. The result is presented in a dimensionless form and corresponds to the values of the objective functions of γO2 = 0.9446 and bypass = 1374 [m3/h].
The optimal point is again positioned toward high flow rates for the pros and for medium-low flow rates for the cons.
F o b j e c t i v e = ( ξ 1   ( 1 / γ O 2 ) + ξ 2   ( 1 / m ˙ b y p a s s ) + ξ 3 F c o s t )

8. Conclusions

A hybrid air staging system in a regenerative glass production plant has been designed to reduce NOx emissions. The CFD simulations are used to understand the flow structure and the performance of the baseline case. The paper has demonstrated the use of response surfaces as a valuable approach to support the design and operation of the system to optimize performance and minimize costs. The use of the surrogate models to predict the mass flow rates through the air staging system or to identify the optimal operating condition for the pros and cons air streams, can be considered an Artificial Intelligence tool that could be embedded into a software module to support the decision-making process. A surrogated model has been created to perform sensitivity analysis for the uncertainty quantification and to develop an optimization process to support operation at minimum costs. The UQ analysis has highlighted that the uncertainty related to the injected mass flow rates of the air, marginally affects the final bypass duct mass flow rate. The optimization procedure has identified the conditions for which the bypass mass flow rate and the uniformity of the oxygen concentration are optimized and the operating cost (total air mass flow rate) is minimized. This procedure has confirmed that the optimal conditions are reached for high values of the pros injector mass flow rate (always around the maximum value of 160 [m3/h]) and medium-low values of cons injector mass flow rate, revealing that a high level of external air contribution is necessary to exploit the air staging system. The use of the proposed approach in addition to the CFD reference modeling is very promising to support not only the design phase, but also the operation of the system for high performance and low energy (cost) consumption.

Author Contributions

C.C., D.D.D. and D.M. have equally contributed to the concept of the research activity, the setup of the model, the discussion of the results, and the writing of the paper. All authors have read and agreed to the published version of the manuscript.

Funding

This research was funded within the framework of the Italian national research project by Regione Puglia (Delibera di Giunta Regionale 1297 del 18/7/2018) titled “Sviluppo Forno Sagittario—soluzioni ibride innovative per la riduzione primaria e secondaria delle emissioni di NOx nella produzione di vetro per contenitori” for an innovative glass furnace installed in Vetrerie Meridionali Spa—Castellana Grotte (Bari)—Italy.

Institutional Review Board Statement

Not applicable.

Informed Consent Statement

Not applicable.

Data Availability Statement

Not applicable.

Conflicts of Interest

The authors declare no conflict of interest.

Nomenclature

ASurface area
ARAspect ratio: Length × height
kTurbulent kinetic energy
Mass flow rate
PStatic pressure
tTime
TTemperature
uVelocity
y+Non dimensional boundary layer distance from wall
γUniform index
εRate of dissipation of turbulent kinetic energy
ρDensity
τTensor of tangential and normal stress

References

  1. Galitsky, C.; Worrell, E.; Masanet, E.; Graus, W. Energy Efficiency Improvement and Cost Saving Opportunities for the Glass Industry. In Energy Star Guide for Energy and Plant Managers; No. LBNL-57335-Revision; Lawrence Berkeley National Lab. (LBNL): Berkeley, CA, USA, 2008. [Google Scholar]
  2. Schmitz, A.; Kaminski, J.; Scalet, B.M.; Soria, A. Energy consumption and CO2 emissions of the European glass industry. Energy Policy 2011, 39, 142–155. [Google Scholar] [CrossRef]
  3. Dogan, E.; Chishti, M.Z.; Alavijeh, N.K.; Tzeremes, P. The roles of technology and Kyoto Protocol in energy transition towards COP26 targets: Evidence from the novel GMM-PVAR approach for G-7 countries. Technol. Forecast. Soc. Chang. 2022, 181, 121756. [Google Scholar] [CrossRef]
  4. Aziz, G.; Sarwar, S.; Waheed, R.; Khan, M.S. Significance of hydrogen energy to control the environmental gasses in light of COP26: A case of European Countries. Resour. Policy 2023, 80, 103240. [Google Scholar] [CrossRef]
  5. Reboussin, Y.; Fourmigué, J.F.; Marthy, J.F.; Citti, O. A numerical approach for the study of glass furnace regenerators. Appl. Therm. Eng. 2005, 25, 2299–2320. [Google Scholar] [CrossRef] [Green Version]
  6. Yakinthos, K.; Missirlis, D.; Sideridis, A.; Vlahostergios, Z.; Seite, O.; Goulas, A. Modelling operation of system of recuperative heat exchangers for aero engine with combined use of porosity model and thermos-mechanical model. Eng. Appl. Comput. Fluid Mech. 2012, 6, 608–621. [Google Scholar] [CrossRef]
  7. Sardeshpande, V.; Anthony, R.; Gaitonde, U.N.; Banerjee, R. Performance analysis for glass furnace regenerator. Appl. Energy 2011, 88, 4451–4458. [Google Scholar] [CrossRef]
  8. Verheijen, O.; Habraken, A.; Gramberg, H. Modeling of Heat Transfer and Gas Flows in Glass Furnace Regenerators. In Proceedings of the 75th Conference on Glass Problems, Columbus, OH, USA, 3–6 November 2014; Greater Columbus Convention Center: Columbus, OH, USA, 2014; Volume 36, p. 1. [Google Scholar]
  9. Cravero, C.; Marsano, D. Numerical simulation of regenerative chambers for glass production plants with a non-equilibrium heat transfer model. WSEAS Trans. Heat Mass Transf. 2017, 12, 21–29. [Google Scholar]
  10. Selvaray, J.; Varun, V.S.; Vishwam, V. Waste heat recovery from metal casting and scrap preheating using recovered heat. Procedia Eng. 2014, 97, 267–276. [Google Scholar] [CrossRef] [Green Version]
  11. Cravero, C.; De Domenico, D.; Leutcha, P.J.; Marsano, D. Strategies for the numerical modelling of regenerative pre-heating systems for recycled glass raw material. Math. Model. Eng. Probl. IIETA 2019, 6, 324–332. [Google Scholar] [CrossRef] [Green Version]
  12. Scalet, B.M.; Garcia Muñoz, M.; Sissa, A.Q.; Roudier, S.; Delgado Sancho, L. Best Available Tecniques (BAT) Reference Document for The Manufacture of Glass. In Industrial Emission Directive 2010/75/EU; Integrated Pollution Prevention and Control; Joint Research Centre (JRC): Seville, Spain, 2013. [Google Scholar]
  13. Zeldovich, Y.B. The oxidation of nitrogen in combustion explosions. Acta Physiochim. 1946, 21, 577–628. [Google Scholar]
  14. Hayhurst, A.N.; Vince, I.M. Nitric oxide formation from N2 in flames: The importance of “prompt” NO. Prog. Energy Combust. Sci. 1980, 6, 35–51. [Google Scholar] [CrossRef]
  15. Bowman, C.T. Chapter 4: Chemistry of Gaseous Pollutant Formation and Destruction. In Fossil Fuel Combustion: A Source Book; John Wiley & Sons Inc.: New York, NY, USA, 1991. [Google Scholar]
  16. Skalska, K.; Miller, J.S.; Ledakowicz, S. Trends in NOx abatement: A review. Sci. Total Environ. 2010, 408, 3976–3989. [Google Scholar] [CrossRef] [PubMed]
  17. LIFE Project “LIFE 12ENV/IT/001020”. Available online: http://ec.europa.eu/environment/life/project/Projects (accessed on 1 January 2023).
  18. PRIMEGLASS LIFE Project. Available online: http://www.primeglass.it/ (accessed on 1 January 2023).
  19. Fathi, M.; Saray, R.K.; Checkel, M.D. The influence of Exhaust Gas Recirculation (EGR) on combustion and emissions of n-heptane/natural gas fueled Homogeneous Charge Compression Ignition (HCCI) engines. Appl. Energy 2011, 88, 4719–4724. [Google Scholar] [CrossRef]
  20. Agarwal, D.; Singh, S.K.; Agarwal, A.K. Effect of Exhaust Gas Recirculation (EGR) on performance, emission, deposits and durability of a constant speed compression ignition engine. Appl. Energy 2011, 88, 2900–2907. [Google Scholar] [CrossRef]
  21. Ghazikhani, M.; Feyz, M.E.; Joharchi, A. Experimental investigation of the exhaust gas recirculation effects on irreversibility and brake specific fuel consumption of indirect injection diesel engines. Appl. Therm. Eng. 2010, 30, 1711–1718. [Google Scholar] [CrossRef]
  22. Cravero, C.; Spoladore, A. Transient Numerical Simulation of Regenerative Systems with Waste Gas Recirculation Strategies in Glass Production Plant. Appl. Sci. 2019, 9, 1496. [Google Scholar] [CrossRef] [Green Version]
  23. Cravero, C.; De Domenico, D. The Use of CFD for the Design and Development of Innovative Configurations in Regenerative Glass Production Furnaces. Energies 2019, 12, 2455. [Google Scholar] [CrossRef] [Green Version]
  24. Cravero, C.; Mola, A.; Rollini, M.; Spinelli, L.; Battaglia, W.; Cattaneo, E. Designing and implementing a high efficiency furnace system. Glass Int. 2021, 44, 41–46. [Google Scholar]
  25. Spliethoff, H.; Greul, U.; Rüdiger, H.; Hein, K.R. Basic effects on NOx emissions in air staging and reburning at a bench-scale test facility. Fuel 1996, 75, 560–564. [Google Scholar] [CrossRef]
  26. Staiger, B.; Unterberger, S.; Berger, R.; Hein, K.R. Development of an air staging technology to reduce NOx emissions in grate fired boilers. Energy 2005, 30, 1429–1438. [Google Scholar] [CrossRef]
  27. Fan, W.; Lin, Z.; Kuang, J.; Li, Y. Impact of air staging along furnace height on NOx emissions from pulverized coal combustion. Fuel Process. Technol. 2010, 91, 625–634. [Google Scholar] [CrossRef]
  28. Houshfar, E.; Lovas, T.; Skreiberg, O. Experimental investigation on NOx reduction by primary measures in biomass combustion: Straw, peat, sewage sludge, forest residues and wood pellets. Energies 2012, 5, 270–290. [Google Scholar] [CrossRef] [Green Version]
  29. Biedermann, F.; Brunner, T.; Obernberger, I.; Sippula, O.; Boman, C.; Öhman, M. Summary and evaluation of existing strategies on air staging strategies. In Report Produced as Part of the ERANET Futurebiotec Project; BIOENERGY 2020+ GmbH: Graz, Austria, 2010. [Google Scholar]
  30. Carroll, J.P.; Finnan, J.M.; Biedermann, F.; Brunner, T.; Obernberger, I. Air staging to reduce emissions from energy crop combustion in small scale applications. Fuel 2015, 155, 37–43. [Google Scholar] [CrossRef]
  31. Zha, Q.; Li, D.; Che, D. Numerical evaluation of heat transfer and NOx emissions under deep-air-staging conditions within a 600 MWe tangentially fired pulverized-coal boiler. Appl. Therm. Eng. 2017, 116, 170–181. [Google Scholar] [CrossRef]
  32. Zhou, C.; Wang, Y.; Jin, Q.; Chen, Q.; Zhou, Y. Mechanism analysis on the pulverized coal combustion flame stability and NOx emission in a swirl burner with deep air staging. J. Energy Inst. 2019, 92, 298–310. [Google Scholar] [CrossRef]
  33. Zadravec, T.; Rajh, B.; Kokalj, F.; Samec, N. CFD modelling of air staged combustion in a wood pellet boiler using the coupled modelling approach. Therm. Sci. Eng. Prog. 2020, 20, 100715. [Google Scholar] [CrossRef]
  34. Campora, U.; Capelli, M.; Cravero, C.; Zaccone, R. Metamodels of a Gas Turbine Powered Marine Propulsion system for Simulation and Diagnostic Purposes. J. Nav. Arch. Mar. Eng. 2015, 12, 1–14. [Google Scholar] [CrossRef] [Green Version]
  35. Launder, B.E.; Spalding, D.B. Mathematical Models of Turbulence; Academic Press: London, UK, 1972. [Google Scholar]
  36. Rodi, W. Turbulence Models and Their Application in Hydraulics. A State-of-the-Art Review, 3rd ed.; IAHR Monograph Series; Routledge: Rotterdam, The Netherlands, 2017. [Google Scholar]
  37. Baake, E.; Mühlbauer, A.; Jakowitsch, A.; Andree, W. Extension of the k-ε model for the numerical simulation of the melt flow in induction crucible furnaces. Metall. Mater. Trans. B 1995, 26, 529–536. [Google Scholar] [CrossRef]
  38. Cellek, M.S. Flameless combustion investigation of CH4/H2 in the laboratory-scaled furnace. Int. J. Hydrog. Energy 2020, 45, 35208–35222. [Google Scholar] [CrossRef]
  39. ANSYS Inc. Ansys Fluent Theory Guide v.17; ANSYS Inc.: Canonsburg, PA, USA, 2016. [Google Scholar]
  40. Cademartori, S.; Cravero, C.; Marini, M.; Marsano, D. CFD Simulation of the Slot Jet Impingement Heat Transfer Process and Application to a Temperature Control System for Galvanizing Line of Metal Band. Appl. Sci. 2021, 11, 1149. [Google Scholar] [CrossRef]
  41. Adams, B.M.; Bohnhoff, W.J.; Dalbey, K.R.; Eddy, J.P.; Ebeida, M.S.; Eldred, M.S.; Frye, J.R.; Gerarci, G.; Hooper, R.W.; Hough, P.D.; et al. Dakota, a Multilevel Parallel Object-Oriented Framework for Design Optimization, Parameter Estimation, Uncertainty Quantification and Sensitivity Analysis; Version 6.11 User’s Manual; Sandia National Laboratories: Albuquerque, NM, USA, 2019.
  42. Helton, J.C.; Davis, F.J. Latin hypercube sampling and the propagation of uncertainty in analyses of complex systems. Reliab. Eng. Syst. Saf. 2003, 81, 23–69. [Google Scholar] [CrossRef] [Green Version]
  43. Helton, J.C.; Johnson, J.D.; Sallaberry, C.J.; Storlie, C.B. Survey of sampling-based methods for uncertainty and sensitivity analysis. Reliab. Eng. Syst. Saf. 2006, 91, 1175–1209. [Google Scholar] [CrossRef] [Green Version]
  44. McKay, M.D.; Beckman, R.J.; Conover, W.J. A comparison of three methods for selecting values of input variables in the analysis of output from a computer code. Technometrics 2000, 42, 55–61. [Google Scholar] [CrossRef]
  45. Cravero, C.; De Domenico, D.; Ottonello, A. Uncertainty Quantification Approach on Numerical Simulation for Supersonic Jets Performance. Algorithms 2020, 13, 130. [Google Scholar] [CrossRef]
  46. Om Ariara Guhan, C.P.; Arthanareeswaran, G.; Varadarajan, K.N.; Krishnan, S. Numerical optimization of flow uniformity inside an under body- oval substrate to improve emissions of IC engines. J. Comput. Des. Eng. 2016, 3, 198–214. [Google Scholar] [CrossRef]
Figure 1. Plant layout of a regenerative end-port glass furnace.
Fluids 08 00076 g001
Figure 2. Layout of Hybrid air staging with the two injectors.
Fluids 08 00076 g002
Figure 3. Cut plane of the unstructured mesh used in the top chamber of the regenerator with a zoom in the bypass duct.
Fluids 08 00076 g003
Figure 4. Scheme of the boundary conditions set on the fluid domain.
Fluids 08 00076 g004
Figure 5. Detail of the flow structure: velocity streamline in the top chamber from the injectors.
Fluids 08 00076 g005
Figure 6. Oxygen mass fraction contours at the top chamber for the baseline case.
Fluids 08 00076 g006
Scheme 1. Oxygen mass fraction values on sectors controls of top chambers.
Fluids 08 00076 sch001
Figure 7. DoE of the bypass mass flow rate.
Fluids 08 00076 g007
Figure 8. Response surface of the bypass mass flow rate obtained with the 64 samples of the DoE (highlighted with the black crosses).
Fluids 08 00076 g008
Figure 9. Histogram of the output PDF considering a uniform distribution for input variables.
Fluids 08 00076 g009
Figure 10. Pros and cons mass flow rate uncertainty distributions—input variables.
Fluids 08 00076 g010
Figure 11. Histogram of the output PDF considering a normal distribution for the input variables.
Fluids 08 00076 g011
Figure 12. Histogram of the output PDFs for the uniform input comparing the two methods explored.
Fluids 08 00076 g012
Figure 13. Histogram of the output PDFs for the normal input comparing the two methods explored.
Fluids 08 00076 g013
Figure 14. Uniformity index response surface and optimal points.
Fluids 08 00076 g014
Figure 15. Bypass mass flow rate response surface and optimal points.
Fluids 08 00076 g015
Figure 16. Populations obtained from optimization and Pareto Front.
Fluids 08 00076 g016
Figure 17. Optimization starting population.
Fluids 08 00076 g017
Figure 18. Optimal point on the objective function response surface.
Fluids 08 00076 g018
Table 1. Geometrical parameters of the reference regenerative chambers.
Geometrical ParametersValue
Aexhaust/Aair0.05
Aexhaust/Aexit0.1
Bottom chamber AR3.9
Top chamber AR1.5
Table 2. Geometrical parameters of the reference regenerative chambers.
Metricsbypass [m3/h]
Means quare error1.37
Average error0.61
Maximum error8.16
Table 3. Statistical moments of the input normal distributions for the pros and cons mass flow rate.
Geometrical Parameterspros [m3/h]cons [m3/h]
Mean13040
Standard Deviation55
Standard Deviation/Mean3.8%12.5%
Table 4. Statistical moments of the input normal distributions for the bypass mass flow rate.
Geometrical Parametersbypass [m3/h]
Mean1279
Standard Deviation30.2
Standard Deviation/Mean2.4%
Table 5. Optimal point obtained with the optimization of the sum objective function.
Pros Mass Flow Rate Non-Dimensional/DimensionalCons Mass Flow Rate Non-Dimensional/DimensionalObjective Function
0.9036/155.05 [m3/h]0.3999/36.90 [m3/h]0.1618
Disclaimer/Publisher’s Note: The statements, opinions and data contained in all publications are solely those of the individual author(s) and contributor(s) and not of MDPI and/or the editor(s). MDPI and/or the editor(s) disclaim responsibility for any injury to people or property resulting from any ideas, methods, instructions or products referred to in the content.

