

Path for Room-Temperature Superconductivity in Q-Carbon-Related Materials


Department of Materials Science and Engineering, North Carolina State University, Raleigh, NC 27695-7907, USA
C 2024, 10(1), 14; https://doi.org/10.3390/c10010014
Submission received: 30 August 2023
/
Revised: 26 December 2023
/
Accepted: 19 January 2024
/
Published: 30 January 2024
(This article belongs to the Section Carbon Materials and Carbon Allotropes)
Abstract
:We present the atomic structures and nonequilibrium synthesis of a new class of materials, where the basic structural unit is a diamond tetrahedron. When units of one, two, and three tetrahedra are randomly packed, we create distinct phases of amorphous Q-carbon. Four tetrahedra in two adjacent layers lead to crystalline diamond lattice, which has four missing tetrahedra alternately. When these four missing tetrahedra are filled, we create subunit cell of crystalline Q-diamond. Theoretical calculations show that the superconducting transition temperature (Tc) in 50 atomic % B-doped Q-diamond can reach room temperature at ambient pressures. This is consistent with our earlier results using low-loss EELS measurements in 50 atomic % B-doped Q-carbon, which had mostly amorphous QB3 phase mixed with some crystalline Q-diamond phase. These EELS results showed that the Tc for these samples was between 90 K and 300 K. Theoretical calculations of density of states, Eliashberg function, electron–phonon interaction parameter, and root-mean-square and logarithmic average of frequency in crystalline Q-diamond show Tc in the range of 268 K to 300 K, which is in complete agreement with our EELS results in QB3.
1. Introduction
Room-temperature superconductivity is the holy grail of solid-state physics and materials science, as it stands to revolutionize applications across the spectrum ranging from energy transmission and levitated trains to magnetic resonance imaging, nanosensing, and quantum computing [1,2]. The quest for room-temperature superconductivity at ambient pressures has intensified after considerable progress in metallic hydrogen-based systems under extreme pressures [3,4,5]. While superconductivity under extreme pressures may not lead to any practical applications, we can learn a lot in terms of basic mechanism of Bardeen–Cooper–Schrieffer (BCS) superconductivity. However, our focus here is on BCS superconductivity at ambient pressures. These are also known as class-1 superconductors with a basic mechanism involving electron–phonon interaction [1]. Since the BCS mechanism of superconductivity, based upon electron–phonon interaction, is well established, the path to high-temperature superconductivity is quite clear, albeit very challenging. For the case of strong electron–phonon coupling (λ > 1), superconducting transition temperature (Tc) is directly proportional to the square root of the bond strength to the atomic mass [1]. Using these guidelines, we have focused our search for higher Tc on sp3 and sp2 strongly bonded carbon-based materials, which are doped with appropriate dopants to provide free carriers and high density of states near the Fermi level. The non-BCS superconductors (also known as class-2 superconductors) include heavy Fermion systems [6], high-Tc cu prates [7], and layered iron pnictides [8,9].
Since the discovery of superconductivity by Kamerlingh Onnes in 1911 with the superconducting transition temperature (Tc) of 4.2 K in mercury [10], progress has been slow in obtaining higher Tc at ambient pressures. This is particularly so for the BCS superconductivity at ambient pressures based upon electron–phonon interaction [11]. As shown in Figure 1, the Tc increased very slowly from 4.2 K to 15 K for V3Si, 18.3 K for Nb3Sn, and 23.2 K for Nb3Ge, until 2001 with Tc = 39 K in MgB2 at ambient pressures [12]. From theoretical considerations, MgB2 is an optimally doped superconductor, making Tc = 39 K the highest possible in this system [13]. More recently, in 2017, B-doped Q-carbon showed a Tc of 37 K in 17 at% B-doped Q-carbon [14], and 55 K in 25 at% B-doped Q-carbon [15], thus surpassing the MgB2 record of 39 K at ambient pressures. The BCS Tc for QB2 phase (25 at% B) was found to be a record Tc of 55 K, and the Tc for QB3 (50 at% B) was estimated to room temperature. From the critical current density versus field measurements, the value of critical current density (Jc at 2 T) in 17% B-doped Q-carbon at 21 K was estimated to be 4.3 × 10⁷ A·cm−2. It was even more exciting to realize the possibility of Tc between 90 and 300 K in 50% B-doped amorphous Q-carbon from low-loss EELS measurements [16,17,18].
Since the experimental discovery in 1911, theoretical developments were slow until 1957, when Bardeen, Cooper, and Schrieffer developed a rather compete fundamental theory of superconductivity to relate superconducting transition temperature (Tc) directly with Debye temperature/phonon spectrum, density of states near the Fermi level, and electron–phonon interaction [11]. The BCS framework laid out a clear, albeit challenging, path for obtaining high Tc by enhancing Debye temperature, density of states near the Fermi level, and electron–phonon interaction [1,19,20]. According to the BCS framework, Tc = ΘD exp [−1/N(0) V], where ΘD is the Debye temperature, N(0) is the density of states near the Fermi level, and V is the carrier (electron or hole) interaction potential. The N(0) V is the electron–phonon interaction parameter λ, which should be corrected for electron–electron repulsion parameter µ*, which is small ~0.115 in diamond-related materials. This formulation is valid under the weak electron–phonon coupling limit, λ < 1. Under the strong electron–phonon coupling limit (λ > 1), Tc can be estimated as Tc = 0.183 < λ ωph2 >0.5, where ωph is averaged phonon frequency. The Tc can be also written as Tc = Σ (η/M)0.5, where M is averaged atomic mass and η is the McMillan–Hopfield parameter with units of spring constant and is related to the strength of the electronic response of electrons near the Fermi surface to atomic perturbations [1].
Thus, materials with higher stiffness and lower mass should provide the best hope for higher transition temperatures in BCS superconducting systems [1]. This framework led us to diamond-related materials with appropriate doping such as B and N to provide an ideal platform for achieving high-temperature superconductivity [14,15,16,17,18]. This is also correlated with the high Debye temperature ΘD for diamond, which is 2250 K compared to 443 K for graphite and 276 K for niobium. Despite this clear path to BCS high-temperature superconductivity in strongly bonded, light-mass materials, the highest Tc of only 11 K in B-doped diamond was achieved. It was realized that the transition temperature in diamond is limited primarily by the low equilibrium solubility limit of boron of 2.0 at% B and low dopant ionization efficiency [21]. This value of Tc can be enhanced further by increasing boron concentration into substitutional sites beyond the equilibrium solubility limit. To achieve these higher dopant concentrations, we need to employ highly nonequilibrium methods. This should enhance the density of states near the Fermi level as well as electron–phonon coupling constant. This challenge has been solved through our discovery of melting of pure and doped carbon with nanosecond lasers in an undercooled state and quenching to form Q-carbon or diamond [14,15,16,17,18]. Using this technique, Q-carbon, as well as diamond, can be doped far beyond thermodynamic equilibrium solubility limits via the solute trapping phenomenon during rapid quenching. During melting of B-doped carbon layers, carbon and dopant atoms are closely packed because of metallic bonding in liquid carbon. It should be emphasized that B atoms in a crystalline diamond lattice produce internal misfit strains which lead to the breaking up of Cooper pairs, as a Tc of only 17 K was achieved in 17% B-doped crystalline diamond [22]. The Q-carbon is more tolerant to internal strains due to boron because of its random packing of tetrahedra, and thus higher superconducting transition temperatures are achieved in amorphous B-doped Q-carbon [14,15,16,17,18].
This paper discusses the design and creation of novel covalently bonded carbon materials with Tc to room temperature at ambient pressures. Since these carbon and diamond-related materials are metastable at ambient temperatures and pressures, novel nonequilibrium processing methods are used to create these materials in a phase-pure form. We also address doping of these materials beyond the thermodynamic solubility limits and control of internal strains due to dopant size misfit with the host lattice to enhance Tc.
2. Design of Q-Carbon- and Diamond-Related Materials
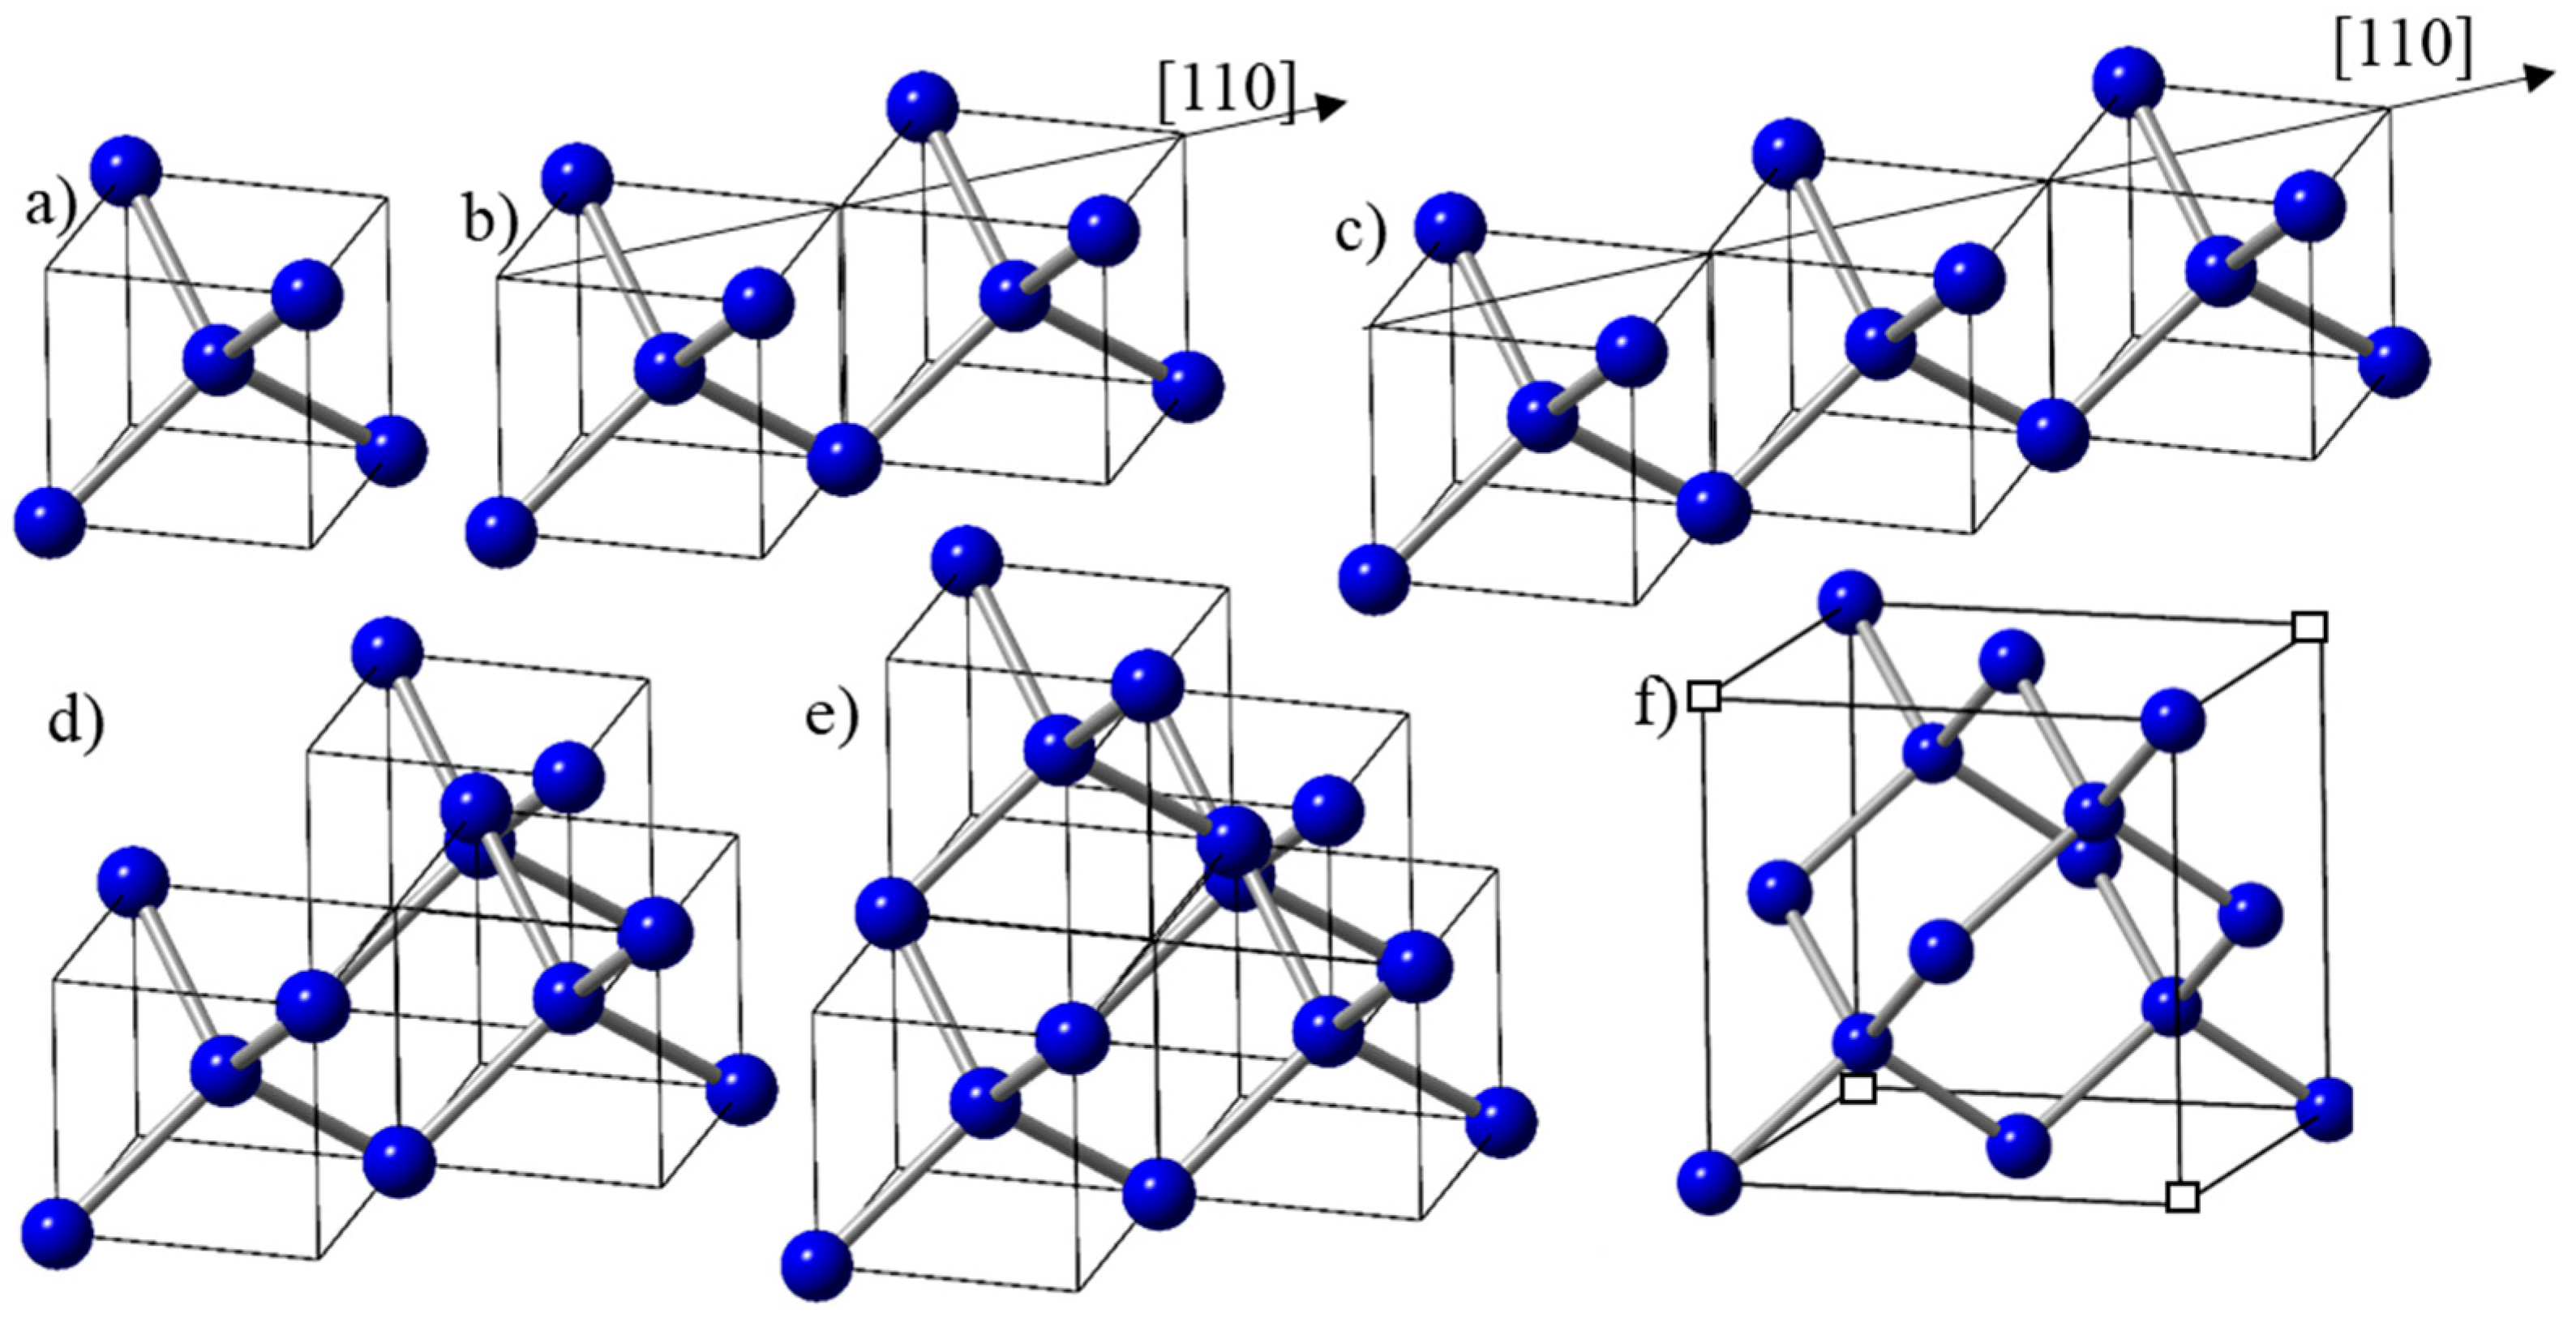
The electrons in the molten state of carbon are delocalized with metallic bonding. With undercooling, the localization of electrons starts and the formation of diamond tetrahedra begins. The formation of a tetrahedron can be correlated with the increase in carbon–carbon atom separation from 2r (close-packed metallic state with r = radius of carbon atom) to 3.26r (diamond tetrahedron) and covalent bonding. The basic unit in the design of new materials is diamond tetrahedron D1 (shown in Figure 2a, contained in (a/2, a/2, a/2) diamond unit cells, where atoms are four-fold coordinated. With more time available in a less undercooled state, two tetrahedra can grow along the <110> direction and form a dimer, as shown in Figure 2b. With a further increase in time associated with reduced undercooling, three tetrahedra can grow along the <110> direction, and form a trimer, as shown in Figure 2c. The third tetrahedron can also join in the <1–10> direction in the second plane to form the trimer, as shown in Figure 2d. This trimer is precursor to the formation of the diamond unit cell, with the addition of a fourth tetrahedron in the <1–10> direction, as shown in Figure 2e. It is important to note that in this framework, the diamond unit cell consists of four tetrahedra with an effective number density of atoms of 16/a3, and four missing tetrahedra, giving an average of 8/a3. Here, all the four carbon atoms are four-fold coordinated, and the four corner atoms contribute to net one atom (Figure 2f). In the diamond cubic unit cell of a 3D structure, all the eight carbon atoms, including four missing corner atoms (indicated by empty squares), are shared by eight unit cells, resulting in one net atom.
By controlling the degree of undercooling before quenching from the molten state, we can control the available time needed for the formation of clusters of one, two, three, and four tetrahedra. The available time for clustering increases with decreasing undercooling. With increasing undercooling, there is not enough time for these tetrahedra to organize into crystalline structures, so we create randomly packed amorphous Q-carbon phases. From the clusters of one, two, and three tetrahedra, we form distinct polymorphic phases of Q3, Q2, and Q1 of Q-carbon, respectively [16]. The formation of distinct phases of Q-carbon depends upon the formation of clusters of one, two, or three tertrahedra before quenching. If there is enough time, the clustering of four tetrahedra in two different planes results in the formation of a diamond cubic lattice, where the crystallite size of nanodiamond is determined by the growth time available during quenching.
It is important to note that the addition of the fourth tetrahedron along the <1–10> direction in the second layer leads to the formation of the diamond cubic unit cell, which can provide nucleation sites for diamond growth. This description of the diamond unit cell is equivalent to two interpenetrating FCC lattices, where one is displaced with respect to the other by (a/4, a/4, a/4) along the diagonal. This framework has been generalized to cover other materials of zinc blende structures, notably Q-silicon with novel properties in a recent paper [23].
The growth of diamond tetrahedra along the <110> direction, as shown in Figure 2b,c, can lead to the formation of rings and strings, as shown in Figure 3a. It should be noted that these tetrahedra are free to pivot along the <001> edges and bend to form rings, provided there is enough time available before quenching. On these rings, the diamond unit cell can nucleate (as shown in red) by attaching two tetrahedra in the <1–10> direction [24,25]. These unit cells grow and form nanodiamonds, whose size is determined by the available time for growth in the undercooled liquid before quenching. Figure 3b shows the formation of nanodiamond rings in the Q1 and Q2 phases, where the number density nanodiamonds is much higher in the Q2 phase than the Q1 phase. The schematic in Figure 3c shows the formation of these ring structures attached with the substrate and the bulk. The nucleation at the substrate involves a heterogeneous nucleation with larger nanodiamonds, whereas in the bulk, the nanodiamond size is smaller because of homogeneous nucleation. Using a thin layer of Q carbon and inducing nucleation only at the substrate, we are able grow epitaxial nanodiamond, as shown in Figure 3d.
This cubic diamond unit cell, having eight atoms and a lattice constant of 0.356 nm, has the highest number density of atoms (1.77 × 1023 cm−3) with many unique properties, including highest stiffness (Young’s modulus) and hardness. Despite the highest number density of atoms, the atomic packing factor (APF) of the diamond unit cell is the lowest of all the crystalline structures, with only 34%, which means there is a lot of empty space (66%) in the diamond unit cell, compared to only 26% in FCC and HCP and 32% in BCC crystal structures. This gives us a unique opportunity of creating new materials by incorporating more atoms to increase APF, while keeping the strong covalent bonding characteristics the same.
3. Design of Novel High-Temperature Superconducting Materials
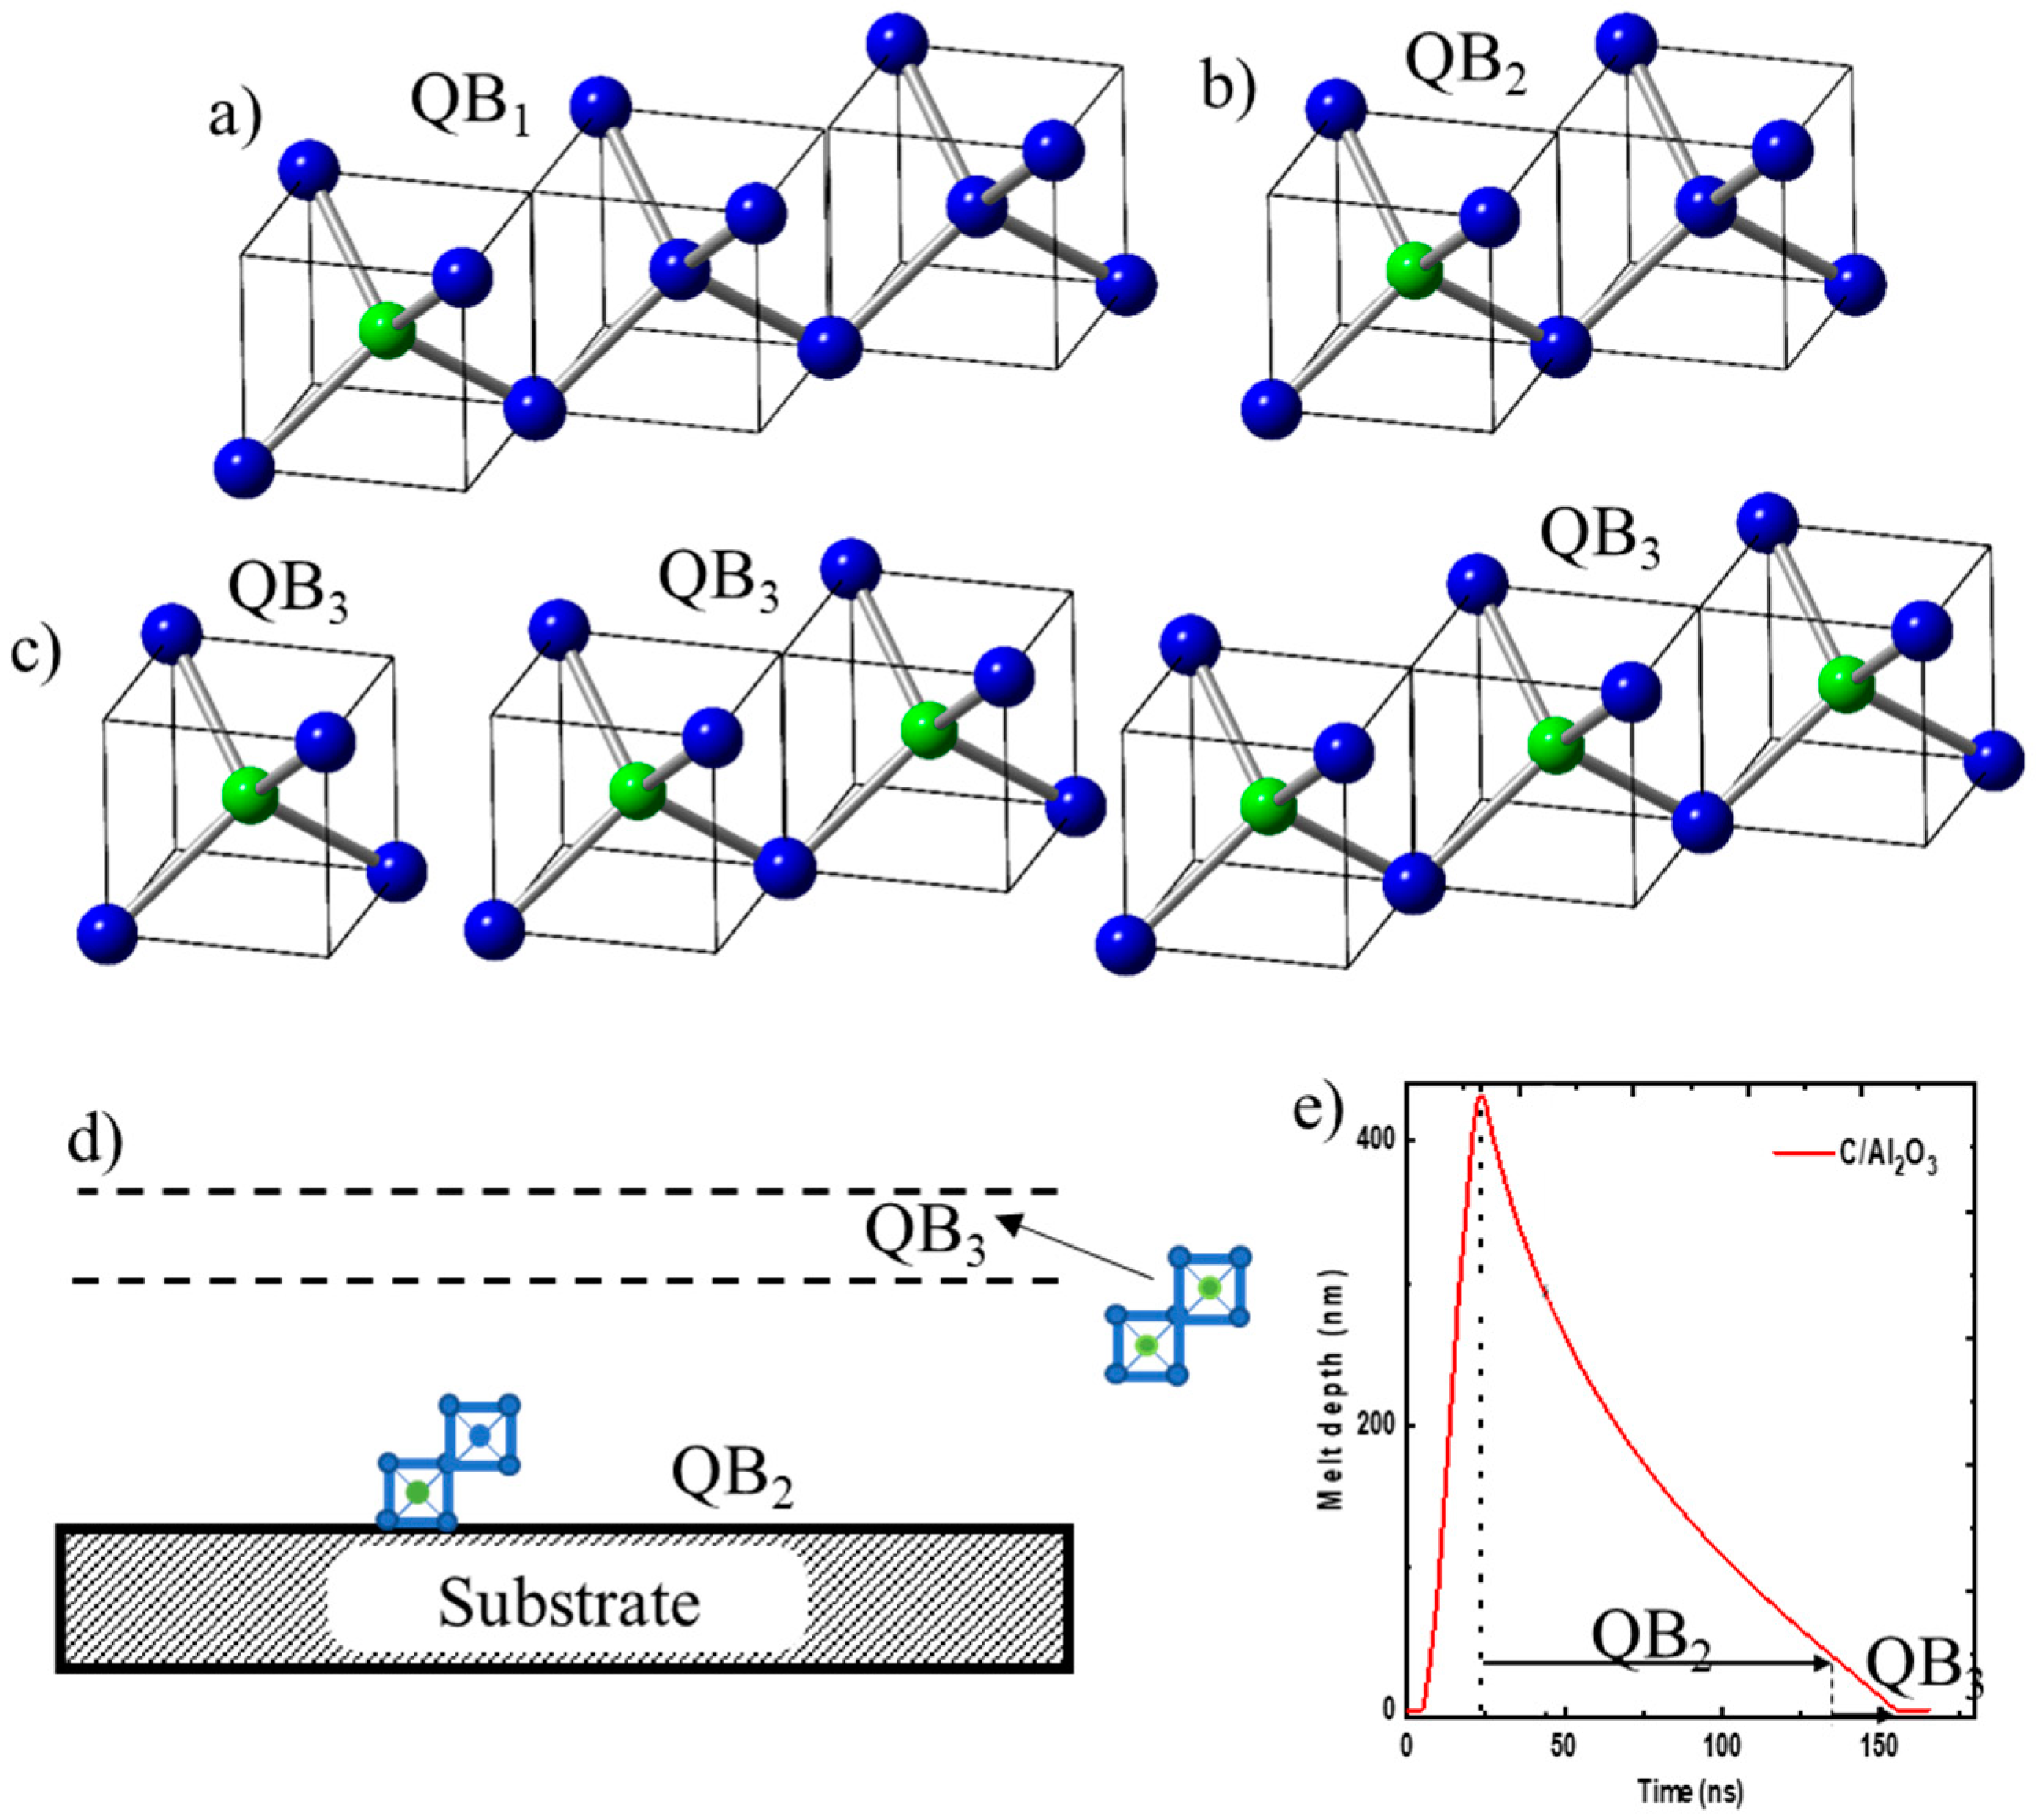
In designing Q-carbon- and diamond-based superconducting materials, we need to dope these materials to create free electrons or holes, which can form Cooper pairs for BCS superconductivity. The basic unit in the design of new materials is diamond tetrahedron D1 (shown in Figure 2a, contained in (a/2, a/2, a/2) diamond unit cell. By replacing the central C by a dopant such as B, we can create 50% B-doped diamond tetrahedron. In the units of three tetrahedra, if the central atom in one of the three tetrahedra is replaced by a dopant, we can create 17% B-doped structures, named QB1, as shown in Figure 4a. These D1 tetrahedra can grow beyond three and create interesting ring and string structures of self-organized B-doped Q-carbon and diamond. If the central atom in one of these two tetrahedra is replaced by B, we create 25% B-doped structures, named QB2, as shown in Figure 4b. If B replaces the central atom in all of the tetrahedra (units of one, two, or three), we create 50% B-doped structures, named QB3, as shown in Figure 4c. The PLA of thicker as-deposited carbon layers can create layers of QB1, QB2, and QB3 layers, where QB1 and QB2 layers are formed near the substrate. This layer is followed by the QB3 layer with increasing B concentration because of zone refining and segregation, as shown in Figure 4d. We also created 17 at% B-doped Q-carbon via pulsed laser annealing of alternate B and C layers, where thicknesses are adjusted to obtain desired QB1. Since the mass density of amorphous carbon and boron are similar (about 2.0 g·cm−3), the relative thicknesses scale with the percentages. Figure 4e shows the calculation of melt depth versus time using SLIM code for a 20 ns ArF laser pulse with an energy density of 0.6 J·cm−2. The surface starts to melt after a few nanoseconds, and the melt front penetrates over 400 nm within 20 ns. This plot shows the time available for QB2 growth and the formation of QB3 near the surface where the boron concentration increases to 50% because of zone refining. The details of this will be discussed below using high-resolution cross-sectional HAADF and EELS studies.
When four D1 tetrahedra are arranged in one plane (as shown in Figure 5a), we can create Q-diamond sheet with an effective number density of atoms of 16/a3. With four D1 units in the second plane with a total of eight tetrahedra, we create a Q-diamond subunit cell with a net 16 atoms and number density of atoms of 16/a3, as shown in Figure 5b. By putting together four Q-diamond subunit cells, we create a Q-diamond super unit cell, where there are two in the <110> direction (Figure 5c) and two in the <1–10> direction in the next plane (Figure 5d), and where there are four missing alternate subunit cells. Interestingly, this is similar to the missing four alternate tetrahedra in the diamond unit cell. By replacing central C atoms in these tetrahedra with B atoms selectively, we have created 50% B-doped Q-diamond phase, having net 32 C and 32 B atoms arranged in two layers of the super unit cell.
In summary, using the D1 subunit cell, which has twice the number density of diamond (16/a3 compared 8/a3 for diamond), we have created the following amorphous (randomly arranged) and crystalline structures. These materials with higher density of atoms than diamond should have novel and improved properties.
- (1)
- Q3 and QB3 structures: The D1 tetrahedra in Figure 2a and Figure 4c can be packed randomly with a packing efficiency of >80% [26] and create Q3 and QB3 phases, respectively. These phases have a number density of atoms of 12.8/a3, which is 60% percent higher than that of diamond. From the HAADF contrast, which is directly proportional to number density of atoms, the density of Q-carbon is derived by comparing the contrast and density of diamond, as shown in Figure S1. The APF of Q3 and QB3 is 51%, which is still lower than the simple cubic APF of 54%. By replacing the central carbon atom of the tetrahedra with appropriate dopants, we can create doped structures, such as 50% B-doped Q-carbon (QB3). These amorphous structures have sp3 covalent bonding within the tetrahedra and some sp2 and dangling bonds between the tetrahedra. The dangling bonds between the tetrahedra provide the source for room-temperature ferromagnetism [27,28].
- (2)
- Q2 and QB2 structures: When two D1 subunit cells attach along the <110> directions (as shown in Figure 2b and Figure 4b), we create D2 subunit cells. When D2 subunit cells are packed randomly, we create Q2 structures. If one of the two central atoms in D2 is replaced with boron, we create QB2 structure with 25% B. When D1 subunit cells grow along two perpendicular directions in a plane, we create two-dimensional platelet structures.
- (3)
- Q1 and QB1 structures: When three D1 subunit cells attach, we create a D3 subunit cell, as shown in Figure 2c and Figure 4a. When two D1 subunit cells attach along <110> and one along <1–10>, we create D3, as shown in Figure 2d. When D3 subunit cells are packed randomly, we create Q1 structures. If one of the three central atoms in D3 is replaced with boron, we create QB1 structure with 17% B.
- (4)
- Crystalline Q and QB diamond structures: The D1 subunit cells can grow along the <100> and <110> directions. Four D1 subunit cells in one plane create a D14 subunit cell, as shown in Figure 5a. By putting eight D1 subunit cells together in two planes, we create a Q-diamond subunit cell, as shown in Figure 5b. There are eight atoms inside and six atoms on the faces of the unit cell, where face atoms are four-fold covalently bonded. In addition, 8 corner atoms are shared by four atoms, which gives net 2 atoms to the unit cell with a total of net 16 atoms. By replacing central atoms with boron atoms (dopants), one can achieve dopant concentrations with increments (1/16) 6.25%. By replacing all the central carbon atoms with boron atoms, we achieve a maximum concentration of 50%. Since the face atoms are already saturated, this unit cell cannot be repeated to obtain 3D structures. However, these unit cells can grow along the <110> diagonal, as shown in Figure 5c. The second layer can grow with a 900 rotation, in the <1–10> direction, as shown in Figure 5d. By combining the <110> and <1–10> layers, we form a super unit cell with four of these unit cells, which can be repeated to create 3D structures. This super unit cell has a total of 64 carbon atoms in a Q-diamond structure, and 32 C + 32 B atoms in QB-diamond, where central C atoms in all the tetrahedra are replaced by B. The atomic coordinates of each carbon and boron atom for the super unit cell are given in Table 1. The table shows the coordinates of all four subunit cells (A1, A2, B1, and B2) in the super unit cell, where A1 and A2 are depicted in Figure 5c and B1 and B2 in Figure 5d. The common atom locations between two different subunits are indicated by Ax By, and by C* for atoms common to all the subunit cells.
4. Computational Method and Experimental Details
Quantum ESPRESSO, based on DFT plane wave functions and pseudopotentials with local density approximation, was employed to perform electronic-structure calculations for a Q-silicon super unit cell with atom coordinates of Table 1. The cutoff energy for plane wave functions in Q-silicon is 120 Ry. The program uses Troullier–Martins norm-conserving psuedopotentials for the exchange correlation. The super unit cell consists of four subunit cells with 22 atoms each, which are arranged in the <110> and <1–10> directions in two adjacent planes, making a total of 88 atoms. As shown in Table 1, nine of these atoms are common, leaving 79 discrete lattice points. However, there are only 64 independent atoms per super unit cell, with 16 each per subunit cell.
We synthesized QB1, QB2, and QB3 phases by depositing alternate layers of amorphous carbon and boron layers via pulsed laser deposition. The thickness ratios of carbon to boron layers were adjusted to obtain 17, 25, and 50 at% of boron. These C/B composite layers are melted via pulsed laser annealing using nanosecond ArF laser pulses (wavelength 193 nm, pulse duration 20 ns, and energy density 0.6–0.8 J·cm−2). However, there is B zone refining as a function of solidification velocity, which changes the relative thicknesses of the QB1, QB2, and QB3 composites. This zone refining process needs to be controlled to obtain thicker layers of QB3 (50 at% B). More details about the synthesis are provided in references [14,15].
5. Results and Discussions
We focus on experimental results of QB3 amorphous structure and theoretical results of crystalline Q-diamond, where both have B-doped diamond tetrahedron as the base structural unit. The B-doped tetrahedron has the central C atom replaced with a B atom, giving a net 50% B concentration. The structure of Q-diamond is unique with the highest density of atoms (3.54 × 10²³ atoms cm−3) in the subunit cells and empty spaces in-between. The subunit cell (as shown in Figure 4c) has 16 carbon atoms instead of 8 as in diamond. When four of these subunit cells are arranged with four empty spaces in two layers, we generate a super unit cell with 64 net carbon atoms with lattice constant of 0.712 nm, which is twice that of diamond. Thus, while the number density of atoms in the subunit cell is twice that of diamond, the average number density of atoms in the super unit cell is the same as that of diamond due to alternating empty spaces. This unique structure results because the face atoms in the subunit cells are already coordinated with four covalent bonds. It is envisaged that this unique structure has an optimum combination of phonon hardening (high frequency, optical phonons) within the subunit cells and phonon softening (low-frequency acoustic phonons) between the subunit cells. This combination of phonon hardening, and phonon softening is critical to high superconducting transition temperature. The phonon softening (slow phonons) is more effective in enhancing electron–phonon interaction (λ), while phonon hardening enhances the Debye temperature.
In the framework of BCS theory, Tc = ΘD exp [−1/N(0) V], where the density of states near the Fermi level, N(0), is related to the doping, while the electron–phonon interaction, V, is determined by the lattice vibrations. As pointed out by Cohen [1], in most materials, these two parameters cannot be separated and often work against each other for enhancing Tc. However, in a Q-diamond unit cell (Figure 5c) with all C atoms, the empty spaces can be filled with metal atoms such as K, Rb, Cs, Ti, and Cu and enhance N(0) independently while preserving lattice vibrations responsible for pairing in the subunit cells, where the number density of covalently bonded carbon atoms is twice that of diamond. In the case of B-doping of Q-diamond, while the doping enhances N(0), weaker C-B bonding may reduce lattice vibrational frequency somewhat needed for pairing.
Taking into account the electron–electron repulsive interaction parameter, µ*, the BCS superconducting transition temperature is given by [1]:
where θD is the Debye temperature and λ is the electron–phonon attractive interaction parameter. This equation is applied to weak-coupling limit (λ ≤ 1). For strong-coupling limit (λ > 1), Tc is estimated by the following:
where θD is replaced with the averaged phonon frequency 0.183 [<ω2>]0.5 and electron–phonon coupling Exp (−1/(λ − µ*)) is replaced with [λ]0.5.
Tc = θD Exp (−1/(λ − µ*)),
Tc = 0.183 [<ω2> λ]0.5,
Since λ is given by λ = [(Ω2 − <ω2>)/<ω2>], where Ω is the bare phonon frequency corresponding to zero electron–phonon interaction, it can be estimated from the phonon density of states (DOS), phonon dispersion, and Eliashberg function calculations using Quantum Espresso.
Figure 6a shows DOS (eV per unit cell with 64 atoms) as a function of distance from the Fermi level. It is interesting to note that the DOS value in Q-diamond is 0.3 eV per atom, which is obtained by dividing the average DOS (~21 eV) near the Fermi level by number of atoms in the super unit cell of 64. This value is substantially higher than 0.1 eV per atom, calculated by Moussa and Cohen for 50% B doped diamond [13]. Since λ (N(0) V) is directly proportional to the density of states near the Fermi level, we expect electron–phonon interaction in Q-diamond to be substantially higher, as much as by a factor of three, than that for B-doped diamond. The DOS plot (eV per atom) as function of frequency in Figure 6b shows the concentration of states around 200 cm−1 and 400–800 cm−1 (for acoustic phonons) and 900–1300 cm−1 for (optic phonons). The presence of a small fraction of negative DOS may be related to metastability aspects of crystalline Q-carbon. The crystalline Q-carbon structures have a deep local energy minimum but are metastable with respect to the global free-energy minimum of graphitic carbon. We have used standard coordinates (Table 1) for these calculations, but the lattice location of face atoms, which are saturated already with four covalent bonds, may cause these negative frequencies. The plot in Figure 6c shows in detail the peak contributions around 200 cm−1, 400–800 cm−1, and 900–1300 cm−1. Figure 6d shows electronic density of states for 64 super unit cell as a function of Fermi energy. A high electronic DOS of 0.3 eV per atom shows the metallic nature of Q-diamond and significant interaction with phonons to enhance the electron–phonon interaction parameter, λ.
From the Quantum Espresso calculations, averaged frequency [<ω2>]0.5 or ωph is estimated to be 750 cm−1 and λ = 2.0. This value is also consistent with λ = [(Ω2 − <ω2>)/<ω2>] = 2.004, where Ω = 1300 cm−1, which is the bare phonon frequency corresponding to λ = 0. Using this value of λ and the equation, Tc = 0.183 [<ω2> λ]0.5, we obtain Tc = 278 K. The logarithmic averaging of frequency gives lower average values as it weighs in heavily the lower frequencies near zero, but higher λ. By using logarithmic average frequency ωlog = 600 cm−1 with corresponding λ = 3.694, we estimate Tc = 302 K.
Using the McMillan formula based upon the generalized Migdal–Eliashberg theory, we obtain the following:
Tc = (ΘD/1.45) exp − [1.04 (1 + λ)/{λ − μ* (1 + 0.62 λ)}]
We obtain Tc = 259 K, using λ = 2.004, μ* = 0.115, and ΘD = 2250 K for diamond.
However, the Debye temperatures for Q-diamond and QB3 are expected to be higher than diamond. The Debye temperature, ΘD, is given by ΘD = h/(2πk) Vs(6π2Nv)1/3, where h is the Planck’s constant, k is the Boltzmann constant, Nv is the number density of atoms per unit volume, and Vs is the velocity of sound equal to (E/ρ)1/2; here, E is the Young’s modulus and ρ is the mass density. Since Nv for QB3 was determined to be 60% higher than diamond, the ΘD for QB3 is estimated to be 2610 K, compared to 2250 K for diamond. For an estimated ΘD = 2610 K for QB3, we obtain Tc = 300 K by using Equation (3). These theoretical results are remarkably consistent with experimental results based upon low-loss EELS and transport measurements to be discussed below. The QE calculations from 2D structure show a much higher density of states per B atom in both unrelaxed and relaxed structures compared to the 3D bulk structure of Q-diamond. In addition, the phonon frequency range in unrelaxed and relaxed 2D structures extends to 1800 cm−1 and 2300 cm−1, respectively. These characteristics lead to Tc estimates to room temperature and higher. The details of all the above theoretical calculations will be published in another paper [29].
6. Experimental Results: High Temperature Superconductivity in QB3 (50% B)
We carried out a detailed study of the bonding characteristics and the electronic structure in B-doped Q-carbon to understand the mechanism of high-temperature superconductivity [30]. These studies were conducted using high-resolution electron-energy loss spectroscopy to probe energy loss near edge structure (ELNES). Aberration-corrected STEM-FEI Titan 80–300 (fifth generation) was used to acquire HAADF images and EELS spectra. These studies provide a direct correlation between experimental results and theoretical calculations of the density of states near the Fermi level, as illustrated in Figure S2. The peaks in ELNES directly correspond to the electronic density of states, which also correlates with phonon density of states. High-resolution HAADF imaging in cross-section showed the formation of distinct phases of QB2 and QB3 phases. After laser annealing heavily B-doped Q-carbon, the atomic fractions of B (from Figure 4c) in QB2 and QB3 phases were estimated as 25% and 50%, respectively. The detailed analysis of EELS data showed the presence of sp3 bonded B with lattice location consistent with the center of the tetrahedron, as presented in the earlier paper [18].
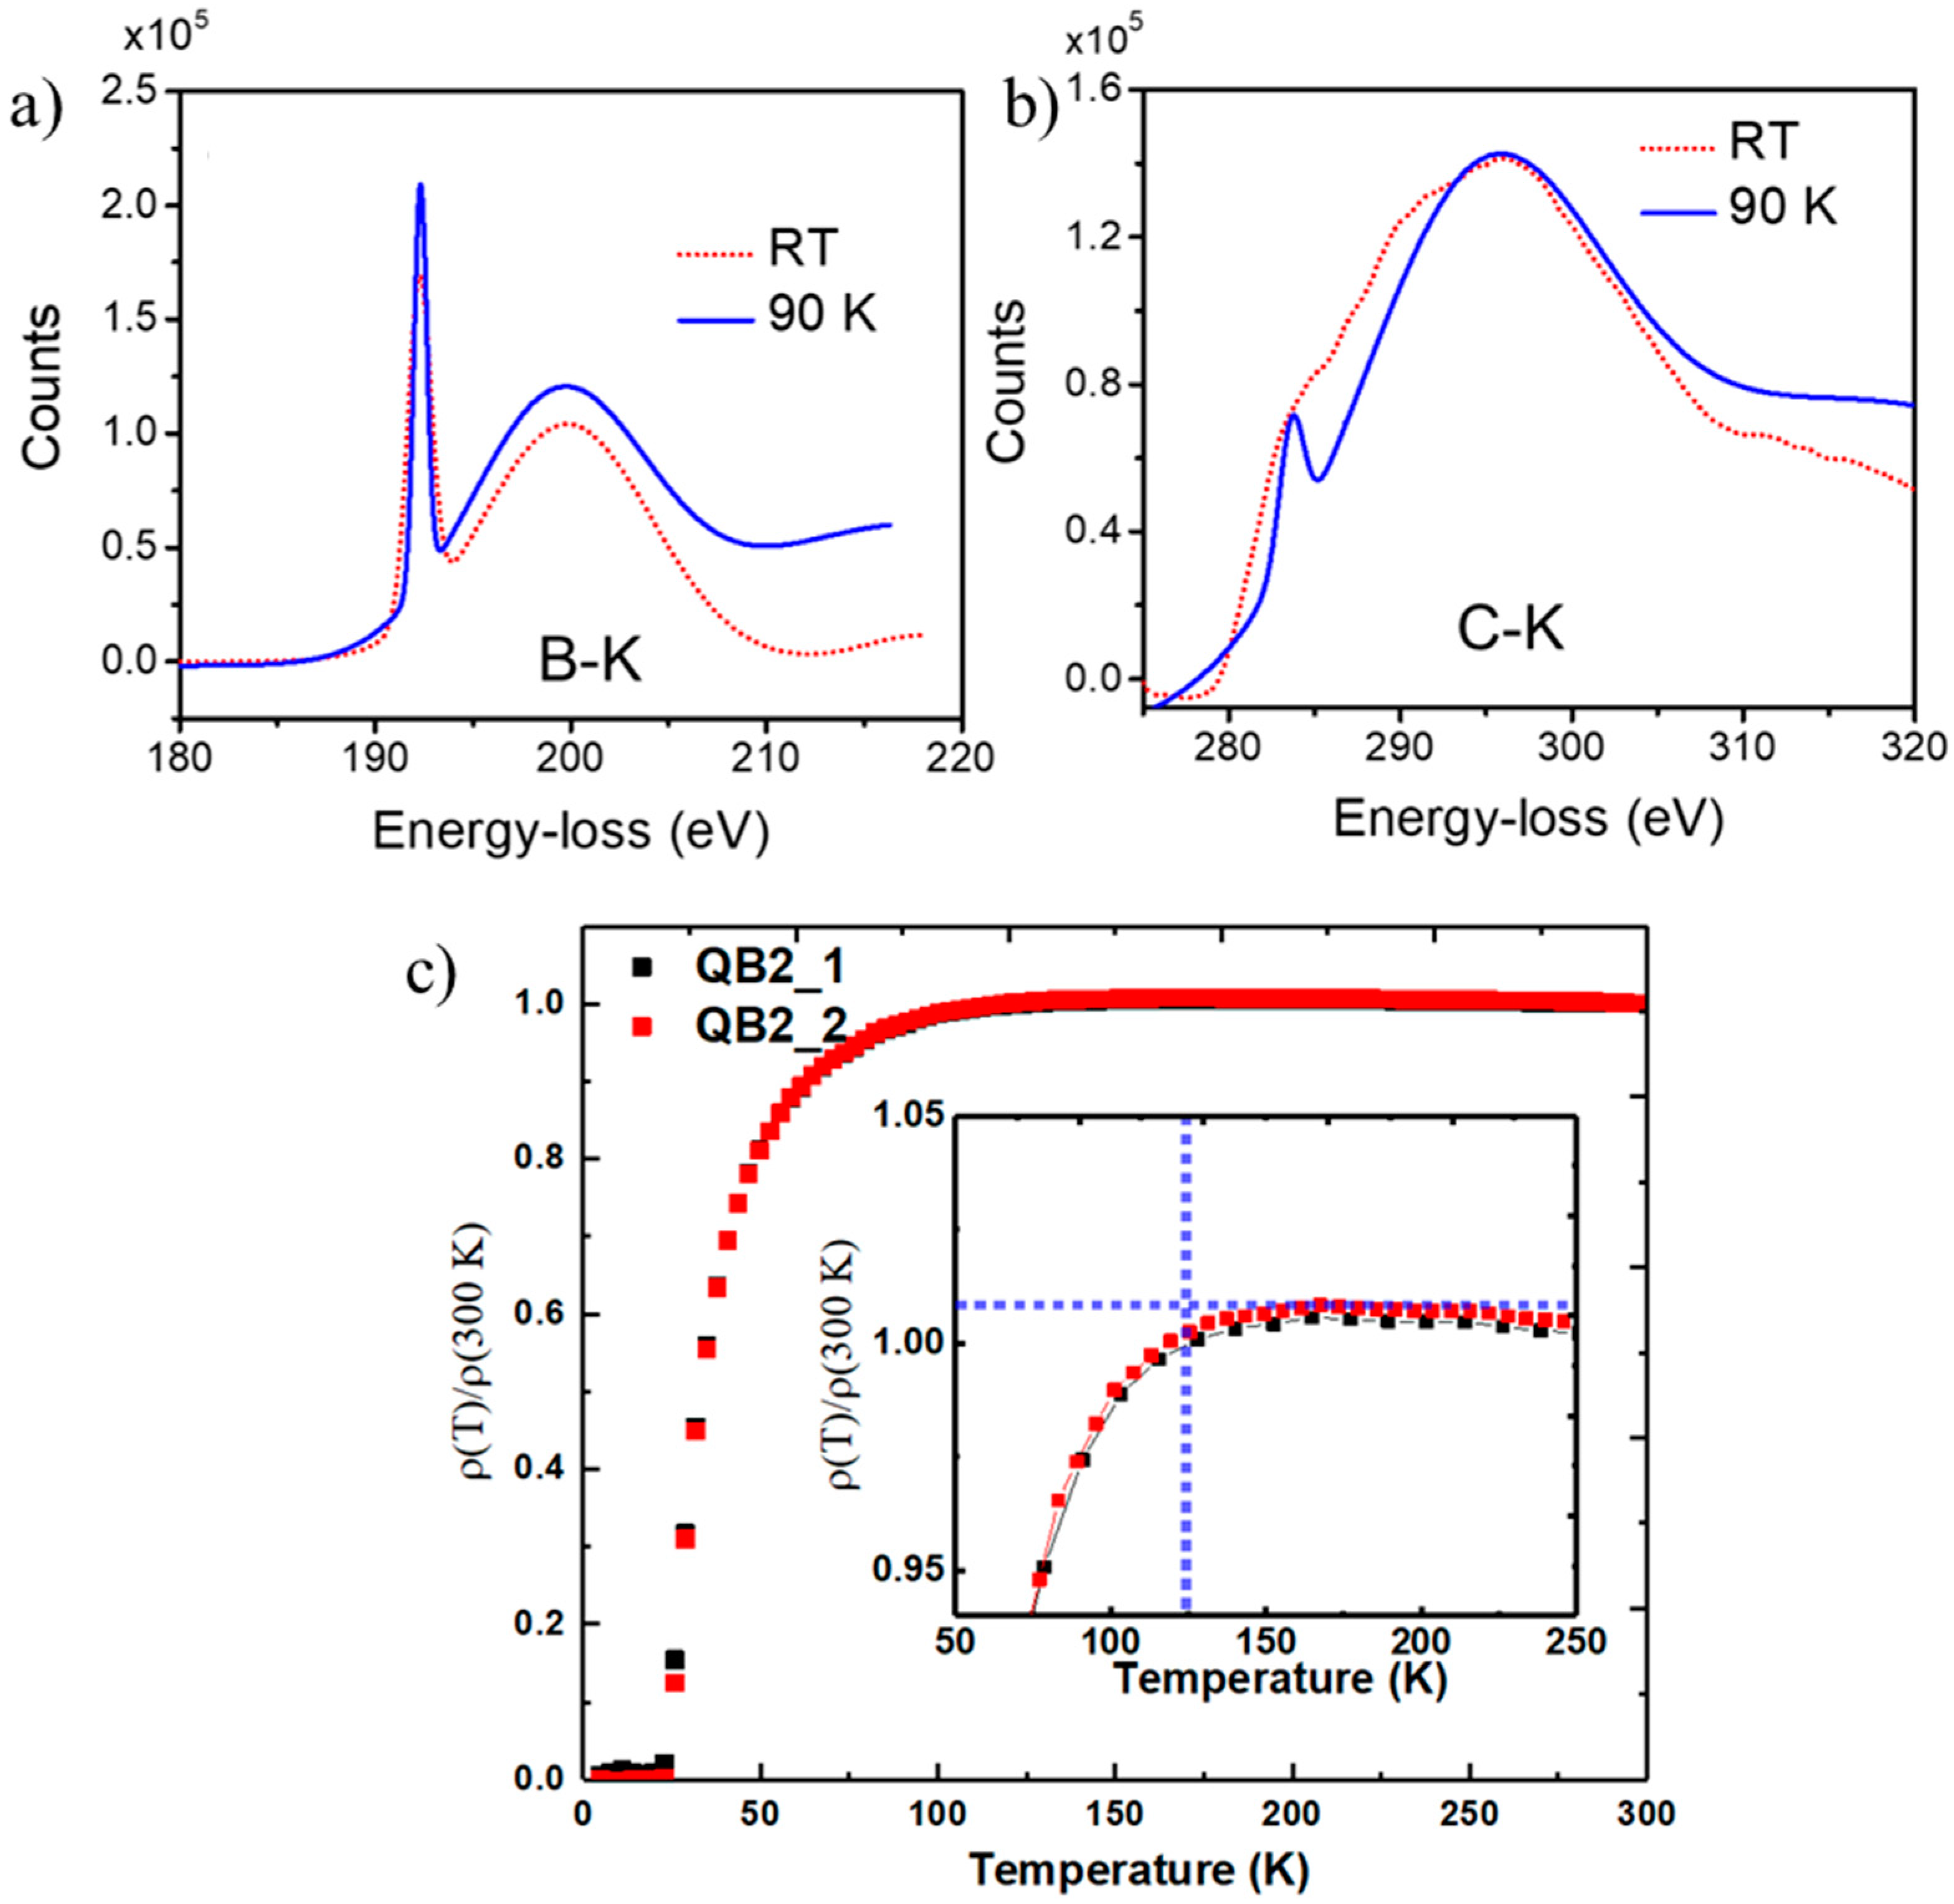
To probe the bonding characteristics and the electronic structure near Tc, we carried out EELS studies at 90 K and compared the results at 300 K. A comparison of B-K edge (at 192.9 eV) at 90 K and 300 K in Figure 7a shows a substantial enhancement in π* and σ* peaks at 90 K, indicating an enhancement in the density of states and presence of superconductivity with Tc above 125 K. We are in the process of making thicker layers of QB3 with 50% boron concentration for transport measurements and Meissner effect. Similar enhancements in intensity for π* and σ* peaks for C-K edge (at 284 eV) are shown in Figure 7b, indicating Tc between 90 and 300 K. Similar studies from QB2 sample with Tc = 55 K showed no changes in B-K and C-K edge EELS spectra at 90 K and 300 K. The electrical transport measurements were carried out as a function of temperature for a composite sample with 8 nm QB3 and 100 nm QB2 and QB1 phases, and the results are shown in Figure 7c. These two mixed phases (QB2_1 and QB2_2) show a much higher Tc than the previous record for BCS Tc = 39 K for MgB2. The plot shows a drop in resistivity starting at 125 K, as the thickness of QB3 is less than 10% of QB2 and QB1 phases. Further experiments are continuing to create a thicker layer of only QB3 for transport and magnetic measurements.
7. Summary
We have designed and synthesized novel phases B-doped Q-carbon with distinct boron concentrations of 17at% in QB3, 25at% in QB2, and 50at% in QB3 phases. The design of novel Q-phases is based upon diamond tetrahedra as the basic building block. The B-doped Q-carbon phases with distinct boron concentrations are formed at 17at% in QB1, 25at% in QB2, and 50at% in QB3 phases, when the units of three, two, and one tetrahedra are packed randomly. The superconducting transition temperature increases as a function of boron concentration, with the highest value for QB3 phase at 50at% boron. Detailed high-resolution EELS studies provide clear evidence for Tc over 125 K [30]. Thicker QB3 samples are being synthesized for transport measurements to obtain a sharp resistivity transition. The EELS results on the changes of π* and σ* peaks at 300 K and 90 K show a significant enhancement in the density of states at 90 K, indicating Tc to be considerably higher between 90 K and 300 K. Theoretical calculations for Q-diamond (crystalline form based upon diamond tetrahedra) using Quantum Espresso show ωph to be ~750 cm−1 and λ = 2.004. This value is also consistent with λ = [(Ω2 − <ω2>)/<ω2>], where Ω = 1300 cm−1, which is the bare phonon frequency corresponding to λ = 0. Using this value of λ and the equation, Tc = 0.183 [<ω2> λ]0.5, we obtain Tc = 278 K. By using ωlog = 600 cm−1 from QE calculations and corresponding λ = 3.694, we obtain Tc = 302 K. From the McMillan formula based upon the generalized Migdal–Eliashberg theory and Debye temperature of QB3 of 2620 K, we estimated the Tc value as 300 K.
By growing the D12 subunit cell in one-dimension, we create a crystalline Q-diamond nanorod with enhanced density of states near the Fermi level. The density of states is increased by doping tetrahedra with boron. By replacing the central carbon atom with boron in these tetrahedra, we obtain a dopant concentration of 50at%. By replacing the central carbon atom with boron in alternate tetrahedra, these nanostructures achieve a concentration of 25at%. Using D12 subunit cells, the crystalline Q-diamond super unit cell can be generated. This super unit cell cannot be repeated systematically as face atoms are already coordinated with four atoms. However, it can be repeated along the diagonal edges (leaving periodic holes) and form the super unit cell structure presented in this paper. We have also obtained preliminary results on the formation of Q-silicon after nanosecond pulsed laser annealing of amorphous silicon. In fact, we expect the formation of Q-phases in all of the materials with zinc blende/diamond cubic crystal structures having novel functional properties.
Supplementary Materials
The following supporting information can be downloaded at: https://www.mdpi.com/article/10.3390/c10010014/s1, Figure S1: (a) HAADF image of Q2 and diamond, showing the density of C atoms in Q phases higher than diamond by >60%; and (b) Electron diffraction pattern from Q-carbon. Figure S2: This figure shows energy loss near edge structure (ELNES) of B–K edge and C–K edge for QB2 and QB3 phases.
Funding
This research was funded by National Science Foundation grant number DMR-2016256.
Data Availability Statement
The data that support the findings of this study are available on request from the author.
Acknowledgments
We are pleased to acknowledge the contributions of students (Siba Sundar Sahoo, Minghao Pan, Pranay Kalakonda, Sumeer Khanna, Roger Sachan, Nayna Khosla, and Naveen Joshi) in drawing some of the figures.
Conflicts of Interest
The author declares no conflicts of interest.
References
- Cohen, M.L. Superconductivity in modified semiconductors and the path to higher transition temperatures. Supercond. Sci. Technol. 2015, 28, 043001. [Google Scholar] [CrossRef]
- Hebard, A.; Stewart, G. Progress in superconductivity. Phys. Toady 2019, 72, 44–45. [Google Scholar] [CrossRef]
- Pickett, W.; Eremets, M. The quest for room-temperature superconductivity in hydrides. Phys. Today 2019, 72, 52–58. [Google Scholar] [CrossRef]
- Ashcroft, N.W. Hydrogen Dominant Metallic Alloys: High Temperature Superconductors? Phys. Rev. Lett. 2004, 92, 187002. [Google Scholar] [CrossRef]
- Drozdov, A.P.; Eremets, M.I.; Troyan, I.A.; Ksenofontov, V.; Shylin, S.I. Conventional superconductivity at 203 kelvin at high pressures in the sulfur hydride system. Nature 2015, 525, 73–76. [Google Scholar] [CrossRef]
- Stewart, G.R. Heavy-fermion systems. Rev. Mod. Phys. 1984, 56, 755. [Google Scholar] [CrossRef]
- Wu, M.K.; Ashburn, J.R.; Torng, C.J.; Hor, P.H.; Meng, R.L.; Gao, L.; Huang, Z.J.; Wang, Y.Q.; Chu, C.W. Superconductivity at 93 K in a new mixed-phase Yb-Ba-Cu-O compound system at ambient pressure. Phys. Rev. Lett. 1987, 58, 908–910. [Google Scholar] [CrossRef]
- Johnston, D.C. The puzzle of high temperature superconductivity in layered iron pnictides and chalcogenides. Adv. Phys. 2010, 59, 803–1061. [Google Scholar] [CrossRef]
- Stewart, G.R. Superconductivity in iron compounds. Rev. Mod. Phys. 2011, 83, 1589. [Google Scholar] [CrossRef]
- Gorter, C.J. Some Remarks on Superconductivity of the Second Kind. Rev. Mod. Phys. 1964, 36, 27. [Google Scholar] [CrossRef]
- Bardeen, J.; Cooper, L.N.; Schrieffer, J.R. Microscopic Theory of Superconductivity. Phys. Rev. 1957, 106, 162. [Google Scholar] [CrossRef]
- Nagamatsu, J.; Nakagawa, N.; Muranaka, T.; Zenitani, Y.; Akimitsu, J. Superconductivity at 39 K in magnesium diboride. Nature 2001, 410, 63–64. [Google Scholar] [CrossRef] [PubMed]
- Moussa, J.E.; Cohen, M.L. Two Bounds on the Maximum Phonon-Mediated Superconducting Transition Temperature. Phys. Rev. B 2006, 74, 094520. [Google Scholar] [CrossRef]
- Bhaumik, A.; Sachan, R.; Narayan, J. High-Temperature Superconductivity in Boron-Doped Q-Carbon. ACS Nano 2017, 11, 5351–5357. [Google Scholar] [CrossRef] [PubMed]
- Bhaumik, A.; Sachan, R.; Gupta, S.; Narayan, J. Discovery of High-Temperature Superconductivity (Tc = 55 K) in B-Doped Q-Carbon. ACS Nano 2017, 11, 11915–11922. [Google Scholar] [CrossRef] [PubMed]
- Narayan, J.; Bhaumik, A.; Sachan, R. High temperature superconductivity in distinct phases of amorphous B-doped Q-carbon. J. Appl. Phys. 2018, 123, 135304. [Google Scholar] [CrossRef]
- Narayan, J.; Bhaumik, A.; Gupta, S.; Haque, A.; Sachan, R. Progress in Q-carbon and related materials with extraordinary properties. Mater. Res. Lett. 2018, 6, 353–364. [Google Scholar] [CrossRef]
- Narayan, J.; Sachan, R.; Bhaumik, A. Search for near room-temperature superconductivity in B-doped Q-carbon. Mater. Res. Lett. 2019, 7, 164–172. [Google Scholar] [CrossRef]
- Moussa, J.E.; Cohen, M.L. Constraints on Tc for Superconductivity in Heavily Boron-Doped Diamond. Phys. Rev. B Condens. Matter Mater. Phys. 2008, 77, 064518. [Google Scholar] [CrossRef]
- Sakai, Y.; Chelikowsky, J.; Cohen, M. Simulating the effect of boron doping in superconducting carbon. Phys. Rev. B 2018, 97, 054501. [Google Scholar] [CrossRef]
- Takano, Y.; Takenouchi, T.; Ishii, S.; Ueda, S.; Okutsu, T.; Sakaguchi, I.; Umezawa, H.; Kawarada, H.; Tachiki, M. Superconducting properties homoepitaxial CVD diamond. Diam. Relat. Mater. 2007, 16, 911–914. [Google Scholar] [CrossRef]
- Bhaumik, A.; Sachan, R.; Narayan, J. Magnetic Relaxation and Three-Dimensional Critical Fluctuations in B-Doped Q-Carbon—A High-Temperature Superconductor. Nanoscale 2018, 10, 12665–12673. [Google Scholar] [CrossRef] [PubMed]
- Narayan, J.; Sahoo, S.S.; Joshi, N.; Narayan, R. Synthesis and novel properties of Q-silicon. Mater. Res. Lett. 2023, 11, 688–696. [Google Scholar] [CrossRef]
- Narayan, J.; Bhaumik, A.; Gupta, S.; Joshi, P.; Riley, P.; Narayan, R.J. Formation of self-organized nano- and micro-diamond rings. Mater. Res. Lett. 2021, 9, 300–307. [Google Scholar] [CrossRef]
- Narayan, J.; Khosla, N. Self-organization of amorphous Q-carbon and Q-BN nanoballs. CARBON 2022, 192, 301–337. [Google Scholar] [CrossRef]
- Jaoshvili, A.; Esakia, A.; Porrati, M.; Chaikin, P.M. Experiments on the random packing of tetrahedral dice. Phys. Rev. Lett. 2010, 104, 185501. [Google Scholar] [CrossRef] [PubMed]
- Bhaumik, A.; Nori, S.; Sachan, R.; Gupta, S.; Kumar, D.; Majumdar, A.K.; Narayan, J. Room-Temp Ferromagnetism and Extraordinary Hall Effect in Nanostructured Q-Carbon: Implications for Potential Spintronic Devices. ACS Appl. Nano Mater. 2018, 1, 807–819. [Google Scholar] [CrossRef]
- Sakai, Y.; Chelikowsky, J.R.; Cohen, M.L. Magnetism in amorphous carbon. Phys. Rev. Mater. 2018, 2, 07440. [Google Scholar] [CrossRef]
- Pan, M.; Sahoo, S.S.; Kim, K.-W.; Narayan, J. Theoretical high Tc calculation in Q-diamond based materials. Under Preparation.
- Sachan, R.; Hatchtel, J.; Bhaumik, A.; Moatti, A.; Prater, J.; Idrobo, J.; Narayan, J. Emergence of shallow energy levels in B-doped Q-carbon: A high-temperature superconductor. Acta Mater. 2019, 174, 153–159. [Google Scholar] [CrossRef]
Figure 1.
BCS Tc as a function of time since the discovery of superconductivity in 1911. The Tc for QB3 is estimated from theoretical calculations and preliminary experimental results on density of states, shown later in the text.
Figure 1.
BCS Tc as a function of time since the discovery of superconductivity in 1911. The Tc for QB3 is estimated from theoretical calculations and preliminary experimental results on density of states, shown later in the text.

Figure 2.
(a) Diamond tetrahedron D1 in (a/2, a/2, a/2) diamond unit cell; (b) two D1 tetrahedra growing in the <110> direction; (c) three D1 tetrahedra growing in the <110>direction; (d) three D1 tetrahedra, the first two growing in the <110> direction (first layer) and the third one in the second layer <1–10> direction; (e) four D1 tetrahedra, the first two in the <110> direction (first layer) and the next two in the <1–10> direction (second layer), which is the diamond unit cell with four missing alternate tetrahedra; (f) unit cell of diamond with missing alternate tetrahedra.

Figure 3.
(a) Schematic of formation of diamond tetrahedra along the <110> direction and nucleation of the diamond unit cell via addition of two tetrahedra in the <1–10> direction in the second layer; (b) schematic showing the formation of nanodiamond rings and larger nanodiamonds growing on the substrate epitaxially; (c) high-resolution SEM showing formation of nanodiamond rings in the Q1 and Q2 phases, shaded region has layers and Q1 and Q2 phases; (d) mechanism of epitaxial growth of diamond mediated by Q-carbon, where red squares are in the second layer.

Figure 4.
(a) Formation of QB1, when one central C atom (blue atom) in one of the three tetrahedra is replaced by B (green atom); (b) formation of QB2, when one central C atom in one of the two tetrahedra is replaced by B; (c) formation of QB3, when central C atom is replaced by B in all one, two, and three unit tetrahedra; (d) schematic of layers of QB2 and QB3 layers; (e) SLIM calculation of melt depth versus time for 20 ns ArF laser pulse with energy density of 0.6 J·cm−2. The plot shows times available for growth Q2 and Q3 phases.

Figure 5.
(a) Formation of D14 by four D1 tetrahedra; (b) formation of Q-diamond subunit cell with eight tetrahedra in two planes with net 16 atoms; (c) formation of Q-diamond super unit cell with two subunit cells in the <110> direction (first layer); and (d) two subunit cells in the <1–10> direction (second layer). In the Q-diamond super unit cell, there are alternate subunit cells missing, which is similar to the missing tetrahedra in the diamond unit cell.

Figure 6.
(a) Density of states (DOS) as a function of energy from the Fermi level; (b) DOS as a function of frequency, presence of negative frequencies is related to metastability of Q-carbon; (c) detailed DOS distribution as function of frequency; (d) electronic DOS as a function of energy from the Fermi level.

Figure 7.
Cryo-EELS spectra of (a) B-K, (b) C-K for QB3 phase at 90 K and RT, and (c) resistivity vs. T results from QB3 mixed with QB2 and QB1 with evidence of Tc > 125 K [12].
Figure 7.
Cryo-EELS spectra of (a) B-K, (b) C-K for QB3 phase at 90 K and RT, and (c) resistivity vs. T results from QB3 mixed with QB2 and QB1 with evidence of Tc > 125 K [12].


Table 1.
Atom coordinates in subunit cell and super unit cell for C and B atoms in B-doped Q-carbon. Common atomic positions (four) between different subunit cells are indicated by C*.
Table 1.
Atom coordinates in subunit cell and super unit cell for C and B atoms in B-doped Q-carbon. Common atomic positions (four) between different subunit cells are indicated by C*.
| A1 | A2 | A1 | A2 | B1 | B2 | ||||
|---|---|---|---|---|---|---|---|---|---|
| B1 | B2 | a = 0.71nm | a/2[110] | a/2[011] | a/2[101] | ||||
| atoms | A1 | A2 | B1 | B2 | |||||
| C | 1 | 0, 0, 0 | 1/2, 1/2, 0 | A2A1 | 0, 1/2, 1/2 | B1A1 | 1/2, 0, 1/2 | B2A1 | |
| 2 | 1/2, 0, 0 | 1, 1/2, 0 | 1/2, 1/2, 1/2 | C* | 1, 0, 1/2 | ||||
| 3 | 1/2, 1/2, 0 | A1A2 | 1, 1, 0 | 1/2, 1, 1/2 | B1A2 | 1, 1/2, 1/2 | B2A2 | ||
| 4 | 0, 1/2, 0 | 1/2, 1, 0 | 0, 1, 1/2 | 1/2, 1/2, 1/2 | C* | ||||
| 5 | 1/4, 0, 1/4 | 3/4, 1/2, 1/4 | 1/4, 1/2, 3/4 | 3/4, 0, 3/4 | |||||
| 6 | 1/2, 1/4, 1/4 | 1, 3/4, 1/4 | 1/2, 3/4, 3/4 | 1, 1/4, 3/4 | |||||
| 7 | 1/4, 1/2, 1/4 | 3/4, 1, 1/4 | 1/4, 1, 3/4 | 3/4, 1/2, 3/4 | |||||
| 8 | 0, 1/4, 1/4 | 1/2, 3/4, 1/4 | 0, 3/4, 3/4 | 1/2, 1/4, 3/4 | |||||
| 9 | 1/4, 1/4, 0 | 3/4, 3/4, 0 | 1/4, 3/4, 1/2 | 3/4, 1/4, 1/2 | |||||
| 10 | 1/4, 1/4, 1/2 | 3/4, 3/4, 1/2 | 1/4, 3/4, 1 | 3/4, 1/4, 1 | |||||
| 11 | 0, 0, 1/2 | 1/2, 1/2, 1/2 | C* | 0, 1/2, 1 | 1/2, 0, 1 | ||||
| 12 | 1/2, 0, 1/2 | A1B2 | 1, 1/2, 1/2 | A2B2 | 1/2, 1/2, 1 | B1B2 | 1, 0,1 | ||
| 13 | 1/2, 1/2, 1/2 | C* | 1, 1, 1/2 | A2B1 | 1/2, 1, 1 | 1, 1/2, 1 | |||
| 14 | 0, 1/2, 1/2 | A1B1 | 1/2, 1, 1/2 | 0, 1, 1 | 1/2, 1/2, 1 | B2B1 | |||
| B | 15 | 1/8, 1/8, 1/8 | 5/8, 5/8, 1/8 | 1/8, 5/8, 5/8 | 5/8, 1/8, 5/8 | ||||
| 16 | 3/8, 3/8, 3/8 | 7/8, 7/8, 3/8 | 3/8, 7/8, 7/8 | 7/8, 3/8, 7/8 | |||||
| 17 | 3/8, 1/8, 1/8 | 7/8, 5/8, 1/8 | 3/8, 5/8, 5/8 | 7/8, 1/8, 5/8 | |||||
| 18 | 1/8, 3/8 3/8 | 5/8, 7/8, 3/8 | 1/8, 7/8, 7/8 | 5/8. 3/8, 7/8 | |||||
| 19 | 3/8, 3/8, 1/8 | 7/8, 7/8, 1/8 | 3/8, 7/8, 5/8 | 7/8, 3/8, 5/8 | |||||
| 20 | 1/8, 1/8, 3/8 | 5/8, 5/8, 3/8 | 1/8, 5/8, 7/8 | 5/8, 1/8, 7/8 | |||||
| 21 | 1/8, 3/8, 1/8 | 5/8, 7/8, 1/8 | 1/8, 7/8, 5/8 | 5/8, 3/8, 5/8 | |||||
| 22 | 3/8, 1/8, 3/8 | 7/8, 5/8, 3/8 | 3/8, 5/8, 7/8 | 7/8, 1/8, 7/8 |
Disclaimer/Publisher’s Note: The statements, opinions and data contained in all publications are solely those of the individual author(s) and contributor(s) and not of MDPI and/or the editor(s). MDPI and/or the editor(s) disclaim responsibility for any injury to people or property resulting from any ideas, methods, instructions or products referred to in the content. |
© 2024 by the author. Licensee MDPI, Basel, Switzerland. This article is an open access article distributed under the terms and conditions of the Creative Commons Attribution (CC BY) license (https://creativecommons.org/licenses/by/4.0/).
Share and Cite
MDPI and ACS Style
Narayan, J. Path for Room-Temperature Superconductivity in Q-Carbon-Related Materials. C 2024, 10, 14. https://doi.org/10.3390/c10010014
AMA Style
Narayan J. Path for Room-Temperature Superconductivity in Q-Carbon-Related Materials. C. 2024; 10(1):14. https://doi.org/10.3390/c10010014
Chicago/Turabian StyleNarayan, Jagdish. 2024. "Path for Room-Temperature Superconductivity in Q-Carbon-Related Materials" C 10, no. 1: 14. https://doi.org/10.3390/c10010014
Note that from the first issue of 2016, this journal uses article numbers instead of page numbers. See further details here.