
Comparison of Homemade and Commercial Plant-Based Drinks (Almond, Oat, Soy) Fermented with Yogurt Starter Culture for Fresh Consumption


Center of Bioimmobilisation and Innovative Packaging Materials, Faculty of Food Sciences and Fisheries, West Pomeranian University of Technology Szczecin, Janickiego 35, 71-270 Szczecin, Poland
Fermentation 2024, 10(1), 35; https://doi.org/10.3390/fermentation10010035
Submission received: 24 November 2023
/
Revised: 29 December 2023
/
Accepted: 30 December 2023
/
Published: 31 December 2023
(This article belongs to the Special Issue The Transformation of Rudimentary Fermented Products into Controlled Industrial Processes and Its Safety)
Abstract
:The growing interest in fermented plant-based milks and the availability of starter bacterial cultures, as well as equipment (devices that maintain the temperature at the appropriate level for fermentation, dedicated to use at home) have a resulted in many consumers not only producing plant-based milks at home, but also fermenting them. Moreover, the importance of homemade plant-based foods and beverages (including fermented products) significantly increased in recent years. The fermentation of commercial and homemade almond, oat and soy milks to obtain plant-based yogurt alternatives for fresh consumption was compared regarding microorganisms viability, physicochemical characteristics (pH, viscosity, stability), bioactive compounds changes (proteins, free amino acids, total carbohydrates, reducing sugars, polyphenolics and flavonoids) as well as antioxidant activity (DPPH, ABTS, O2− radicals scavenging activities and reducing power). The results showed that both commercial and homemade plant-based milks can be successfully fermented, ensuring high number of Lactic Acid Bacteria, high content of bioactive ingredients and antioxidant activity. Homemade plant-based milks are an attractive alternative to their commercial counterparts, moreover, considering the content of bioactive ingredients (such as polyphenols and flavonoids) and antioxidant activity, homemade almond, oat and soy milks showed a more favorable profile.
1. Introduction
Fermented foods are defined as foods or beverages produced by the controlled growth of microorganisms and the conversion of food components through enzymatic action. Nowadays, fermented foods have gained popularity, mainly because of the health benefits they offer [1]. A body of evidence has shown that consuming fermented foods can have a preventive effect against many diseases, due to the presence of bioactive molecules that may have antioxidant, cholesterol-lowering, anti-inflammatory or anti-diabetic properties [2,3,4]. Based on available reports it is estimated that fermented foods account for about 25% of diets in Europe and 60% in developing countries, and their increased consumption is undoubtedly a global trend [2,5,6,7,8]. The most popular fermented foods are fermented dairy products, such as yogurt, kefir and cheese [2,3,9,10]. Fermentation (with Lactic Acid Bacteria—LAB) is the pivotal biotechnological process to produce yogurt [11]. Yogurt in one of the most popular milk-based product worldwide and has gained a widespread consumer acceptance as health-promoting product due to its micronutrients and health-promoting components (peptides, organic acids, etc.) [2,8,11,12]. It is notable that consumer demand for alternative dairy products has increased due to health issues (lactose intolerance, allergies, cholesterol) and their awareness of the environmental impact of their dietary choices [13,14,15,16]. This is due to a growing group of vegans, vegetarians, flexitarians and other consumers who choose more plant-based foods [6]. Changing lifestyles and rising popularity of functional foods have led to a shift in dietary patterns. This had meaningful impact on public health, which has created a dramatic and quickly-growing demand for plant-based foods and beverages [11,17].
Plant-based products are seen as healthy foods because they are abundant in antioxidants, vitamins, dietary fiber and minerals [8,14]. In addition, they do not contain any dairy ingredients, such as allergens, lactose and cholesterol, which could prevent their use by some population groups [16,18,19]. Plant milk substitutes are water-soluble colloidal extracts, suspensions or emulsions composed of dissolved and crushed plant material and an aqueous phase that resemble animal milk in appearance, color and consistency [6,14,16,17]. Today, milk alternatives are commercially obtained from a variety of plants, such as legumes, seeds, nuts, cereals, pseudo-cereals, oilseeds and others [16,17]. Soy milk is the most common milk-substitute, but its domination on the market is gradually replaced by the emergence of alternative products from other plant sources such as almond, oat, coconut, cashew, hazelnut or rice milks [16,17,19]. In recent years, the market for these products has been growing steadily [17,19]. Moreover, based on projected annual growth rate (higher than 10%), the world market of plant-based milk alternatives is estimated to double by 2023 [5,17].
Soy, oat and almond are largely employed for making experimental and commercial plant milks [11,12,16,17]. Soy has been widely used for production of plant-milks, considering its low production cost, high protein content, quality and functional properties [7,11]. Moreover, soymilk is considered as a good substrate for the growth of yogurt microflora [11]. However, some problems related to large-scale production of soy (such as sustainability of the production chain and the usage of transgenic cultivars) recently emerged, and pushed the global research to investigate other plant alternatives [11]. Oat is perceived as a very good source of unsaturated fatty acids, high quality proteins and compounds with antioxidant activity (such as tocopherols, tocotrienols, phenolics and avenanthramides [11,19,20,21,22]. Many of the health-promoting effects (including glucose and cholesterol reduction in blood) and prevention of some disorders (such as irritable bowel syndrome, diarrheas, constipation, and flatulence) are related to the consumption of oat products, and have been linked with intake of oat fiber (containing β-glucans) [11,18,19,23,24]. Almond, a very popular nut is considered as functional food and a good alternative for vegans, being an important source of numerous nutrients, including high quality protein, dietary fiber, unsaturated fatty acids, phenolic acids, flavonoids, phytosterols and vitamins (vitamin E, riboflavin) [12,25,26]. Almond is reported to posses health enhancing effects such as prevention of coronary diseases, cancer, hypercholesterolemia (reducing low-density lipoprotein in plasma), oxidative stress, inflammation [12,25,26]. Almond-based milks are well present in the European market as a substitutes for cow’s milk [19,27].
Currently, consumers are interested in novel “milk” plant-based products including: organic, biodynamic, personalized food, allergen-free, ready to eat products, foods and beverages [14,15]. Moreover, there is an increasing demand for plant-based milk products enriched with beneficial microflora. Fermentation has been a natural approach to food production since the beginning of humanity, and today fermented foods are more popular than ever before [17]. They are raising interest as innovative potential carriers ensuring lactic acid bacteria (including probiotics) for vegan consumers, as a replacement for conventional dairy products [10,13,14,15,17]. Fermentation applied on plant-based foods matrices has been identified as a natural and effective biotechnological way to increase their nutritional, sensory, and technological characteristics as well as bioactivity due to production of health-promoting compounds [4,11,21]. Being similar to the fermented dairy products (such as yogurt), traditionally associated with well-known health properties, their acceptance as functional foods is greatly facilitated [11]. Lactic acid bacteria (LAB) are the most widely used microbes for plant-based fermentation [17]. The majority of research results found in the literature relate to the production of fermented soy milk [11,26]. However, a successful production of fermented plant milks and beverages based on almond, oat, coconut, hazelnut, rice has already been reported and some fermented plant-products from soy (produced i.e., by Kellogg and ALPRO®), oat (OATLY®, YOSA®, Mill Milk™, ALPRO®), and almond (ALPRO®) are commercially available [11,18,21,24,27,28,29,30].
The growing interest in fermented plant-based milks and the availability of starter bacterial cultures, as well as appropriate equipment (devices that maintain the temperature at the appropriate level for fermentation, dedicated to use at home) have also resulted that many consumers not only produce plant-based milks at home, but also ferment them [31]. Moreover, the importance of homemade plant-based foods and beverages (including fermented products) significantly increased as response to COVID-19 pandemic situation due to their immune enhancing activity [32,33,34]. Nevertheless, there are limited scientific reports comparing the fermentation possibilities of some commercially available plant milks (form almond, soy and oat) with those of homemade ones for production of freshly-fermented beverages in terms of fermentation kinetics (microbial growth), as well as bioactive compounds and antioxidative activity changes.
Thus, the aim of the presented study was to compare fermentation of commercial and homemade almond, oat and soy plant milks to obtain plant-based yogurt alternatives for fresh consumption and compare their LAB viability, physicochemical characteristics and antioxidant activity.
2. Materials and Methods
2.1. Materials and Reagents
Commercial plant milks (almond, oat and soy–without sugars added) were obtained from Alpro (Wevelgem, Belgium). Almonds (Bakalland, Warsaw, Poland), oat flakes (Sonko, Kobierzyce, Poland) and soy (Radix-Bis, Rotmanka, Poland) were purchased in local market. Commercial yogurt starter culture YO 122 (consisting of Lactobacillus delbrueckii subsp. bulgaricus and Streptococcus salivarius subsp. thermophilus) was obtained from Biochem s.r.l. (Rome, Italy). Sodium hydroxide, sulfuric acid, hydrogen peroxide, disodium phosphate, monosodium phosphate, 2,2-diphenyl-1-picrylhydrazyl (DPPH), 2,2′-azino-bis(3-ethylbenzothiazoline-6-sulfonic acid) (ABTS), methanol, Folin–Ciocalteu’s reagent, sodium carbonate, gallic acid, sodium nitrite, phenol, aluminum chloride, quercetin, 3,5-dinitrosalicylic acid, Benedict reagent, sodium tartrate tetrahydrate, acetic acid, sodium acetate, potassium ferricyanide, trichloroacetic acid, ferric chloride, ninhydrin, glacial acetic acid, cadmium chloride, tris(hydroxymethyl)aminomethane, pyrogallol, glycine, were purchased from Merck (Darmstadt, Germany). Glucose, hydrochloric acid, sodium chloride and ethanol were supplied from Chempur (Piekary Śląskie, Poland). All reagents were of analytical grade. MRS agar was purchased from Merck (Darmstad, Germany).
2.2. Plant Milks Preparation
For preparation of almond milk modified protocol of Lipan et al. was used [21]. Almonds were soaked in sterile distilled water for 12 h in a fridge (4 °C), followed by draining step. Then, the almonds were grounded with sterile distilled water in a blender (in a ratio 1:5 w/w) for 2 min, followed by staining through a two layer muslin cloth to obtain almond milk. Oat milk was prepared by soaking oat flakes in sterile distilled water (in a ratio 4:70 w/w) for 2 h at 25 °C. Then, the oat flakes were grounded in a blender for 2 min, followed by staining through a two layer muslin cloth. Soy milk was prepared following the methodology of Mishra and Mishra [7] with some modifications. Soybeans were soaked (4:20 w/w) for 12 h in a fridge (4 °C) in distilled water and draining the solution afterwards. It was then boiled again in fresh sterile distilled water for 30 min which was drained again followed by grinding of soybean in water at room temperature. The soy-slurry was then heated to 60 °C and filtered to remove okara. The plant milks were pasteurized (65 °C for 30 min) and subsequently cooled down to 40 °C (fermentation temperature).
2.3. Fermentation and Enumeration of Lactic Acid Bacteria Viability
Based on the manufacturer instructions, the plant milks samples (100 mL, preheated to 40 °C) were inoculated directly with starter culture (0.1 g-to obtain inoculation level of 1.20 × 10⁵ CFU/mL). Then, the samples were vigorously shaken (in tightly closed glass bottles) to distribute the culture homogeneously in the milks. Fermentation was carried out at 40 °C for 24 h using device dedicated for home production of yogurt (Yogurella 621, Ariete, De’Longhi Appliances s.r.l, Campi Bisenzio, Italy). Each fermentation process was carried out in a separate device, which has a power of 20 watts, and a capacity of 1 L, with a temperature range of 30–45 °C. Microbial analyses were carried out at time zero and after 2, 4, 6, 8, and 24 h of fermentation. The samples (1 mL) were collected and diluted with 9 mL of sterile physiological saline (0.9% NaCl), and serial ten-fold dilutions were prepared. Lactic acid bacteria counts were determined on MRS (de Man, Rogosa and Sharpe) medium (Merck, Darmstad, Germany) after incubation at 37 °C under anaerobic conditions for 72 h. Microbial counts were carried out in triplicate, and the number of viable cells was expressed as CFU/mL of samples [35].
2.4. Determination of Total Solids Contents, pH and Viscosity
The total solids content (TSC) of the commercial and homemade plant milks was analyzed by weighing the amount of solids present in a known amount of sample based on AOAC standard method. This was done by weighing a beaker, filling it with a known amount (g) of sample, then evaporating the water in an oven, and completely drying the residue (105 °C for 12 h). Subsequently, the weight of the beaker with the residue was determined [36]. To measure pH (of control and fermented plant milks) a pH-meter (CP-411, Elmetron, Zabrze, Poland) was used. The pH-meter electrode was directly placed in the samples at room temperature (25 °C) [12]. The viscosity of the samples was determined by the use of a rheometer (AR G2, TA Instruments Ltd., New Castle, DE, USA with cone plate–diameter 62 mm) at 25 °C, and shear rate 50 s−1. To analyze the results TA Rheology Advantage Data Analysis software V 5.4.7. (TA Instruments, New Castle, DE, USA) was used [37]. All analyses were carried out in triplicate at time zero and after 2, 4, 6, 8, and 24 h of fermentation.
2.5. Preparation of Supernatants
To obtain clear fluids for further analyses (supernatants) the samples were placed in 1.5-mL Eppendorf tubes and afterwards centrifuged (14,000 rpm/min, 10 min, 20 °C-Centrifuge 5418 Eppendorf, Warsaw, Poland). Subsequently, the samples were filtered using 0.22-µm nylon membrane filters (Merck, Darmstadt, Germany).
2.6. Determination of Total Carbohydrates Content (TCC), Reducing Sugars Content (RSC), Protein Content (PC), Total Free Amino Acids (TFAA), Total Polyphenolics Content (TPC) and Total Flavonoids Content (TFC)
The total carbohydrates content (TCC) was measured according to method described by Dubois et al. with some modifications [38]. The 0.2 mL of sample was diluted with distilled water in ratio 1:10, then 0.2 mL of 5% phenol solution was added and mixed. Subsequently 1 mL concentrated H2SO4 was added directly into the solution. The mixture was then vortexed, and allowed to stand for 30 min at room temperature. Readings were taken at 490 nm against a blank prepared by substituting distilled water for the carbohydrates solution (UV-Vis Thermo Scientific Evolution 220). The glucose was used as standard. The total carbohydrates content was calculated according to formula:
where:
- C—concentration of standard, Ab—absorbance of measured sample, Aa—absorbance of standard.
The reducing sugars content (RSC) was determined as described elsewhere [35], with DNS (3,5-dinitrosalicylic acid) reagent. Briefly, 1 mL of supernatants were mixed with 1 mL of 0.05 m acetate buffer (pH 4.8), 3 mL of DNS reagent, and shaken. Then, the mixtures were boiled for 5 min, cooled to room temperature, and the absorbance was read at 540 nm (UV-Vis Thermo Scientific Evolution 220). Glucose in acetate buffer was used for preparation of a calibration curve.
The protein content was determined according to microbiurette method described by Goa et al. with slightly modification [39]. The samples were diluted with distilled water in ratio 1:100. Then, 0.1 mL of samples were mixed with 2 mL of 3% NaOH and 0.1 mL of Benedict reagent. The samples were mixed and after 15 min the absorbance was measured at 330 nm (UV-Vis Thermo Scientific Evolution 220). The total protein content was calculated from a standard curve prepared with albumin bovine serum.
The method for the determination of total free amino acids level (TFAAL) was carried out according to methodology described in previous study [9]. Briefly, 1 mL of the supernatants were mixed with 2 mL of a Cd-ninhydrin reagent. The mixtures were shaken and heated at 84 °C for 5 min in a water bath. Subsequently, the samples were cooled in ice-water, and the absorbance was read (507 nm, UV-Vis Thermo Scientific Evolution 220). The results were expressed as milligram Gly per mL of the sample.
The total polyphenolics content was analyzed by Folin–Ciocalteu method with own modification [35]. The supernatants (100 µL) were mixed with 6 mL of distilled water and 0.5 mL of Folin–Ciocalteu’s reagent. After 3 min the saturated solution of Na2CO3 was added (1.5 mL). The mixtures were incubated in darkness (30 min, 40 °C), and then measured at 765 nm (UV-Vis Thermo Scientific Evolution 220). The concentration of TPC was calculated as mg of gallic acid equivalents (GAE) per mL of sample (mg GAE/mL).
The total flavonoids content (TFC) was measured following methodology described elsewhere [35]. Briefly, 250 µL of supernatant were mixed with 1 mL of distilled water and 75 µL of 5% NaNO2 solution. After 5 min, 75 µL of 10% AlCl3 solution was added, and after 6 min, 250 µL of 1 M NaOH was added. Distilled water was added to total volume of 3 mL, and then absorbance was read at 510 nm (UV-Vis Thermo Scientific Evolution 220). The results were expressed as mg of quercetin equivalents (QE) per mL of the sample (mg QE/mL).
2.7. Determination of Antioxidant Activity
All analyses were carried out in triplicate at time zero and after 2, 4, 6, 8, and 24 h of fermentation. The reducing power (RP) determination was carried out by mixing 500 μL of supernatants, 1.25 mL of phosphate buffer (0.2 M, pH 6.6), and 1.25 mL of potassium ferricyanide. Then, the mixtures were incubated at 50 °C (20 min). Subsequently, 1.25 mL of trichloroacetic acid was added, and the mixtures were centrifuged (3000 rpm, 10 min). Then, 1.25 mL of supernatants were mixed with 1.25 mL of distilled water, and mixed with 0.25 mL of ferric chloride solution (0.1%). The absorbance was read at 700 nm [37].
Radical scavenging activities (DPPH, ABTS+·, O2−) were analyzed as described elsewhere [35,37]. Briefly, to determine DPPH inhibition, 1 mL of the supernatants were mixed with 1 mL of 0.01 mM DPPH solution (in methanol), and the absorbance was read at 517 nm. ABTS+· scavenging activity was measured at 734 after mixing 50 µL of supernatants with 3 mL of radical solution, and incubation for 6 min. Superoxide radical (O2−) inhibition was determined by mixing 1 mL of the supernatants with Tris-HCl buffer (3 mL, 50 mM, pH 8.2), and pyrogallol solution (0.3 mL, 7 mM). After incubation at 25 °C for 4 min, the reaction was stopped by adding 1 mL of 10 mM HCl, and the absorbance was measured at 318 nm.
2.8. Statistical Analyses
All data were presented as mean ± standard deviation (SD). Statistical significance was determined using an analysis of variance (two-way ANOVA) followed by NIR Fisher test. The values were considered as significantly different when p < 0.05. All analyses were performed with Statistica version 10 (StatSoft Polska, Kraków, Poland)
3. Results and Discussion
3.1. Lactic Acid Bacteria Viability during Fermentation
The viable LAB counts during fermentation in plant milks are presented in Figure 1. Initially (time zero) there was no significant (p > 0.05) difference among the LAB counts coming from starter culture in yogurt samples. As can be seen, in all samples the microorganisms counts showed statistically significant changes during fermentation (p < 0.05), and a multiplying started after 2 h (p < 0.05). Conventional yogurt is prepared through the fermentation of cow milk by Streptococcus thermophilus and Lactobacillus delbrueckii subsp. bulgaricus until pH decrease to 4.5 and final LAB density at least 108 CFU/mL are reached [11]. After 8 h of fermentation, up to 24 h, the bacterial counts were maintained in the samples over the recommended for yogurt level > 108 CFU/mL. Those results are in agreement with the previous reports of other authors using mono- and mixed cultures for fermentation of almond, oat and soy beverages [26,40]. A significant increase of LAB counts was observed during fermentation in all samples (p < 0.05), and the highest LAB viability (1.21 × 10⁹ ± 0.16 CFU/mL was observed in sample A-HM after 8 h of fermentation. A slight decrease in all samples was observed after 24 h (p < 0.05), which may be attributed to acid production, as it is known that to low pH might have been detrimental for survival of LAB [20]. There are available studies indicating that almond, oat and soy milks affect the growth and metabolism of LAB such as prebiotic substrate. The carbohydrates (e.g., resistant starch, oligosaccharides, β-glucans, and fiber), proteins and dietary polyphenolic compounds are the stimulatory factors [12]. It can be therefore stated that commercial as well as homemade plant milks are satisfactory for fermentation with yogurt starting culture. Moreover, it appears to be relationship between the decrease of pH and viability of LAB. A similar trend was reported by Topcuoglu and Yilmas-Ersan [12] as well as by Garro et al. [41]. Fermentation using yogurt starter cultures is an example of obviously important concept of the mixed cultures application to ferment plant materials. The cooperation between L. delbruecki subsp. bulgaricus and S. thermophilus during yogurt fermentation is a well-understood example of mutualism [17]. The proteolytic Lactobacillus benefits the non-proteolytic S. thermophilus by releasing of peptides and free amino acids as a nitrogen source, whereas S. thermophilus provides L. delbrueckii growth-stimulating factors (such as organic acids, vitamins and carbon dioxide) [17]. In a mixed culture, the two strains are simultaneously stimulating each other’s growth and metabolites production.
3.2. The Changes of pH
The changes of pH are presented in Figure 2. The initial pH of homemade samples (A-HM, O-HM, S-HM–6.30, 6.30, 6.90, respectively) was generally lower than pH of commercial samples (A-C, O-C, S-C–7.70, 7.30, 7.20, respectively) (p < 0.05). Those results are in good agreement of values reported by other authors [21,24,25,41]. As a result of fermentation, a significant decrease of pH during fermentation was noticed for all samples to the range of 4.60–6.70 for commercial milks, and of 3.90–4.40 for homemade ones (p < 0.05). All homemade fermented samples were characterized by lower pH than the commercial samples (p < 0.05), and the lowest pH (3.90) was observed for sample O-HM after 24 h of fermentation. Moreover, homemade milks reached pH 4.5 (recommended for cow milk yogurt) earlier when compared with commercial milks. A higher acidity of homemade samples might be attributed to higher total solids content, being substrates for fermentation. As shown in Table 1, the TSC of A-HM, O-HM, S-HM samples was 14.43 ± 0.17%; 9.98 ± 0.10%; 8.08 ± 0.04%, respectively, whereas TSC of A-C, O-C, S-C samples was 2.59 ± 0.08%; 5.63 ± 0.03% and 7.35 ± 0.09%, respectively. The results of acidification are in line with reports of other authors [12,21,22,27,40]. However, it can be hypothesized that, commercial plant milks have a higher buffering capacity due to the different processing method (low protein denaturation) and the addition of ingredients such as gellan gum [42,43,44].
3.3. Viscosity and Appearance Changes
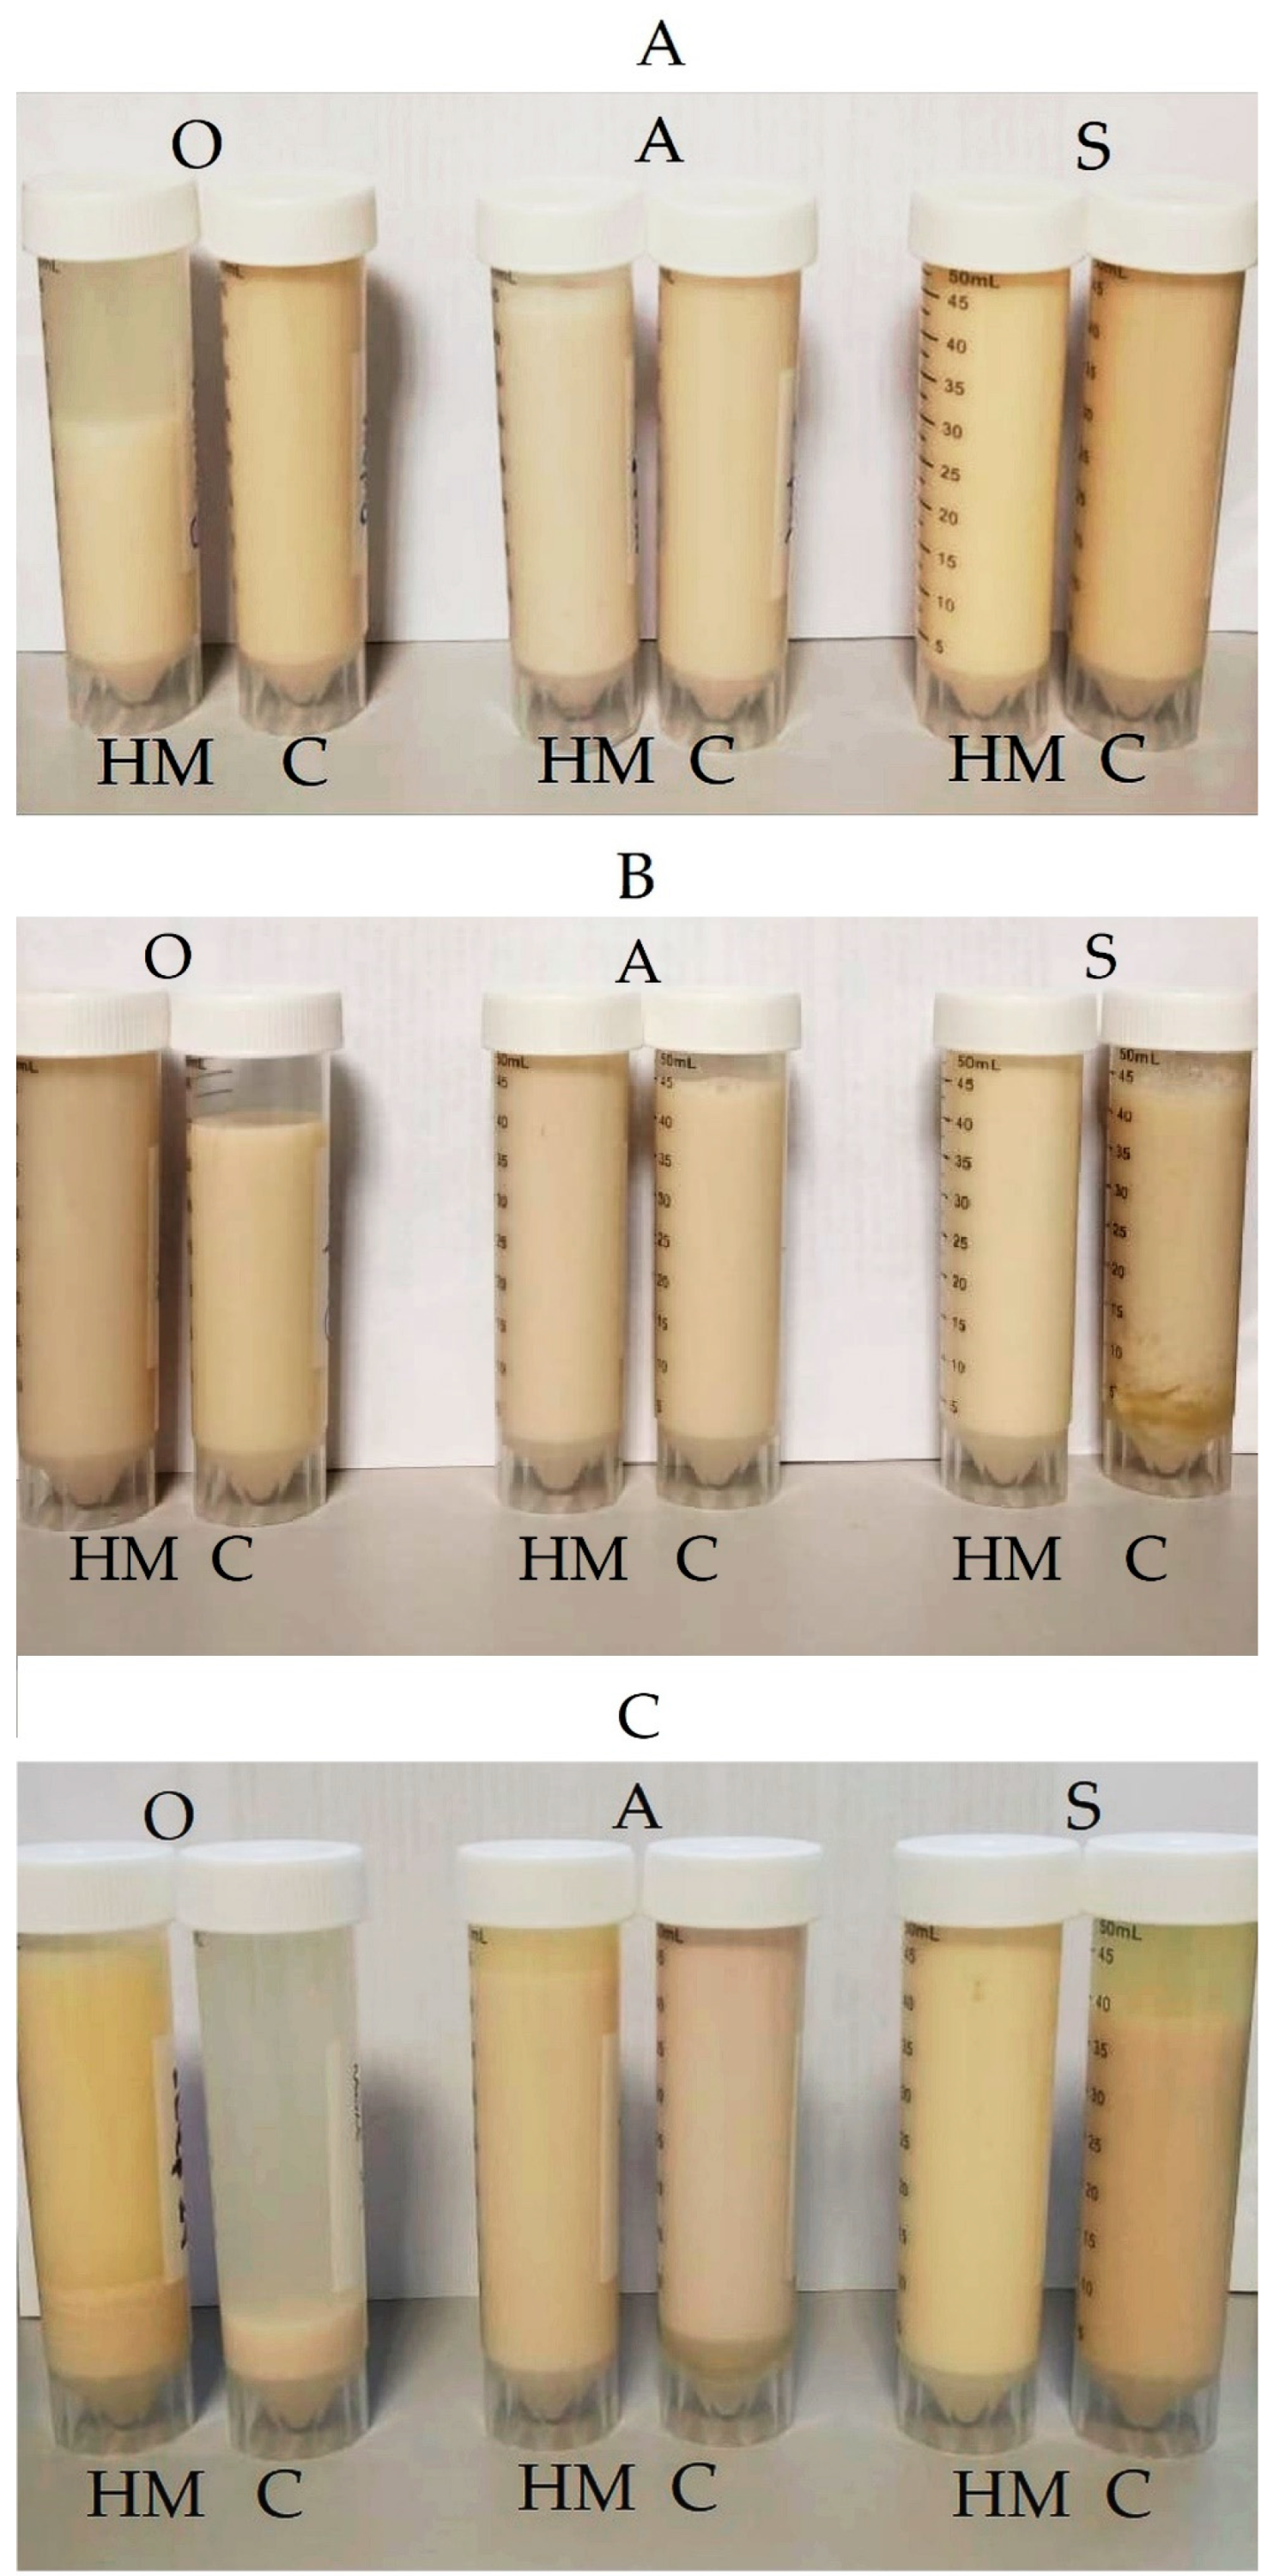
Figure 3 presents the viscosity changes during fermentation, whereas a visual appearance of the samples is illustrated in Figure 4. The initial viscosity of homemade milks was higher than the commercial ones (p < 0.05). The highest difference in viscosity (almost 2-fold) was noticed between almond milks (24.00 ± 0.28 mPa·s and 14.65 ± 0.07 mPa·s, for A-HM and A-C, respectively). Different viscosity changes patterns were observed for almond, oat and soy milks. For almond milks a significant increase of viscosity started after 4 h of fermentation and continued up to 8 h, reaching 2- and 3-fold higher values (for A-HM and A-C milks, respectively) when compared with initial viscosity. However, after 24 h a significant decrease of viscosity was noticed (p < 0.05). As can be seen in Figure 4, almond milks showed the highest stability, and only a slight phase separation (linked with syneresis) was observed after 24 h. Generally, low viscosity changes were observed for oat milks, presumably linked with low β-glucan content, and not enough gelated starch [6]. Moreover, a very high phase separation was observed in O-HM and O-C samples after 24 h. This might be linked with avenin (one of oat proteins) isoelectric point (6.69), of below oat protein is easily precipitated and easily removed from the solution with the sediment [6], suggesting high thickeners levels are necessary to avoid phase separation in oat-based fermented products. Mårtensson et al. [29] as well as Gokavi et al. [21] observed a viscosity decrease of fermented oat-based milk substitutes caused by a high syneresis. On the contrary, Mårtenson et al. [28] reported increase of viscosity in oat-based fermented beverage when used microbial strains able to synthesize exopolysaccharide (EPS). Similarly, El-Batawy et al. [40] noticed, that high β-glucan content might result in viscosity increase in oat milk. For soy milks a significant increase of viscosity started after 4 h of fermentation (p < 0.05). After 8 h approximately 10-fold (S-HM) and 13-fold (S-C) increase of viscosity when compared with initial values was observed (p < 0.05). This observation is in line with results of Mishra and Mishra [7] who observed increase of viscosity and gelation of fermented soy milk. However, phase separation was noticed for sample S-C. After 24 h, the viscosity of sample S-HM continued to increase and no phase separation was noticed, whereas for sample S-C a slight decrease of viscosity (p < 0.05), as well as phase separation were observed. The viscosity changes of the samples can be attributed presumably to several different mechanisms. An increase of viscosity may be linked with production of exopolysaccharide (EPS) by LAB [7], which may determine water retention and interaction with other components of plant milks, resulting in increased hardness of the protein matrix in the final product. In cow’s milk yogurt, the primary factor involved in milk gelation is the reduction of the high net negative charge on casein micelles as a consequence of acidification and dissolution of some insoluble calcium phosphate cross-links, thus modifying the internal bonds between proteins. Reaching a pH value lower than the isoelectric point of caseins causes their gelation [7,11]. Aggregation of casein micelles starts at a pH of approximately 5.3, and further reduction to below 5.0 causes a more complex and extensive interconnection of casein micelles, and the gel attains maximum firmness at pH 4.6 (the isoelectric point of casein). According to Mishra and Mishra [7], a similar phenomenon is responsible for gel formation in fermented soy products as isoelectric point of soy protein is similar to casein. Soybean glycinin is a hexamer consisting of five kinds of subunits, and each subunit contains acidic and basic chains linked by a disulphide bond. Consequently, the tight and rigid molecular structure is formed. However the destabilization of the plant protein structure caused by fermentation and to high acidification, can lead to the weakening of the product structure and to aqueous phase separation during storage, and was presumably linked with phase separation observed in the samples [11]. As a result, the optimal consistency achieved in commercial dairy-free products is usually achieved with additives (protein extracts, thickeners and emulsifiers), which are not part of the growing trend of clean-label products [11]. In commercial samples a thickener–gellan gum was used, however, as can be seen in Figure 4, it was not enough to achieve no phase separation in fermented samples. The firmness of yogurt depends directly on its total solids content, and in particular on its protein content and type of protein. A higher protein content would result in a higher degree of cross-linking of the gel network, which would result in a much denser and stiffer structure [7].
3.4. The Changes of Protein Content, Total Free Amino Acids Level, Total Carbohydrates Content and Reducing Sugars Content
Figure 5 presents the changes of protein content (PC) and total free amino acids level (TFAAL) in the samples during fermentation. It was observed, that in almost all samples the PC level after 24 h of fermentation significantly decreased when compared with the initial samples (p < 0.05). This observation is consistent with findings of other authors [11,26,45]. A lower amount of proteins in soy-based yogurt compared to soymilk was also observed by Rui et al. [45]. Only in sample A-HM an increased level of PC was noticed (p < 0.05). On the other hand, in all samples an increased trend in TFAAL was observed, which was more intensive after 6 h of fermentation (p < 0.05). Indeed, it was already reported that proteases activity is poor during early fermentation stage, in which LAB preferentially use the available free amino acids [11]. On the other hand, Luana et al. observed that the concentration of free amino acids slightly varied between fermented and non-fermented beverages from oat flakes [22]. A balance between the release and consumption of free amino acids by microbial starter was hypothesized [22]. Insufficient free amino acids and peptides are present in milk to allow LAB to grow. Therefore, LAB have a complex system of proteinases and peptidases that enable them to use milk proteins as a source of amino acids and nitrogen. It was also reported that LAB fermentation of soy released bioactive peptides (having antihypertensive effect due to inhibition of angiotensin-converting enzymes) [46].
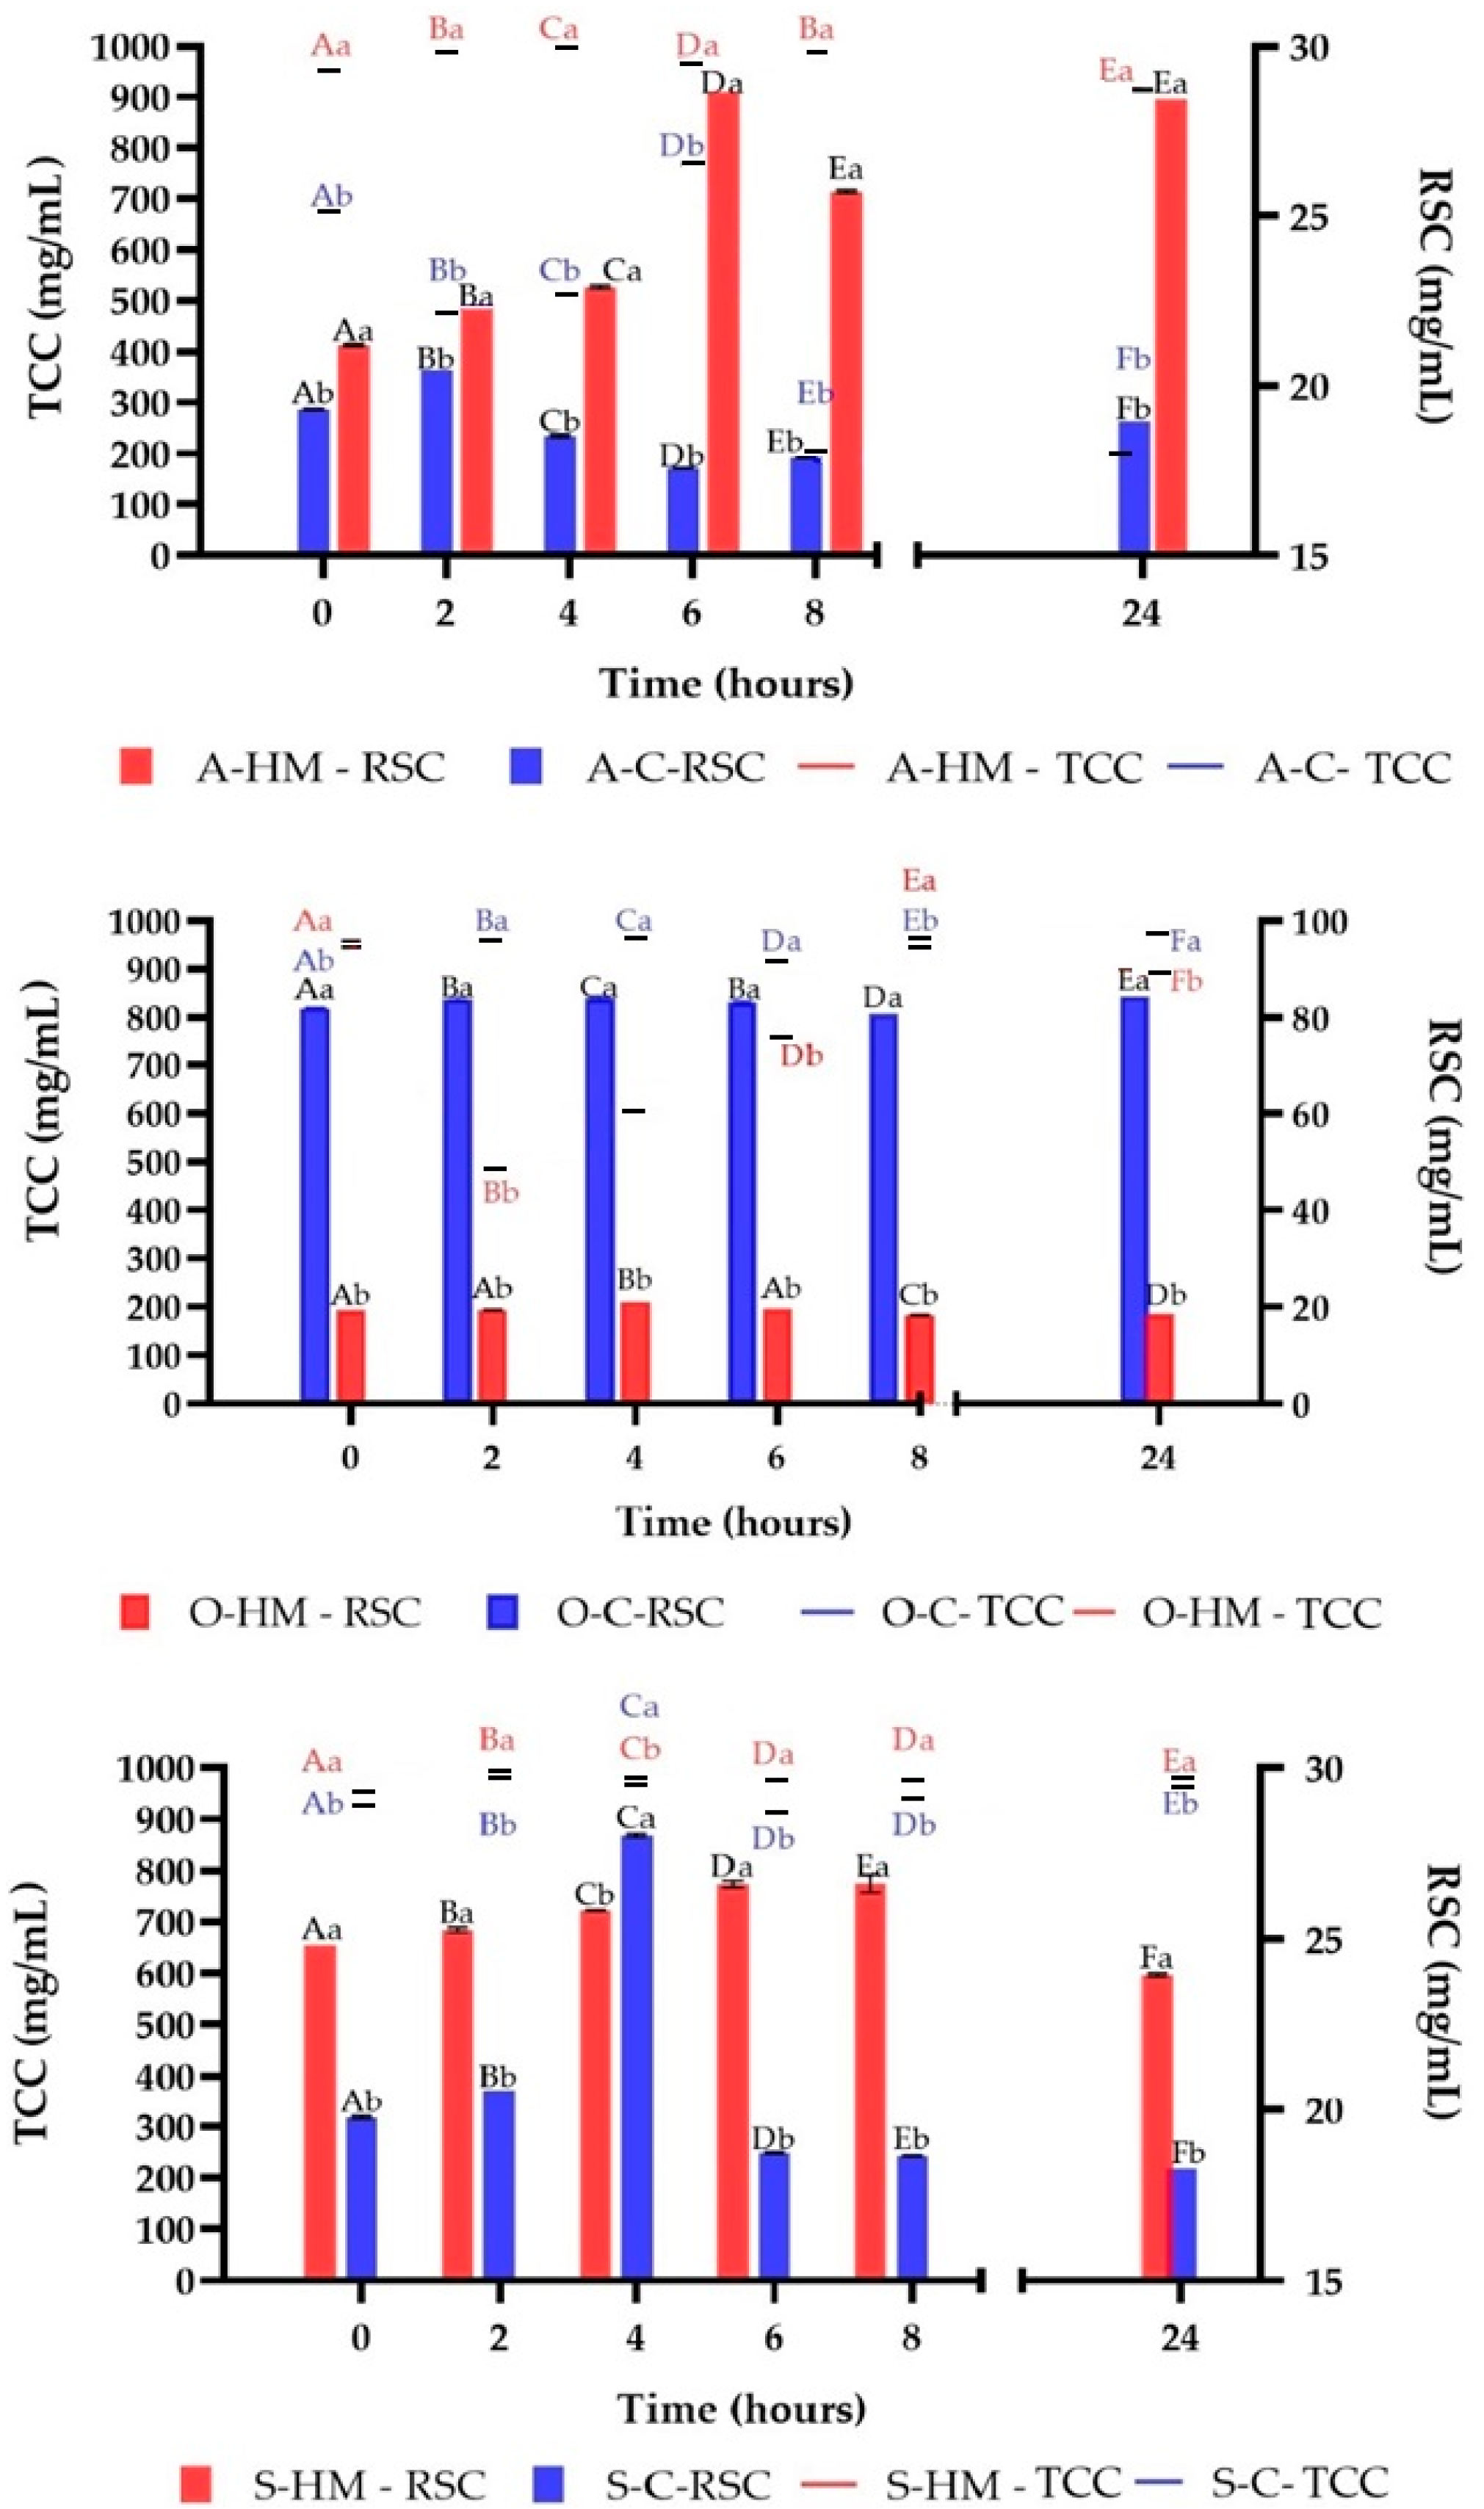
The changes in total carbohydrates content (TCC) and reducing sugars content (RSC) are presented in Figure 6. A high production of RSC was noticed in sample A-HM up to 6 h of fermentation, whereas in contrary for A-C a decrease was noticed (p < 0.05). After 6 h of fermentation an intensive decrease of TCC in sample A-C was found (p < 0.05). For oat milks a generally stable level of RSC was observed. After 2 h of fermentation a significant decrease of TCC in O-HM was noticed, which afterwards increased. On the other hand, TSC of O-C sample remained at a similar level. A low utilization of TCC was observed in S-HM and S-C samples. However, a high decrease of RSC in S-C sample up to 4 h was noticed, which further decreased (p < 0.05). In sample S-HM, the RSC gradually increased up to 8 h, and after 24 h of fermentation a decrease was observed (p < 0.05). For instance, soya milk contains some oligosaccharides (α-galactosyl sucrose derivatives such as raffinose and stachyose) that have prebiotic properties and can be hydrolyzed by some LAB strains [18,24]. The utilization of carbohydrates from plant cell walls, due to enzymatic activity of microorganisms and production of simple sugars is carried out to obtain energy required for growth. It is necessary to point out, that both homemade and commercial plant milks were with no sugar added. However, in other studies this phenomenon is reported to be prolonged during storage (few weeks) [8,35,41], and presumably can be linked with low TCC utilization in the samples.
3.5. The Changes in Total Polyphenolics Content and Total Flavonoids Content
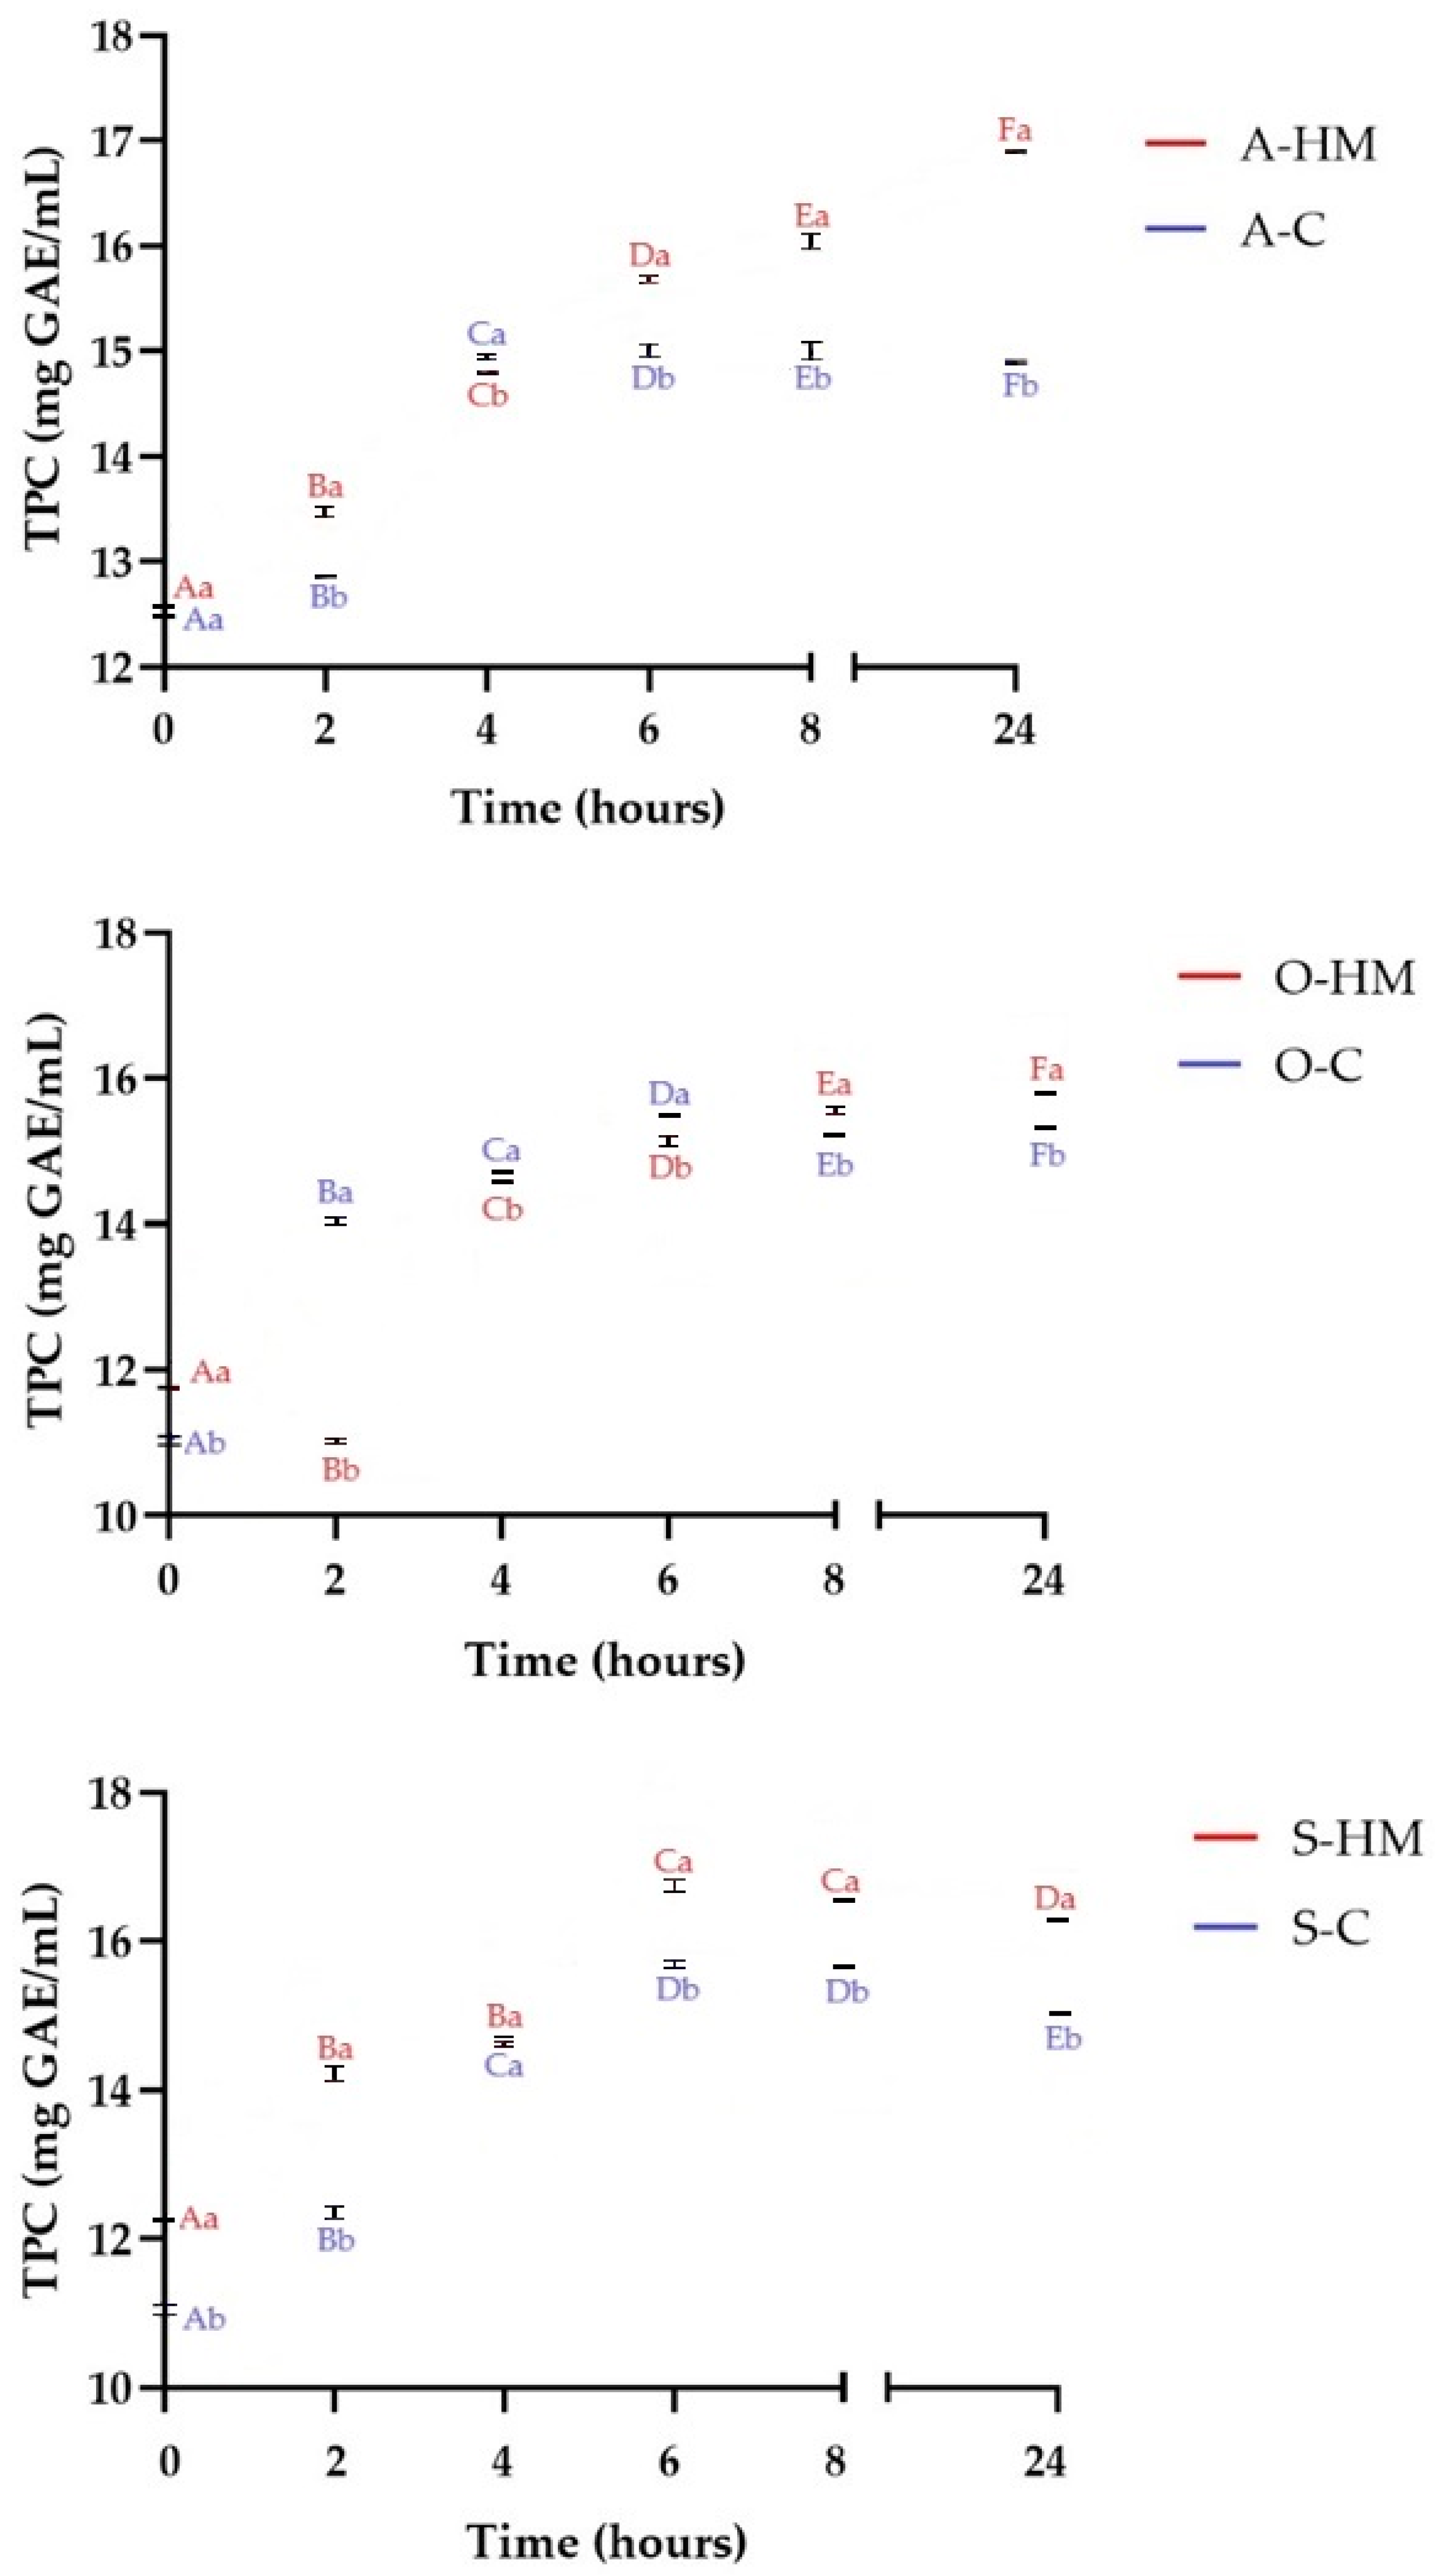
As presented in Figure 7 in all fermented samples there was a significant increase in TPC in comparison to the non-fermented samples (p < 0.05). There was no statistical difference between initial TPC of almond A-HM and A-C samples (p > 0.05), whereas TPC of O-HM and S-HM was higher than TPC of O-C and S-C, respectively (p < 0.05). The initial TPC of soy and oat samples is in line with reported by other authors [22]. On the contrary, the TPC of both almond milks was lower than reported by Topcuoglu and Yilmaz-Ersan [12], and might be attributed to different extraction patterns. As can be seen, after 8 h of fermentation, all homemade milks were characterized by significantly higher TPC than the commercial ones (p < 0.05). The constantly increased TPC trend was observed for sample A-HM and the highest TPC was noticed after 24 h of fermentation (16.90 ± 0.01 mg GAE/mL). Conversely, in sample A-C, the TPC remained at almost constant level after 4 h of fermentation. A similar trend was observed for oat milks (p < 0.05). The increase of TPC was observed for yogurt-like beverage made with oat flakes by Luana et al. [22]. A different pattern was noticed for soy milks, where up to 6 h the TPC of the samples increased, but after 8 h and 24 h of fermentation, a decrease was observed, however S-HM sample had higher TPC than sample S-C (p < 0.05). The changes in TFC are illustrated in Figure 8. Initially, TFC of A-HM and O-HM (0.75 ± 0.05 mgQE/mL and 1.06 ± 0.07 mg/mL) was significantly higher (p < 0.05) than TFC of A-C and O-C (0.12 ± 0.03 mg QE/mL and 0.52 ± 0.02 mg QE/mL, respectively). On the other hand, the TFC of S-C was almost 3-fold higher than observed for S-HM (1.22 ± 0.01 mg QE/mL and 0.44 mg QE/mL, respectively). The TFC of O-HM sample, started to increase after 4 h of fermentation, whereas for other samples the increase was observed after 2 h (p < 0.05). It was observed that after 24 h of fermentation the TFC in all homemade samples was higher than noticed for commercial, and the sample O-HM was characterized by the highest TFC (8.73 ± 0.02 mg QE/mL). Generally, during fermentation of plant-based substrates, bound phenolic compounds are bioconverted from their linked or conjugated forms to their free ones (aglycones). This mechanism is based on the breakdown of the bonds with the plant cell wall components, activities of enzymes (such as β-glucosidase, decarboxylases, esterases, hydrolases, and reductases) as well as metabolic activity of fermenting microorganisms. The progress in the acidity of the samples presumably induced delinking of some phenolic compounds [4,8,35,37]. Phenolic compounds have higher bioavailability in their free form, and the released aglycones have the potential to increase antioxidant activity. A reduction of free phenolic compounds, on the other hand, can occur during fermentation, as they can bind to other molecules present in the food matrix and can be degraded by microbial enzymes, as well as hydrolyzed by specific microbial strains (the effect and degree of influence depends on the species and strain of microorganisms) involved in the process [4]. This mechanism was presumably responsible for observed TPC decrease after 24 h of fermentation in A-C, O-C, S-HM and S-C samples.
3.6. The Changes of Reducing Power and Free Radicals Scavenging Activities
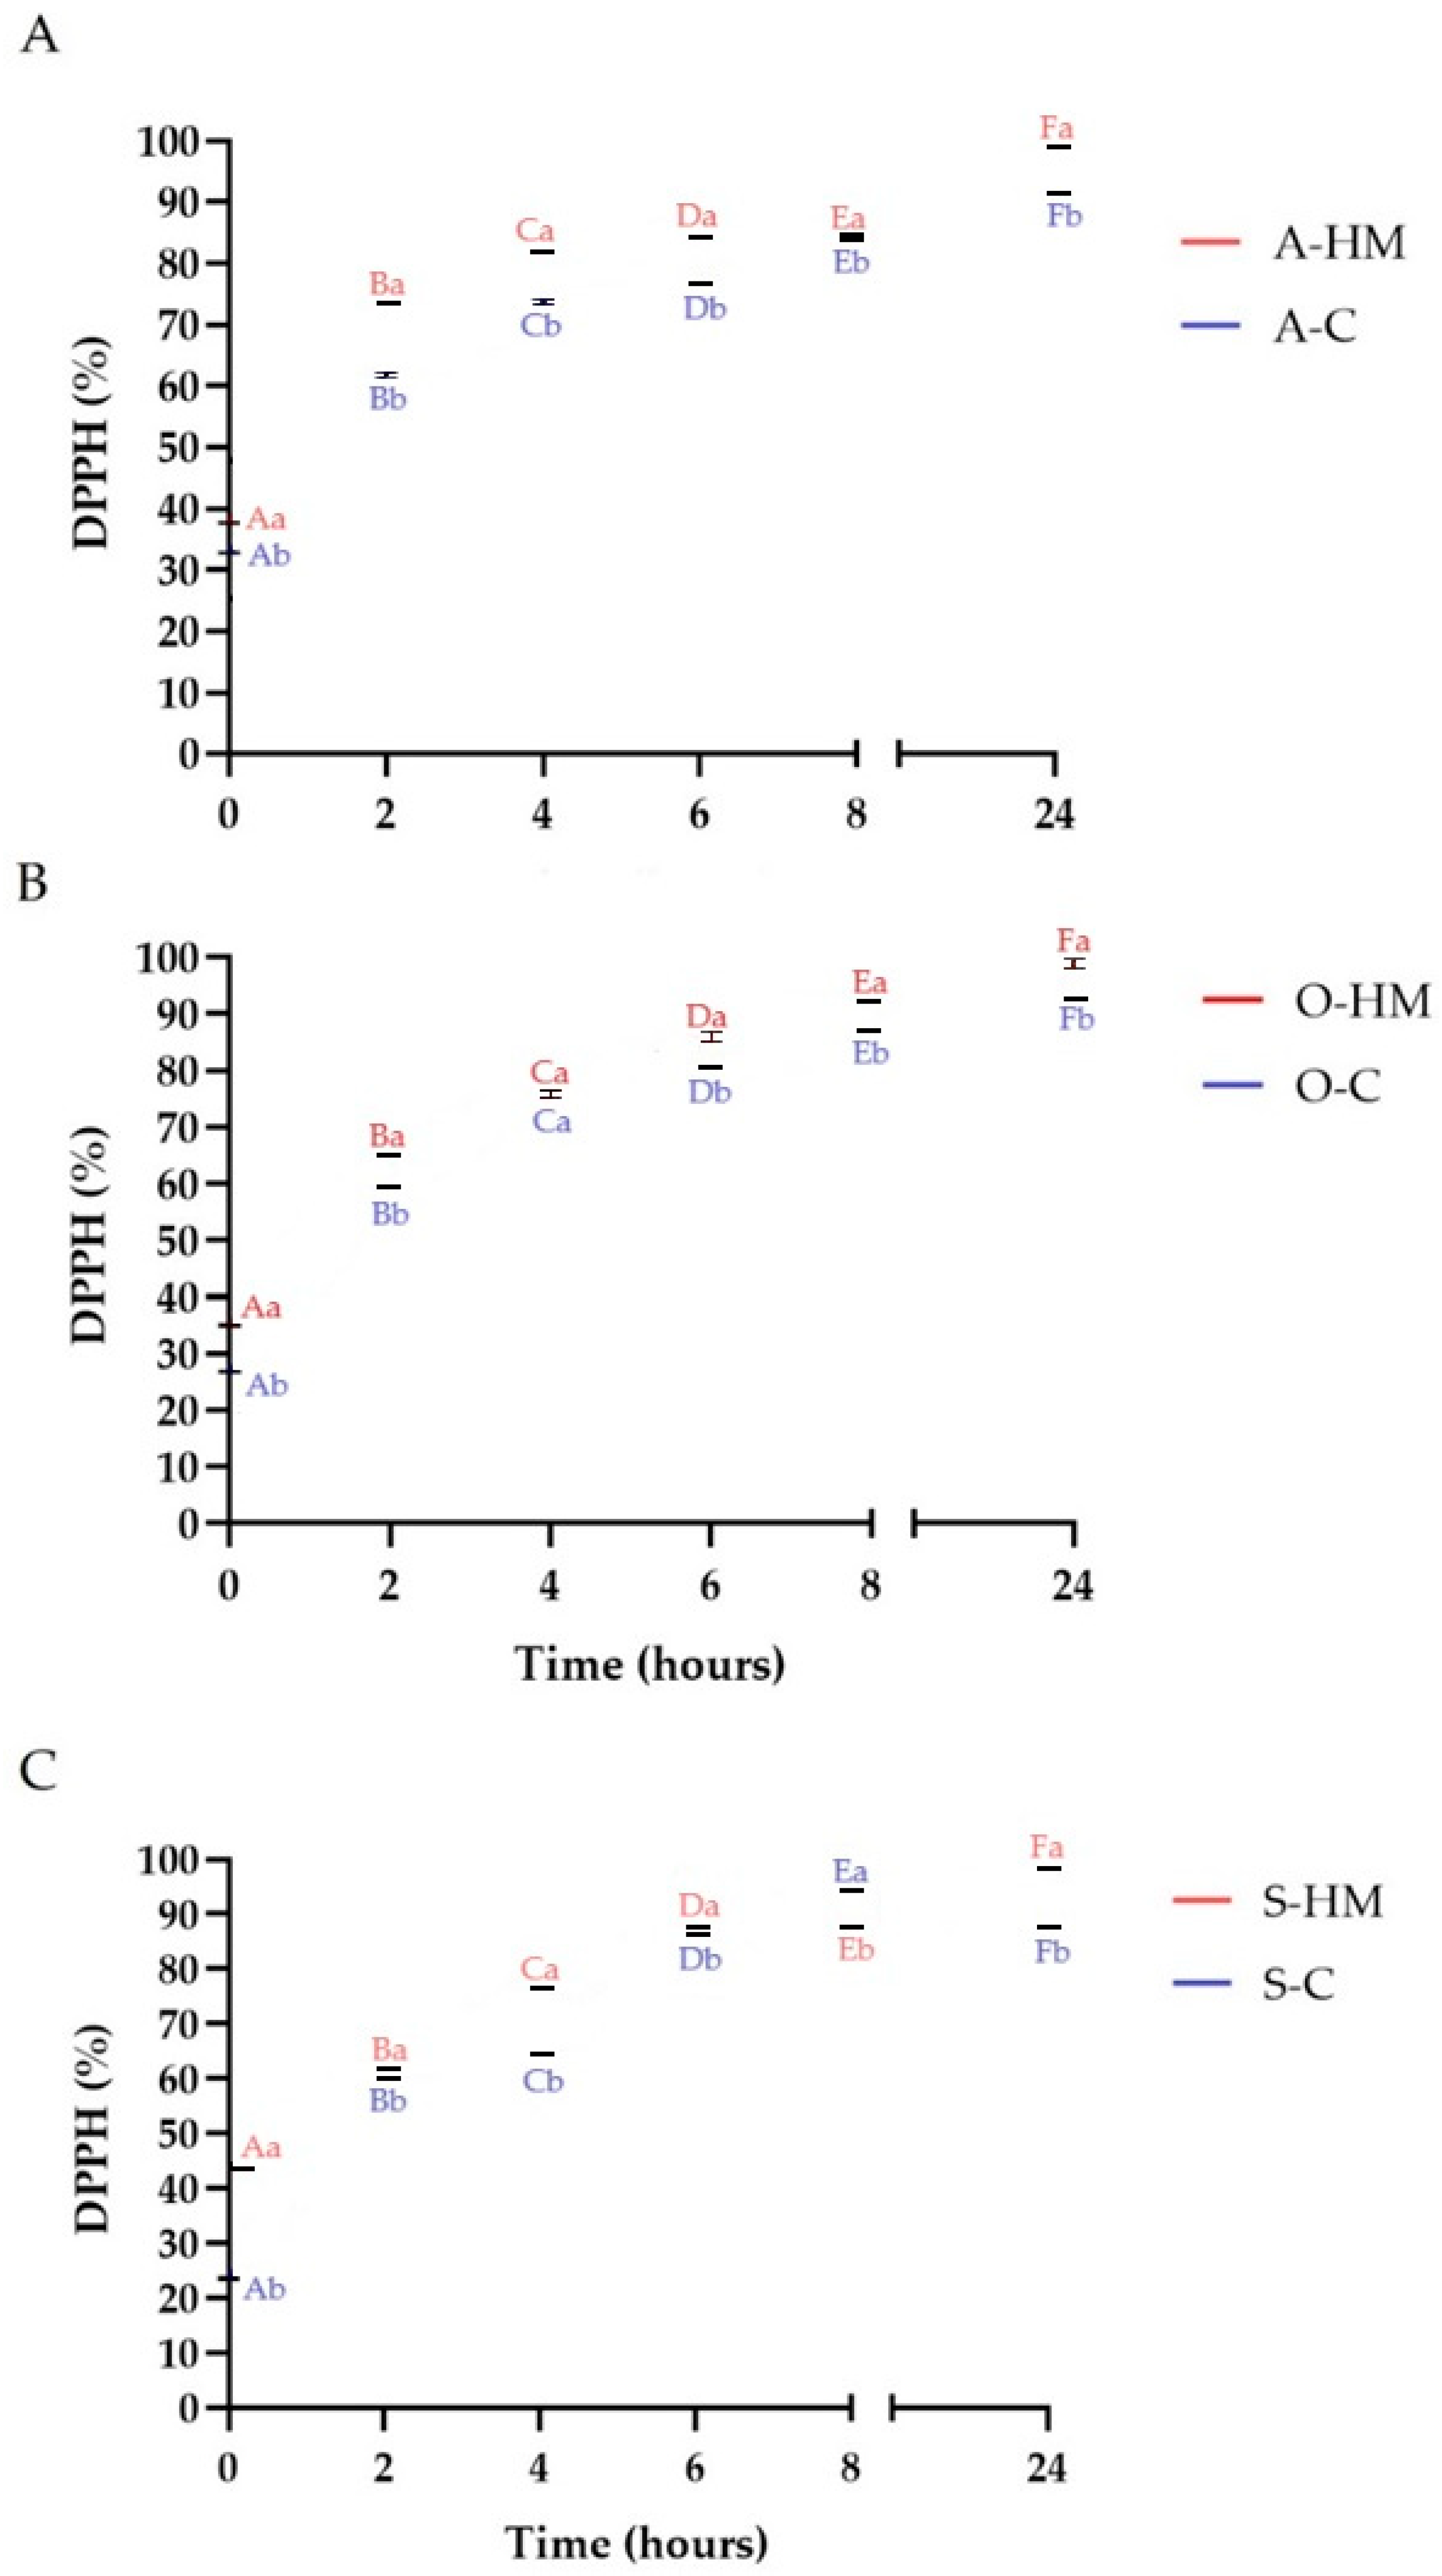
Consuming foods abundant in natural antioxidants improves the body’s antioxidant status by protecting against oxidative stress and damage. The antioxidant capacity of a food products is determined by the concentration and chemical form of components acting as antioxidants. Hence, any processing able to modulate the content of antioxidants in foods impacts their antioxidant capacity [4]. The changes of DPPH, ABTS+· and O2− free radicals scavenging activities are presented in Figure 9, Figure 10 and Figure 11, whereas the reducing power (RP) of the samples is summarized in Table 2. Initially A-HM, O-HM and S-HM milks had higher antioxidant potential that A-C, O-C and S-C samples (p < 0.05). As can be seen in Table 2, the RP of the samples increased significantly by fermentation, however, homemade samples showed higher values than commercial ones (p < 0.05). A similar observation was noticed by Liu et al., who reported a greater RP of milk-kefir and soymilk-kefir than that of the respective milks from which they were made, moreover, production of certain metabolites having superior reducing power during fermentation and react with free radicals to stabilize and terminate radical chain reaction has been suggested [35,47]. The increase of antioxidant activity as a result of fermentation was reported for almond [12,27], oat [22], and soy [26] beverages. A similar observation was also reported for flaxseed oil cake-yogurt beverage [8]. Lorusso et al. also observed increase of antioxidant activity in yogurt-like beverages from quinoa flour [48]. Generally, an increase of DPPH, ABTS+· and O2− radical scavenging activities was observed during fermentation which may be linked with microbial activity, production and liberation of bioactive compounds (such as polyphenolics, flavonoids, free peptides and amino acids) and this observation is in line with the results of TPC, TFC and TFAAL determinations. In case of soy products an important part of antioxidant activity is linked also with isoflavones, that are present mainly as glycosides, which are poorly absorbed in the small intestine when compared with their aglycones [26]. Fermentation is known to be potentially important in the production of aglycones with higher bioactivity and better absorption, facilitating the bioavailability of isoflavones, due to catalytic action of β-glucosidase [12,26]. It was noticed, that after 8 h of fermentation ABTS+· scavenging activity was stabilized at certain levels whereas DPPH continued to increase (except S-C sample, where a decrease was noticed after 24 h). On the other hand for all commercial samples, a decrease of O2− scavenging activity was observed after 24 h, whereas for homemade milks a continuous increase was noticed (p < 0.05). It was reported that amino acids as well as low molecular weight peptides can interact with highly energetic free radicals [9,37,49]. Thus based on the results of this study it is reasonable to conclude that, the total antioxidant activity of fermented almond, oat and soy milks was manifold, which is in agreement with the results of other authors [12,22,26,50].
4. Conclusions
Overall, commercially available and homemade plant-based milk alternatives showed considerable variability in suitability for the production of fermented plant-based milks for fresh consumption, which are gaining more and more popularity due to, inter alia, changing dietary patterns and the possibility of producing home-fermented food in the face of the COVID-19 pandemic cases. Both commercial and home-made plant-based drinks can be successfully fermented, ensuring high number of microorganisms, high content of bioactive ingredients and antioxidant activity. Nevertheless, based on the obtained results, it can be concluded that homemade plant-based milks are an attractive alternative to their commercial counterparts, considering the commercial availability of starter cultures and devices maintaining temperature required for effective fermentation. Moreover, considering the content of bioactive ingredients (such as polyphenols and flavonoids) and antioxidant activity, homemade almond, oat and soy milks showed a more favorable profile. However, certain aspects, such as stability (phase separation), fermentation kinetics optimization, and storage stability in refrigerated conditions have to be taken into account and further research has to be carried out showing the acceptability of such solutions. Furthermore, in-depth studies of proteomic, peptidomic, lipidomic and volatilomic aspects comparing the profile of the changes that occur in commercial and homemade products relating also to their comparison with dairy fermented products should be included in subsequent studies.
Funding
This research was funded by Polish National Centre for Research and Development, grant number LIDER 41/0141/L-11/19/NCBR/2020.
Institutional Review Board Statement
Not applicable.
Informed Consent Statement
Not applicable.
Data Availability Statement
The data presented in this study are available on request from the corresponding author.
Acknowledgments
The author would like to thank Emilia Drozłowska for assistance with study and visualization.
Conflicts of Interest
The author declares no conflict of interest.
References
- Dimidi, E.; Cox, S.R.; Rossi, M.; Whelan, K. Fermented Foods: Definitions and Characteristics, Gastrointestinal Health and Disease. Nutrients 2019, 11, 1806. [Google Scholar] [CrossRef] [PubMed]
- Nazhand, A.; Souto, E.B.; Lucarini, M.; Souto, S.B.; Durazzo, A.; Santini, A. Ready to Use Therapeutical Beverages: Focus on Functional Beverages Containing Probiotics, Prebiotics and Synbiotics. Beverages 2020, 6, 26. [Google Scholar] [CrossRef]
- Kandylis, P.; Pissaridi, K.; Bekatorou, A.; Kanellaki, M.; Koutinas, A.A. Dairy and Non-dairy Probiotic Beverages. Curr. Opin. Food Sci. 2016, 7, 58–63. [Google Scholar] [CrossRef]
- Melini, F.; Melini, V. Impact of Fermentation on Phenolic Compounds and Antioxidant Capacity of Quinoa. Fermentation 2021, 7, 20. [Google Scholar] [CrossRef]
- Martínez-Padilla, E.; Li, K.; Frandsen, H.B.; Joehnke, M.S.; Vargas-Bello-Pérez, E.; Petersen, I.L. In Vitro Protein Digestibility and Fatty Acid Profile of Commercial Plant-based Milk Alternatives. Foods 2020, 9, 1784. [Google Scholar] [CrossRef] [PubMed]
- Bonke, A.; Sieuwerts, S.; Petersen, I.L. Amino Acid Composition of Novel Plant Drinks from Oat, Lentil and Pea. Foods 2020, 9, 429. [Google Scholar] [CrossRef] [PubMed]
- Mishra, S.; Mishra, H.N. Effect of Synbiotic Interaction of Fructooligosaccharide and Probiotics on the Acidification Profile, Textural and Rheological Characteristics of Fermented Soy Milk. Food Bioprocess Technol. 2013, 6, 3166–3176. [Google Scholar] [CrossRef]
- Łopusiewicz, Ł.; Drozłowska, E.; Siedlecka, P.; Mężyńska, M.; Bartkowiak, A. Preparation and Characterization of Novel Flaxseed Oil Cake Yogurt-like Plant Milk Fortified with Inulin. J. Food Nutr. Res. 2020, 59, 61–70. [Google Scholar]
- Łopusiewicz, Ł.; Drozłowska, E.; Tarnowiecka-Kuca, A.; Bartkowiak, A.; Mazurkiewicz-Zapałowicz, K.; Salachna, P. Biotransformation of Flaxseed Oil Cake into Bioactive Camembert-analogue using Lactic Acid Bacteria, Penicillium camemberti and Geotrichum candidum. Microorganisms 2020, 8, 1266. [Google Scholar] [CrossRef]
- Valero-Cases, E.; Cerdá-Bernad, D.; Pastor, J.J.; Frutos, M.J. Non-dairy Fermented Beverages as Potential Carriers to Ensure Probiotics, Prebiotics, and Bioactive Compounds Arrival to the Gut and Their Health Benefits. Nutrients 2020, 12, 1666. [Google Scholar] [CrossRef]
- Montemurro, M.; Pontonio, E.; Coda, R.; Rizzello, C.G. Plant-Based Alternatives to Yogurt: State-of-the-Art and Perspectives of New Biotechnological Challenges. Foods 2021, 10, 316. [Google Scholar] [CrossRef]
- Topcuoglu, E.; Yilmaz-Ersan, L. Effect of Fortification with Almond Milk on Quality Characteristics of Probiotic Yoghurt. J. Food Process. Preserv. 2020, 44, e14943. [Google Scholar] [CrossRef]
- Pimentel, T.C.; da Costa, W.K.A.; Barão, C.E.; Rosset, M.; Magnani, M. Vegan Probiotic Products: A Modern Tendency or the Newest Challenge in Functional Foods. Food Res. Int. 2021, 140, 110033. [Google Scholar] [CrossRef] [PubMed]
- Rasika, D.M.D.; Vidanarachchi, J.K.; Rocha, R.S.; Balthazar, C.F.; Cruz, A.G.; Sant’Ana, A.S.; Ranadheera, C.S. Plant-based Milk Substitutes as Emerging Probiotic Carriers. Curr. Opin. Food Sci. 2021, 38, 8–20. [Google Scholar] [CrossRef]
- Aydar, E.F.; Tutuncu, S.; Ozcelik, B. Plant-based Milk Substitutes: Bioactive Compounds, Conventional and Novel Processes, Bioavailability Studies, and Health Effects. J. Funct. Foods 2020, 70, 103975. [Google Scholar] [CrossRef]
- Mäkinen, O.E.; Wanhalinna, V.; Zannini, E.; Arendt, E.K. Foods for Special Dietary Needs: Non-dairy Plant-based Milk Substitutes and Fermented Dairy-type Products. Crit. Rev. Food Sci. Nutr. 2016, 56, 339–349. [Google Scholar] [CrossRef] [PubMed]
- Tangyu, M.; Muller, J.; Bolten, C.J.; Wittmann, C. Fermentation of Plant-based Milk Alternatives for Improved Flavour and Nutritional value. Appl. Microbiol. Biotechnol. 2019, 103, 9263–9275. [Google Scholar] [CrossRef] [PubMed]
- Angelov, A.; Gotcheva, V.; Kuncheva, R.; Hristozova, T. Development of a New Oat-based Probiotic drink. Int. J. Food Microbiol. 2006, 112, 75–80. [Google Scholar] [CrossRef]
- Silva, A.R.A.; Silva, M.M.N.; Ribeiro, B.D. Health Issues and Technological Aspects of Plant-based Alternative Milk. Food Res. Int. 2020, 131, 108972. [Google Scholar] [CrossRef]
- Karaçalı, R.; Özdemİr, N.; Çon, A.H. Aromatic and Functional Aspects of Kefir Produced Using Soya Milk and Bifidobacterium species. Int. J. Dairy Technol. 2018, 71, 921–933. [Google Scholar] [CrossRef]
- Gokavi, S.; Zhang, L.; Huang, M.K.; Zhao, X.; Guo, M. Oat-based Symbiotic Beverage Fermented by Lactobacillus plantarum, Lactobacillus paracasei ssp. casei and Lactobacillus acidophilus. J. Food Sci. 2005, 70, 216–223. [Google Scholar] [CrossRef]
- Luana, N.; Rossana, C.; Curiel, J.A.; Kaisa, P.; Marco, G.; Rizzello, C.G. Manufacture and Characterization of a Yogurt-like Beverage Made with Oat Flakes Fermented by Selected Lactic Acid Bacteria. Int. J. Food Microbiol. 2014, 185, 17–26. [Google Scholar] [CrossRef] [PubMed]
- Duysburgh, C.; Van Den Abbeele, P.; Kamil, A.; Fleige, L.; De Chavez, P.J.; Chu, Y.; Barton, W.; Sullivan, O.O.; Cotter, P.D.; Quilter, K.; et al. In Vitro–In Vivo Validation of Stimulatory Effect of Oat Ingredients on Lactobacilli. Pathogens 2021, 10, 235. [Google Scholar] [CrossRef] [PubMed]
- Angelov, A.; Yaneva-Marinova, T.; Gotcheva, V. Oats as a Matrix of Choice for Developing Fermented Functional Beverages. J. Food Sci. Technol. 2018, 55, 2351–2360. [Google Scholar] [CrossRef] [PubMed]
- Lipan, L.; Rusu, B.; Sendra, E.; Hernández, F.; Vázquez-Araújo, L.; Vodnar, D.C.; Carbonell-Barrachina, Á.A. Spray Drying and Storage of Probiotic-enriched Almond Milk: Probiotic Survival and Physicochemical Properties. J. Sci. Food Agric. 2020, 100, 3697–3708. [Google Scholar] [CrossRef] [PubMed]
- Myagmardorj, B.; Purev, M.E.; Batdorj, B. Functional Properties of Fermented Soymilk by Lactobacillus fermentum BM-325. Mong. J. Chem. 2018, 19, 32–37. [Google Scholar] [CrossRef]
- Bernat, N.; Cháfer, M.; Chiralt, A.; Moisés Laparra, J.; González-Martínez, C. Almond Milk Fermented with Different Potentially Probiotic Bacteria Improves Iron Uptake by Intestinal Epithelial (Caco-2) Cells. Int. J. Food Stud. 2015, 4, 49–60. [Google Scholar] [CrossRef]
- Mårtensson, O.; Dueñas-Chasco, M.; Irastorza, A.; Öste, R.; Holst, O. Comparison of Growth Characteristics and Exopolysaccharide Formation of Two Lactic Acid Bacteria Strains, Pediococcus damnosus 2.6 and Lactobacillus brevis g-77, in an Oat-based, Nondairy Medium. LWT Food Sci. Technol. 2003, 36, 353–357. [Google Scholar] [CrossRef]
- Mårtensson, O.; Öste, R.; Holst, O. Lactic Acid Bacteria in an Oat-based Non-dairy Milk Substitute: Fermentation Characteristics and Exopolysaccharide Formation. LWT Food Sci. Technol. 2000, 33, 525–530. [Google Scholar] [CrossRef]
- Atalar, I. Functional Kefir Production from High Pressure Homogenized Hazelnut Milk. LWT 2019, 107, 256–263. [Google Scholar] [CrossRef]
- Aysu, Ş.; Akıl, F.; Çevik, E.; Kılıç, M.E.; İlyasoğlu, H. Development of Homemade Hazelnut Milk-based Beverage. J. Culin. Sci. Technol. 2020, 20, 421–429. [Google Scholar] [CrossRef]
- Pieroni, A.; Vandebroek, I.; Prakofjewa, J.; Bussmann, R.W.; Paniagua-Zambrana, N.Y.; Maroyi, A.; Torri, L.; Zocchi, D.M.; Dam, A.T.K.; Khan, S.M.; et al. Taming the Pandemic? The Importance of Homemade Plant-based Foods and Beverages as Community Responses to COVID-19. J. Ethnobiol. Ethnomed. 2020, 16, 75. [Google Scholar] [CrossRef] [PubMed]
- Antunes, A.E.C.; Vinderola, G.; Xavier-Santos, D.; Sivieri, K. Potential Contribution of Beneficial Microbes to Face the COVID-19 Pandemic. Food Res. Int. 2020, 136, 109577. [Google Scholar] [CrossRef] [PubMed]
- Alkhatib, A. Antiviral Functional Foods and Exercise Lifestyle Prevention of Coronavirus. Nutrients 2020, 12, 2633. [Google Scholar] [CrossRef] [PubMed]
- Łopusiewicz, Ł.; Drozłowska, E.; Siedlecka, P.; Mężyńska, M.; Bartkowiak, A.; Sienkiewicz, M.; Zielińska-Bliźniewska, H.; Kwiatkowski, P. Development, Characterization, and Bioactivity of Non-Dairy Kefir-Like Fermented Beverage Based on Flaxseed Oil Cake. Foods 2019, 8, 544. [Google Scholar] [CrossRef] [PubMed]
- AOAC. Determination of Moisture, Ash, Protein and Fat. Official Method of Analysis of the Association of Analytical Chemists, 18th ed.; AOAC: Washington DC, USA, 2005. [Google Scholar]
- Łopusiewicz, Ł.; Drozłowska, E.; Trocer, P.; Kwiatkowski, P.; Bartkowiak, A.; Gefrom, A.; Sienkiewicz, M. The Effect of Fermentation with Kefir Grains on the Physicochemical and Antioxidant Properties of Beverages from Blue Lupin (Lupinus angustifolius L.) Seeds. Molecules 2020, 25, 5791. [Google Scholar] [CrossRef] [PubMed]
- Dubois, M.; Gilles, K.A.; Hamilton, J.K.; Rebers, P.A.; Smith, F. Colorimetric Method for Determination of Sugars and Related Substances. Anal. Chem. 1956, 28, 350–356. [Google Scholar] [CrossRef]
- Goa, J. A Micro Biuret Method for Protein Determination Determination of Total Protein in Cerebrospinal Fluid. Scand. J. Clin. Lab. Investig. 1953, 5, 218–222. [Google Scholar] [CrossRef]
- El-Batawy, O.I.; Mahdy, S.M.; Gohari, S.T. Development of Functional Fermented Oat Milk by Using Probiotic Strains and Whey Protein. Int. J. Dairy Sci. 2019, 14, 21–28. [Google Scholar] [CrossRef]
- Garro, M.S.; De Valdez, G.F.; Oliver, G.; De Giori, G.S. Growth Characteristics and Fermentation Products of Streptococcus salivarius subsp. thermophilus, Lactobacillus casei and L. fermentum in Soymilk. Eur. Food Res. Technol. 1998, 206, 72–75. [Google Scholar] [CrossRef]
- Drozłowska, E.; Łopusiewicz, Ł.; Mężyńska, M.; Bartkowiak, A. The Effect of Native and Denaturated Flaxseed Meal Extract on Physiochemical Properties of Low Fat Mayonnaises. J. Food Meas. Charact. 2020, 14, 1135–1145. [Google Scholar] [CrossRef]
- Picone, C.S.F.; Cunha, R.L. Influence of pH on Formation and Properties of Gellan Gels. Carbohydr. Polym. 2011, 84, 662–668. [Google Scholar] [CrossRef]
- Mennah-Govela, Y.A.; Cai, H.; Chu, J.; Kim, K.; Maborang, M.K.; Sun, W.; Bornhorst, G.M. Buffering Capacity of Commercially Available Foods is Influenced by Composition and Initial Properties in the Context of Gastric Digestion. Food Funct. 2020, 11, 2255–2267. [Google Scholar] [CrossRef] [PubMed]
- Rui, X.; Zhang, Q.; Huang, J.; Li, W.; Chen, X.; Jiang, M.; Dong, M. Does Lactic Fermentation Influence Soy Yogurt Protein Digestibility: A Comparative Study Between Soymilk and Soy Yogurt at Different pH. J. Sci. Food Agric. 2019, 99, 861–867. [Google Scholar] [CrossRef] [PubMed]
- Hou, J.W.; Yu, R.C.; Chou, C.C. Changes in Some Components of Soymilk During Fermentation with Bifidobacteria. Food Res. Int. 2000, 33, 393–397. [Google Scholar] [CrossRef]
- Liu, J.-R.; Chen, M.-J.; Lin, C.-W. Antimutagenic and Antioxidant Properties of Milk−Kefir and Soymilk−Kefir. J. Agric. Food Chem. 2005, 53, 2467–2474. [Google Scholar] [CrossRef] [PubMed]
- Lorusso, A.; Coda, R.; Montemurro, M.; Rizzello, C. Use of Selected Lactic Acid Bacteria and Quinoa Flour for Manufacturing Novel Yogurt-Like Beverages. Foods 2018, 7, 51. [Google Scholar] [CrossRef] [PubMed]
- Barac, M.; Vucic, T.; Zilic, S.; Pesic, M.; Sokovic, M.; Petrovic, J.; Kostic, A.; Ignjatovic, I.S.; Milincic, D. The Effect of In Vitro Digestion on Antioxidant, ACE-inhibitory and Antimicrobial Potentials of Traditional Serbian White-brined Cheeses. Foods 2019, 8, 94. [Google Scholar] [CrossRef]
- Gupta, M.; Bajaj, B.K. Development of Fermented Oat Flour Beverage as a Potential Probiotic Vehicle. Food Biosci. 2017, 20, 104–109. [Google Scholar] [CrossRef]
Figure 1.
Lactic Acid Bacteria counts during fermentation. Means with different lowercase (representing the differences between commercial and homemade milks) are significantly different at p < 0.05. Means with different capital letters (representing the changes in fermentation time) are significantly different at p < 0.05. (A)—comparison of almond milks: A-HM—homemade almond milk, A-C—commercial almond milk; (B)—comparison of oat milks: O-HM—homemade oat milk, O-C—commercial oat milk; (C)—comparison of soy milks: S-HM—homemade soy milk, S-C—commercial soy milk.

Figure 2.
pH changes during fermentation. Means with different lowercase (representing the differences between commercial and homemade milks) are significantly different at p < 0.05. Means with different capital letters (representing the changes in fermentation time) are significantly different at p < 0.05. (A)—comparison of almond milks: A-HM—homemade almond milk, A-C—commercial almond milk; (B)—comparison of oat milks: O-HM—homemade oat milk, O-C—commercial oat milk; (C)—comparison of soy milks: S-HM—homemade soy milk, S-C—commercial soy milk.

Figure 3.
Viscosity changes during fermentation. Means with different lowercase (representing the differences between commercial and homemade milks) are significantly different at p < 0.05. Means with different capital letters (representing the changes in fermentation time) are significantly different at p < 0.05. (A)—comparison of almond milks: A-HM—homemade almond milk, A-C—commercial almond milk; (B)—comparison of oat milks: O-HM—homemade oat milk, O-C—commercial oat milk; (C)—comparison of soy milks: S-HM—homemade soy milk, S-C—commercial soy milk.

Figure 4.
The appearance of the samples at time 0 (A), after 8 h (B), and 24 h (C) of fermentation. A-HM—homemade almond milk, A-C—commercial almond milk, O-HM—homemade oat milk, O-C—commercial oat milk, S-HM—homemade soy milk, S-C—commercial soy milk.
Figure 4.
The appearance of the samples at time 0 (A), after 8 h (B), and 24 h (C) of fermentation. A-HM—homemade almond milk, A-C—commercial almond milk, O-HM—homemade oat milk, O-C—commercial oat milk, S-HM—homemade soy milk, S-C—commercial soy milk.

Figure 5.
Changes of protein content (PC) and total free amino acids level (TFAAL) during fermentation. Means with different lowercase (representing the differences between commercial and homemade milks) are significantly different at p < 0.05. Means with different capital letters (representing the changes in fermentation time) are significantly different at p < 0.05. A-HM—homemade almond milk, A-C—commercial almond milk, O-HM—homemade oat milk, O-C—commercial oat milk, S-HM—homemade soy milk, S-C—commercial soy milk.

Figure 6.
Changes of total carbohydrates content (TCC) and reducing sugars content (RSC) during fermentation. Means with different lowercase (representing the differences between commercial and homemade milks) are significantly different at p < 0.05. Means with different capital letters (representing the changes in fermentation time) are significantly different at p < 0.05. A-HM—homemade almond milk, A-C—commercial almond milk, O-HM—homemade oat milk, O-C—commercial oat milk, S-HM—homemade soy milk, S-C—commercial soy milk.

Figure 7.
Changes of total polyphenolic content (TPC) during fermentation. Means with different lowercase (representing the differences between commercial and homemade milks) are significantly different at p < 0.05. Means with different capital letters (representing the changes in fermentation time) are significantly different at p < 0.05. A-HM—homemade almond milk, A-C—commercial almond milk, O-HM—homemade oat milk, O-C—commercial oat milk, S-HM—homemade soy milk, S-C—commercial soy milk.

Figure 8.
Changes of total flavonoid content (TFC) during fermentation. Means with different lowercase (representing the differences between commercial and homemade milks) are significantly different at p < 0.05. Means with different capital letters (representing the changes in fermentation time) are significantly different at p < 0.05. (A)—comparison of almond milks: A-HM—homemade almond milk, A-C—commercial almond milk; (B)—comparison of oat milks: O-HM—homemade oat milk, O-C—commercial oat milk; (C)—comparison of soy milks: S-HM—homemade soy milk, S-C—commercial soy milk.

Figure 9.
Changes of DPPH scavenging activity during fermentation. Means with different lowercase (representing the differences between commercial and homemade milks) are significantly different at p < 0.05. Means with different capital letters (representing the changes in fermentation time) are significantly different at p < 0.05. (A)—comparison of almond milks: A-HM—homemade almond milk, A-C—commercial almond milk; (B)—comparison of oat milks: O-HM—homemade oat milk, O-C—commercial oat milk; (C)—comparison of soy milks: S-HM—homemade soy milk, S-C—commercial soy milk.

Figure 10.
Changes of ABTS scavenging activity during fermentation. Means with different lowercase (representing the differences between commercial and homemade milks) are significantly different at p < 0.05. Means with different capital letters (representing the changes in fermentation time) are significantly different at p < 0.05. (A)—comparison of almond milks: A-HM—homemade almond milk, A-C—commercial almond milk; (B)—comparison of oat milks: O-HM—homemade oat milk, O-C—commercial oat milk; (C)—comparison of soy milks: S-HM—homemade soy milk, S-C—commercial soy milk.

Figure 11.
Changes of O2− scavenging activity during fermentation. Means with different lowercase (representing the differences between commercial and homemade milks) are significantly different at p < 0.05. Means with different capital letters (representing the changes in fermentation time) are significantly different at p < 0.05. (A)—comparison of almond milks: A-HM—homemade almond milk, A-C—commercial almond milk; (B)—comparison of oat milks: O-HM—homemade oat milk, O-C—commercial oat milk; (C)—comparison of soy milks: S-HM—homemade soy milk, S-C—commercial soy milk.


Table 1.
Total Solids Content (TSC) of the samples.
| Sample | |
|---|---|
| TSC (%) | |
| A-HM | 14.43 ± 0.17 aA |
| A-C | 2.59 ± 0.08 bF |
| O-HM | 9.98 ± 0.10 aB |
| O-C | 5.63 ± 0.03 bE |
| S-HM | 8.08 ± 0.04 aC |
| S-C | 7.35 ± 0.09 bD |
Means with different lowercase (in pairs, representing the differences between commercial and homemade milks) are significantly different at p < 0.05. Means with different capital letters (representing differences between milk samples) are significantly different at p < 0.05. A-HM—homemade almond milk, A-C—commercial almond milk, O-HM—homemade oat milk, O-C—commercial oat milk, S-HM—homemade soy milk, S-C—commercial soy milk.
Table 2.
Changes of reducing power during fermentation.
| Sample * | ||||||
|---|---|---|---|---|---|---|
| 0 | 2 | 4 | 6 | 8 | 24 | |
| RP 700 nm | ||||||
| A-HM | 0.032 ± 0.003 Ab | 0.086 ± 0.002 Bb | 0.175 ± 0.001 Cb | 0.188 ± 0.000 Db | 0.214 ± 0.002 Ea | 0.286 ± 0.000 Fa |
| A-C | 0.057 ± 0.001 Aa | 0.089 ± 0.002 Ba | 0.183 ± 0.000 Ca | 0.198 ± 0.003 Da | 0.212 ± 0.001 Ea | 0.273 ± 0.001 Fb |
| O-HM | 0.017 ± 0.002 Aa | 0.070 ± 0.003 Ba | 0.121 ± 0.000 Ca | 0.139 ± 0.002 Db | 0.260 ± 0.001 Ea | 0.387 ± 0.002 Fa |
| O-C | 0.010 ± 0.004 Ab | 0.027 ± 0.000 Bb | 0.039 ± 0.002 Cb | 0.168 ± 0.001 Da | 0.252 ± 0.002 Eb | 0.297 ± 0.001 Fb |
| S-HM | 0.039 ± 0.005 Ab | 0.075 ± 0.003 Bb | 0.181 ± 0.001 Ca | 0.195 ± 0.002 Da | 0.229 ± 0.000 Eb | 0.273 ± 0.002 Fa |
| S-C | 0.077 ± 0.001 Aa | 0.117 ± 0.002 Ba | 0.168 ± 0.001 Cb | 0.186 ± 0.001 Db | 0.256 ± 0.001 Da | 0.260 ± 0.002 Eb |
Means with different lowercase (representing the differences between commercial and homemade milks) are significantly different at p < 0.05. Means with different capital letters (representing the changes in fermentation time) are significantly different at p < 0.05. * A-HM—homemade almond milk, A-C—commercial almond milk, O-HM—homemade oat milk, O-C—commercial oat milk, S-HM—homemade soy milk, S-C—commercial soy milk.
Disclaimer/Publisher’s Note: The statements, opinions and data contained in all publications are solely those of the individual author(s) and contributor(s) and not of MDPI and/or the editor(s). MDPI and/or the editor(s) disclaim responsibility for any injury to people or property resulting from any ideas, methods, instructions or products referred to in the content. |
© 2023 by the author. Licensee MDPI, Basel, Switzerland. This article is an open access article distributed under the terms and conditions of the Creative Commons Attribution (CC BY) license (https://creativecommons.org/licenses/by/4.0/).
Share and Cite
MDPI and ACS Style
Łopusiewicz, Ł. Comparison of Homemade and Commercial Plant-Based Drinks (Almond, Oat, Soy) Fermented with Yogurt Starter Culture for Fresh Consumption. Fermentation 2024, 10, 35. https://doi.org/10.3390/fermentation10010035
AMA Style
Łopusiewicz Ł. Comparison of Homemade and Commercial Plant-Based Drinks (Almond, Oat, Soy) Fermented with Yogurt Starter Culture for Fresh Consumption. Fermentation. 2024; 10(1):35. https://doi.org/10.3390/fermentation10010035
Chicago/Turabian StyleŁopusiewicz, Łukasz. 2024. "Comparison of Homemade and Commercial Plant-Based Drinks (Almond, Oat, Soy) Fermented with Yogurt Starter Culture for Fresh Consumption" Fermentation 10, no. 1: 35. https://doi.org/10.3390/fermentation10010035
Note that from the first issue of 2016, this journal uses article numbers instead of page numbers. See further details here.