Article

Valorisation Process Using Lactic Acid Bacteria Fermentation Induces Significant Changes in the Physical and Functional Properties of Brewers Spent Yeast

1
School of Food and Nutritional Science, University College Cork, T12K8AF Cork, Ireland
2
Sapienza Universita di Roma, Piazzale Aldo Moro, 5, 00185 Roma, Italy
3
APC Microbiome Institute, University College Cork, T12YT20 Cork, Ireland
*
Author to whom correspondence should be addressed.
Fermentation 2024, 10(3), 136; https://doi.org/10.3390/fermentation10030136
Submission received: 12 February 2024 / Accepted: 28 February 2024 / Published: 29 February 2024
(This article belongs to the Section Fermentation for Food and Beverages)

Abstract

:
Brewer’s spent yeast (BSY) is a plentiful by-product of the brewing process. Currently regarded as a waste product, this low-value material is used in animal feed formulations or disposed of. However, BSY is known to be nutritionally dense, particularly regarding high-quality proteins, fibre, vitamins, and minerals. Previous work has examined the effect of a process including fermentation with Lactobacillus amylovorus FST 2.11 on BSY and indicates a reduction in bitterness intensity and an increase in sour and fruity flavours. The current study expands on this previous work, examining the changes in composition and functionality resulting from this upcycling process. The major changes include protein degradation and a decrease in pH, leading to increased protein solubility by 41%, increased foam stability by up to 69% at pH 7, and improved emulsion stabilising characteristics as well as differences in rheological behaviour during heating. Compositional changes are also detailed, with evidence of glucan and trehalose degradation. These changes in the physical and functional properties of BSY provide useful information, particularly with regard to the incorporation of BSY into food products for human consumption.

1. Introduction

Brewer’s spent yeast (BSY) is an abundant waste product of the brewing industry. Brewing yeast, generally the Saccharomyces species, is used to convert simple sugars in wort to ethanol during fermentation. However, at the end of the fermentation process, a large amount of excess yeast is produced at ~2.8–3.4 million tonnes globally per year [1,2]. Currently, this plentiful, low-value waste product is primarily used in animal feed formulations or is disposed of in landfills. Although this yeast no longer has optimal metabolic activity, it is high in valuable nutrients, including proteins and fibre, as well as vitamins and minerals [3]. Food poverty and insecurity remain high, with 29.6% (2.4 billion people) of the global population declared moderately or severely food insecure in 2022 and 148 million children experiencing stunted growth as a result of malnutrition [4]. In a world facing increased food insecurity and environmental challenges, recycling food processing side-streams, otherwise regarded as waste, into valuable nutrition sources is gaining traction as a means of dealing with these issues.
However, the nutritional potential of brewer’s spent yeast remains largely unutilised. This is primarily due to the issue of taste. As a result of hops’ addition during the brewing process, yeast cells become complexed with iso-α-acids, which are responsible for an extremely bitter taste in BSY [5]. Another reason may be the lack of knowledge and familiarity regarding the use of spent yeast as a primary nutrition source for humans. In relation to this, there is a lack of research regarding spent yeast valorisation outside of animal feed formulations, with the majority of brewing by-product studies focusing on brewer’s spent grain and/or agricultural applications. Also, the majority of research focuses on the production and characterisation of fractions extracted from spent yeast as opposed to attempting to valorise the whole cell biomass [6,7,8,9]. However, there is an ever-increasing interest in the use of single-cell organisms in human nutrition, particularly concerning proteins, as a means of feeding a growing population without the environmental requirements of meat and dairy [10,11,12].
There is an ever-increasing interest in sustainability, circular economy, and reducing environmental impact by taking steps to upcycle and valorise otherwise underutilised food processing by-products. In 2015, the Sustainable Development Goals (SDGs) were proposed by the United Nations as a means of improving the lives and future prospects of all people. This research, in particular, ties into Goal 12—‘Responsible production and consumption’—which aims to substantially reduce food waste along production chains through prevention, reduction, recycling, and reuse. A previous study employed a process including lactic acid bacteria (LAB) fermentation to successfully improve the sensory and quality characteristics of brewers’ spent yeast [13]. LAB fermentation with Lactobacillus amylovorus FST 2.11 significantly reduced the bitterness of BSY as perceived by a sensory panel while increasing the intensity of fruity and sour flavours. In addition to changes in sensory characteristics, significant protein degradation was observed as a result of the processing, which likely affected functional behaviour [13]. Thus, processing, including LAB fermentation, is a successful means of upcycling BSY into a more palatable, nutritious food ingredient. What remains is to assess the physical nature of this novel food material and to determine suitable applications and processing parameters.
This study examines the effect of a process involving BSY standardisation, autolysis, and fermentation with L. amylovorus FST 2.11, on the physical and functional properties of BSY. Physicochemical factors such as pH, TTA, foaming properties, rheological behaviour, protein solubility, and potential emulsifying abilities were investigated. A furthered understanding of how BSY behaves during processing, and its potential interactions with other constituents in a complex food system, will be a stepping stone to the development of BSY-enriched food products, where the full nutritional and functional potential of BSY can be utilised.

2. Materials and Methods

2.1. Material

Control brewers’ spent yeast (CBSY) and processed brewers’ spent yeast (PBSY) were prepared as described by Jaeger et al. [13]. Briefly, the processing of the BSY consisted of standardisation, autolysis, sterilisation, and fermentation with Lactobacillus amylovorus FST 2.11. BSY was centrifuged at 12,000× g for 30 min, and the pellet was resuspended to a solid content of 40%. After this, 4% (w/w) sucrose was added, and autolysis was induced by heating to 50 °C for 20 h. The BSY was then inoculated with 1% Lactobacillus amylovorus FST 2.11 (UCC culture collection) in an overnight culture and fermented at 30 °C for 72 h. At the end of the fermentation period, the BSY was pasteurised at 72 °C for 15 min. BSY, which did not undergo any standardisation or fermentation, was pasteurised at 72 °C for 15 min and included as a control. Subsequently, the yeast material was frozen at −80 °C and freeze-dried to produce a dried ingredient. The dried and fermented BSY is referred to as processed BSY (PBSY), and the unfermented BSY is referred to as control BSY (CBSY). The composition of these powders was then analysed and is presented in Table 1 [13].

2.2. α-,β-, and Total Glucans

The 1,3:1,6-β-glucan and α-glucan content were determined using the Yeast and Mushroom β-glucan assay kit (Megazyme, Bray, Ireland). This method involves solubilising and hydrolysing all glucans (1,3:1,6-β-D-Glucans, 1,3-β-D-glucans, and α -glucans) in highly concentrated sulphuric acid. The remaining glucan fragments are then hydrolysed to glucose, using 1,3-β-glucanase and β-glucosidase. Glucose quantification using the glucose oxidase/peroxidase (GOPOD) reagent gives the value for total glucans. Separately, α-glucans (i.e., glycogen and starch) and sucrose were hydrolysed using amyloglucosidase and invertase. β-glucan was then determined by its difference.

2.3. Fatty Acid Composition

The fatty acid composition was determined externally by Chelab SRL (Treviso, Italy), according to ISO 16958:2015 [14].

2.4. FODMAPs and Trehalose

The quantification of mono-, di-, galactooligosaccharides, fructans, and polyols was conducted using high-performance anion-exchange chromatography coupled with pulsed amperometric detection (HPAEC-PAD), performed on a DionexTM ICS-5000+ system (Sunnyvale, CA, USA), as described by Ispiryan et al. (2019) [15]. All carbohydrates, except for the fructans, were quantified using authentic reference standards. The total fructan content was determined after enzymatic hydrolysis with two enzyme mixtures, A (containing α-galactosidase and amyloglucosidase) and B, where B contained the same enzymes as A as well as fructan-degrading inulinases. The significance of the fructose released from sucrose and the fructose released from the hydrolysis with enzyme mixture B was determined. All levels below 0.1 g/100 g were defined as not detected (n.d.). All extractions were carried out in triplicate. The results are presented as the gram analyte per 100 g of the sample on a dry weight basis (g/100 g DM). The extraction and detection method of FODMAP analysis was also used to quantify disaccharide trehalose: a major yeast carbohydrate that is not classed as a FODMAP.

2.5. Resistant, Digestible, and Total Starch

Digestible and resistant starch were determined using the K-RAPRS kit (Megazyme, Bray, Ireland), with the addition of a sample blank, i.e., samples where distilled water was added in the place of enzyme preparations. This allowed for the determination of innate D-glucose in the samples before analysis. This method initially degraded the digestible starch to D-glucose using pancreatic α-amylase (PAA) and amyloglucosidase (AMG). After the reaction was terminated using ethanol, the resistant starch fraction was separated by centrifugation and was rinsed several times using ethanol. D-glucose (i.e., the digestible starch) was measured using the glucose oxidase/peroxidase (GOPOD) reagent. Resistant starch in the pellet was then solubilised under alkali conditions and quantitively hydrolysed to D-glucose via amyloglucosidase.

2.6. pH and Total Titratable Acidity (TTA)

The pH and TTA of CBSY and PBSY were determined by weighing 10 g of material into a beaker and adding 95 mL of water and 5 mL of acetone. The samples were then mixed using a stirring bar until they were well dispersed. The pH was measured using a pH meter (Mettler Toledo, Columbus, OH, USA), and the TTA was determined by titration with 0.1 M of NaOH until a pH of 8.5 was reached.

2.7. Foaming Capacity and Stability

Foaming behaviour was examined as described by Alonso-Miravalles et al. [16]. Briefly, aqueous dispersions with a concentration of 2% (w/w) were prepared using distilled water. The pH was adjusted to pH 7 for half of the samples using varying concentrations of HCl and NaOH. The samples were allowed to hydrate at 4 °C overnight. After allowing the samples to return to room temperature, pH was measured and readjusted if needed. The samples were then frothed using an Ultra-Turrax equipped with a S10N-10G dispersing element (Ika-Labortechnik, Janke and Kunkel GmbH, Staufen, Germany) at maximum speed for 30 s. The height of the foam phase was recorded immediately, after 30 min and after 60 min. Foaming capacity and foam stability were determined using the following equations:
Foaming capacity (%) = (Foam height immediately after foaming/Initial sample height) × 100
Foam stability (%) = (Foam height after 1 h/Foam height immediately after foaming) × 100

2.8. Water- and Oil-Holding Capacities

The water- (WHC) and oil (OHC)-holding capacities of CBSY and PBSY were determined according to the method by Boye et al. (2010) with some slight modifications [17]. In total, 1 g of the sample was weighed into a 15 mL tube, followed by the addition of 6 g of either sunflower oil (for oil absorption) or water (for water absorption), which was added to the tubes and mixed well by vortexing for 3 min. Samples were then kept at room temperature for 60 min. Following this, samples were then centrifuged at 4000× g for 30 min at 20 °C. The supernatant was removed, and the samples were inverted and allowed to drain for 30 min. The oil or water absorption in % was calculated using the following formula:
W H C / O H C % = W e i g h t   o f   t u b e   a n d   p e l l e t W e i g h t   o f   t u b e I n i t i a l   i n g r e d i e n t   w e i g h t I n i t i a l   i n g r e d i e n t   w e i g h t × 100

2.9. Surface Hydrophobicity

Surface hydrophobicity was measured according to the method by Hayakawa & Nakai (1985) [18] using 1-anilino-8-naphthalenesulfonate (ANS), with slight modifications, as described by Karaca et al. (2011) [19]. Protein dispersions of 0.2% (w/v) protein were prepared in a 0.01 M sodium phosphate buffer (pH 7) and hydrated at 4 °C overnight while in a platform shaker. Dilutions of 0.006–0.015% protein (% w/v) were prepared using a 0.01 M sodium phosphate buffer. Following this, 2 mL of each dilution and sodium phosphate buffer blank were transferred to new 15 mL tubes, and 20 µL of ANS (8.0 mM in 0.1 M phosphate buffer, pH 7) was added. Samples were incubated in the dark for 15 min at room temperature, after which fluorescence was measured (λexcitation 390 nm, λemission 470 nm) and adjusted with a blank measured without the addition of ANS. The results are presented as the slopes (r2 ≥ 0.98) of the absorbance versus protein concentration.

2.10. Isoelectric Point Determination

The zeta potential of CBSY and PBSY was determined, as described by Alonso-Miravalles et al. [16], with some adjustments. Briefly, samples (0.1% w/v) were prepared using ultrapure water and left at their native pH or adjusted to a range of pH values (pH 2, 3, 4, 5, 6, and 7) using a variety of concentrations of HCl and NaOH followed by incubation overnight while shaking (500 rpm) at 4 °C. The zeta potential of the ingredients in the solution was determined using dynamic light scattering technology with Zetasizer Nano-Z (Malvern Instruments Ltd., Malvern, UK). Automatic voltage selection, a refractive index of 1.45, and an absorbance of 0.001 were utilised. The isoelectric points of CBSY and PBSY were determined by identifying the point at which the zeta potential was 0.

2.11. Protein Solubility

Protein solubility at native and adjusted neutral pH (pH 7) was evaluated using the Kjeldahl method [20]. Firstly, the protein contents of CBSY and PBSY were determined (N × 6.25). Following this, 1% (w/v) protein dispersions were prepared, and then left to hydrate overnight at 4 °C while shaking. After returning to room temperature, the pH was measured and readjusted if necessary. Samples were then centrifuged at maximum speed (4892× g) for 30 min. Finally, the protein content of the supernatant was determined, and protein solubility was expressed as the % of the total protein present in the supernatant.

2.12. Particle Size

The particle size distribution of CBSY and PBSY dispersions was determined using a static laser light diffraction unit (Mastersizer 3000, Malvern Instruments Ltd., Worcestershire, UK), covering a size range of 0.01–3000 µm. BSY dispersions were prepared in ultrapure water in 50 mL centrifuge tubes at a concentration of 1% protein (w/v). Samples were then shaken overnight at 4 °C. Following this, the samples were allowed to return to room temperature and were introduced into the dispersing unit using ultrapure water as a dispersant until a laser obscuration of 12% was achieved. The particle refractive index was set at 1.45, the absorption used was 0.1, and the dispersant refractive index was 1.33. The results are presented as the volume-weighted mean particle diameter (D4,3), surface-area-weighted mean particle diameter (D3,2), and volume percentiles (Dv(10), Dv(50), Dv(90)).

2.13. Emulsion Properties

The emulsion-stabilising properties of CBSY and PBSY were examined by preparing and analysing rough emulsions using the method by Alonso-Miravalles et al. [16] with some modifications as described by Jaeger et al. (2023) [21]. Briefly, a 1% w/w aqueous protein solution was prepared using CBSY or PBSY and adjusted to pH 7 using varying concentrations of NaOH and HCl. The samples were then hydrated overnight with shaking at 4 °C. Emulsions were prepared by mixing ingredient dispersions with sunflower oil at a ratio of 90:10 (material dispersion/oil) in 50 mL centrifuge tubes. The samples were sheared using Ultra-Turrax equipped with an S10N-10G dispersing element (IKA Labortechnik, Janke and Kunkel GmbH, Staufen, Germany) at a speed of 5 for 2 min. Oil droplet size was measured using a static laser light diffraction unit (Mastersizer 3000, Malvern Instruments Ltd., Worcestershire, UK) with a refractive index of 1.47 and 1.33 for sunflower oil and water, respectively. Stability was monitored using an analytical centrifuge (LUMiSizer, LUM GmbH, Berlin, Germany) with parameters of 100× g for 15 min at 15 °C. The results are reported as the separation rate (%/min) and transmission profiles over the entire measurement range.

2.14. Minimum Gelation Concentration

The minimum gelation concentrations of the samples were determined according to the method by Alonso-Miravalles et al. (2019) [16] with some modifications, as described by Jaeger et al. (2023) [21]. Briefly, samples (15 mL) were prepared at a variety of concentrations (in the range of 6% to 20%, in 2% intervals). The samples were then adjusted to pH 7 using varying concentrations (0.01–2 M) of HCl and NaOH and hydrated overnight at 4 °C. The samples were heated at 90 °C in a water bath for 30 min, cooled rapidly on ice, and maintained overnight at 4 °C. The samples were then inverted, and the minimum protein concentration at which the dispersion did not flow in less than 30 s was determined as the minimum gelling concentration.

2.15. Rheological Analysis

Rheological tests were carried out using a rheometer (MCR301, Anton Paar GmbH, Graz, Austria) equipped with a concentric cylinder measuring system (C-CC27-T200/SS, Anton Paar GmbH, Austria). Ingredient dispersions (20% w/v) were hydrated overnight (16 h) at 4 °C while shaking. This concentration was determined by minimum gelling concentration pre-trials. Small deformation oscillatory rheology was used to examine structural changes over a heating and cooling cycle using a strain of 0.1% and a frequency of 1 Hz. The temperature profile was defined as an increase from 20 °C to 90 °C at 2 °C/min, followed by a hold at 90 °C for 30 min, cooling to 20 °C, and a hold at 20 °C for 30 min.

2.16. Statistical Analysis

All analyses were completed in triplicate and were tested for normality, homogeneity and then significant difference of the means using an independent t-test at a level of 5% significance. All statistical analyses were completed using IBM SPSS Statistic Version 28.0.0.0 (190).

3. Results

The basic composition of the control brewer’s spent yeast (CBSY) and the processed brewer’s spent yeast (PBSY) are described in a previous study [13] and are reported in Table 1. The current study builds on these known compositional data, further investigating the carbohydrate and lipid composition of CBSY and PBSY.

3.1. α-, β-, and Total Glucans

Contained in the carbohydrate fraction of BSY are glucans, defined as polysaccharides consisting of glucose polymers. The glucan compositions of CBSY and PBSY are presented in Table 2. A significant decrease in β-glucan levels was observed, decreasing from 24.97 g/100 g in CBSY to 14.99 g/100 g in PBSY. There was also a difference in α-glucan content, presumably consisting of glycogen, with values of 14.8 g/100 g and 11.3 g/100 g determined for CBSY and PBSY, respectively. Overall, the total glucan levels in PBSY (26.31 g/100 g) were significantly lower than that of CBSY (39.79 g/100 g).

3.2. Lipid and Fatty Acid Composition

In general, the total lipid content of the ingredients was low, with little difference observed between CBSY (1.36 g/100 g) and PBSY (1.29 g/100 g) [13]. Furthermore, the fatty acid profiles of CBSY and PBSY were similar. As seen in Table 2, C16 fatty acids dominated the profile, namely palmitic acid (C16:0) and palmitoleic acid (C16:1 n7). Secondary to these, C18 fatty acids were the most plentiful, including stearic acid (C18:0), octadecanoic acids (C18:1), and a smaller fraction of linoleic acid (18:2 n6).

3.3. Fermentable Oligosaccharides, Disaccharides, Monosaccharides, and Polyols

Fermentable oligosaccharides, disaccharides, monosaccharides, and polyols (FODMAPs) are a group of poorly digested carbohydrates that cause painful gastrointestinal symptoms for those with irritable bowel syndrome (IBS) and other gastrointestinal disorders [22]. The levels of common FODMAPs in CBSY and PBSY were measured, and the results are presented in Table 2. Overall, there are low levels of FODMAPs present in CBSY. The other main change identifiable in this analysis was the significant increase in fructose in PBSY (7.994 g/100 g) in comparison to CBSY (0.02 g/100 g). Fructans were also included in this analysis, but the levels were below the calibration limit (0.1 g/100 g), and no significant differences were detected between the means. Trehalose was present at a level of 5.275 g/100 g in CBSY and just 0.403 g/100 g in PBSY.

3.4. Resistant and Digestible Carbohydrates

The resistant and digestible starch content of CBSY and PBSY are reported in Table 2. CBSY contained 10.55 g/100 g of resistant starch and 17.10 g/100 g of digestible starch, while PBSY contained 5.67 g/100 g of resistant starch and 12.38 g/100 g of digestible starch.

3.5. pH and Total Titratable Acidity

An analysis of the pH and total titratable acidity (TTA) showed significant differences between the control and processed material, and the results are outlined in Table 3. There is a significant difference in pH, decreasing from pH 6.09 to 3.49, as a result of processing. A significant increase in TTA was also observed, with the required amount of 0.1 M of NaOH needed to reach pH 8.5 increasing from 2.5 mL/g to 15.5 mL/g.

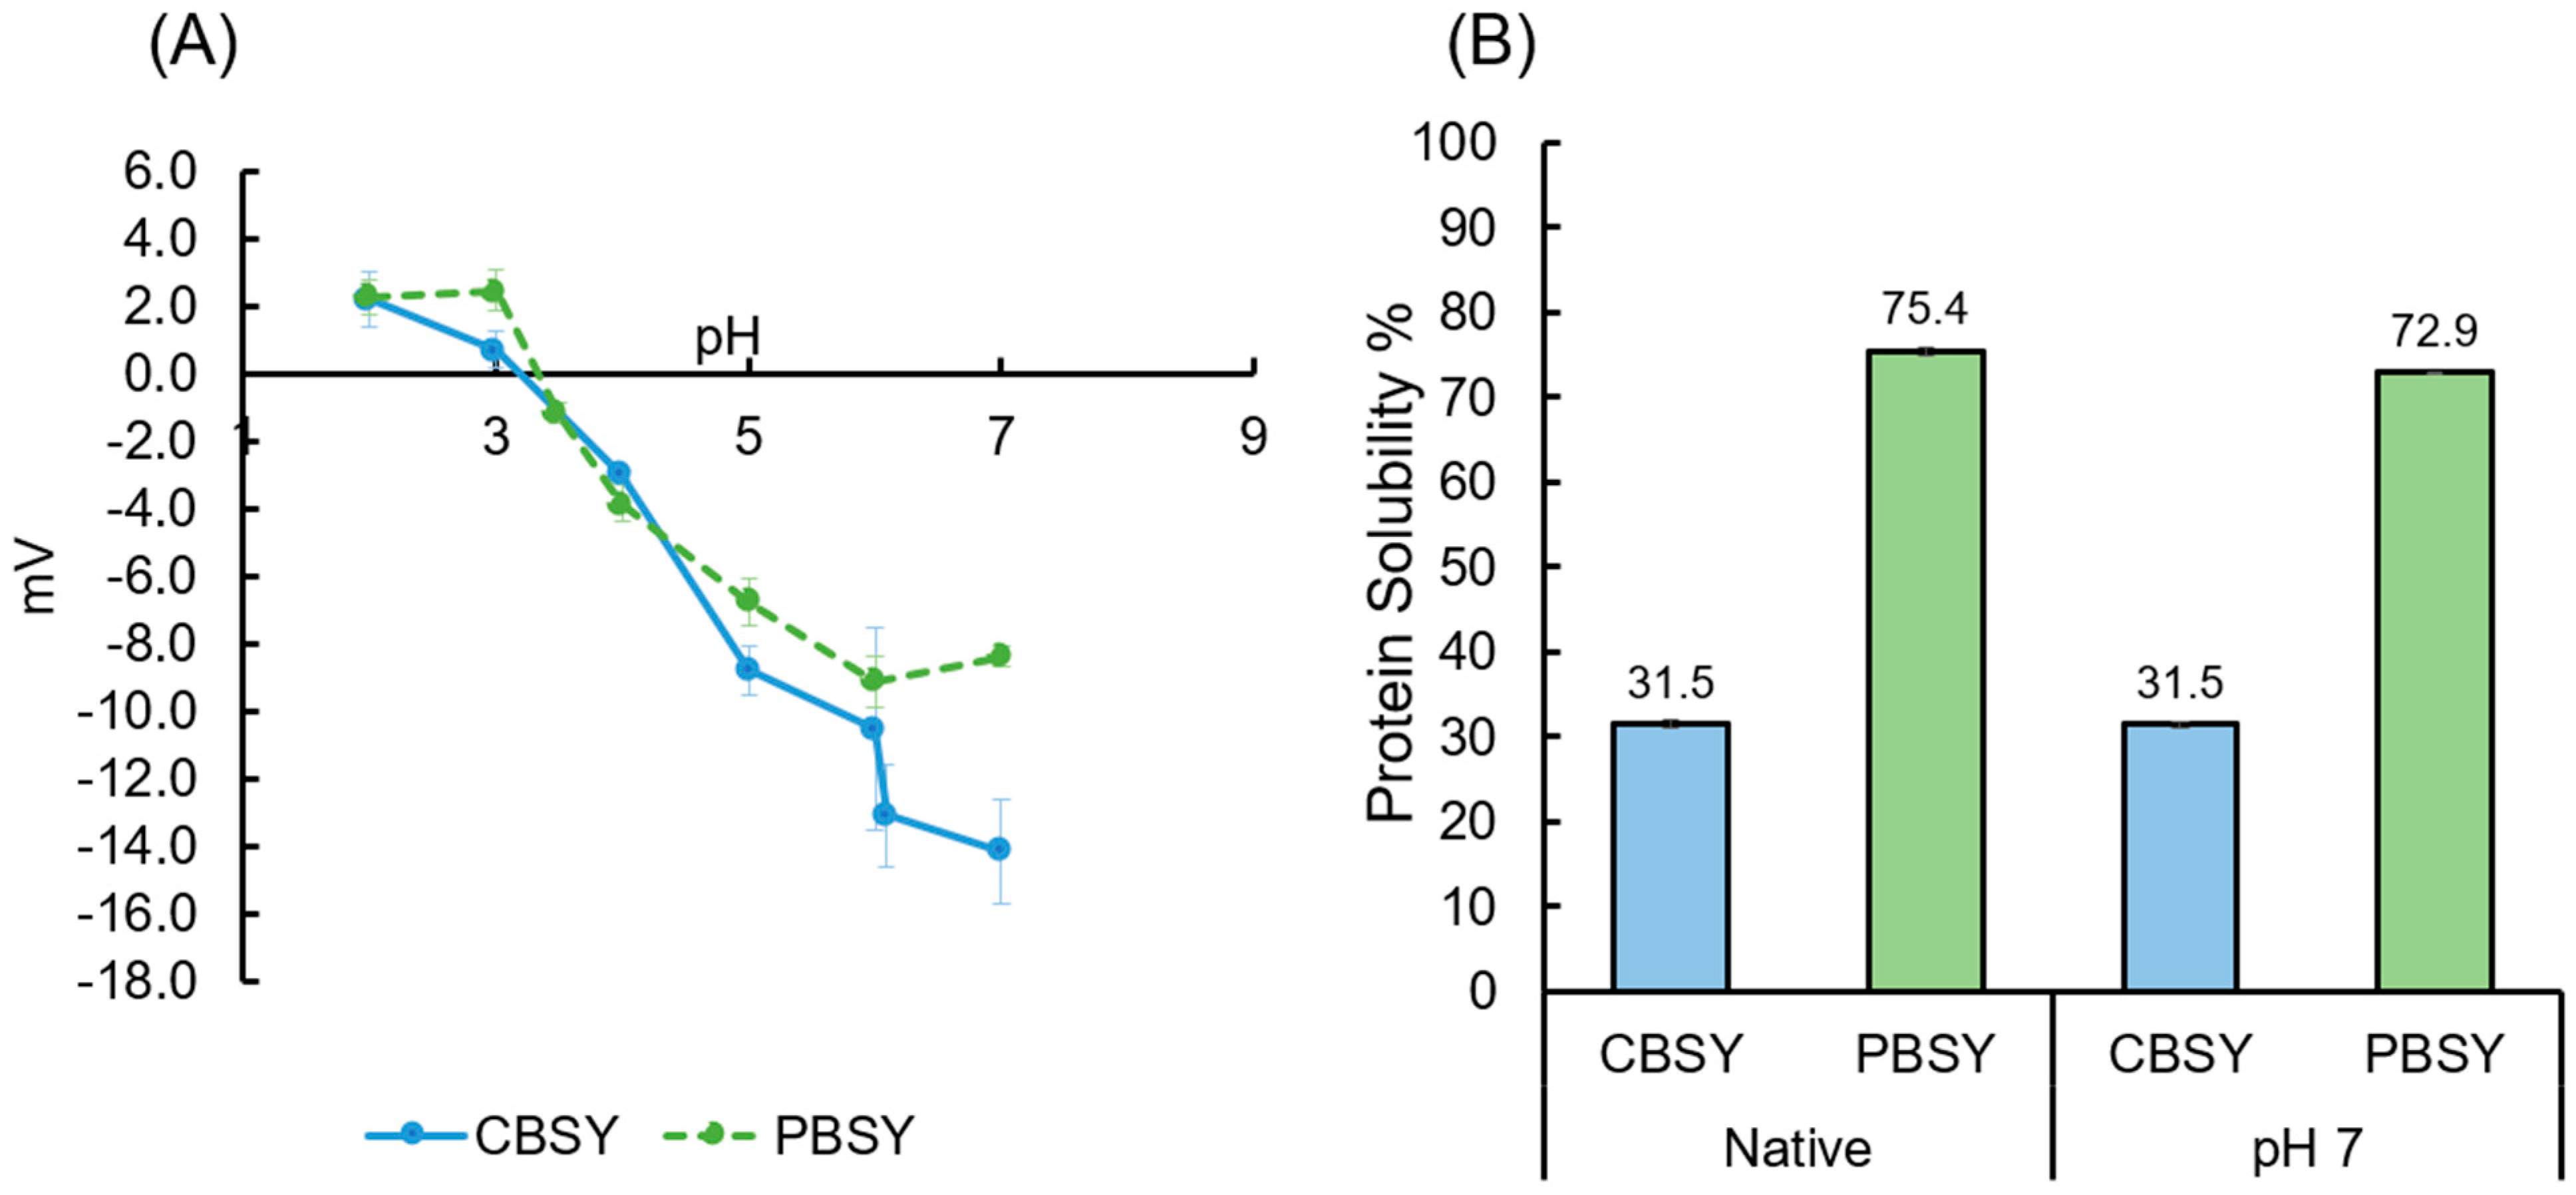
3.6. Surface Hydrophobicity, Zeta Potential, and Protein Solubility

Surface hydrophobicity measures the extent of exposed hydrophobic regions on the protein surface using 1-anilino-8-naphthalenesulfonate (ANS). ANS fluoresces upon its interaction with hydrophobic (non-polar) sites, and fluorescence spectroscopy can provide a relative measurement of the surface hydrophobicity of a material. Surface hydrophobicity is an important characteristic of materials as it can indicate the properties of these proteins and their functional properties, including foaming characteristics and their emulsifying capacity. The results of these analyses are shown in Table 3. The surface hydrophobicity of CBSY was significantly higher than that of PBSY, with slopes of 2906.9 and 189.9 determined, respectively. The determination of the isoelectric point of CBSY and PBSY is described in Figure 1. The zeta potential measurement over a pH range indicates an isoelectric point of pH 3–3.5 for both CBSY and PBSY. At native pH, the zeta potential was −13.1 mV and −1.17 mV for CBSY and PBSY, respectively. The protein solubility results for CBSY and PBSY are also presented in Figure 1 and Table 3. It can be observed that protein solubility increased from 31.5% in CBSY to 75.4% in PBSY. The protein solubility for CBSY remains similar at native pH and pH 7, as the native pH for CBSY is 6.1 and, therefore, already close to pH 7.

3.7. Oil- and Water-Holding Capacity

The oil-holding capacity (OHC) and water-holding capacity (WHC) of CBSY and PBSY are presented in Table 3. OHC can be linked with the emulsifying characteristics of a material, as well as potentially affecting mouthfeel and texture [23,24,25]. There was no significant difference in the fat absorption capacity between CBSY and PBSY. There was a small but significant difference in WHC, with PBSY (48.7%) having a slightly lower WHC value than CBSY (52.7%).

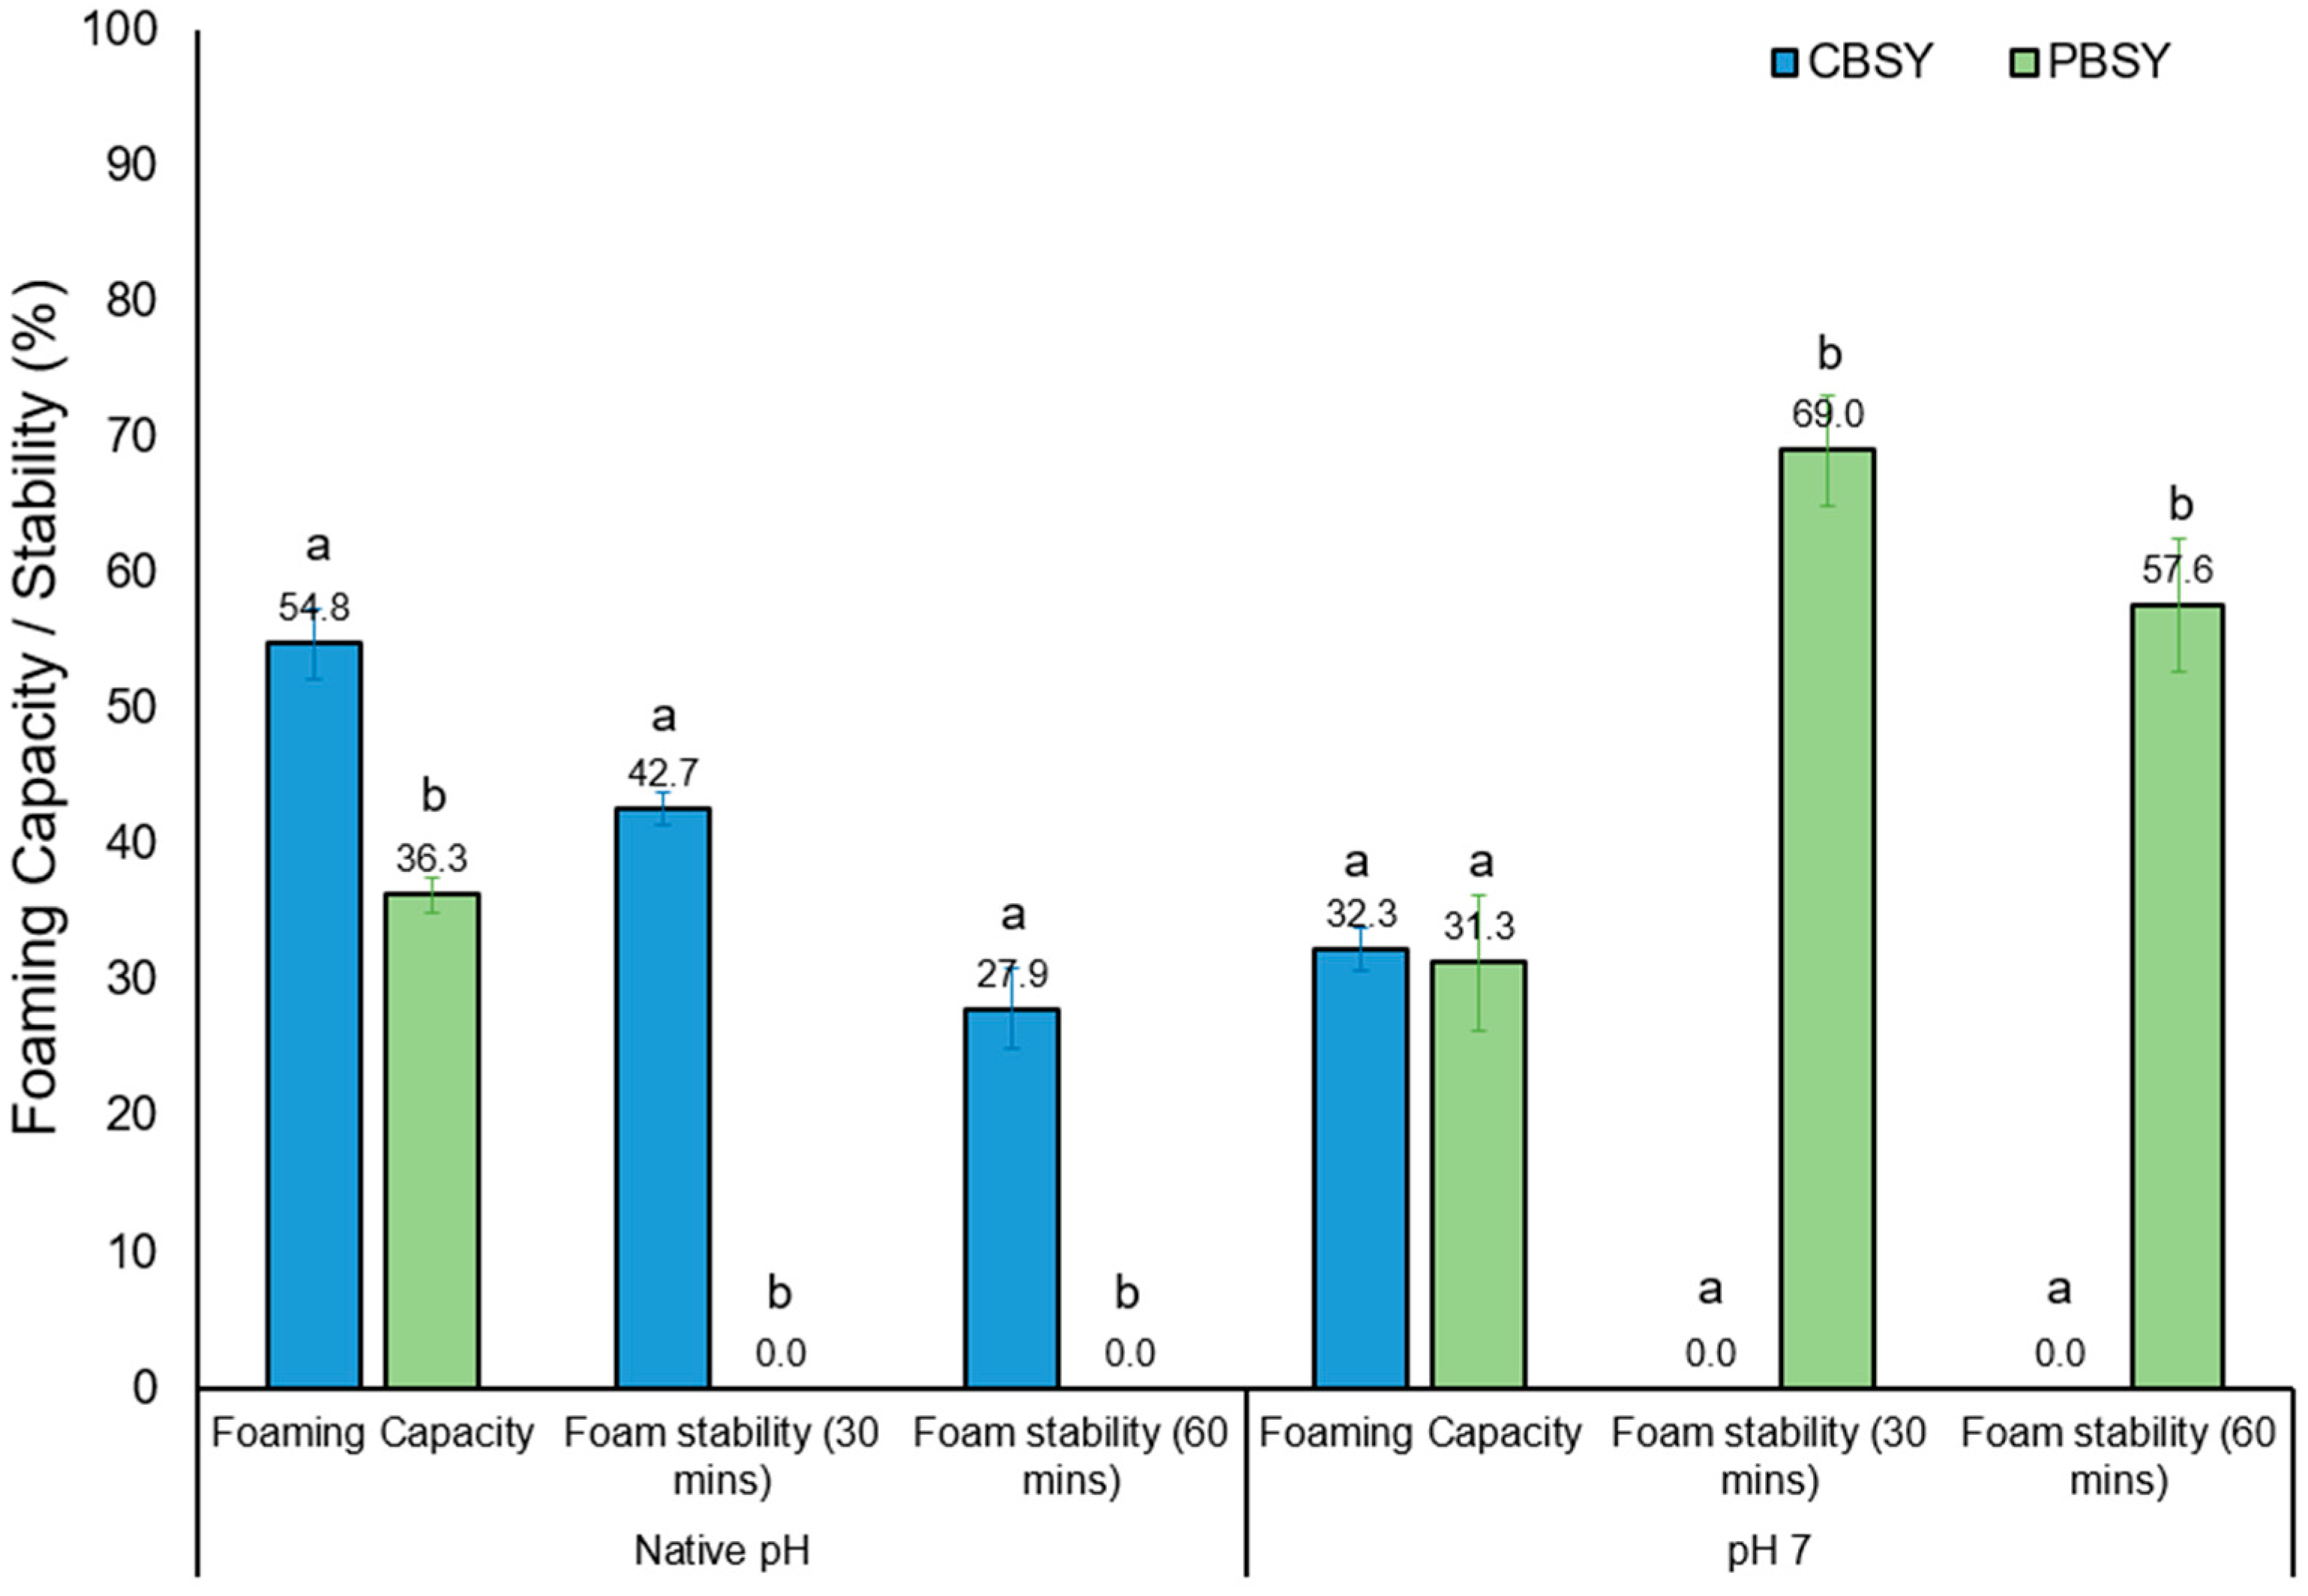
3.8. Foaming Capacity and Stability

The foaming capability of a substance assesses the ability of a mixture to produce foam after vigorous mixing and foam stability assesses the degree to which the foam persists over time after mixing. The foaming capacity and stability of CBSY and PBSY are presented in Figure 2. At native pH, foaming capacity was significantly higher in CBSY, with 54.7% versus only 36.3% in PBSY. However, at pH 7, there was no significant difference in the foaming capacity between CBSY and PBSY. At native pH, foaming stability at 30 min for CBSY was 42.7%, whereas in PBSY, there was no foam present; therefore, a stability of 0% was recorded. After one hour, CBSY stability was reduced to 27.9%. At pH 7, the foam stability for PBSY was 69.0% and 57.6% at 30 min and 60 min, respectively, showing the opposite effect compared to native pH.

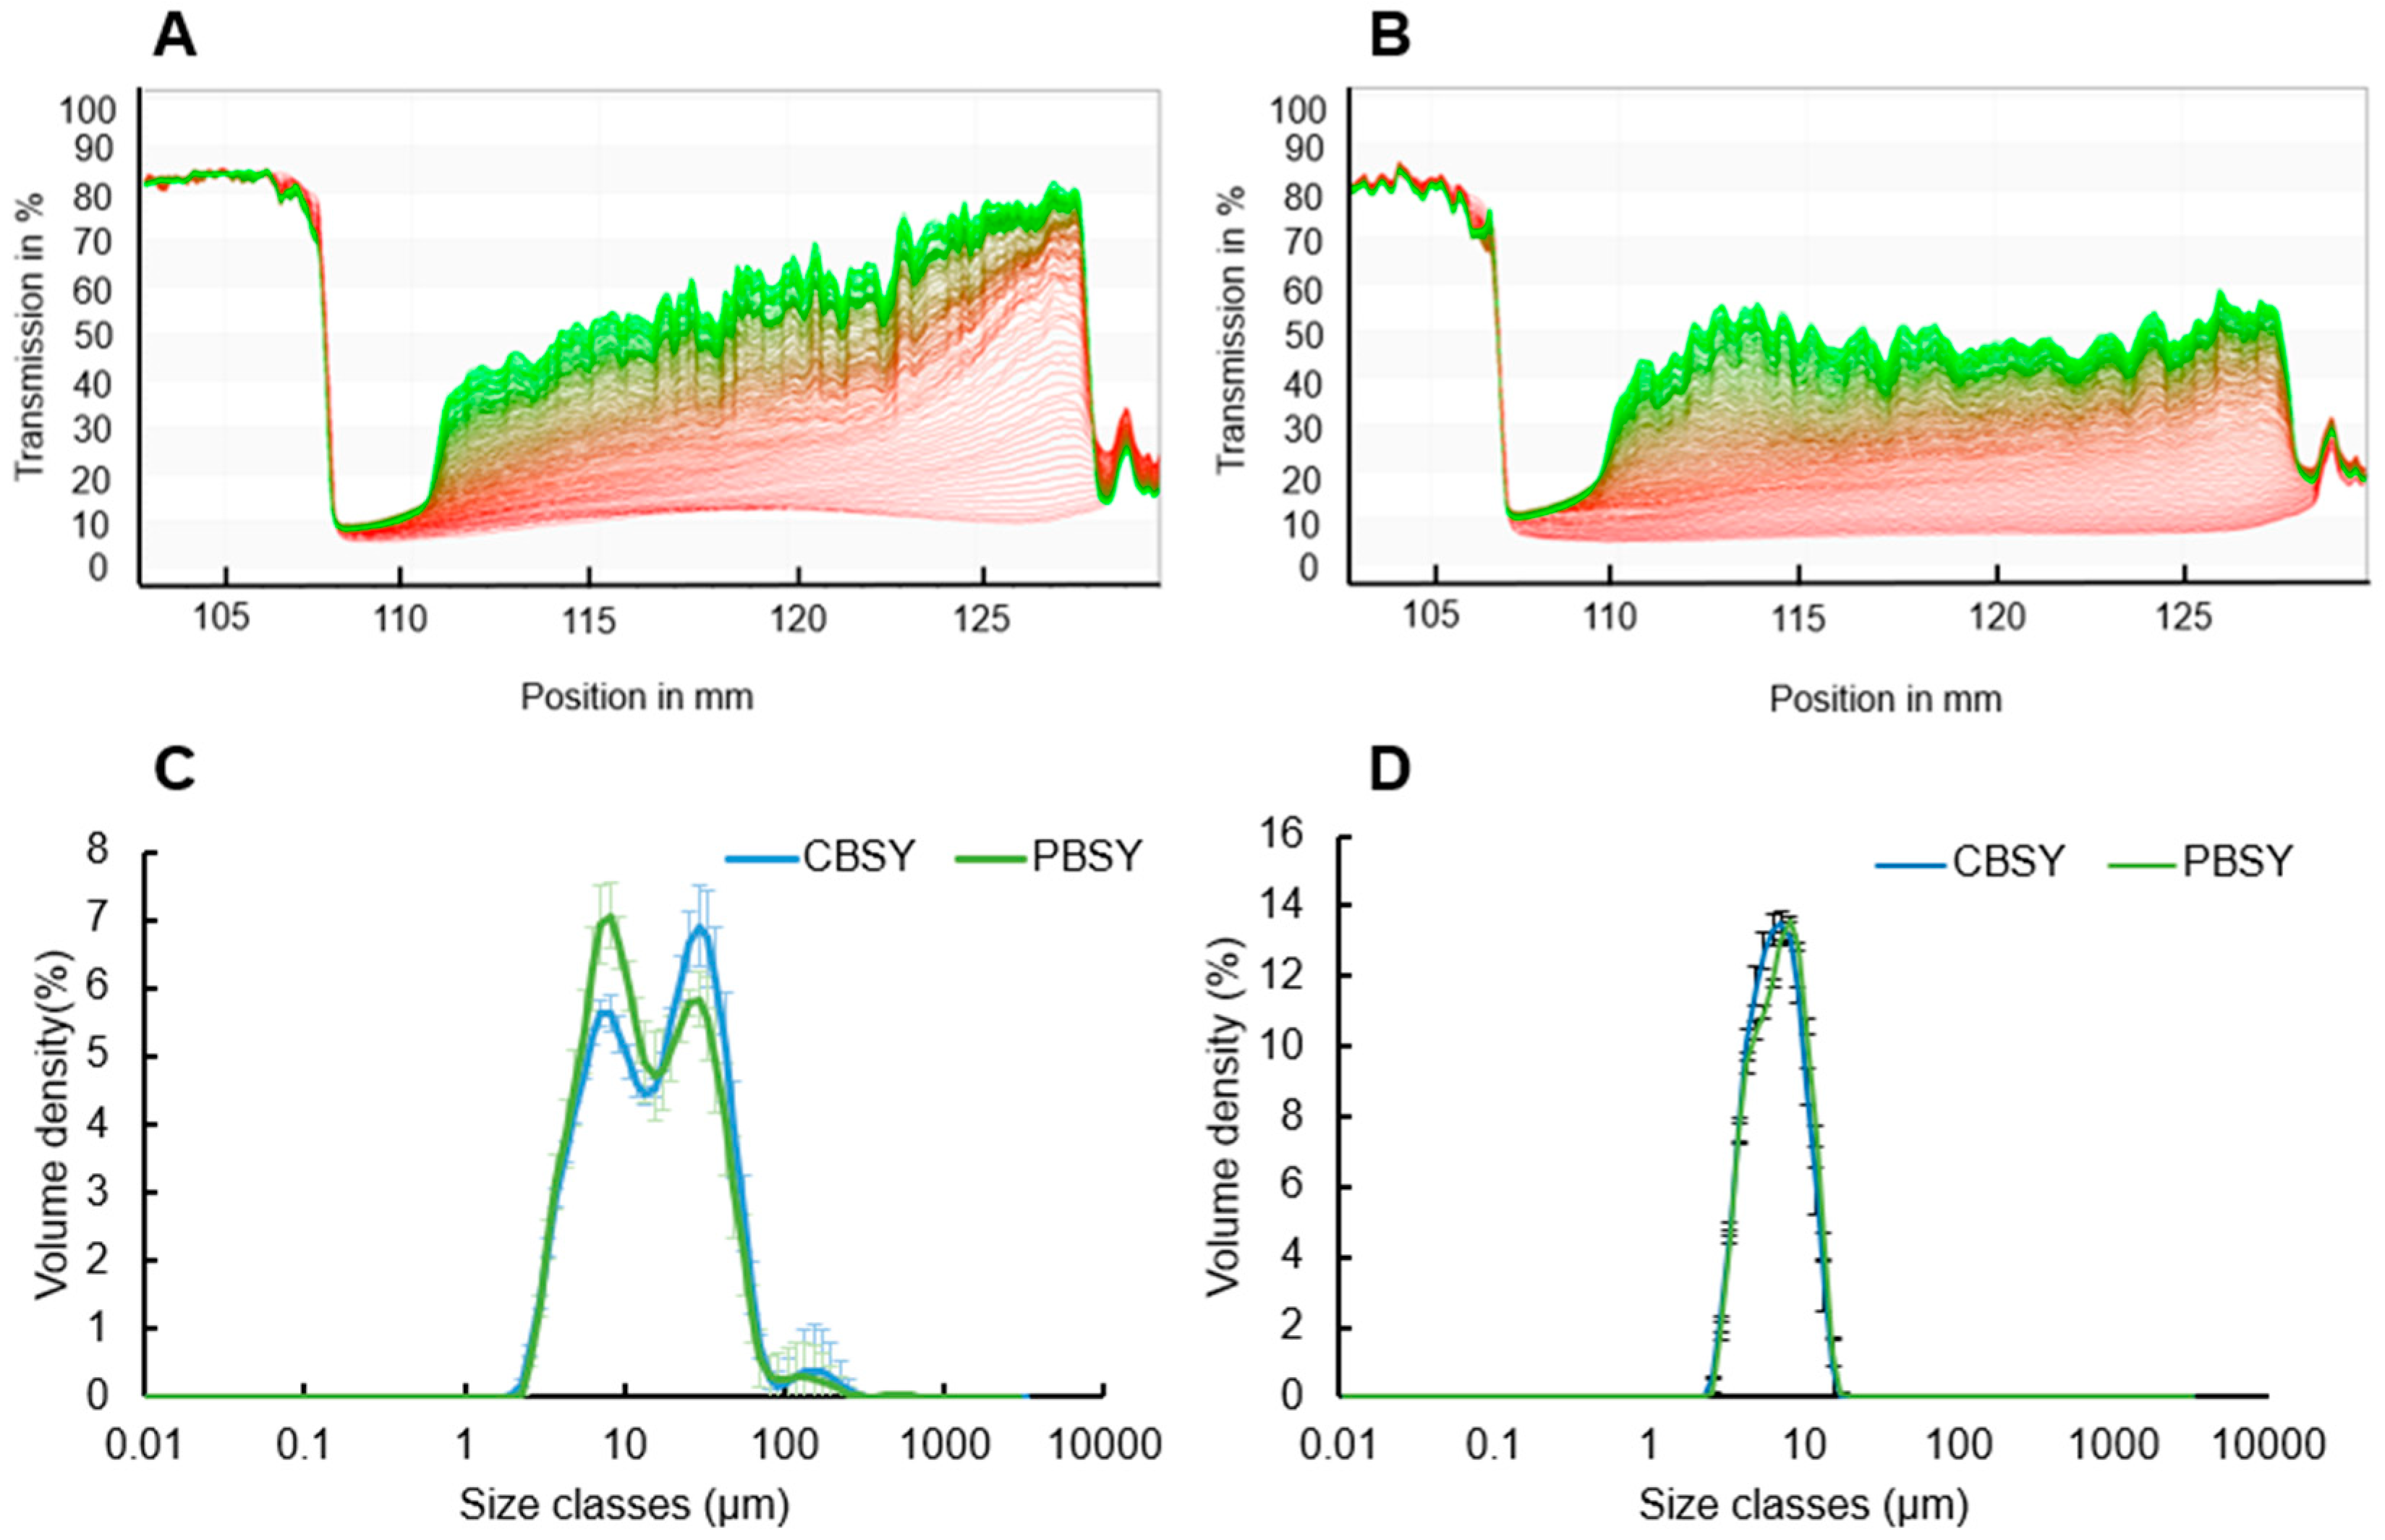
3.9. Particle Size Distribution

The particle size distributions of CBSY and PBSY dispersions are represented in Table 3 and Figure 3. The profiles were very similar, both being monomodal and showing a similar size range of ~2 µm to ~20 µm, with volume mean (D 4,3) values of 6.98 µm and 7.32 µm, respectively. These values are not significantly different from one another. The values for Dv [10], [50], and [90] are also very similar, with the Dv [90] value showing that 90% of the particles measured were below 10.8 µm and 11.38 µm for CBSY and PBSY, respectively. However, differences were significant for the Dv [10] and Dv [50] values.

3.10. Stabilisation Behaviour and Emulsion Particle Size Distribution

In terms of applications, the ability of a material to stabilise an emulsion is of particular interest. CBSY and PBSY were both screened to assess their potential emulsion-forming activity, and the results are presented in the form of the separation rate (Table 3), separation profiles, and particle size dispersions (Figure 3). In emulsions, both CBSY and PBSY display bi-modal particle size distributions, with the right most volume peak relating to oil droplets and the left most peak relating to insoluble yeast cell materials, as this peak can also be seen in the BSY dispersion particle size distribution. Generally, there was no significant difference in the emulsion particle size between CBSY and PBSY, with the mean volume of D [4,3] determined at 22.9 µm and 20.6 µm, respectively. The only value that differed significantly was the Dv [50], with 16.3 µm measured for CBSY compared to 13.0 µm for PBSY. This was also reflected in the separation rate and separation profiles. CBSY displayed an increased separation rate of 3.46%/min, whereas PBSY separated at 2.98%/min. The separation profiles indicate the creaming and sedimentation that occurred in the sample during centrifugation by plotting the transmission of infrared light throughout the sample cell’s length, with measurements being taken every 30 s. A difference was visible between the samples, with the CBSY emulsion displaying a quicker clearing and, therefore, increased transmission from the bottom of the cell.

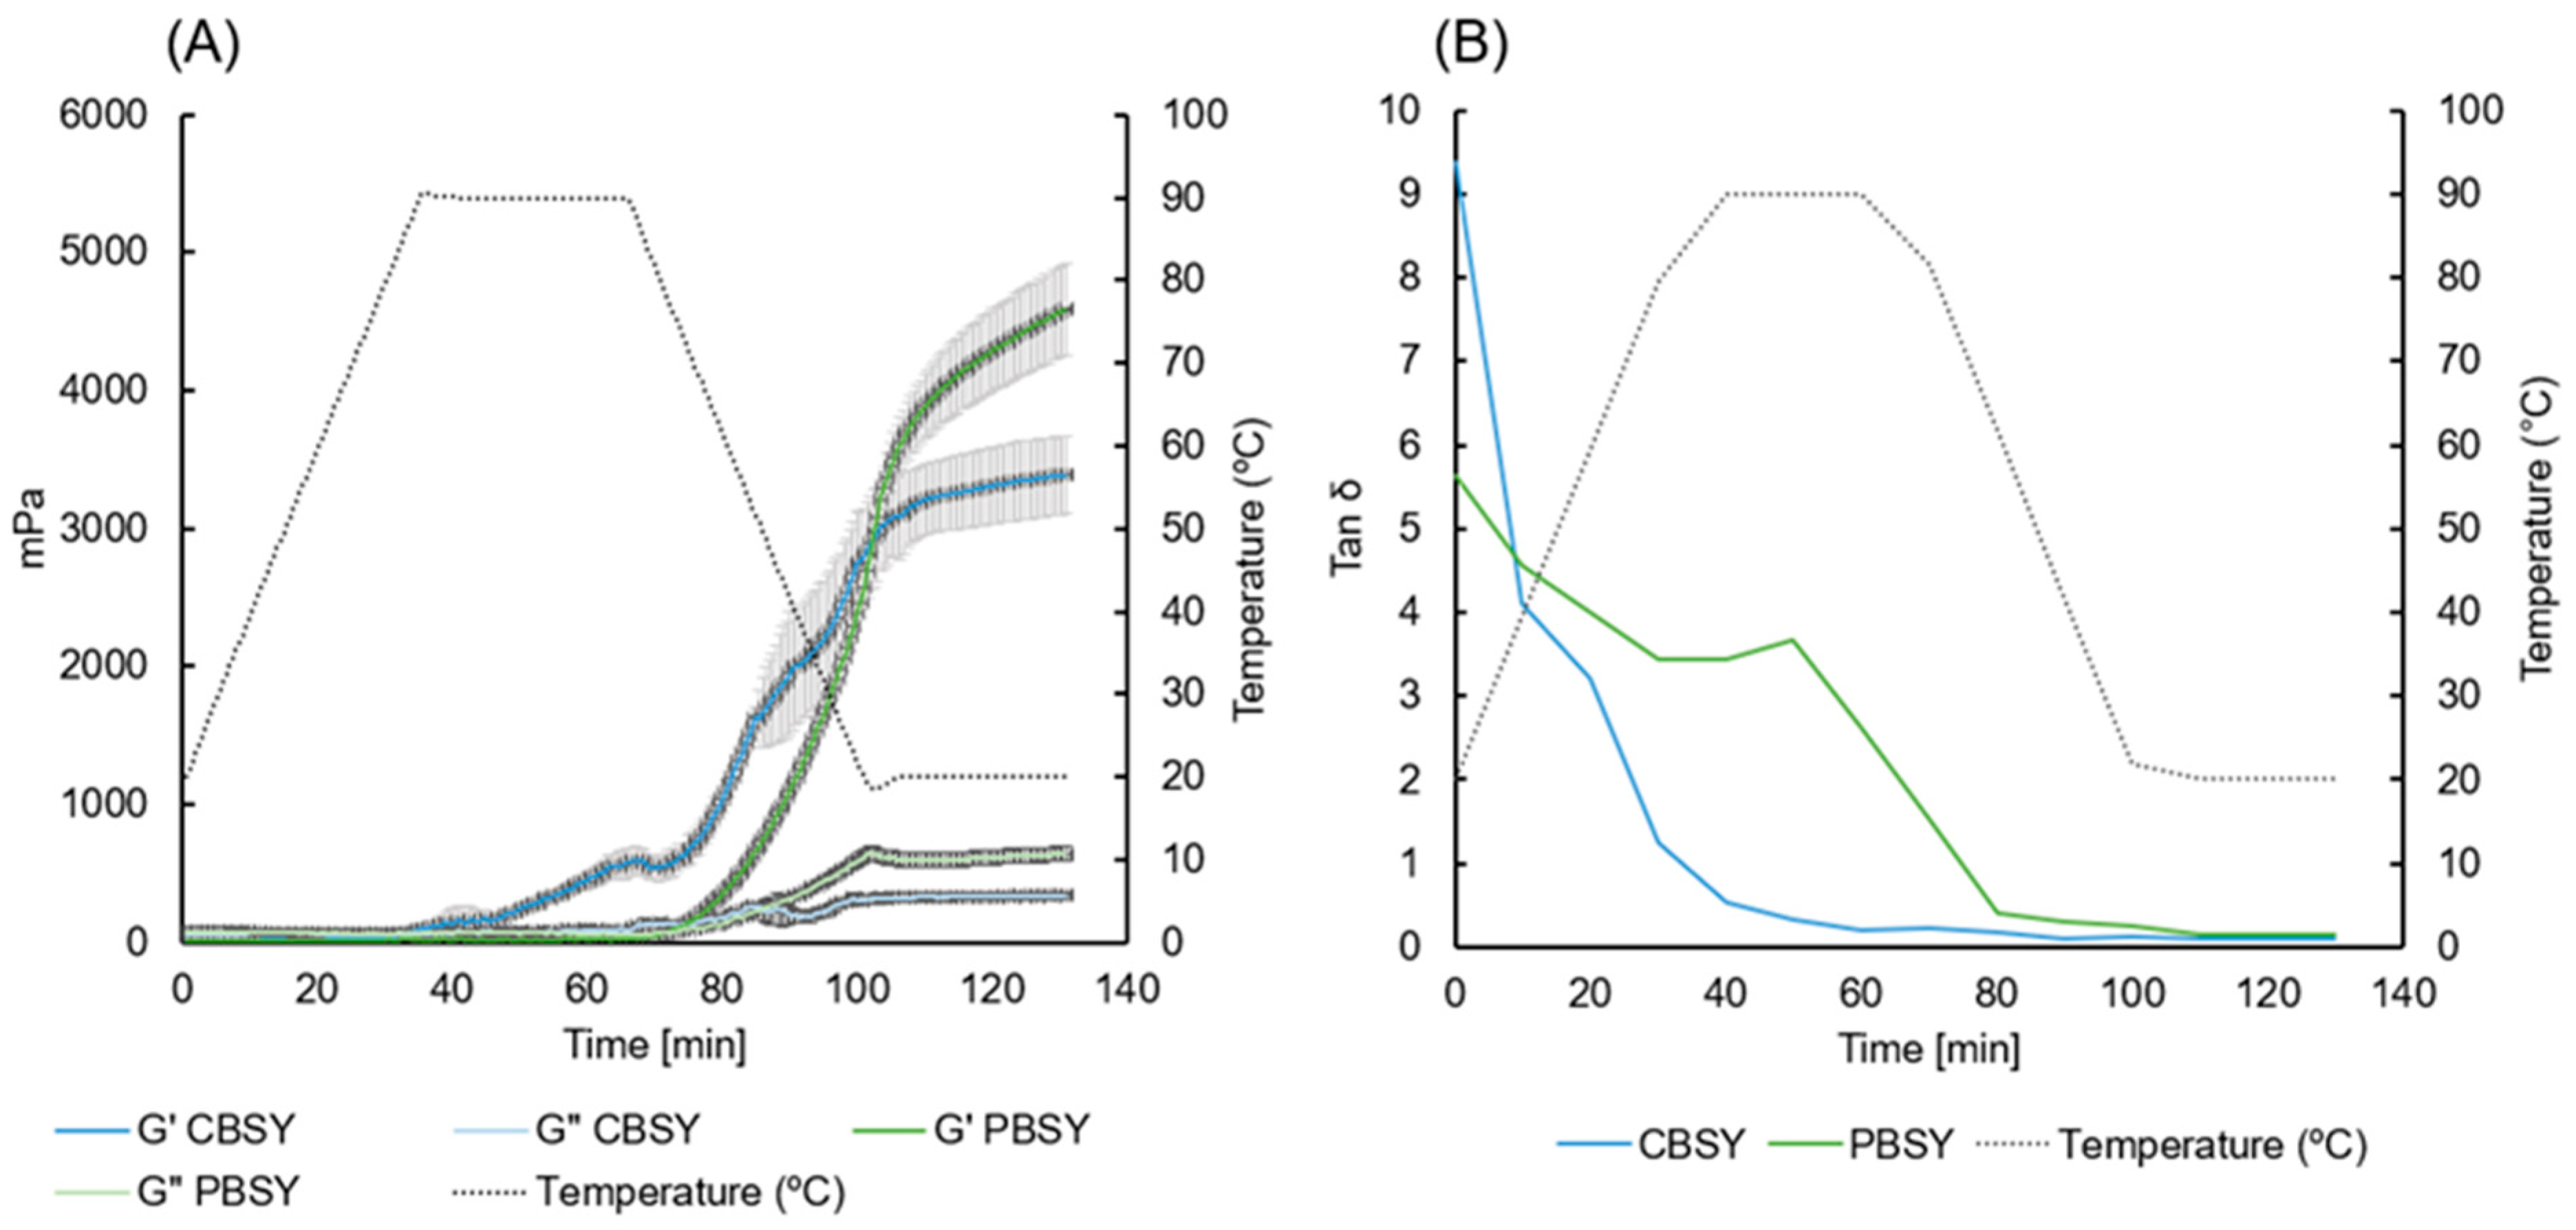
3.11. Rheological Properties

The rheological properties of a material are important when considering suitable applications and potential processing capabilities. The storage modulus (G′) and the loss modulus (G″) of 20% CBSY and PSBY dispersions, while subjected to heating and cooling cycles, are presented in Figure 4. Overall, it can be said that both CBSY and PBSY exhibited no significant gelling capabilities, with very low final G′ values after cooling to 20 °C and reaching a very low magnitude of 3.4 Pa and 4.6 Pa for CBSY and PBSY, respectively. However, differences between the rheological behaviour of CBSY and PBSY can be seen in the G′ and G″ profiles. The point at which G′ dominates over G″ (known as the inflection point) indicates a shift towards more elastic or solid-like behaviour and vice versa. Initially, G″ is dominant for both CBSY and PBSY, indicating that the system is characterised by more viscous or liquid-like behaviour. At the beginning of the 30 min hold at 90 °C, the G′ value for CBSY overtakes G″ and steadily increases throughout cooling. However, PBSY did not appear to be affected by the high heat hold in the same way as CBSY, with the G′/ G″ crossover occurring at the beginning of the cooling phase and increasing significantly throughout cooling and overtaking CBSY. Tan δ is another aid in representing the rheological character of the material and uses the ratio of G″: G′. A Tan δ value of >1 represents a more liquid system, while a value closer to 0 represents increased solid-like behaviour. Tan δ exists from 0 to infinity because a Tan δ value of 0 indicates a perfectly elastic (solid) material. Figure 4 represents the Tan δ values throughout the heating and cooling processes. For both CBSY and PBSY, Tan δ values were high, indicating a high proportion of viscous behaviour, as also seen in the G″ curves in Figure 3. For CBSY, Tan δ decreased most significantly in the first 60 min, with the value falling below 1 at 33 min, corresponding with the beginning of the 90 °C hold at 40 min. In contrast, for PBSY, the most rapid decrease occurred between 50 min and 80 min and only fell below 1 at 72 min. This coincided with the initiation of the cooling step at 67 min and indicates that the CBSY and PBSY displayed different physical responses to heating and cooling cycles.

4. Discussion

Brewer’s spent yeast is a brewing by-product with a high potential for revalorisation, particularly regarding its applications in foods for human consumption as a nutritional and functional ingredient. This study expands on the compositional changes occurring during the standardisation, autolysis, and fermentation of BSY, as described in a previous publication [13].
Glucans, a group of polysaccharides consisting of glucose residues, are one of the most plentiful carbohydrates and a source of dietary fibre in yeast cells. Generally, the cell wall comprises 50–60% β-glucan (approx. 15% of total cell mass), specifically β-(1-3) and β-(1,3:1,6)-glucan, and ~40% mannoprotein (approx. 10% of total cell mass), as well as more minor compounds such as chitin and glycogen [26,27,28]. The total glucan level in BSY decreased as a result of processing. The reduction in glucans indicates a process breaking down the yeast cell wall, i.e., autolysis. During yeast autolysis, the glycosidic bonds in β-glucans are hydrolysed by β-glucanases, releasing glucose molecules, oligosaccharides, and mannoproteins. The subsequent proteolysis of the released mannoproteins causes a release of mannose and glucose [29]. This could potentially result in an increased mannose level in the fermented ingredient, although mannose is likely consumed by the LAB during fermentation, as with glucose [30,31]. It is well known that β-glucans can positively affect human health. Many studies have shown that yeast β-glucans, in particular, can affect immunomodulation, increasing immunity [3,32,33,34]. In addition, it has been shown that they aid in treating and preventing respiratory tract infections [35,36], reducing the negative effects of chronic stress on immune response [37].
In yeast, starch analogous α-glucans in the form of glycogen are one of the main storage carbohydrates comprising glucose monomers in α(1-4) glycosidic linkages with α(1-6) branches [38]. Glycogen, alongside trehalose, is one of yeast cells’ main glucose storage forms. These carbohydrates play a role in optimising survival and reproductive abilities, including the control of glycolytic flux, stress responses, and energy storage [38]. The α-glucan content decreased in PBSY, which is in agreement with the digestible starch values obtained in this study (17.10 ± 2.06 g/100 g and 12.38 ± 0.12 g/100 g, respectively). This is potentially due to the amylolytic activity by L. amylovorus FST 2.11, degrading the glucose chains into glucose monomers for use as an energy source and allowing lactic energy production directly from starch [38,39,40]; it could also occur during the standardisation or yeast autolysis processes, as glycogen is consumed during autolysis [41]. Resistant starch comprises complex polysaccharides which resist breakdown by digestive enzymes and can, therefore, potentially act as dietary fibre [42] and contribute to the total fibre content of BSY [13] alongside β-glucan. This study observed a decrease in resistant starch in BSY as a result of processing. This is most likely due to the fact that the majority of glycogen in yeast is bound in the cell wall, with a smaller portion in the cell cytoplasm [43], which would be minimally accessible in CBSY due to the mostly intact nature of the cell walls. However, in PBSY, the cell wall is degraded as a result of autolysis and, therefore, a higher proportion of the carbohydrate would be accessible for enzyme action.
Trehalose, alongside glycogen, is one of the major storage carbohydrates in yeast, consisting of two α-(1,1)-linked glucose residues [38]. However, it has also been shown that it plays an active role in several yeast cell survival mechanisms, namely thermal resistance [44], alcohol tolerance [45], resistance to desiccation, cell membrane stabilisation, and antioxidative activity [46,47]. A significant level of trehalose in CBSY is expected as a result of stressors towards the end of the fermentation process (i.e., increased alcohol concentration and lack of substrate) [46]. Trehalose accumulation as a result of serial yeast re-pitching [48] should also be taken into account, considering that the spent yeast used in this study was fifth-generation strain. In PBSY, the level of trehalose is decreased, indicating trehalose degradation during processing. During BSY autolysis, the breakdown of the yeast cell wall releases the cell contents, including trehalose. One hypothesis is that this trehalose is then degraded into glucose and fermented by L. amylovorus FST 2.11; however, a study by Toit et al. (2001) indicated that the majority (80–90%) of L. amylovorus strains are unable to ferment trehalose [49]. Therefore, it is more likely that trehalose breakdown, forming two glucose residues, occurs in the autolytic phase, as was also indicated by Jacob et al. (2019) [50]. This, as well as the addition of sucrose, could explain the elevated level of glucose in PBSY compared to CBSY.
Overall, there are low levels of FODMAPs present in CBSY and PBSY, which are unlikely to induce any digestive issues with the exception of fructose in excess glucose. This can likely be directly linked to the addition of 4% sucrose before fermentation, after which it is degraded to glucose and fructose, and glucose was preferentially metabolised by the LAB, leaving excess fructose. The results here are concurrent, with the results for sugar composition reported by Jaeger et al. (2023) [13], except for the glucose level in PBSY, which was previously determined as negligible. This difference is likely due to differences in the analytical method and/or extraction procedure. The cut-off values for FODMAPs per serving in a low-FODMAP diet are as follows: <0.2 g oligosaccharides, <0.40 g of total polyols, and <0.15 g of fructose in excess of glucose [51]. This should be considered when formulating recipes, including PBSY in food applications.
Additional compositional data obtained are related to lipid composition. Yeast produces fatty acids via fatty acid synthase [52]. These fatty acids are required by yeast during fermentation to aid in membrane regulation, allowing the cell to maintain its membrane fluidity at different temperatures [53]. Fatty acids are essential in yeast, with all cellular organisms either involved in or dependent on fatty acids. They are used in cellular compartmentalisation and cellular membranes as precursors to important cellular signallers and to store metabolic energy in C-C bonds, which can then be degraded during beta-oxidation. In brewing, fatty acid oxidation products can have a negative effect on the quality aspects of the finished product, in particular, the sensory characteristics and foaming stability [54]. In addition, fatty acids and their oxidation products, such as (E)-2-nonenal, can be responsible for a stale off-flavour in beer [54]. Since the levels of total lipids are low in CBSY and PBSY, it is unlikely that the fatty acid composition will influence any physical characteristics. However, some of the flavour and aroma characteristics may result from these. The major fatty acids in CBSY and PBSY were determined to be C16 and C18, which is in agreement with the literature [55,56]. A study by Blagovi et al. (2001) examined the lipid profile of spent brewers’ yeast (Saccharomyces uvarum) and found that the total lipid fraction was characterised by the presence of saturated fatty acids, mainly palmitic acid (C16:0) with a lower fraction of stearic acid (C18:0) [56]. This trend is mirrored in CBSY and PBSY, with higher levels of these fatty acids.
Regarding functionality, the two most important changes that occur in the production of PBSY are the reduction in pH and the degradation of proteins and carbohydrates. Firstly, the pH is reduced from pH 6 to pH 3.5 due to lactic acid production by L. amylovorus FST 2.11. The drastic decrease in pH could be attributed to the production of lactic acid during homofermentative LAB fermentation, as demonstrated by Jaeger et al. [13]. This decrease has a marked effect on zeta potential and surface hydrophobicity, which, in turn, impacts solubility, foaming properties, emulsion stabilisation characteristics, and other functional properties. Corresponding to the decrease in pH, an increase in the TTA of PBSY was observed. This was likely due to the increase in acids produced during fermentation as well as a potential increase in the buffering capacity caused by the production/release of buffering agents during autolysis and fermentation, namely lactic acid, proteins, peptides, and amino acids [57,58,59].
Zeta potential is a measure of the net charge at the slipping plane of a particle in a solution, influencing the material’s functional properties. Zeta potential changes are based on the pH of the material but also vary with ionic strength. This most notably affects solubility, with a knock-on effect on other characteristics, including foaming and emulsification capacity and stability. The closer the zeta potential of a material is to a net charge of 0 (isoelectric point), the likelihood of particle aggregation and precipitation is increased, therefore lowering protein solubility. At native pH, zeta potential is −13.1 mV and −1.17 mV for CBSY and PBSY, respectively. For CBSY, this is within the range of zeta potential values given for yeast in the literature of approximately −10 mV to −20 mV [60,61]. Since the zeta potential of PBSY is closer to 0 than that of CBSY, protein solubility is expected to be lower in PBSY due to decreased electrostatic repulsive forces between the particles, encouraging aggregation. However, the protein solubility results indicate that this is untrue, with increased protein solubility observed in PBSY. This increase in protein solubility is likely affected by extensive protein degradation occurring during autolysis [62,63] and lactic acid fermentation [64], leading to an increased number of free amino acids and small peptides, as shown in a previous study [13]. The protein solubility for CBSY remains similar at native pH and pH 7, as the native pH for CBSY is 6.1 and, therefore, already close to pH 7. This is in line with other studies, citing that yeast has an isoelectric point of around pH 3 [65]. Therefore, in the case of PBSY, protein solubility is likely at its minimum at its native pH of ~3.5 as this was determined to be the approximate isoelectric point of the material; however, at pH 7, it is approximately the same value. Since the change in pH did not seem to have a major effect on the solubility of PBSY, it can be hypothesised that the main influence on protein solubility is perhaps the extent of proteolysis products present in PBSY. It is also likely that the zeta potential is affected by other compounds in the BSY matrix, not specifically protein, but by sugars, minerals, salt, and alcohol. It is emphasised that BSY is a particularly complex matrix with regard to determining zeta potential due to the presence of ions and minerals that affect the ionic strength and, therefore, the overall charge [66,67]. In general, increased ionic strength leads to a decreased overall charge; in other words, it is closer to 0. It is also true that the zeta potential refers to the sum of all charged particles in the matrix, whereas in this study, solubility refers to protein solubility alone. Since there is an absence of research in the literature available regarding the effects of LAB fermentation on this already complex matrix, further study in this area and its relation to zeta potential is required.
In yeast, cell surface hydrophobicity is an important characteristic as it affects the cells’ ability to interact with each other and other materials. In brewing, this is particularly important for yeast flocculation behaviour [68]. Yeast strains adapted for brewing purposes could benefit from increased surface hydrophobicity, as in CBSY, to allow for increased cell–cell contact and interaction with the environment, improving flocculation properties and reducing solubility [69]. The decrease in hydrophobicity in PBSY is likely due to the degradation of the yeast cell and protein during autolysis and fermentation [13]. This theory is supported by the literature, with increasing degrees of hydrolysis reducing the hydrophobicity of proteins depending on the method of hydrolysis [70,71]. Conformational changes induced during processing (i.e., thermal treatment, pH drop) could also contribute to this difference [72]. Additionally, the increased ethanol concentration in CBSY compared to PBSY [13] might also have contributed to an increase in surface hydrophobicity [73], while yeast cell surface hydrophobicity has also been shown to increase with replicative age [69].
Generally, increased protein solubility indicates improved functional characteristics, including foaming [74,75,76]. However, a low pH can destabilise foam matrices, whereas a neutral to higher pH has been shown to enhance foaming properties [77]. This effect is likely the reason for the inhibited foaming capacity and stability of PBSY at native pH. In contrast, at pH 7, CBSY and PBSY perform similarly in terms of foaming capacity, and PBSY exceeds CBSY with regard to foam stability. This increased foaming capacity and stability of CBSY at native pH may also be due to increased surface hydrophobicity, where the hydrophobic groups lend increased surfactant properties.
Proteins and peptides also play a significant role in the production and stabilisation of foam in food applications due to their potential surfactant properties. A study by Tang et al. (2022) [78] showed that the addition of soy peptides can improve the foaming characteristics of egg white powder. Soy peptides have been shown to exhibit good interfacial and emulsifying properties and have the ability to reduce surface tension [79]. However, peptide size is important. Smaller peptides (i.e., a higher degree of hydrolysis) do not display any surfactant properties. By contrast, those with lower degrees of hydrolysis show improved surface-tension-lowering abilities [79]. The same effect has been observed in brewing, where lower molecular weight peptides are considered to be negative foaming effectors, potentially due to the limitation of active sites at the air/liquid interface [80]. The protein degradation occurring in PBSY during autolysis and fermentation results in the release of amino acids, peptides, and proteins [13], in particular glycoproteins, which may account for the improved foam stability performance of PBSY over CBSY at pH 7. During autolysis, the cell wall degradation activity by β-1,3 glucanase releases the glycoprotein, i.e., mannoproteins, from the yeast cell wall. With a hydrophobic protein segment and a hydrophilic polysaccharide segment, glycoproteins can act as good foam producers and stabilisers. Purified yeast mannoproteins have been successful in enhancing foaming characteristics in sparkling wines [81]. This is a possible explanation for the enhanced foam stability in PSBY at pH 7. This could also explain the increase in stability of emulsions formed with PSBY as opposed to CBSY, with these proteins forming a stabilising layer around the oil droplets [82]. Saccharomyces species have been shown to successfully stabilise oil in water emulsions [83,84]. However, the yeast used in that study included pure yeast cells that had been thermally inactivated, which is a significantly different matrix from that of BSY. In this study, the PBSY emulsions exhibited a decreased separation rate and a smaller oil droplet size than the CBSY emulsions. As well as the release of glycoproteins, simply the increased concentration of peptides in PBSY could also contribute to this effect, although the degree of hydrolysis is not specifically known. It should also be noted that the emulsions formed in this study were based on the 1% protein concentration without accounting for protein solubility. Since PBSY exhibits greater protein solubility, it corresponds that surfactant properties will be increased.
The particle size results observed in this study align with the BSY cell size estimated by scanning electron microscopy in a previously published study [13], where the average cell diameter was estimated to range between 5 and 8 µm. These data are also supported by similar values reported in the literature [85,86,87].
While no significant thickening behaviour was observed in either CBSY or PBSY throughout heating and cooling, changes in rheological behaviour were observed between the ingredients. As a result of the heating and cooling cycle, G′ is increased in both CBSY and PBSY. However, PBSY G′ begins to increase at the beginning of the 90 °C hold, whereas CBSY G′ only begins to increase at the commencement of cooling. In food materials, changes in the rheological properties of food can mainly be attributed to proteins and polysaccharides [88]. Yeast β-glucans have been shown to possess gel-forming properties on their own and improve the gelling characteristics of other proteins when used in combination [89,90]. However, the yeast protein has been shown to have a low apparent viscosity, minimally influenced by shear rate [9]. A study by Worrasinchai et al. (2006) examined the weak-gel-forming abilities of spent yeast β-glucans and their use as an oil replacer in low-fat mayonnaise [91]. The presence of β-glucan in BSY, and the changes in polysaccharide composition during processing, may be partially responsible for the changes in rheological behaviour during heating and cooling. Yeast β-glucan has been shown to increase the water-holding capacity of fish protein gels [89,90], and, therefore, the increased level of β-glucan in CBSY may be responsible for its slightly increased WHC. Differing degrees of protein degradation in CBSY and PBSY may also affect rheological behaviour, as autolysis, LAB fermentation, and heat treatments likely result in protein denaturation and changes in the protein configuration in PBSY. Increased protein solubility in PBSY may also contribute to the accelerated rheological response from PBSY on heating. Differences in pH and ionic strength, as influenced by the presence of monovalent and divalent cations, are also factors to consider with regard to rheological changes [88,92,93]. The given results provide an interesting insight into the potential functionality of BSY when implemented in food applications as an important issue to consider when contemplating the feasibility of processing BSY in large quantities.

5. Conclusions

The upcycling of BSY presents an ongoing challenge. Although previous studies have outlined the potential of fermentation as a tool to improve overall sensory acceptability, the functional properties of such materials remain largely unexplored. This study examines in more detail the compositional changes that occur during the LAB fermentation of BSY, including a reduction in the level of glucans, the degradation of trehalose, and the increased level of fructose, while the fatty acid profile remains similar for both CBSY and PBSY. In terms of functionality, at pH 7, PBSY exceeded CBSY regarding foam stability, whereas CBSY displayed a higher foam capacity. No change in the oil-holding capacity, but a slight decrease in the water-holding capacity was observed. A significant increase in protein solubility at both native pH and pH 7 and a drastic decrease in surface hydrophobicity indicated extensive protein degradation in PBSY. Slightly improved emulsion stabilising characteristics were observed in PBSY, and some changes were observed in rheological behaviour. However, concerning these last two points, in particular, further study would be beneficial. In conclusion, this study expands on the known nutritional and functional information regarding BSY and fermented BSY, which is critically important in terms of implementing BSY as an ingredient in foods for human consumption and determining the feasibility of upscaling processing methods and food applications.

Author Contributions

Conceptualisation, E.K.A. and A.W.S.; investigation, A.J.; writing—original draft preparation, A.J.; writing—review and editing, L.N. and A.W.S.; supervision, E.K.A. and A.W.S.; project administration, E.Z.; funding acquisition, E.K.A. All authors have read and agreed to the published version of the manuscript.

Funding

This project received funding from the European Union’s Horizon 2020 research and innovation programme under grant agreement No 818368 (MASTER). This manuscript reflects only the authors’ views, and the European Commission is not responsible for any use that may be made of the information it contains.

Institutional Review Board Statement

Not applicable.

Informed Consent Statement

Not applicable.

Data Availability Statement

Data available upon request.

Acknowledgments

The authors wish to thank Thomas Monin and Patrick O’Riordan for their support and helpful discussions. The authors would also like to acknowledge and thank Lilit Ispiryan and Emma Neylon for their help with the IC analysis and evaluation, Martin Vogelsang-O’Dwyer for his valuable advice and assistance with many methods used during this study, and Tom Hannon for technical support.

Conflicts of Interest

The authors declare no conflicts of interest.

References

  1. Kunze, W. Technology Brewing and Malting, 2nd ed.; VLB: Berlin, Germany, 1999. [Google Scholar]
  2. Jan Conway Global Beer Production 1998–2022. Available online: https://www.statista.com/statistics/270275/worldwide-beer-production/ (accessed on 30 January 2024).
  3. Jaeger, A.; Arendt, E.K.; Zannini, E.; Sahin, A.W. Brewer’s Spent Yeast (BSY), an Underutilized Brewing By-Product. Fermentation 2020, 6, 123. [Google Scholar] [CrossRef]
  4. Burki, T. Food Security and Nutrition in the World. Lancet Diabetes Endocrinol. 2022, 10, 622. [Google Scholar] [CrossRef]
  5. Shotipruk, A.; Kittianong, P.; Suphantharika, M.; Muangnapoh, C. Application of Rotary Microfiltration in Debittering Process of Spent Brewer’s Yeast. Bioresour. Technol. 2005, 96, 1851–1859. [Google Scholar] [CrossRef] [PubMed]
  6. Oliveira, A.S.; Ferreira, C.; Pereira, J.O.; Pintado, M.E.; Carvalho, A.P. Valorisation of Protein-Rich Extracts from Spent Brewer’s Yeast (Saccharomyces cerevisiae): An Overview. Biomass Convers. Biorefinery 2022, 11, 4002. [Google Scholar] [CrossRef]
  7. Oliveira, A.S.; Odila Pereira, J.; Ferreira, C.; Faustino, M.; Durão, J.; Pereira, A.M.; Oliveira, C.M.; Pintado, M.E.; Carvalho, A.P. Spent Yeast Valorization for Food Applications: Effect of Different Extraction Methodologies. Foods 2022, 11, 4002. [Google Scholar] [CrossRef]
  8. Olivares-Galván, S.; Marina, M.L.; García, M.C. Extraction of Valuable Compounds from Brewing Residues: Malt Rootlets, Spent Hops, and Spent Yeast. Trends Food Sci. Technol. 2022, 127, 181–197. [Google Scholar] [CrossRef]
  9. Ma, C.; Xia, S.; Song, J.; Hou, Y.; Hao, T.; Shen, S.; Li, K.; Xue, C.; Jiang, X. Yeast Protein as a Novel Dietary Protein Source: Comparison with Four Common Plant Proteins in Physicochemical Properties. Curr. Res. Food Sci. 2023, 7, 100555. [Google Scholar] [CrossRef]
  10. Ritala, A.; Häkkinen, S.T.; Toivari, M.; Wiebe, M.G. Single Cell Protein-State-of-the-Art, Industrial Landscape and Patents 2001–2016. Front. Microbiol. 2017, 8, 2009. [Google Scholar] [CrossRef] [PubMed]
  11. Thiviya, P.; Gamage, A.; Kapilan, R.; Merah, O.; Madhujith, T. Single Cell Protein Production Using Different Fruit Waste: A Review. Separations 2022, 9, 178. [Google Scholar] [CrossRef]
  12. Jach, M.E.; Serefko, A.; Ziaja, M.; Kieliszek, M. Yeast Protein as an Easily Accessible Food Source. Metabolites 2022, 12, 63. [Google Scholar] [CrossRef]
  13. Jaeger, A.; Nyhan, L.; Sahin, A.W.; Zannini, E.; Arendt, E.K. Lactic Acid Fermentation as a Valorising Agent for Brewer’s Spent Yeast—Improving the Sensory Quality and Nutritional Potential. Fermentation 2024, 10, 54. [Google Scholar] [CrossRef]
  14. ISO 16958:2015|IDF 231:2015; International Organization for Standardization Determination of Fatty Acids Composition—Milk, Milk Products, Infant Formula and Adult Nutritionals. Capillary Gas Chromatographic Method. International Organization for Standardization: Geneva, Switzerland, 2015.
  15. Ispiryan, L.; Heitmann, M.; Hoehnel, A.; Zannini, E.; Arendt, E.K. Optimization and Validation of an HPAEC-PAD Method for the Quantification of FODMAPs in Cereals and Cereal-Based Products. J. Agric. Food Chem. 2019, 67, 4384–4392. [Google Scholar] [CrossRef]
  16. Alonso-Miravalles, L.; Jeske, S.; Bez, J.; Detzel, A.; Busch, M.; Krueger, M.; Wriessnegger, C.L.; O’Mahony, J.A.; Zannini, E.; Arendt, E.K. Membrane Filtration and Isoelectric Precipitation Technological Approaches for the Preparation of Novel, Functional and Sustainable Protein Isolate from Lentils. Eur. Food Res. Technol. 2019, 245, 1855–1869. [Google Scholar] [CrossRef]
  17. Boye, J.I.; Aksay, S.; Roufik, S.; Ribéreau, S.; Mondor, M.; Farnworth, E.; Rajamohamed, S.H. Comparison of the Functional Properties of Pea, Chickpea and Lentil Protein Concentrates Processed Using Ultrafiltration and Isoelectric Precipitation Techniques. Food Res. Int. 2010, 43, 537–546. [Google Scholar] [CrossRef]
  18. Hayakawa, S.; Nakai, S. Relationships of Hydrophobicity and Net Charge to the Solubility of Milk and Soy Proteins. J. Food Sci. 1985, 50, 486–491. [Google Scholar] [CrossRef]
  19. Karaca, A.C.; Low, N.; Nickerson, M. Emulsifying Properties of Chickpea, Faba Bean, Lentil and Pea Proteins Produced by Isoelectric Precipitation and Salt Extraction. Food Res. Int. 2011, 44, 2742–2750. [Google Scholar] [CrossRef]
  20. AACC. Method 46-12–Crude Protein—Kjeldahl Method, Boric Acid Modification 2011. In International Approved Methods of Analysis, 11th ed.; AACC: Arnold, MD, USA, 2011. [Google Scholar]
  21. Jaeger, A.; Sahin, A.W.; Nyhan, L.; Zannini, E.; Arendt, E.K. Functional Properties of Brewer’s Spent Grain Protein Isolate: The Missing Piece in the Plant Protein Portfolio. Foods 2023, 12, 798. [Google Scholar] [CrossRef]
  22. Gibson, P.R.; Shepherd, S.J. Personal View: Food for Thought-Western Lifestyle and Susceptibility to Crohn’s Disease. The FODMAP Hypothesis. Aliment. Pharmacol. Ther. 2005, 21, 1399–1409. [Google Scholar] [CrossRef] [PubMed]
  23. Wu, M.; Wang, J.; Hu, J.; Li, Z.; Liu, R.; Liu, Y.; Cao, Y.; Ge, Q.; Yu, H. Effect of Typical Starch on the Rheological Properties and NMR Characterization of Myofibrillar Protein Gel. J. Sci. Food Agric. 2020, 100, 258–267. [Google Scholar] [CrossRef]
  24. Raghavendra, S.N.; Ramachandra Swamy, S.R.; Rastogi, N.K.; Raghavarao, K.S.M.S.; Kumar, S.; Tharanathan, R.N. Grinding Characteristics and Hydration Properties of Coconut Residue: A Source of Dietary Fiber. J. Food Eng. 2006, 72, 281–286. [Google Scholar] [CrossRef]
  25. Escamilla-Silva, E.M.; Guzmán-Maldonado, S.H.; Cano-Medinal, A.; González-Alatorre, G. Simplified Process for the Production of Sesame Protein Concentrate. Differential Scanning Calorimetry and Nutritional, Physicochemical and Functional Properties. J. Sci. Food Agric. 2003, 83, 972–979. [Google Scholar] [CrossRef]
  26. McCleary, B.V.; Draga, A. Measurement of β-Glucan in Mushrooms and Mycelial Products. J. AOAC Int. 2016, 99, 364–373. [Google Scholar] [CrossRef] [PubMed]
  27. Pinto, M.; Coelho, E.; Nunes, A.; Brandão, T.; Coimbra, M.A. Valuation of Brewers Spent Yeast Polysaccharides: A Structural Characterization Approach. Carbohydr. Polym. 2015, 116, 215–222. [Google Scholar] [CrossRef] [PubMed]
  28. Avramia, I.; Amariei, S. Spent Brewer’s Yeast as a Source of Insoluble β-Glucans. Int. J. Mol. Sci. 2021, 22, 825. [Google Scholar] [CrossRef]
  29. Alexandre, H.; Guilloux-Benatier, M. Yeast Autolysis in Sparkling Wine—A Review. Aust. J. Grape Wine Res. 2006, 12, 119–127. [Google Scholar] [CrossRef]
  30. Balmaseda, A.; Aniballi, L.; Rozès, N.; Bordons, A.; Reguant, C. Use of Yeast Mannoproteins by Oenococcus Oeni during Malolactic Fermentation under Different Oenological Conditions. Foods 2021, 10, 1540. [Google Scholar] [CrossRef] [PubMed]
  31. Campos, J.; Bao, J.; Lidén, G. Optically Pure Lactic Acid Production from Softwood-Derived Mannose by Pediococcus Acidilactici. J. Biotechnol. 2021, 335, 1–8. [Google Scholar] [CrossRef]
  32. Van Steenwijk, H.P.; Bast, A.; De Boer, A. Immunomodulating Effects of Fungal Beta-Glucans. Nutrients 2021, 13, 1333. [Google Scholar] [CrossRef]
  33. Brown, G.D.; Gordon, S. Fungal β-Glucans and Mammalian Immunity. Immunity 2003, 19, 311–315. [Google Scholar] [CrossRef]
  34. Vetvicka, V.; Vashishta, A.; Saraswat-Ohri, S.; Vetvickova, J. Immunological Effects of Yeast- and Mushroom-Derived β-Glucans. J. Med. Food 2008, 11, 615–622. [Google Scholar] [CrossRef]
  35. Dharsono, T.; Rudnicka, K.; Wilhelm, M.; Schoen, C. Effects of Yeast (1,3)-(1,6)-Beta-Glucan on Severity of Upper Respiratory Tract Infections: A Double-Blind, Randomized, Placebo-Controlled Study in Healthy Subjects. J. Am. Coll. Nutr. 2019, 38, 40–50. [Google Scholar] [CrossRef] [PubMed]
  36. Zhong, K.; Liu, Z.; Lu, Y.; Xu, X. Effects of Yeast β-Glucans for the Prevention and Treatment of Upper Respiratory Tract Infection in Healthy Subjects: A Systematic Review and Meta-Analysis. Eur. J. Nutr. 2021, 60, 4175–4187. [Google Scholar] [CrossRef] [PubMed]
  37. Talbott, S.M.; Talbott, J.A. Baker’s Yeast Beta-Glucan Supplement Reduces Upper Respiratory Symptoms and Improves Mood State in Stressed Women. J. Am. Coll. Nutr. 2012, 31, 295–300. [Google Scholar] [CrossRef]
  38. François, J.; Parrou, J.L. Reserve Carbohydrates Metabolism in the Yeast Saccharomyces cerevisiae. FEMS Microbiol. Rev. 2001, 25, 125–145. [Google Scholar] [CrossRef] [PubMed]
  39. Peyer, L.C.; Zarnkow, M.; Jacob, F.; De Schutter, D.P.; Arendt, E.K. Sour Brewing: Impact of Lactobacillus Amylovorus FST2.11 on Technological and Quality Attributes of Acid Beers. J. Am. Soc. Brew. Chem. 2017, 75, 207–216. [Google Scholar] [CrossRef]
  40. Gänzle, M.G.; Follador, R. Metabolism of Oligosaccharides and Starch in Lactobacilli: A Review. Front. Microbiol. 2012, 3, 340. [Google Scholar] [CrossRef] [PubMed]
  41. Hernawan, T.; Fleet, G. Chemical and Cytological Changes during the Autolysis of Yeasts. J. Ind. Microbiol. 1995, 14, 440–450. [Google Scholar] [CrossRef]
  42. Raigond, P.; Ezekiel, R.; Raigond, B. Resistant Starch in Food: A Review. J. Sci. Food Agric. 2015, 95, 1968–1978. [Google Scholar] [CrossRef]
  43. Aklujkar, P.P.; Sankh, S.N.; Arvindekar, A.U. A Simplified Method for the Isolation and Estimation of Cell Wall Bound Glycogen in Saccharomyces cerevisiae. J. Inst. Brew. 2008, 114, 205–208. [Google Scholar] [CrossRef]
  44. Guyot, S.; Ferret, E.; Gervais, P. Responses of Saccharomyces cerevisiae to Thermal Stress. Biotechnol. Bioeng. 2005, 92, 403–409. [Google Scholar] [CrossRef]
  45. Bandara, A.; Fraser, S.; Chambers, P.J.; Stanley, G.A. Trehalose Promotes the Survival of Saccharomyces cerevisiae during Lethal Ethanol Stress, but Does Not Influence Growth under Sublethal Ethanol Stress. FEMS Yeast Res. 2009, 9, 1208–1216. [Google Scholar] [CrossRef]
  46. Eleutherio, E.; Panek, A.; Freire, J.; Eduardo, D.M. Revisiting Yeast Trehalose Metabolism. Curr. Genet. 2015, 61, 263–274. [Google Scholar] [CrossRef] [PubMed]
  47. Trevisol, E.T.V.; Panek, A.D.; Mannarino, S.C.; Eleutherio, E.C.A. The Effect of Trehalose on the Fermentation Performance of Aged Cells of Saccharomyces cerevisiae. Appl. Microbiol. Biotechnol. 2011, 90, 697–704. [Google Scholar] [CrossRef]
  48. Kordialik-Bogacka, E.; Diowksz, A. Physiological State of Reused Brewing Yeast. Czech J. Food Sci. 2013, 31, 264–269. [Google Scholar] [CrossRef]
  49. Du Toit, M.; Dicks, L.M.T.; Holzapfel, W.H. Taxonomy of Obligately Homofermentative and Facultatively Heterofermentative Lactobacilli in Pig Faeces. Lett. Appl. Microbiol. 2001, 32, 199–204. [Google Scholar] [CrossRef]
  50. Jacob, F.F.; Striegel, L.; Rychlik, M.; Hutzler, M.; Methner, F.J. Yeast Extract Production Using Spent Yeast from Beer Manufacture: Influence of Industrially Applicable Disruption Methods on Selected Substance Groups with Biotechnological Relevance. Eur. Food Res. Technol. 2019, 245, 1169–1182. [Google Scholar] [CrossRef]
  51. Varney, J.; Barrett, J.; Scarlata, K.; Catsos, P.; Gibson, P.R.; Muir, J.G. FODMAPs: Food Composition, Defining Cutoff Values and International Application. J. Gastroenterol. Hepatol. 2017, 32, 53–61. [Google Scholar] [CrossRef]
  52. Lomakin, I.B.; Xiong, Y.; Steitz, T.A. The Crystal Structure of Yeast Fatty Acid Synthase, a Cellular Machine with Eight Active Sites Working Together. Cell 2007, 129, 319–332. [Google Scholar] [CrossRef] [PubMed]
  53. Speers, A.; Forbes, J. Yeast: An overview. In Brewing Microbiology: Managing Microbes, Ensuring Quality and Valorising Waste; Elsevier Ltd.: Amsterdam, The Netherlands, 2015; pp. 3–9. ISBN 9781782423492. [Google Scholar]
  54. Olšovská, J.; Vrzal, T.; Štěrba, K.; Slabý, M.; Kubizniaková, P.; Čejka, P. The Chemical Profiling of Fatty Acids during the Brewing Process. J. Sci. Food Agric. 2019, 99, 1772–1779. [Google Scholar] [CrossRef] [PubMed]
  55. Tehlivets, O.; Scheuringer, K.; Kohlwein, S.D. Fatty Acid Synthesis and Elongation in Yeast. Biochim. Biophys. Acta Mol. Cell Biol. Lipids 2007, 1771, 255–270. [Google Scholar] [CrossRef]
  56. Technology, F.; Blagovi, B. Lipid Composition of Brewer’ s Yeast. Food Technol. Biotechnol. 2015, 39, 175–181. [Google Scholar]
  57. Mennah-Govela, Y.A.; Singh, R.P.; Bornhorst, G.M. Buffering Capacity of Protein-Based Model Food Systems in the Context of Gastric Digestion. Food Funct. 2019, 10, 6074–6087. [Google Scholar] [CrossRef]
  58. Salaün, F.; Mietton, B.; Gaucheron, F. Buffering Capacity of Dairy Products. Int. Dairy J. 2005, 15, 95–109. [Google Scholar] [CrossRef]
  59. Thomas, K.C.; Hynes, S.H.; Ingledew, W.M. Influence of Medium Buffering Capacity on Inhibition of Saccharomyces cerevisiae Growth by Acetic and Lactic Acids. Appl. Environ. Microbiol. 2002, 68, 1616–1623. [Google Scholar] [CrossRef]
  60. Lavaisse, L.M.; Hollmann, A.; Nazareno, M.A.; Disalvo, E.A. Zeta Potential Changes of Saccharomyces cerevisiae during Fermentative and Respiratory Cycles. Colloids Surf. B Biointerfaces 2019, 174, 63–69. [Google Scholar] [CrossRef]
  61. Rogowska, A.; Pomastowski, P.; Złoch, M.; Railean-Plugaru, V.; Król, A.; Rafińska, K.; Szultka-Młyńska, M.; Buszewski, B. The Influence of Different PH on the Electrophoretic Behaviour of Saccharomyces cerevisiae Modified by Calcium Ions. Sci. Rep. 2018, 8, 2–11. [Google Scholar] [CrossRef]
  62. Takalloo, Z.; Nikkhah, M.; Nemati, R.; Jalilian, N.; Sajedi, R.H. Autolysis, Plasmolysis and Enzymatic Hydrolysis of Baker’s Yeast (Saccharomyces Cerevisiae): A Comparative Study. World J. Microbiol. Biotechnol. 2020, 36, 68. [Google Scholar] [CrossRef]
  63. Hansen, J.Ø.; Lagos, L.; Lei, P.; Reveco-Urzua, F.E.; Morales-Lange, B.; Hansen, L.D.; Schiavone, M.; Mydland, L.T.; Arntzen, M.Ø.; Mercado, L.; et al. Down-Stream Processing of Baker’s Yeast (Saccharomyces cerevisiae)—Effect on Nutrient Digestibility and Immune Response in Atlantic Salmon (Salmo salar). Aquaculture 2021, 530, 735707. [Google Scholar] [CrossRef]
  64. Dawood, M.A.O.; Koshio, S. Application of Fermentation Strategy in Aquafeed for Sustainable Aquaculture. Rev. Aquac. 2020, 12, 987–1002. [Google Scholar] [CrossRef]
  65. Mercier-Bonin, M.; Ouazzani, K.; Schmitz, P.; Lorthois, S. Study of Bioadhesion on a Flat Plate with a Yeast/Glass Model System. J. Colloid Interface Sci. 2004, 271, 342–350. [Google Scholar] [CrossRef]
  66. Marson, G.V.; Pereira, D.T.V.; da Costa Machado, M.T.; Di Luccio, M.; Martínez, J.; Belleville, M.P.; Hubinger, M.D. Ultrafiltration Performance of Spent Brewer’s Yeast Protein Hydrolysate: Impact of PH and Membrane Material on Fouling. J. Food Eng. 2021, 302, 110569. [Google Scholar] [CrossRef]
  67. Cano-Sarmiento, C.; Téllez-Medina, D.I.; Viveros-Contreras, R.; Cornejo-Mazón, M.; Figueroa-Hernández, C.Y.; García-Armenta, E.; Alamilla-Beltrán, L.; García, H.S.; Gutiérrez-López, G.F. Zeta Potential of Food Matrices. Food Eng. Rev. 2018, 10, 113–138. [Google Scholar] [CrossRef]
  68. Shimoi, H.; Sakamoto, K.; Okuda, M.; Atthi, R.; Iwashita, K.; Ito, K. The AWA1 Gene Is Required for the Foam-Forming Phenotype and Cell Surface Hydrophobicity of Sake Yeast. Appl. Environ. Microbiol. 2002, 68, 2018–2025. [Google Scholar] [CrossRef]
  69. Vidgren, V.; Londesborough, J. 125th Anniversary Review: Yeast Flocculation and Sedimentation in Brewing. J. Inst. Brew. 2011, 117, 475–487. [Google Scholar] [CrossRef]
  70. Mahmoud, M.I.; Malone, W.T.; Cordle, C.T. Enzymatic Hydrolysis of Casein: Effect of Degree of Hydrolysis on Antigenicity and Physical Properties. J. Food Sci. 1992, 57, 1223–1229. [Google Scholar] [CrossRef]
  71. Zhang, Y.; Zhang, Y.; Liu, X.; Huang, L.; Chen, Z.; Cheng, J. Influence of Hydrolysis Behaviour and Microfluidisation on the Functionality and Structural Properties of Collagen Hydrolysates. Food Chem. 2017, 227, 211–218. [Google Scholar] [CrossRef]
  72. Vogelsang-O’Dwyer, M.; Petersen, I.L.; Joehnke, M.S.; Sørensen, J.C.; Bez, J.; Detzel, A.; Busch, M.; Krueger, M.; O’Mahony, J.A.; Arendt, E.K.; et al. Comparison of Faba Bean Protein Ingredients Produced Using Dry Fractionation and Isoelectric Precipitation: Techno-Functional, Nutritional and Environmental Performance. Foods 2020, 9, 322. [Google Scholar] [CrossRef]
  73. Jin, Y.L.; Speers, R.A. Effect of Enviromnental Conditions on the Flocculation of Saccharomyces cerevisiae. J. Am. Soc. Brew. Chem. 2000, 58, 108–116. [Google Scholar] [CrossRef]
  74. Murray, B.S.; Ettelaie, R. Foam Stability: Proteins and Nanoparticles. Curr. Opin. Colloid Interface Sci. 2004, 9, 314–320. [Google Scholar] [CrossRef]
  75. Rez, A.; Mason, T.J.; Lelas, V.; Herceg, Z. Effect of Ultrasound Treatment on Solubility and Foaming Properties of Whey Protein Suspensions. J. Food Eng. 2008, 86, 281–287. [Google Scholar] [CrossRef]
  76. Kinsella, J.E. Functional Properties of Proteins: Possible Relationships between Structure and Function in Foams. Food Chem. 1981, 7, 273–288. [Google Scholar] [CrossRef]
  77. Nastaj, M.; Sołowiej, B.G. The Effect of Various PH Values on Foaming Properties of Whey Protein Preparations. Int. J. Dairy Technol. 2020, 73, 683–694. [Google Scholar] [CrossRef]
  78. Tang, T.; Liu, J.; Tang, S.; Xiao, N.; Jiang, Y.; Tu, Y.; Xu, M. Effects of Soy Peptides and PH on Foaming and Physicochemical Properties of Egg White Powder. LWT 2022, 153, 112503. [Google Scholar] [CrossRef]
  79. Imura, T.; Nakayama, M.; Taira, T.; Sakai, H.; Abe, M.; Kitamoto, D. Interfacial and Emulsifying Properties of Soybean Peptides with Different Degrees of Hydrolysis. J. Oleo Sci. 2015, 64, 183–189. [Google Scholar] [CrossRef]
  80. Lekkas, C.; Hill, A.E.; Taidi, B.; Hodgson, J.; Stewart, G.G. The Role of Small Wort Peptides in Brewing Fermentations. J. Inst. Brew. 2009, 115, 134–139. [Google Scholar] [CrossRef]
  81. Núñez, Y.P.; Carrascosa, A.V.; González, R.; Polo, M.C.; Martínez-Rodríguez, A. Isolation and Characterization of a Thermally Extracted Yeast Cell Wall Fraction Potentially Useful for Improving the Foaming Properties of Sparkling Wines. J. Agric. Food Chem. 2006, 54, 7898–7903. [Google Scholar] [CrossRef]
  82. Dickinson, E. Emulsion Stability. In Food Hydrocolloids: Structures, Properties, and Functions; Springer: Boston, MA, USA, 1994; pp. 387–398. [Google Scholar] [CrossRef]
  83. Firoozmand, H.; Rousseau, D. Microbial Cells as Colloidal Particles: Pickering Oil-in-Water Emulsions Stabilized by Bacteria and Yeast. Food Res. Int. 2016, 81, 66–73. [Google Scholar] [CrossRef]
  84. Moreira, T.C.P.; da Silva, V.M.; Gombert, A.K.; da Cunha, R.L. Stabilization Mechanisms of Oil-in-Water Emulsions by Saccharomyces cerevisiae. Colloids Surf. B Biointerfaces 2016, 143, 399–405. [Google Scholar] [CrossRef]
  85. Siddiqi, S.F.; Bulmer, M.; Ayazi Shamlou, P.; Titchener-Hooker, N.J. The Effects of Fermentation Conditions on Yeast Cell Debris Particle Size Distribution during High Pressure Homogenisation. Bioprocess Eng. 1995, 14, 1–8. [Google Scholar] [CrossRef]
  86. Milo, R.; Phillips, R. Cell Biology by the Numbers. In Physical Biology; Taylor and Francis Group: Oxford, UK, 2015; pp. 217–246. [Google Scholar]
  87. Zakhartsev, M.; Reuss, M. Cell Size and Morphological Properties of Yeast Saccharomyces cerevisiae in Relation to Growth Temperature. FEMS Yeast Res. 2018, 18, foy052. [Google Scholar] [CrossRef]
  88. Banerjee, S.; Bhattacharya, S. Food Gels: Gelling Process and New Applications. Crit. Rev. Food Sci. Nutr. 2012, 52, 334–346. [Google Scholar] [CrossRef]
  89. Xu, Y.; Lv, Y.; Yin, Y.; Zhao, H.; Li, X.; Yi, S.; Li, J. Improvement of the Gel Properties and Flavor Adsorption Capacity of Fish Myosin upon Yeast β-Glucan Incorporation. Food Chem. 2022, 397, 133766. [Google Scholar] [CrossRef]
  90. Zhang, H.; Xiong, Y.; Bakry, A.M.; Xiong, S.; Yin, T.; Zhang, B.; Huang, J.; Liu, Z.; Huang, Q. Effect of Yeast β-Glucan on Gel Properties, Spatial Structure and Sensory Characteristics of Silver Carp Surimi. Food Hydrocoll. 2019, 88, 256–264. [Google Scholar] [CrossRef]
  91. Worrasinchai, S.; Suphantharika, M.; Pinjai, S.; Jamnong, P. β-Glucan Prepared from Spent Brewer’s Yeast as a Fat Replacer in Mayonnaise. Food Hydrocoll. 2006, 20, 68–78. [Google Scholar] [CrossRef]
  92. Puppo, M.C.; Añón, M.C. Soybean Protein Dispersions at Acid PH. Thermal and Rheological Properties. J. Food Sci. 1999, 64, 50–56. [Google Scholar] [CrossRef]
  93. Khemakhem, M.; Attia, H.; Ayadi, M.A. The Effect of PH, Sucrose, Salt and Hydrocolloid Gums on the Gelling Properties and Water Holding Capacity of Egg White Gel. Food Hydrocoll. 2019, 87, 11–19. [Google Scholar] [CrossRef]
Figure 1. (A) Zeta potential of CBSY and PBSY represented as mV across a pH range of pH 2 to pH 7 and (B) protein Solubility of CBSY and PBSY at pH 7 and native pH (CBSY/pH 6.09; PBSY/pH 3.49.
Fermentation 10 00136 g001
Figure 2. Foaming properties of CBSY and PBSY at native pH (CBSY/pH 6.09; PBSY/pH 3.49) and pH 7. Significant differences are indicated by differing lowercase letters (p < 0.05).
Fermentation 10 00136 g002
Figure 3. Separation profiles of CBSY (A) and PBSY (B) emulsions, showing light transmission over the length of the sample, (C) the oil droplet size distribution of CBSY and PBSY emulsions, and (D) the particle size distribution of BSY dispersions.
Fermentation 10 00136 g003
Figure 4. (A) G′ and G″ of CBSY and PBSY during a heating and cooling cycle (standard deviation in grey) (B) Tan δ values for CBSY and PBSY as a function of time over the defined heating and cooling cycle, plotted using the average values of triplicate data.
Fermentation 10 00136 g004
Table 1. Composition of CBSY and PBSY, represented as g/100 g of DM, as published previously by (Jaeger et al. [13]).
g/100 g DM
CBSYPBSY
Proteins35.588 ± 1.50138.736 ± 1.638
Total Fats1.361 ± 0.0891.393 ± 0.001
Carbohydrates
Insoluble Dietary Fibre44.367 ± 1.97236.723 ± 1.767
High MW Soluble3.130 ± 0.4822.095 ± 0.386
Low MW Soluble2.412 ± 0.0640.925 ± 0.140
Total Dietary Fibre49.909 ± 2.12239.731 ± 1.603
Total Sugars0.301 ± 0.01910.048 ± 0.644
Ash5.628 ± 0.3223.429 ± 0.211
Moisture 6.710 ± 0.38014.530 ± 0.380
Energy value (kcal)314 ± 10294 ± 10
Energy value (kJ)1322 ± 451237 ± 47
mg/kg
Calcium2320 ± 1902700 ± 220
Iron65 ± 1368 ± 14
Phosphorus9860 ± 7906600 ± 530
Magnesium2060 ± 2301310 ± 140
Manganese5.7 ± 1.35.5 ± 1.2
Potassium14,900 ± 15004950 ± 480
Copper3.16 ± 0.673.36 ± 0.71
Sodium271 ± 26166 ± 21
Zinc72 ± 1478 ± 15
Total29,55615,880
g/100g DM
Glucose0.166 ± 0.014n.d.
Fructose0.090 ± 0.0099.924 ± 0.644
Lactosen.d.n.d.
Sucrosen.d.n.d.
Maltose0.045 ± 0.0100.124 ± 0.020
Total Sugars0.301 ± 0.01910.048 ± 0.644
IBU (mg/L)
Iso-α-acids (IBU)129100
Table 2. Carbohydrate and fatty acid breakdown of CBSY and PBSY, presented as g/100 g [DM] ± standard deviation.
g/100 g
Carbohydrates CBSYPBSY
FODMAPS
Mono-/disaccharidesGlucose0.069 ± 0.003 a0.790 ± 0.015 b
Fructose0.020 ± 0.000 a7.994 ± 0.251 b
Excess fructose-7.204 *
PolyolsXylitol0.091 ± 0.001 a0.021 ± 0.000 b
Sorbitol0.035 ± 0.000 a0.011 ± 0.000 b
Mannitol0.057 ± 0.001 a0.043 ± 0.001 b
Total polyols0.1830.075
OligosaccharidesRaffinose/Stachyose0.080 ± 0.001 a0.138 ± 0.005 b
Verbascosen.d.n.d.
Total GOS0.080.138
Total fructann.d. **n.d. **
OtherTrehalose5.275 ± 0.056 a0.403 ± 0.007 b
g/100 g DM
Glucans
Total glucan 39.788 ± 0.443 a26.316 ± 0.693 b
α-glucan 14.822 ± 0.607 a11.319 ± 0.356 b
β-glucan 24.966 ± 0.753 a14.997 ± 0.379 b
Resistant starch 10.550 ± 0.323 a5.670 ± 0.271 b
Digestible starch 17.10 ± 2.06 a12.38 ± 0.12 b
Fatty acids
Caprylic acid (C8:0)0.056 ± 0.0130.069 ± 0.015
Capric acid (C10:0)0.135 ± 0.0290.129 ± 0.027
Lauric acid (C12:0)0.030 ± 0.0060.036 ± 0.008
Myristic acid (C14:0)0.004 ± 0.0010.005 ± 0.001
Palmitic acid (C16:0)0.388 ± 0.0590.444 ± 0.066
Palmitoleic acid (C16:1)0.227 ± 0.0460.250 ± 0.050
Stearic acid (C18:0)0.155 ± 0.0330.174 ± 0.036
Octadecenoic acid (18: 1 total)0.101 ± 0.0180.110 ± 0.019
Octadecenoic acid (18:1 all trans)0.013 ± 0.0030.016 ± 0.003
Cisoctadecenoic acid (18:1 all cis)0.088 ± 0.0180.094 ± 0.018
Linoleic acid (18:2 n6)0.028 ± 0.0050.030 ± 0.006
Octadecatrienoic acid (total 18:3)0.005 ± 0.0010.006 ± 0.001
* Excess fructose = Fructose − Glucose ** n.d. not detected in means of no significant difference in fructose values determined from difference of assay A and B in fructan determination, or levels ≤ 0.1 g/100 g. Different lowercase letters represent significant statistical difference of means (p < 0.05).
Table 3. Techno-functional properties of CBSY and PBSY. Values in the same row that share a letter do not differ significantly.
CBSYPBSY
pH 6.090 ± 0.000 a3.493 ± 0.006 b
TTA (mL 0.1 M NaOH/g) 2.577 ± 0.040 a15.508 ± 0.362 b
Surface hydrophobicity 2906.933 ± 20.387 a189.867 ± 26.942 b
Protein solubility (%)Native pH31.531 ± 0.420 a75.426 ± 0.419 b
pH 731.508 ± 0.331 a72.916 ± 0.174 b
Zeta potential (mV)Native pH−13.1167 ± 1.532 a−1.179 ± 0.301 b
pH 7−14.1778 ± 1.525 a−8.393 ± 0.284 b
Oil-holding capacity (%) 178.098 ± 1.379 a183.310 ± 3.186 a
Water-holding capacity (%) 52.704 ± 1.587 a48.701 ± 0.321 b
Minimum gelling concentration (%w/w) >20%>20%
µmCBSYPBSY
Particle sizeD [3,2]6.022 ± 0.114 a6.274 ± 0.075 b
D [4,3]6.976 ± 0.192 a7.322 ± 0.103 a
Dv [10]3.834 ± 0.032 a3.912 ± 0.030 b
Dv [50]6.532 ± 0.156 a6.941 ± 0.098 b
Dv [90]10.844 ± 0.383 a11.378 ± 0.222 a
Emulsion particle sizeD [3,2]10.756 ± 0.204 a10.049 ± 0.612 a
D [4,3]22.967 ± 3.800 a20.611 ± 4.170 a
Dv [10]4.736 ± 0.103 a4.711 ± 0.212 a
Dv [50]16.311 ± 0.650 a12.967 ± 1.323 b
Dv [90]46.267 ± 4.729 a43.022 ± 5.094 a
Separation rate[%/minute]3.462 ± 0.067 a2.979 ± 0.065 b
Different lowercase letters represent significant statistical difference of means (p < 0.05).
Disclaimer/Publisher’s Note: The statements, opinions and data contained in all publications are solely those of the individual author(s) and contributor(s) and not of MDPI and/or the editor(s). MDPI and/or the editor(s) disclaim responsibility for any injury to people or property resulting from any ideas, methods, instructions or products referred to in the content.

