

Distinct Short-Term Response of Intracellular Amino Acids in Saccharomyces cerevisiae and Pichia pastoris to Oxidative and Reductive Stress

Department of Genetics and Bioengineering, Faculty of Engineering, Yeditepe University, Istanbul 34755, Turkey
*
Author to whom correspondence should be addressed.
Fermentation 2024, 10(3), 166; https://doi.org/10.3390/fermentation10030166
Submission received: 29 December 2023
/
Revised: 1 February 2024
/
Accepted: 16 February 2024
/
Published: 15 March 2024
(This article belongs to the Section Microbial Metabolism, Physiology & Genetics)
Abstract
:Despite being frequently encountered, the effect of oxidative or reductive stress on the intracellular metabolism and the response of the intracellular metabolome of yeasts is severely understudied. Non-conventional yeasts are attracting increasing attention due to their large substrate portfolio of non-canonical pathways as well as their production and secretion of proteins. To understand the effects of both stresses on yeast, the conventional model yeast S. cerevisiae and the non-conventional model yeast P. pastoris were perturbed with 5 mM of hydrogen peroxide for oxidative stress and 20 mM of dithiothreitol for reductive stress in well-defined chemostat cultures at a steady state, and fermentation profiles, intracellular amino acid levels, and intracellular glutathione levels were measured. Although stable profiles of extracellular metabolites were observed, significant changes were measured in intracellular amino acid levels within the first five minutes. Collectively, the amino acids ranged from 0.5 to 400 µmol/gDW, with the most significant increase upon the induction of oxidative stress being seen in cysteine (up to 90%) for S. cerevisiae and in aspartate (up to 80%) for P. pastoris. Upon the induction of reductive stress, asparagine nearly halves in S. cerevisiae, while tryptophan decreases by 60% in P. pastoris. By inspecting the time traces of each amino acid, possible mechanisms of pathway kinetics are speculated. This work furthers our understanding of the response of metabolism to oxidative stress in two model yeasts.
1. Introduction
An increasing level of oxygen in the atmosphere has given the potential to (micro)organisms, which originally evolved in a reducing environment, of efficient energy generation through respiration and also the capability to produce intermediates responsible for maintaining cellular homeostasis. Yet, excessive exposure to oxygen may cause damage to cells. Defense mechanisms have been developed to counter oxidative stress and the accumulation of reactive oxygen species (ROS) in all organisms. As a result, cells have evolved to survive both oxidative and reductive conditions.
The response of yeast cells to oxidative stress is typically complex, tightly regulated, and involves several omic layers following a time hierarchy. Dedicated experiments exploiting this time hierarchy may ultimately allow for the isolation of a single-omic response to external stimuli. Such an approach has been adopted in stimulus–response experiments focusing on monitoring the system response upon the external perturbation of a well-defined metabolic state (e.g., steady state in a chemostat) within a couple of minutes [1]. The resulting transient data can be used to construct and parametrize a dynamic model for metabolic reaction networks [2,3,4]. A typical short-term stimulus–response experiment involves taking “snapshots of the metabolism” upon perturbation by rapidly quenching the metabolism to stop enzymatic activity, separating cells from the fermentation medium, and extracting followed by quantifying intracellular metabolites. Focusing on the within-minute response of the cells and assuming that changes in enzyme concentration are negligible, the response can be attributed to the metabolic level and kinetic interactions [5,6].
Non-conventional yeasts draw attention in the field of industrial biotechnology due to their ability to use different substrates, their post-transcriptional modification capabilities, and their tendency to produce and secrete recombinant proteins. Recent studies have shown that non-conventional yeasts have a high potential to produce valuable biotechnological products including various recombinant proteins, several enzymes, and vaccines. With an increasing number of post-genomic studies and available dedicated molecular biology toolboxes, the use of non-conventional yeasts in the industry is increasing. Pichia pastoris (Komagataella pastoris), a well-known methylotrophic yeast, is an essential host for recombinant protein production.
Despite the available interest, studies on the impact of environmental stresses on the physiology of P. pastoris are rather limited, especially on the effects of oxygen availability, which is one of the most common problems in industrial biotechnology. By significantly affecting cellular redox reactions, oxygen plays a key role in protein-folding reactions within cells as well as the growth and protein production of cells. Baumann et al. [7] focused on understanding the physiological adaptation of P. pastoris to oxygen availability using a multi-level study that included transcriptomic, proteomic, and metabolic flux analyses, and they unraveled potentially distinct features of such an adaptation that have been described for S. cerevisiae.
Aerobic life induces oxidative stress, defined as high exposure to reactive oxygen species such as peroxides, alkyl hydroperoxides, and peroxide anions, as it leads to the production of ROS as an inevitable result of the physiological metabolism of all aerobically growing (micro)organisms. The type and content of the ROS define both the beneficial and toxic effects on the cell. While cell proliferation and differentiation processes require low levels of ROS, even these low levels can damage cellular homeostasis and can drive cell aging and death. In the physiological state, cells maintain their ROS levels with dynamic equilibrium during ROS generation and elimination processes, antioxidant enzyme mechanisms (superoxide dismutase, catalase, and peroxidase reactions), glutaredoxin/thioredoxin systems, metabolic products (glutathione, which is used in almost all eukaryotes), and the upregulation of various transcription factors (Yap1p, Skn7p, Msn2/4p) [8].
Reductive stress is described as an increased level of reducing equivalents in the form of redox couples (GSH/GSSG, NAD(P)H/NAD(P)+). Although studies on understanding oxidative stress mechanisms and responses have attracted more attention than reductive stress studies, the effect of reductive stress also maintains its importance in terms of intracellular redox balance. Exposure to reductants can cause reductive stress; the superoxide anion is essentially a reductant. Under certain conditions, redox enzymes such as mitochondrial glutathione reductase and thioredoxin reductase can donate electrons to O2 instead of their standard substrate, increasing the production of ROS. Reductive stress can be promoted using dithiothreitol (DTT) (experimentally), which is a potent reducing agent [9]. DTT can diffuse from membranes and prohibit disulfide bond formation. For instance, the folding and transport of vacuolar carboxypeptidase Y(CPY) from the endoplasmic reticulum is reversibly blocked by DTT. Moreover, DTT-induced reductive stress causes an accumulation of misfolded proteins in the endoplasmic reticulum. The study of Gasch and Spelmann [10] showed that the transcriptional response of yeast cells to DTT-induced reductive stress was remarkably different from the general environmental stress response.
Redox couples, NAD(H), NADP(H), and GSH/GSSG are essential regulators of cell metabolism. Glutathione (GSH) is an antioxidant found in plants, animals, fungi, and some bacteria and archaea, which is capable of preventing damage to important cellular components caused by various sources including reactive oxygen species, free radicals, peroxides, lipid peroxides, and heavy metals. GSH, a tripeptide with a gamma peptide bond between the carboxyl group of the glutamate side chain and cysteine, acts as a linker metabolite between amino acid metabolism and the redox state of cells [11]. Therefore, changes in the ratio of this redox couple may be key to understanding the reductive stress response. Besides its role in yeast metabolism, GSH is also significant for the bread and wine industries [12,13].
Recent studies on the methylotrophic yeast P. pastoris have focused on its response to ROS induced by methanol, which is used as a substrate for recombinant protein production. Lin et al. [14] conducted a noteworthy study indicating that an oxidative stress response was induced with methanol in P. pastoris. Heterologous protein production increased with the new mutant cell being designed with the overexpression of genes related to an antioxidant mechanism against ROS [14]. Similar studies show that understanding the oxidative stress response mechanism is of high importance in terms of taking new steps to increase fermentation efficiency in various application fields from recombinant protein production to fine chemicals.
Microorganisms require an abundant supply of amino acids to maintain their driving force for proliferation. However, the role of amino acids in the cell is not limited to their primary role as the primary building block of proteins. Amino acids play diverse roles in the cell, including energy generation, nucleoside synthesis, homeostasis of cellular redox, as well as stabilizing cell osmolarity and pathogenesis. Amino acids and their derivatives, being the most abundant compounds among all detected metabolites, represent a pivotal focus in oxidative stress, and their associated amino acid metabolism can be easily modified [15].
Departing from the question of how the non-conventional yeast model P. pastoris responds to oxidative stress in comparison to the conventional yeast model S. cerevisiae, this study focuses on the quantitative investigation of intracellular amino acids and glutathione levels in P. pastoris and compares them to those of the conventional yeast S. cerevisiae. Adopting the systems biology approach, the data generated, including fermentation profiles as well as measured targeted metabolome data and transcriptome data from the literature, are collectively taken into account in response to oxidative and reductive stress for conventional and non-conventional yeasts.
2. Materials and Methods
2.1. Organisms and Media
Saccharomyces cerevisiae CEN.PK113-7D (MATα, MAL2-8c SUC2, obtained from the EUROSCARF collection) and Pichia pastoris ATCC 28485 (obtained from ATCC) were kept in 30 percent glycerol at −80 °C prior to use in this study. Yeast cells were grown to the stationary phase in 250 mL Erlenmeyer flasks with 50 mL of a double mineral medium at 180 rpm and 30 °C [16]. The composition of the double mineral medium was as follows: (per liter) 10 g glucose, 10 g ammonium sulfate, 6 g potassium phosphate monobasic, 1 g magnesium sulfate heptahydrate, 2 mL of 1000× vitamin solution, and 20 mL of 100× trace elements (Table S1). The medium was sterilized at 121 °C 15 min prior to use, and the glucose solution was separately sterilized at 121 °C for 3 min. Both 1000× vitamin solution and 100× trace element solution were filter-sterilized.
2.2. Chemostat Cultivation and Application of Oxidative Stress
Both yeasts were aerobically cultivated in a double mineral medium at a dilution rate of 0.1 h−1 in 4 L bioreactors (Minifors 2, Infors HT, Bottmingen, Switzerland) with a working volume of 1.5 L. The medium is supplemented with 200 μL L−1 Antifoam Y-30 emulsion (Sigma Aldrich, St. Louis, MO, USA). Chemostat cultivation was preceded by a batch phase performed on a medium identical to the feed medium. At the end of the batch phase (evidenced by a sharp decrease in the carbon dioxide level in the off-gas and a sharp increase in the oxygen profile of the off-gas), medium feeding was started. The culture temperature was kept at 30 °C, and the pH was controlled at 5.5 using 3 M orthophosphoric acid or 3 M sodium hydroxide. The cultures were sparged with sterile air with a 0.75 Lh−1 flow rate and stirred initially at 500 rpm. The dissolved oxygen (DO) level was maintained above 20% through the cascaded control of the agitation speed. The fractions of carbon dioxide and oxygen in the off-gas were followed with the BlueInOneFerm gas analyzer (BlueSens, GmbH, Herten, Germany). The amounts of added acid, base, and antifoam were monitored and recorded during the entire course of fermentation.
Chemostat cultures were assumed to be at a steady state when the culture biomass production, carbon dioxide, and oxygen compositions of the off-gas readings did not change more than 5 percent after 5 volume changes. Furthermore, glucose limitation was confirmed by measuring the residual glucose concentration under 0.9 g L−1 at a steady state. To apply oxidative or reductive stress to the culture, corresponding agents were directly injected into the bioreactor with a sterile syringe. The feed pump and outflow pump were stopped at the start of a pulse experiment and restarted 5 min after each pulse. Just before the application of hydrogen peroxide (H2O2) perturbation, 10 mL of culture broth was sampled, and all the data from that sample were used as a reference state. The oxidative stress was mimicked by pulsing 5 mM of H2O2, and the reductive stress was mimicked by pulsing 20 mM Dithiothreitol (DTT) to the reactor. To observe the response of the yeasts, broth samples were rapidly withdrawn and quenched 1, 3, and 5 min after exposure to H2O2 and DTT, and metabolites were analyzed after extraction.
2.3. Rapid Sampling, Quenching, and Extraction of Intracellular Metabolites
10 mL of broth samples were rapidly withdrawn and quenched into 35 mL pure methanol at <−40 °C, quickly vortexed, and stored back at −40 °C. To remove the extracellular medium, samples were centrifuged at 5000× g for 5 min and at −12 °C (1580R, Gyrozen, Daejeon, Republic of Korea), and supernatants were stored at −80 °C for the determination of extracellular metabolites [2]. Intracellular metabolites were extracted using the boiling ethanol extraction method, following the earlier work carried out by Lange et al. [17], particularly for the measurement of the intracellular amino acid levels. A total of 35 mL of 75% ethanol was heated in a water bath at 95 °C for 5 min, the boiling ethanol was quickly poured onto the cell pellet, and the tubes were vortexed as fast as possible and placed on the water bath for 3 min. The samples were then cooled and centrifuged at 7000× g for 10 min at 4 °C (1580R, Gyrozen, Daejeon, Republic of Korea), and the extracts were stored at −80 °C [18]. Finally, the extracts were concentrated through a rotary evaporator (Heidolph, Schwabach, Germany), and then the samples were dried using a freeze-dryer (Labconco, Kansas City, Missouri, USA). Before each analysis, the extracts were resuspended on 500–1000 µL double-distilled water [2]. Broth samples collected prior to H2O2 perturbation were analyzed similarly and used as reference state measurements.
2.4. Analytical Methods
The biomass concentration was followed through the optical density measured using UV spectrometry (Thermo Scientific Genesys 10S UV-vis, Waltham, MA, USA) at 600 nm as well as the measurement of the dry weights of the cells. To measure the dry weight of the cells, 40 mL of the sample was taken in pre-weighted tubes and centrifuged at 10,000 rpm, followed by washing the pellets with distilled water or PBS solution. Then, the washed pellets were dried at 105 °C for at least 24 h. Residual sugar was measured with the dinitrosalicylic acid (DNS) method [19]. Acetate, ethanol, and glycerol were analyzed by HPLC (LC20AD, Shimadzu, Kyoto, Japan) equipped with an RI detector and IC-Pak ion exclusion column (7 μm, 7.8 × 300 mm, Waters, Milford, MA, USA) maintained at 50 °C using 5 mM sulfuric acid as mobile phase as 0.6 mLmin−1.
Identification and quantification of intracellular amino acids were carried out by first derivatizing using diethyl ethoxymethylenemalonate (DEEMM) and then quantification using HPLC (LC20AD, Shimadzu, Kyoto, Japan) equipped with a UV detector (280 nm) at 25 °C using an XBridge C18 column (5 μm 4.6 × 150 mm, Waters) eluted with two mobile phases as follows: 25 mM sodium acetate buffer (pH 5.8) with 0.02% sodium azide and 80:20 acetonitrile/methanol (4:1 (v/v) at 0.8 mL min−1 [20]. Commercial amino acids (L-tryptophan (T0254), L-phenylalanine (P5482), L-alanine (A7627), L-valine (V0500), L-isoleucine (I7403), L-leucine (L8912), glycine (G7403), L-cysteine (C7352), L-serine (S4311), L-glutamic acid monosodium salt hydrate (G1626), L-proline (P0380), DL-aspartatic acid potassium salt (A2025), L-arginine (A8094), L-methionine (M9625), L-asparagine (A0884), L-glutamine (G8540), and L-lysine (L9037) from Sigma Aldrich, USA) were used as the external standards for HPLC (Table S2). The available HPLC methodology did not allow for the accurate quantification of isoleucine and leucine separately. These amino acids were evaluated as total concentrations.
For glutathione, a UV detector at 210 nm with the same column was used, this time eluted with 25 mM sodium phosphate monobasic (pH 3.5) at 0.3 mL min−1 [21]. Commercial reduced glutathione (G6013) and oxidized glutathione (G4501-Sigma Aldrich, USA) were used as external standards for glutathione measurements.
2.5. Elemental Balances, Statistical Evaluations
Biomass-specific rates of growth (µ), glucose consumption (-), oxygen consumption (-), and carbon dioxide production () were calculated/estimated using the steady-state mass balances. The cumulative carbon balance accounts for the carbon from the substrate used and the accumulation of the carbon in biomass, carbon dioxide, and by-products if any. In the same manner, the cumulative electron balance accounts for the electrons from glucose, transferred to biomass and oxygen, with each being weighed by the corresponding degree of reduction. The biomass formula for S. cerevisiae used was that as described in [17], and for P. pastoris the one used was that in [22]. The calculated average values of the specific rates were reconciled under the constraint of satisfying the elemental conservation relations [23].
Statistical significance in the change in intracellular metabolite levels was assessed using a paired Student’s t-test (prior and posterior to the oxidative stress) under the null hypothesis that there is no change. The critical level of significance is taken to be 0.05.
3. Results and Discussion
This work aims to further our understanding of the response of two model yeasts (conventional and non-conventional) to oxidative and reductive stress using short-term stimulus–response experiments. With this aim, glucose-limited chemostats well characterized in their fermentation profiles (both the initial batch phase as well as its steady state) were carried out at a dilution rate of 0.1 h−1 for both yeasts. For the oxidative stress response, H2O2 perturbation experiments were conducted, and DTT perturbation experiments were conducted for the reductive stress response. Prior to the perturbation experiments, the patch/plate assays were used to determine the toxic levels of DTT on the yeast cells. In line with our results, Trotter et al. [24] reported that the wild-type S. cerevisiae was extremely resistant, growing on plates containing DTT concentrations as high as 16 mM. Therefore, 20 mM of DTT was selected in subsequent perturbation experiments.
3.1. Fermentation Profiles
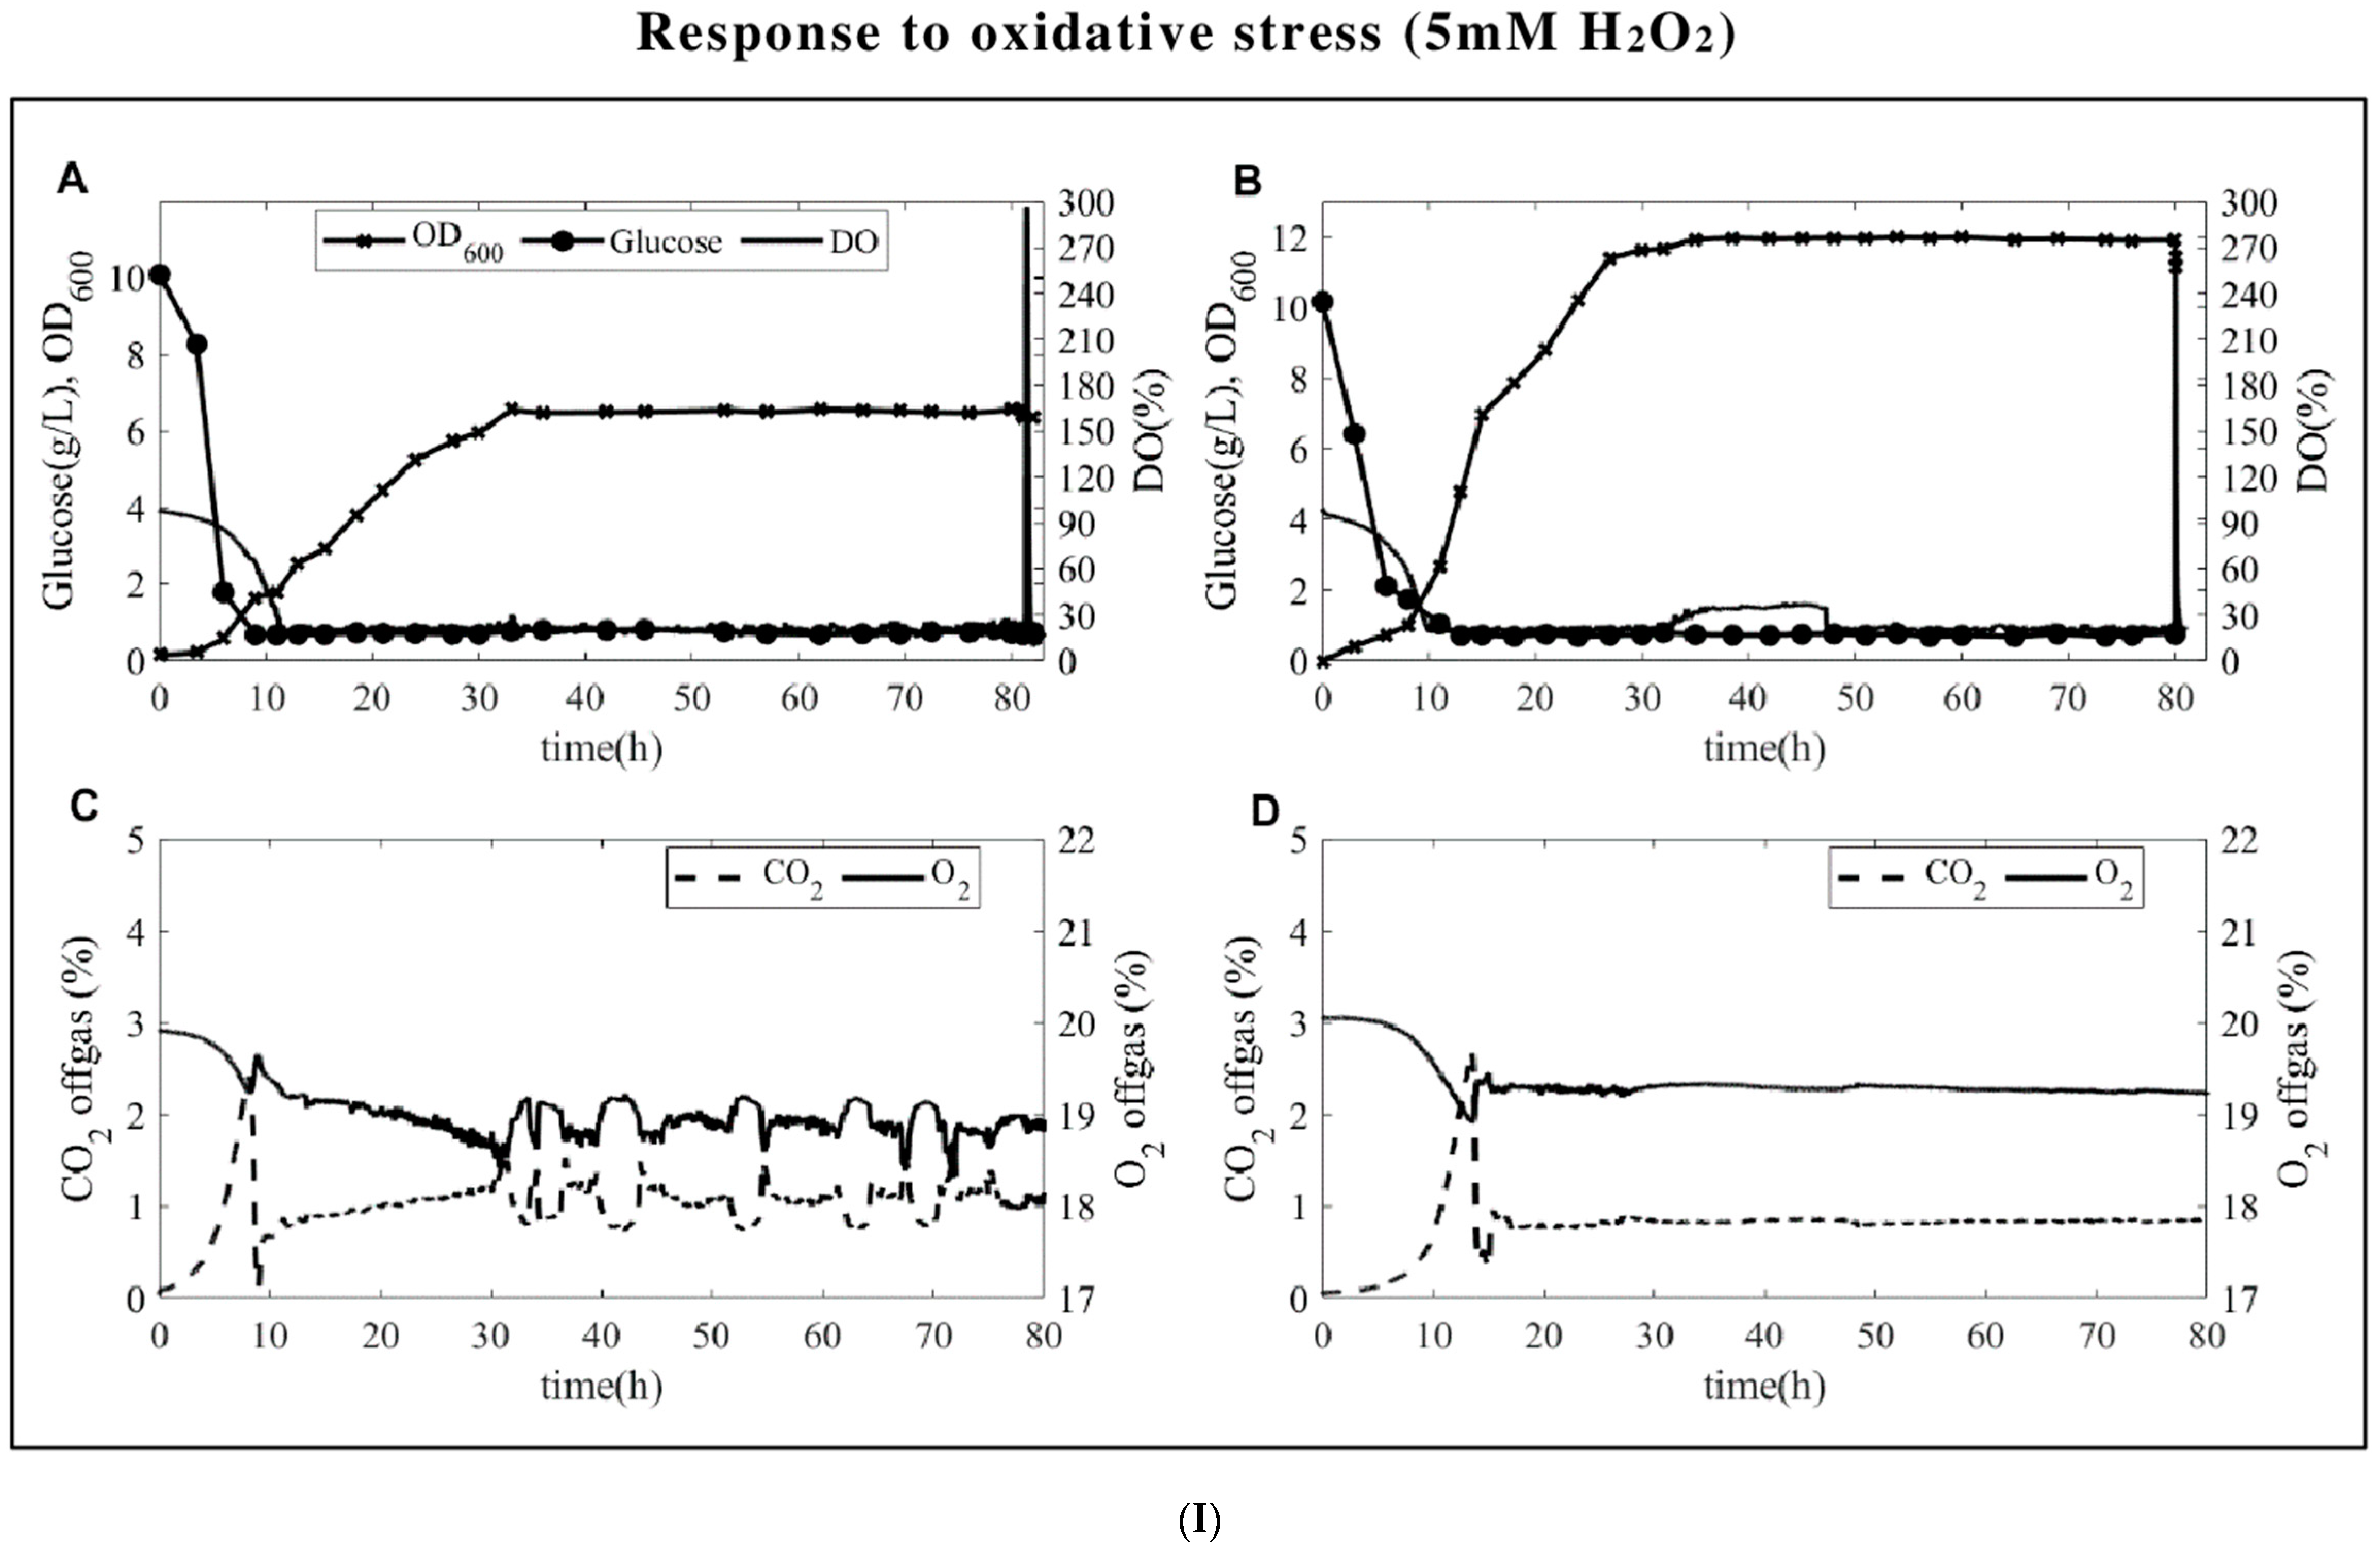
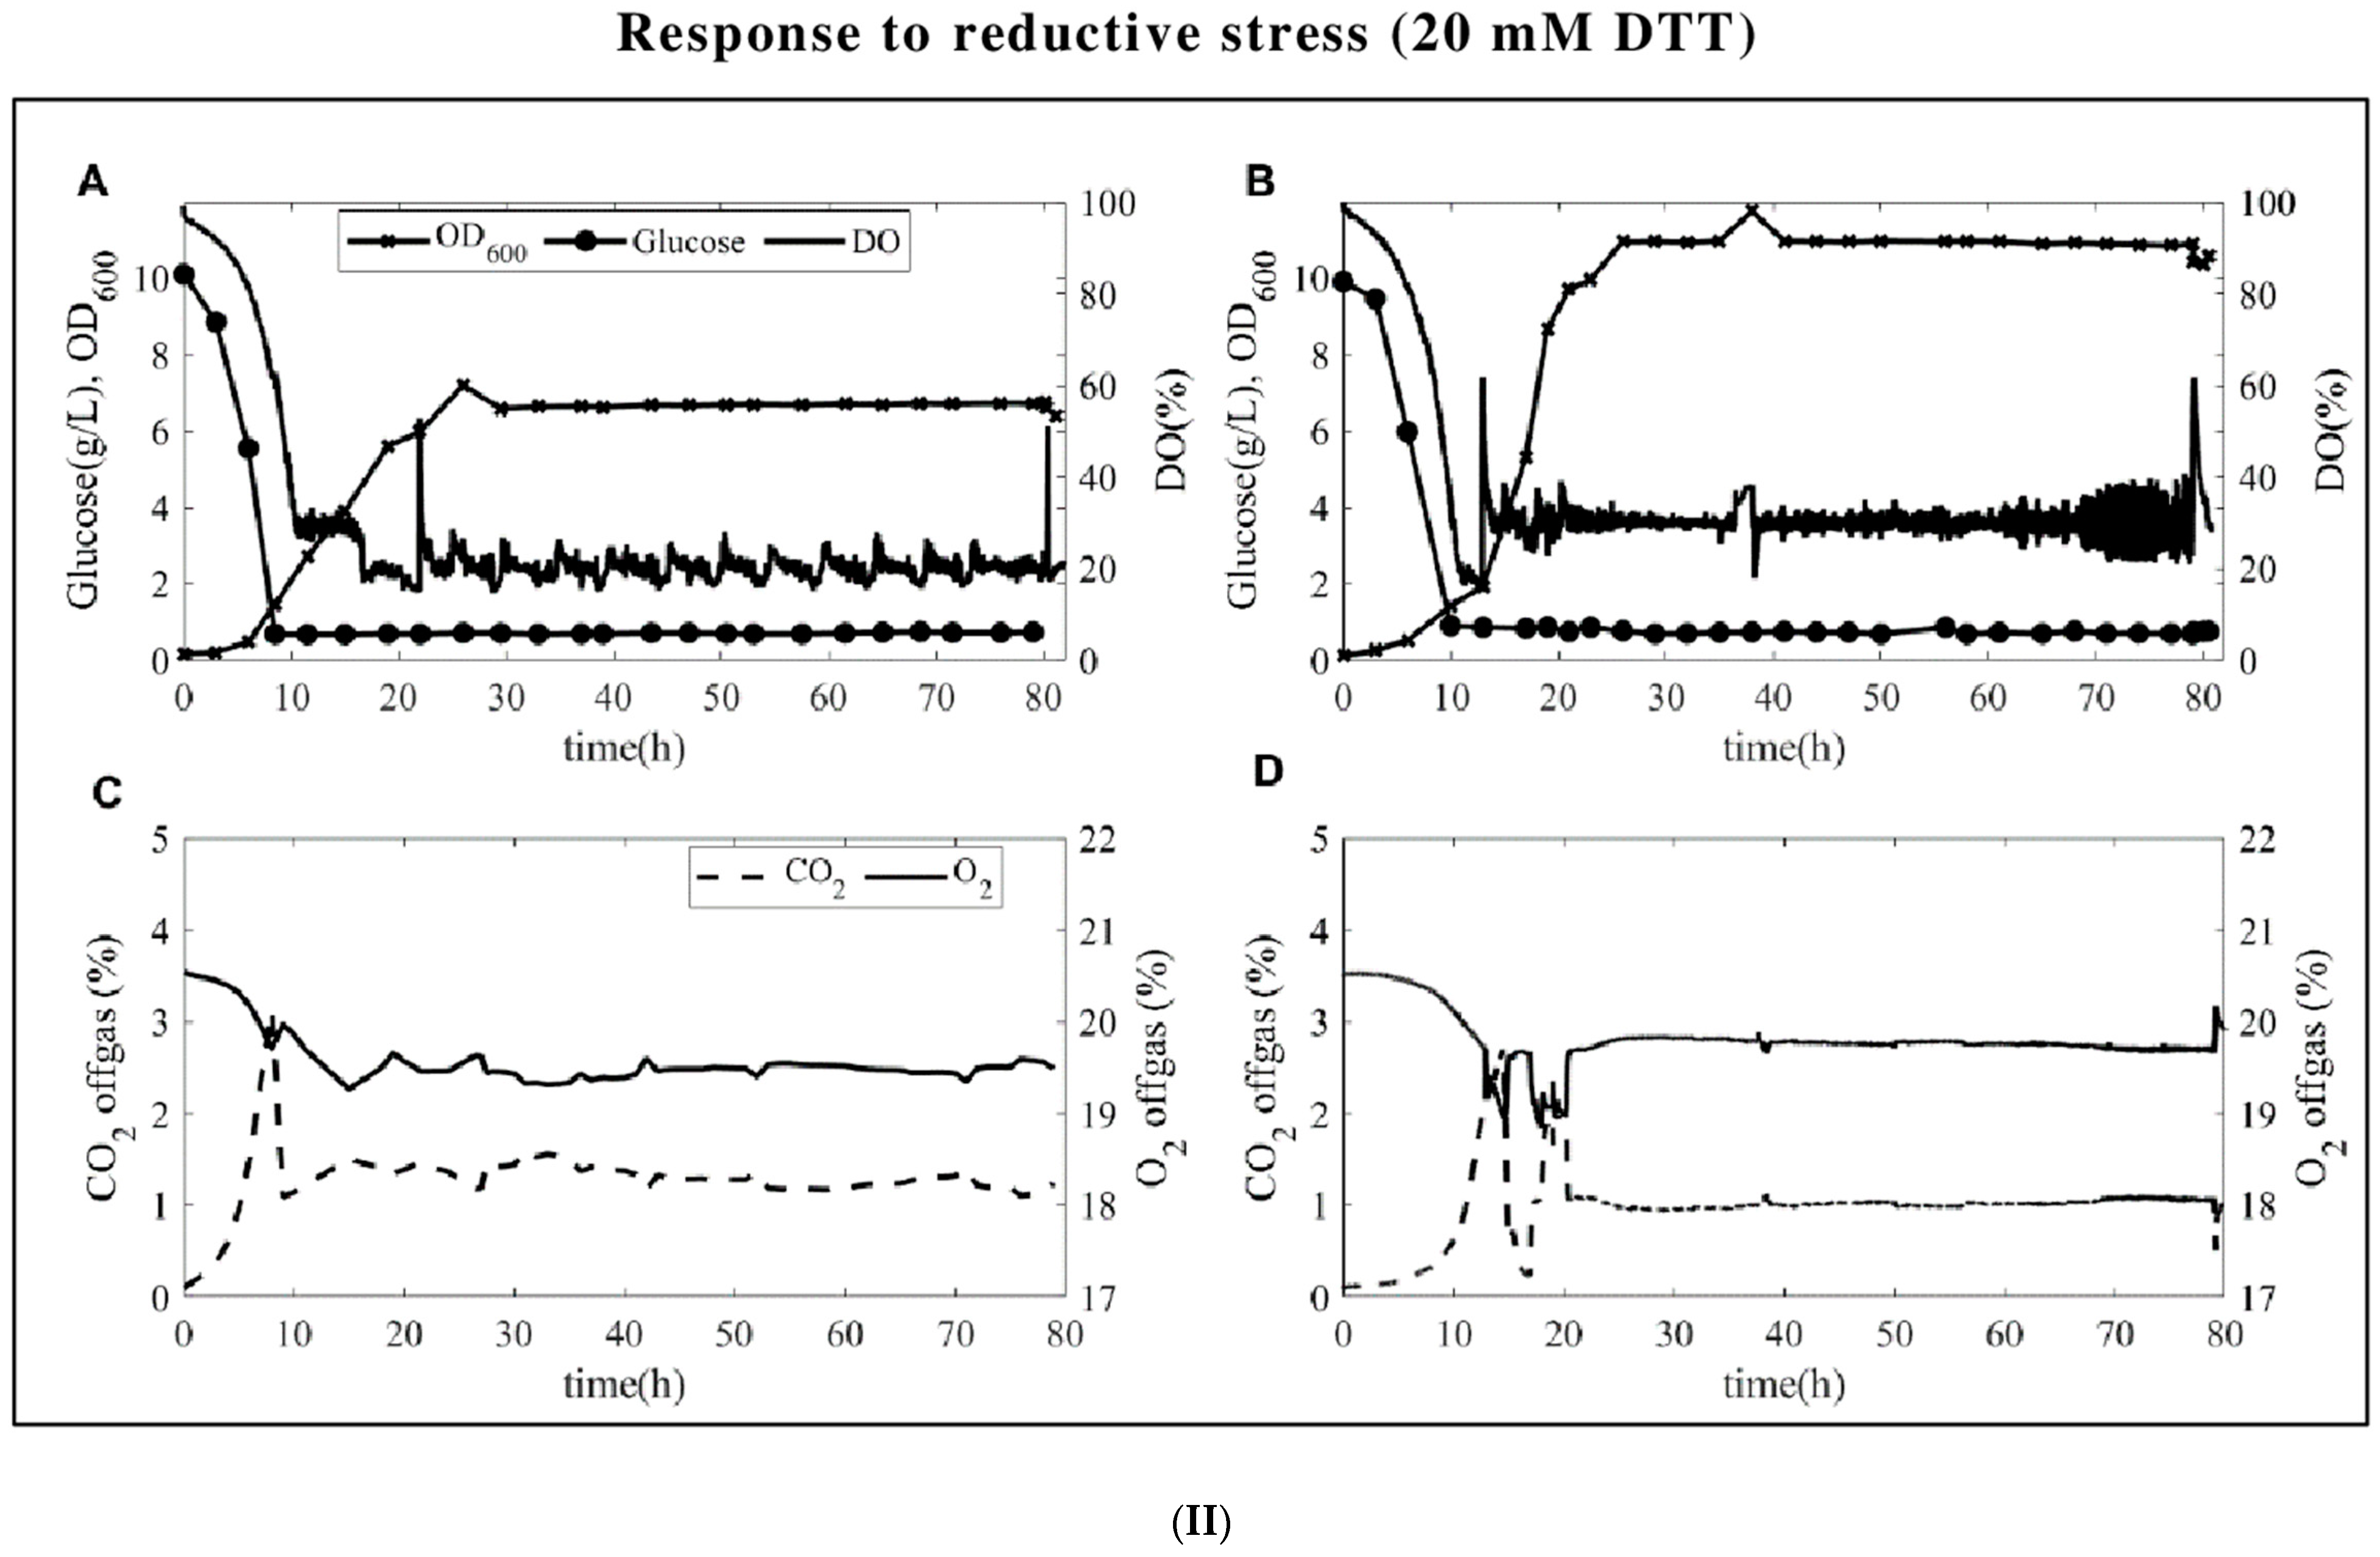
Glucose-limited chemostats were carried out at a dilution rate of 0.1 h−1 for both yeasts. The time profiles from the start of the batch until the steady state is reached are presented in Figure 1. Both yeasts have fairly stable glucose, biomass, and DO profiles. At the end of the batch phase (around the 10th hour), the CO2 level reaches around 4%, the feeding starts, and the CO2 level quickly decreases after feeding. Upon stress application, the DO levels instantaneously increase up to 300 % for H2O2 perturbation (Figure 1I) and up to 60% for DTT perturbation (Figure 1II), with the latter being attributed to the interaction of DTT with air and trace metals in the medium producing H2O2 [25]. As for the microbial physiology, due to the respiro-fermentative characteristics of S. cerevisiae, the yield of biomass on glucose is lower than the yield of biomass on glucose of P. pastoris in the batch fermentations. While P. pastoris was reported to be Crabtree-negative in earlier publications [19], low levels of ethanol were measured in our batch experiments in the presence of excess glucose in line with the recent literature [20,21] although the levels are far less than what was measured for S. cerevisiae (3–4 g/L vs. 0.5–1.5 g/L ethanol for S. cerevisiae and P. pastoris, respectively). Additionally, S. cerevisiae produces 0.3–0.5 g/L glycerol and acetate during the batch culture, while there is no detectable by-product formation carried out by P. pastoris. The biomass-specific uptake and secretion rates, as well as carbon and the degrees of reduction recoveries at a steady state, were presented in Table 1.
3.2. Amino Acid Profiling of S. cerevisiae and P. pastoris after Oxidative and Reductive Stress
Quantitative measurement of intracellular metabolite levels and their time profiles suffer from several challenges, e.g., a high level of (accumulated) noise as these typically result from a series of elaborate procedures (quenching, extraction, quantification), the high background at the steady state resulting in minimal relative changes upon perturbation, and the choice of the time-window to observe the dynamics.
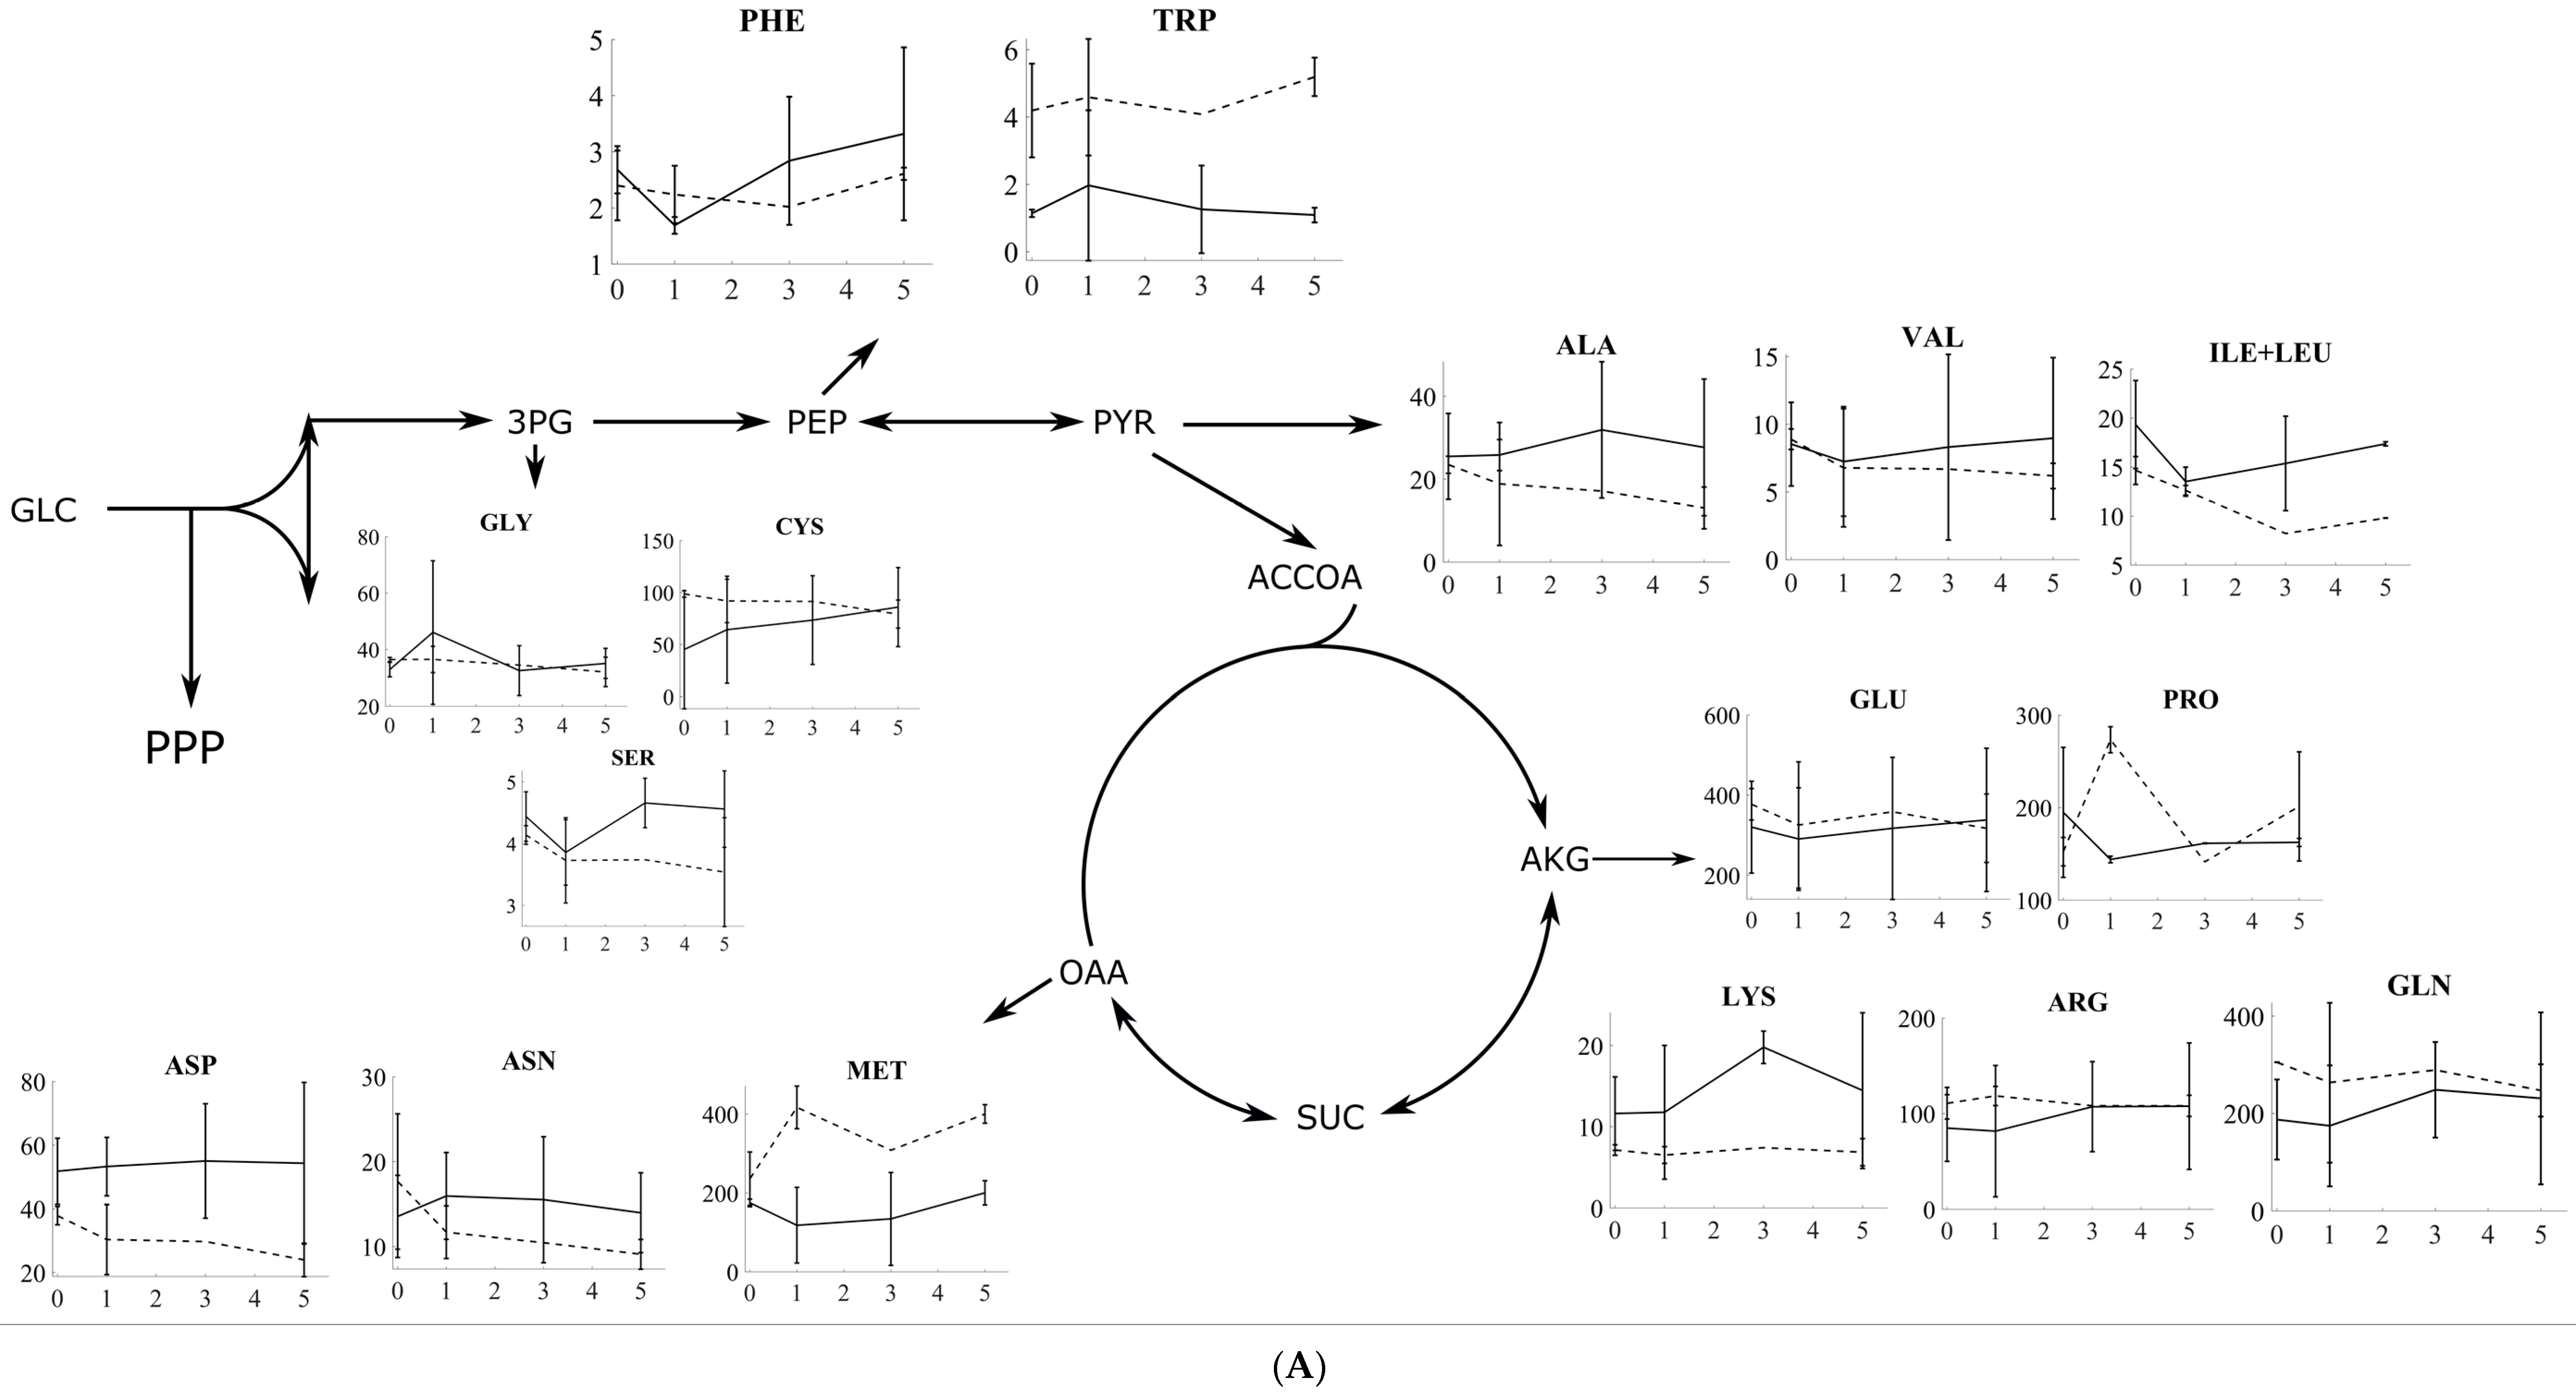
The sampling time is very important to decide since the long-term response is typically confounded with secondary effects, while the shorter term response is not enough for observing enough dynamics. Here, the intracellular concentrations of amino acids prior to and after H2O2 and DDT perturbation were measured. To decide the time of the sampling points, the turnover times of the intracellular amino acids are considered, and these vary between 30 and 500 s under similar cultivation conditions [4]. Based on this, samples were collected until 300 s following perturbation. The effect of the 5 mM H2O2-induced oxidative stress as well as the 20 mM DTT-induced reductive stress on intracellular amino acid levels is presented in µmol/gDW in Figure 2A,B for S. cerevisiae and P. pastoris, respectively, as well as in Supplementary Tables S3 and S4.
The amino acid levels at a steady state, prior to stress application, are compared to assess batch-to-batch variation and the overall quality of the data. For S. cerevisiae, the amino acid levels are well-stable and are measured from several independent chemostats. An exception to this is cysteine (Cys), as well as glycine (Gly) to a lesser extent, with both of them having a high level of batch-to-batch biological variation at a steady state. For P. pastoris, however, a handful of amino acids, i.e., cysteine (Cys), glutamate (Glu), asparagine (Asn), methionine (Met), and lysine (Lys), exhibit high batch-to-batch variation.
Overall, the levels of valine (Val), serine (Ser), and proline (Pro) followed similar decreasing profiles for the first 3 mins and increasing profiles between 3 and 5 min after oxidative stress for both yeasts. Aspartate (Asp), glutamine (Gln), methionine (Met), phenylalanine (Phe), tryptophan (Trp), and proline changed significantly after the first minute upon 5 mM H2O2-induced oxidative stress for P. pastoris. Aspartate, glutamate, phenylalanine (Phe), tryptophan, and proline levels were significantly changed after 3 and 5 min for P. pastoris. Asparagine, arginine (Arg), and glutamine levels were significantly changed after 1 and 3 min for S. cerevisiae.
As part of the response to 20 mM-DTT-induced reductive stress, tryptophane, phenylalanine, and lysine followed an increasing trend in course of 5 min as observed for S. cerevisiae. Conversely, arginine, glutamine, cysteine, alanine, aspartate, and glycine had a decreasing trend in the course of 5 min. Alanine, arginine, methionine, lysine, valine, glutamate, and serine showed a similar behavior. Also, proline, asparagine, and isoleucine+leucine (ile+leu) followed decreasing trends. Cysteine and proline are the only amino acids that follow a contradictory profile in the course of 5 min as observed for both stresses in S. cerevisiae.
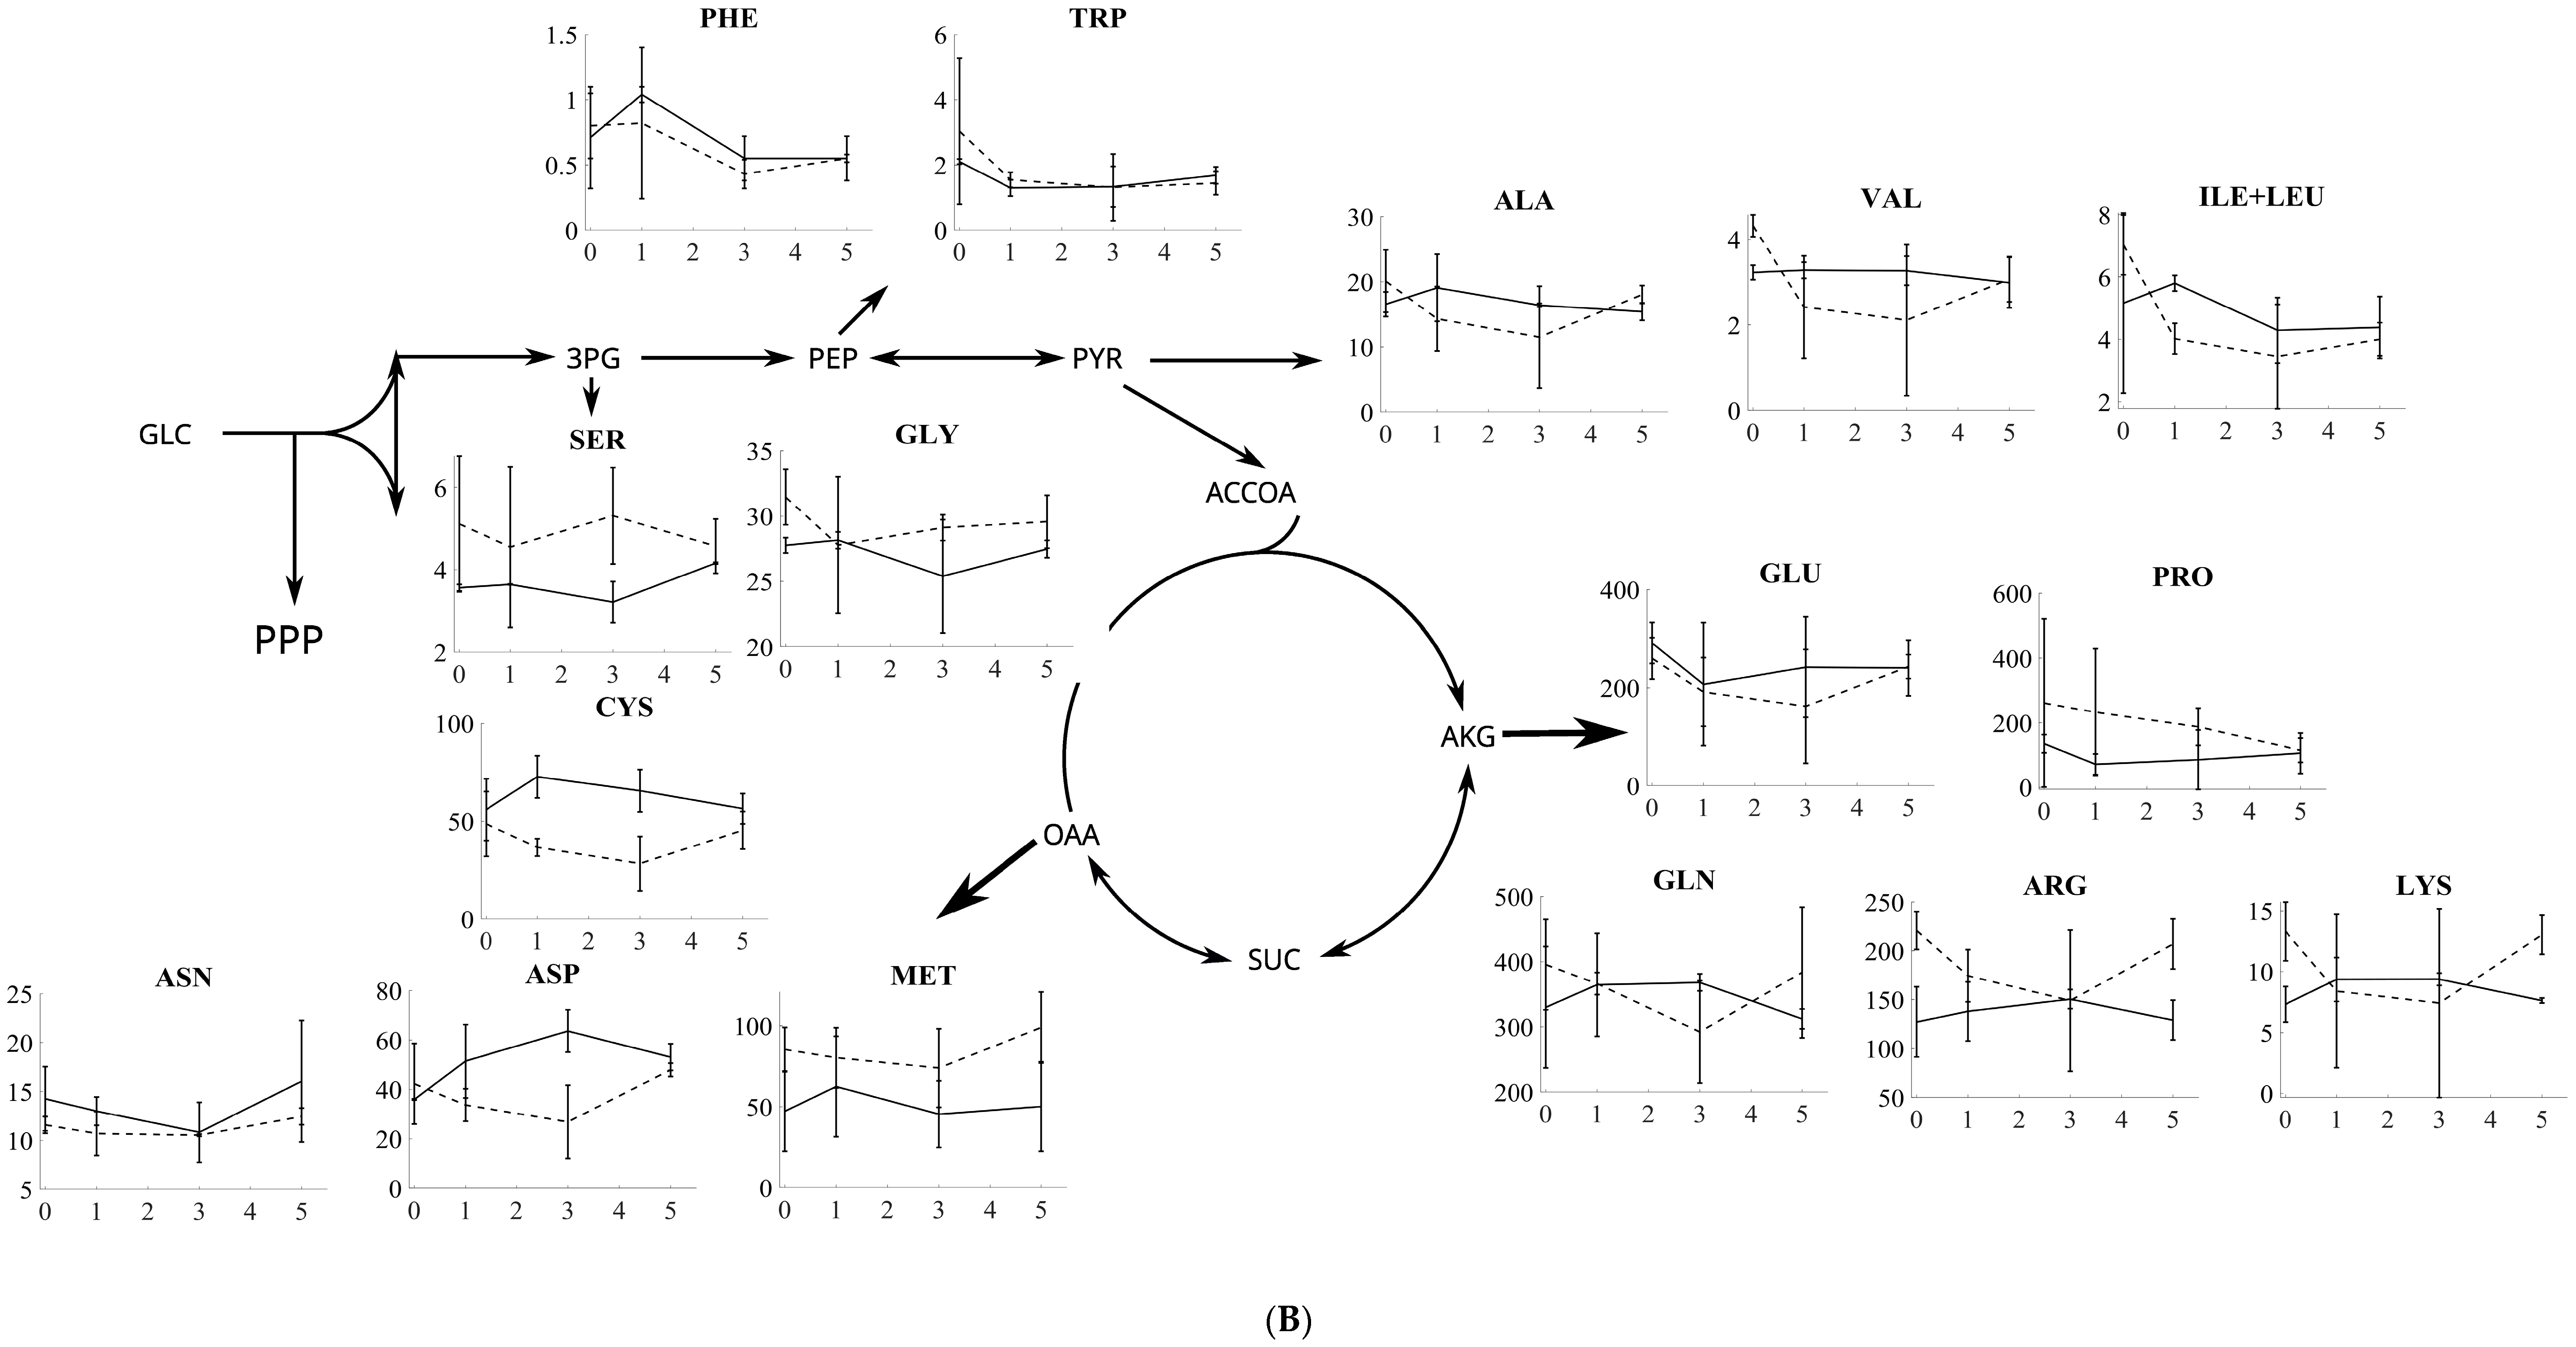
For P. pastoris, alanine, arginine, glutamine, tryptophan, and isoleucine+leucine followed similar trends that were more or less constant; aspartate, cysteine, glutamate, lysine, methionine, and valine displayed similar decreasing trends after 20 mM DTT stress. Proline followed a decreasing trend in the course of 5 min after reductive stress. Asparagine also followed more stable profiles after 20 mM-DTT stress. Serine is the only amino acid that follows a profile of decreasing, increasing, and then decreasing again in response to reductive stress. Arginine, lysine, glutamine, aspartate, cysteine, and serine have opposite profiles against oxidative and reductive stress for P. pastoris.
Earlier work on the oxidative stress response of yeasts typically focuses on the transcriptomic response to either hydrogen peroxide [26] or cumene hydroperoxide [27], while (targeted) metabolome approaches are scarcely available [28].
Sha et al. [27] focused on the early temporal transcriptional response of Saccharomyces cerevisiae to oxidative stress induced by a cumene peroxide. Interesting for that study, a considerable number of transcripts responded to the stress, thereby suggesting a highly dynamic profile for the metabolome. They also focused on glutathione, and they additionally noted that the cells respond distinctively to the two peroxides applied. Additionally, the authors noted that the genes downregulated only by cumene hydroperoxide are mainly related to the mitochondrial function. This is in qualitative agreement with our results in the sense that the levels of more than half of the amino acids from the TCA cycle (Figure 2A) decrease in the first 5 min. As for Pichia pastoris, proline, glutamate, asparagine, and tryptophan decrease in the first minute upon stress application. Inspecting differentially expressed genes in the work of Sha et al. [27], we see that amino acid-related genes are typically linked to the transport processes (permeases, transporters, etc.) and protein kinases. In a similar work by Zhao et al. [26], where the transcriptomic response to oxidative stress is measured, aminotransferases, glutamate decarboxylases, and glutamate dehydrogenases are upregulated, while several lyases are downregulated. All in all, several signaling pathways related to amino acid biosynthesis have been differentially changed, thereby contributing to the time hierarchy of the corresponding amino acids.
The work of Christodolou et al. [28] compares the stress response of E. coli, H. sapiens, and S. cerevisiae vis-à-vis their oxidative response to search for a potentially conserved mechanism related to the rapid response using metabolomic data and an ensemble kinetic modeling approach. Interestingly, common to all three species, the normally inhibited oxidative pentose phosphate pathway (PPP) gets increased pathway flux for detoxification upon stress application, and the authors name this as “reserve flux”. This concept of a reserve flux is in line with our above-discussed observations as well as the transcriptomic response measured by Sha et al. [27] of how having a pentose phosphate pathway as a reserve allows the levels of PPP-related amino acids to increase upon stress application. This is indeed what we observe for tryptophan, which does increase for S. cerevisiae.
Several precursors to amino acids have been quantified by Christodolou et al. [28]. Our work and their work can be seen as complementary since a number of precursor metabolites to amino acids have already been reported by them. Two of these are striking as follows: pyruvate and α-ketoglutarate (α-KG). For pyruvate, the levels decrease in the first two minutes before restoring back afterwards. In our work, the amino acids from pyruvate (PYR), namely valine and ile+leu, also decrease initially before restoring back after the first minute. This correlated profile points (closely) to the mass action kinetics for the corresponding biochemical reactions. Similarly, for α-KG, its level is measured as decreasing immediately after stress, as reported by Christodolou et al. [28], and the amino acids of glutamate and proline also follow a similar trend, thereby indicating clearly linear kinetics for these synthesis reactions. Lastly, 3-phosphoglycerate (3-PG) only correlates with serine among 3-PG-derived amino acids.
3.3. Glutathione Response to Oxidative and Reductive Stress
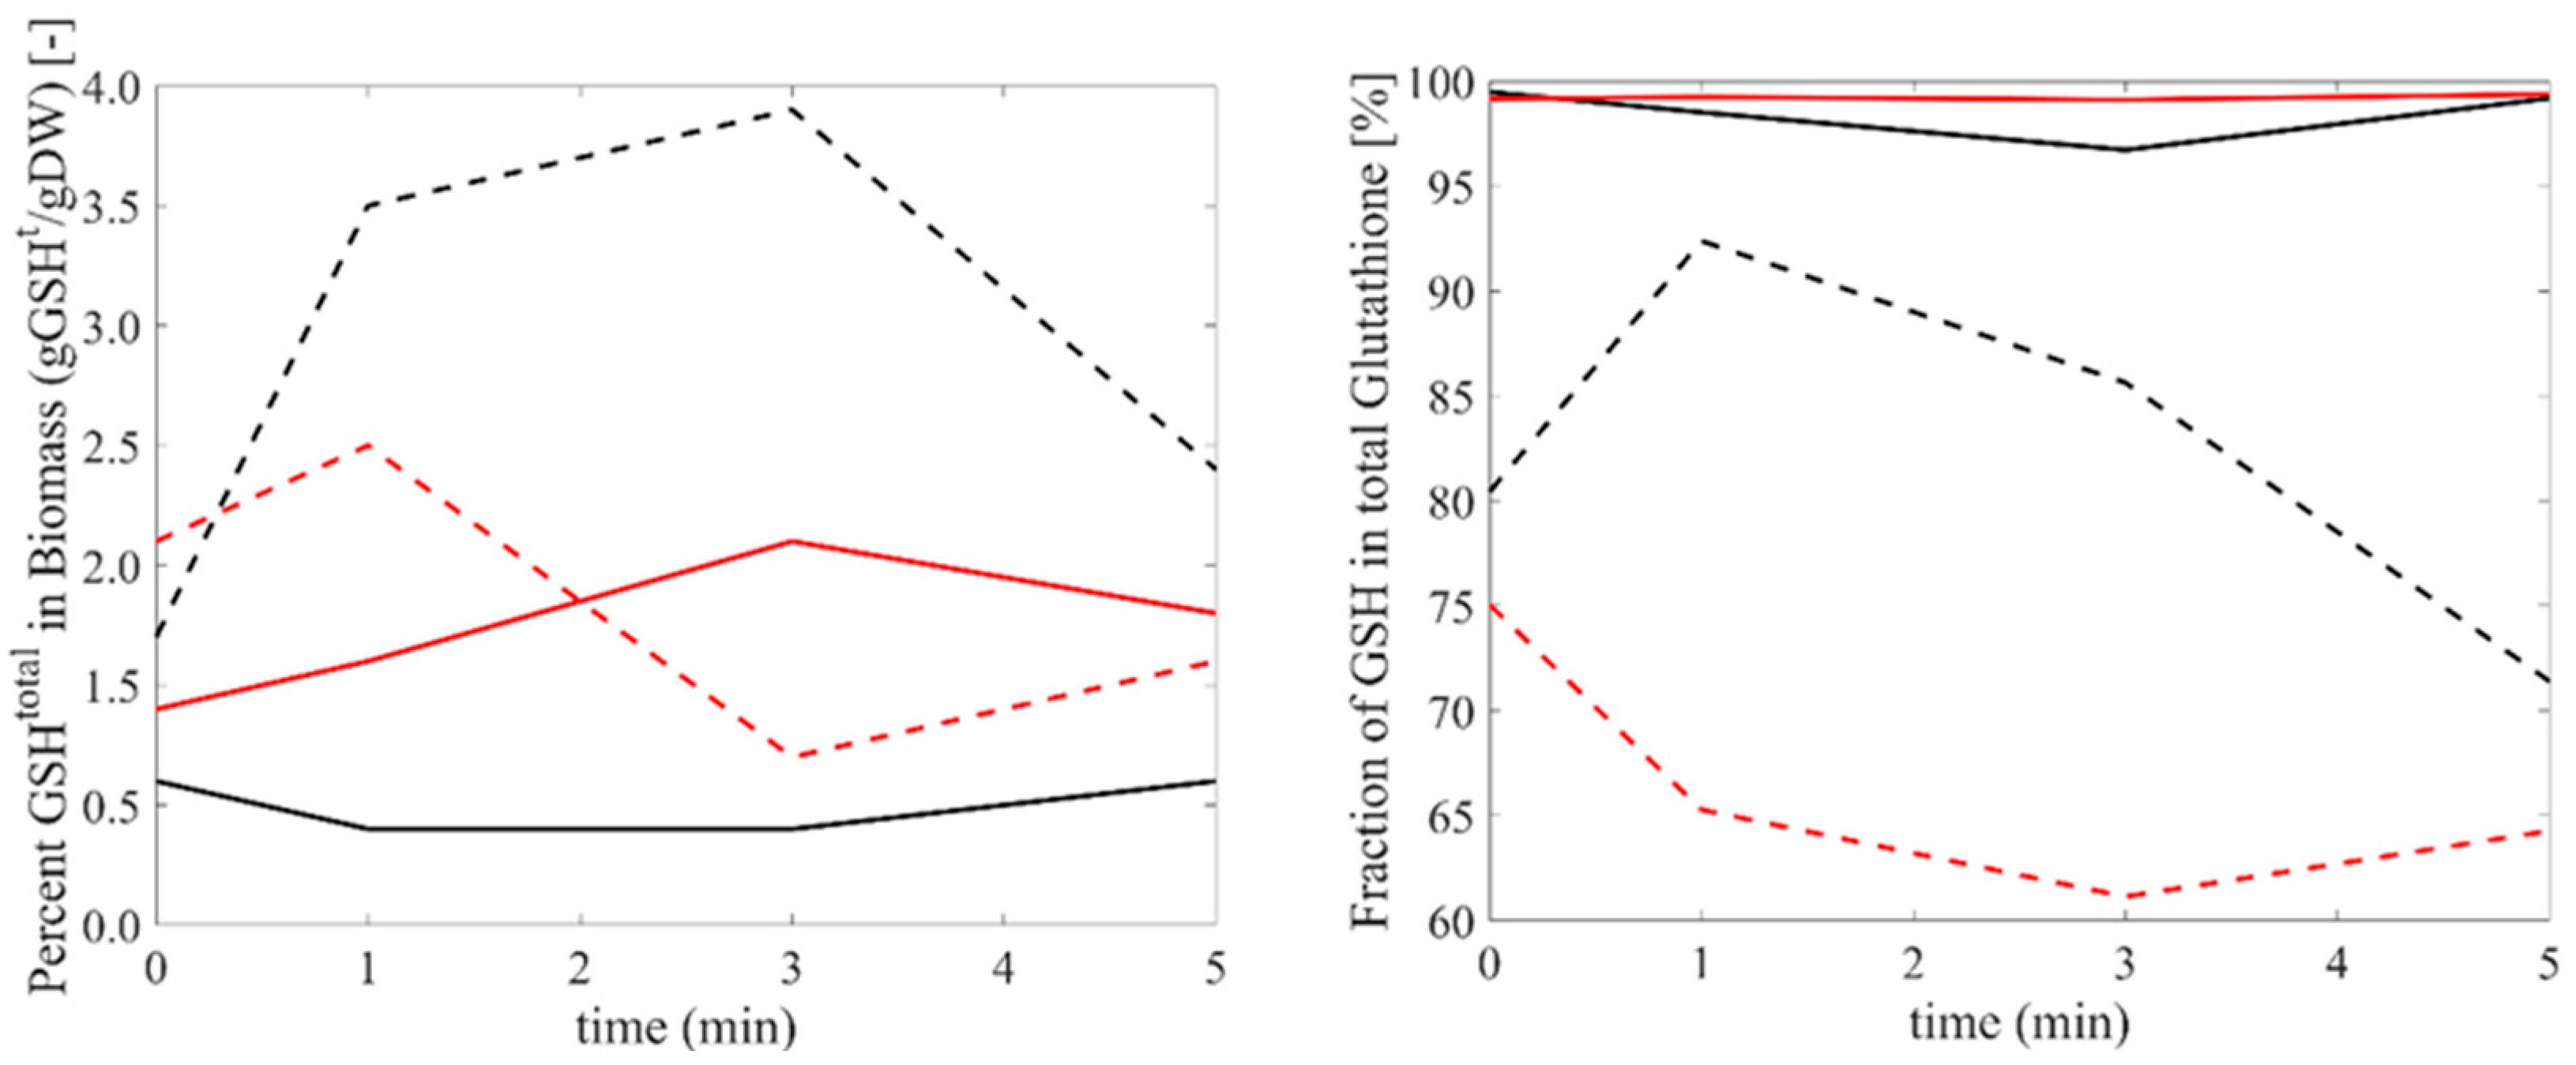
The intracellular levels of glutathione (GSH, GSSG, and total) are additionally measured upon oxidative and reductive perturbation for both yeasts (Figure 3). Although the reduced form of glutathione (GSH) is dominant in both yeasts, the reducing power (the ratio of GSH/GSSG) is far higher in Pichia pastoris (with the ratio being around 5–20 for S. cerevisiae and above 100 for P. pastoris), which might (partially) explain why P. pastoris is more resilient to oxidative stress. Interestingly, both the levels of total glutathione and the distribution among the reduced and oxidized forms change significantly in S. cerevisiae, with these changes being limited in P. pastoris. Furthermore, total glutathione response for reductive stress is almost a mirror image of the response to oxidative stress in both yeasts. The total amount of GSH first increases and then decreases for oxidative stress, but is otherwise for reductive stress, thereby indicating a distinct response of the two yeasts.
Lastly, when taken together, the time profiles of glutathione and the precursor amino acid profiles allows us to speculate on the potential bottlenecks in glutathione production in both yeasts. We speculate that the bottlenecks are different among the two as follows: both cysteine and glycine may be the bottleneck for S. cerevisiae, while a supply of glycine seems to be the bottleneck for P. pastoris, with these observations being based on the time profiles of these amino acids and GSH. This bottleneck is deduced by noting that the glutathione time profile is correlated with the time profiles of cysteine and glycine for S. cerevisiae. For P. pastoris glutathione, the time profile correlates with the glycine and glutamate time profiles. These potential targets for improved GSH production can easily be pursued, e.g., by co-feeding with corresponding amino acid(s) along with the oxidative stress as an example of a push strategy. There are various studies on supplementation, especially that of the precursor amino acids of glutathione in yeast culture media [29,30,31]. Wen et al. [32] showed that cysteine is the major limiting compound for glutathione biosynthesis. Also, a study by Wang et al. [29] and Liang et al. [33] supported how with the addition of cysteine into the culture media, the intracellular GSH concentration significantly increased. In a similar attempt, Christodolou et al. [28] measured GSH levels. Reduced GSH decreases in the first 40 s, increases until the second minute, and decreases afterwards. GSH is measured in our experiments as increasing until the first minute and then stably decreasing afterwards. The profiles are in semi-quantitative agreement after two minutes, but a seeming difference in the first two minutes points to a highly dynamic response upon stress application. It should be noted that the metabolic response to oxidative stress is not limited to glutathione but that other enzymatic mechanisms may also play a role (catalase, SODs, etc.). It is worth discussing that, as also mentioned by Zhao et al. [26], other non-enzymatic, metabolite antioxidants such as ascorbate, tocopherol, and uric acid may play roles in scavenging reactive oxygen species, which is omitted in this work as GSH is known to be dominant in both yeasts.
However, within the short time frame, we assumed that the levels of these enzymes would not substantially change. Further investigation might also include the activities of these enzymes at a steady state, even if they are constant within the time frame. Further extensions of this work may be on the untargeted quantification of entire metabolomics as well as on multi-omic approaches.
4. Conclusions
To further our understanding of the mechanism to cope with oxidative and reductive stress in yeast cells, this study provides a new dataset consisting of fermentation data and intracellular amino acid and intracellular glutathione levels for two different yeasts (S. cerevisiae and P. pastoris) at 5 mM H2O2-induced oxidative stress and 20 mM DTT-induced reductive stress. The amino acids range from 0.5 to 400 µmol/gDW. Upon oxidative stress, cysteine significantly increased (up to 90%) in S. cerevisiae and aspartate significantly increased (up to 80%) in P. pastoris. S. cerevisiae loses approximately half of its asparagine under reductive stress, while P. pastoris loses 60% of its tryptophan. Overall, it is extremely hard, if ever possible, to isolate the effect of both stresses in a single-omic layer or a single pathway, and when also considering the metabolic reaction networks, it affects the NAD/NADH balance and thereby numerous redox reactions. The data presented in this work point to the kinetics of amino acid production pathways as well as to potential bottlenecks in glutathione production pathways. Departing from the results of earlier studies discussed by presenting additional metabolome data under comparable conditions, the results presented here are still far from depicting the entire multi-omic landscape. Rather, this work constitutes a stepping stone for further quantitative study on metabolomics with a systems biology approach.
Supplementary Materials
The following supporting information can be downloaded at: https://www.mdpi.com/article/10.3390/fermentation10030166/s1. A supplementary spreadsheet file is provided as a supplementary file. Table S1: Ingredients of Vitamin solution and Trace elements for Verduyn Medium; Table S2: The amino acid standards used as an external calibration for HPLC; Table S3: The effect of 5 mM H2O2-induced oxidative stress as well as 20 mM DTT-induced reductive stress on intracellular amino acid levels is presented in µmol/gDW for S. cerevisiae; Table S4: The effect of 5 mM H2O2-induced oxidative stress as well as 20 mM DTT-induced reductive stress on intracellular amino acid levels is presented in µmol/gDW P. pastoris.
Author Contributions
Conceptualization, B.Ş.K. and E.N.; methodology, B.Ş.K.; formal analysis, B.Ş.K. and E.N.; investigation, B.Ş.K.; writing—review and editing, B.Ş.K. and E.N.; supervision, E.N.; project administration, B.Ş.K.; funding acquisition, E.N. All authors have read and agreed to the published version of the manuscript.
Funding
This research was funded by Ministry of Agriculture and Forestry, grant number TAGEM-18/AR-GE/26.
Institutional Review Board Statement
Not applicable.
Informed Consent Statement
Not applicable.
Data Availability Statement
All data used in this study are shared in the main article.
Acknowledgments
The financial support for Burcu Şirin through the TÜBİTAK 2211C Program (1649B03) is gratefully acknowledged.
Conflicts of Interest
The authors declare no conflicts of interest.
References
- Mashego, M.R.; van Gulik, W.M.; Vinke, J.L.; Visser, D.; Heijnen, J.J. In Vivo Kinetics with Rapid Perturbation Experiments in Saccharomyces Cerevisiae Using a Second-Generation BioScope. Metab. Eng. 2006, 8, 370–383. [Google Scholar] [CrossRef] [PubMed]
- Canelas, A.B.; Ten Pierick, A.; Ras, C.; Seifar, R.M.; Van Dam, J.C.; Van Gulik, W.M.; Heijnen, J.J. Quantitative Evaluation of Intracellular Metabolite Extraction Techniques for Yeast Metabolomics. Anal. Chem. 2009, 81, 7379–7389. [Google Scholar] [CrossRef] [PubMed]
- Nikerel, I.E.; Canelas, A.B.; Jol, S.J.; Verheijen, P.J.T.; Heijnen, J.J. Construction of Kinetic Models for Metabolic Reaction Networks: Lessons Learned in Analysing Short-Term Stimulus Response Data. Math. Comput. Model. Dyn. Syst. 2011, 17, 243–260. [Google Scholar] [CrossRef]
- Nikerel, I.E.; Verheijen, P.J.T.; van Gulik, W.M.; Heijnen, J.J. Model-Based Design of Superior Cell Factory: An Illustrative Example of Penicillium Chrysogenum. In Systems Metabolic Engineering; Springer: Dordrecht, The Netherlands, 2012; pp. 221–270. [Google Scholar]
- Nikerel, I.E. Managing Complexity of Cellular Systems: Theoretical Tools for Dynamic Modeling of Metabolic Reaction Networks. Ph.D. Thesis, Delft University of Technology, Delft, The Netherlands, 2009; 231p. [Google Scholar]
- Kresnowati, M.T.A.P.; Suarez-Mendez, C.M.; van Winden, W.A.; van Gulik, W.M.; Heijnen, J.J. Quantitative Physiological Study of the Fast Dynamics in the Intracellular pH of Saccharomyces Cerevisiae in Response to Glucose and Ethanol Pulses. Metab. Eng. 2008, 10, 39–54. [Google Scholar] [CrossRef] [PubMed]
- Baumann, K.; Carnicer, M.; Dragosits, M.; Graf, A.B.; Stadlmann, J.; Jouhten, P.; Maaheimo, H.; Gasser, B.; Albiol, J.; Mattanovich, D.; et al. A Multi-Level Study of Recombinant Pichia Pastoris in Different Oxygen Conditions. BMC Syst. Biol. 2010, 4, 141. [Google Scholar] [CrossRef]
- Diezmann, S. Oxidative Stress Response and Adaptation to H2O2 in the Model Eukaryote Saccharomyces Cerevisiae and Its Human Pathogenic Relatives Candida Albicans and Candida Glabrata. Fungal Biol. Rev. 2014, 28, 126–136. [Google Scholar] [CrossRef]
- Korge, P.; Calmettes, G.; Weiss, J.N. Increased Reactive Oxygen Species Production during Reductive Stress: The Roles of Mitochondrial Glutathione and Thioredoxin Reductases. Biochim. Biophys. Acta Bioenerg. 2015, 1847, 514–525. [Google Scholar] [CrossRef]
- Gasch, A.; Spellman, P. Genomic Expression Programs in the Response of Yeast Cells to Environmental Changes. Mol. Biol. Cell 2000, 11, 4241–4257. [Google Scholar] [CrossRef]
- Kurylenko, O.O.; Dmytruk, K.V.; Sibirny, A. Glutathione Metabolism in Yeasts and Construction of the Advanced Producers of This Tripeptide; Springer: Cham, Switzerland, 2019; ISBN 9783030211103. [Google Scholar]
- Chen, Y.; Yang, X.; Zhang, S.; Wang, X.; Guo, C.; Guo, X.; Xiao, D. Development of Saccharomyces Cerevisiae Producing Higher Levels of Sulfur Dioxide and Glutathione to Improve Beer Flavor Stability. Appl. Biochem. Biotechnol. 2012, 166, 402–413. [Google Scholar] [CrossRef]
- Schmacht, M.; Lorenz, E.; Senz, M. Microbial Production of Glutathione. World J. Microbiol. Biotechnol. 2017, 33, 106. [Google Scholar] [CrossRef] [PubMed]
- Lin, N.X.; He, R.Z.; Xu, Y.; Yu, X.W. Oxidative Stress Tolerance Contributes to Heterologous Protein Production in Pichia Pastoris. Biotechnol. Biofuels 2021, 14, 160. [Google Scholar] [CrossRef] [PubMed]
- Pan, Y.; Cheng, J.H.; Sun, D.W. Metabolomic Analyses on Microbial Primary and Secondary Oxidative Stress Responses. Compr. Rev. Food Sci. Food Saf. 2021, 20, 5675–5697. [Google Scholar] [CrossRef] [PubMed]
- Verduyn, C.; Postma, E.; Scheffers, W.A.; Van Dijken, J.P. Effect of Benzoic Acid on Metabolic Fluxes in Yeasts: A Continuous-culture Study on the Regulation of Respiration and Alcoholic Fermentation. Yeast 1992, 8, 501–517. [Google Scholar] [CrossRef] [PubMed]
- Lange, H.C.; Heijnen, J.J. Statistical Reconciliation of the Elemental and Molecular Biomass Composition of Saccharomyces Cerevisiae. Biotechnol. Bioeng. 2001, 75, 334–344. [Google Scholar] [CrossRef] [PubMed]
- Lange, H.C.; Eman, M.; Van Zuijlen, G.; Visser, D.; Van Dam, J.C.; Frank, J.; De Teixeira Mattos, M.J.; Heijnen, J.J. Improved Rapid Sampling for in Vivo Kinetics of Intracellular Metabolites in Saccharomyces Cerevisiae. Biotechnol. Bioeng. 2001, 75, 406–415. [Google Scholar] [CrossRef] [PubMed]
- Miller, G.L. Use of Dinitrosalicylic Acid Reagent for Determination of Reducing Sugar. Anal. Chem. 1959, 31, 426–428. [Google Scholar] [CrossRef]
- Pudlik, A.M.; Lolkema, J.S. Rerouting Citrate Metabolism in Lactococcus Lactis to Citrate-Driven Transamination. Appl. Environ. Microbiol. 2012, 78, 6665–6673. [Google Scholar] [CrossRef]
- Rollini, M.; Manzoni, M. Influence of Different Fermentation Parameters on Glutathione Volumetric Productivity by Saccharomyces Cerevisiae. Process Biochem. 2006, 41, 1501–1505. [Google Scholar] [CrossRef]
- Carnicer, M.; Ten Pierick, A.; Van Dam, J.; Heijnen, J.J.; Albiol, J.; Van Gulik, W.; Ferrer, P. Quantitative Metabolomics Analysis of Amino Acid Metabolism in Recombinant Pichia Pastoris under Different Oxygen Availability Conditions. Microb. Cell Fact. 2012, 11, 83. [Google Scholar] [CrossRef]
- van der Hijden, R.T.J.M.; Heijnen, J.J.; Hellinga, C.; Romein, B.; Luyben, K.C.A.M. Linear Constrain Relations in Biochemical Reaction Systems: I. Classification of the Calculability and the Balanceability of Conversion Rates. Biotechnol. Bioeng. 1994, 43, 3–10. [Google Scholar] [CrossRef]
- Trotter, E.W.; Grant, C.M. Thioredoxins Are Required for Protection against a Reductive Stress in the Yeast Saccharomyces Cerevisiae. Mol. Microbiol. 2002, 46, 869–878. [Google Scholar] [CrossRef] [PubMed]
- Netto, L.E.S.; Stadtman, E.R. The Iron-Catalyzed Oxidation of Dithiothreitol Is a Biphasic Process: Hydrogen Peroxide Is Involved in the Initiation of a Free Radical Chain of Reactions. Arch. Biochem. Biophys. 1996, 333, 233–242. [Google Scholar] [CrossRef] [PubMed]
- Zhao, H.; Chen, J.; Liu, J.; Han, B. Transcriptome Analysis Reveals the Oxidative Stress Response in Saccharomyces Cerevisiae. RSC Adv. 2015, 5, 22923–22934. [Google Scholar] [CrossRef]
- Sha, W.; Martins, A.M.; Laubenbacher, R.; Mendes, P.; Shulaev, V. The Genome-Wide Early Temporal Response of Saccharomyces Cerevisiae to Oxidative Stress Induced by Cumene Hydroperoxide. PLoS ONE 2013, 8, e74939. [Google Scholar] [CrossRef]
- Christodoulou, D.; Kuehne, A.; Estermann, A.; Fuhrer, T.; Lang, P.; Sauer, U. Reserve Flux Capacity in the Pentose Phosphate Pathway by NADPH Binding Is Conserved across Kingdoms. iScience 2019, 19, 1133–1144. [Google Scholar] [CrossRef]
- Wang, B.; Liang, G.; Zhou, Q.; Xie, J.; Mo, Y. Combined Amino Acids Modulation with H2O2 Stress for Glutathione Overproduction in Candida Utilis. Afr. J. Biotechnol. 2010, 9, 5399–5406. [Google Scholar]
- Wei, G.Y.; Wang, D.H.; Chen, J. Overproduction of Glutathione by L-Cysteine Addition and a Temperature-Shift Strategy. Biotechnol. Bioprocess. Eng. 2008, 13, 347–353. [Google Scholar] [CrossRef]
- Wang, Z.; Tan, T.; Song, J. Effect of Amino Acids Addition and Feedback Control Strategies on the High-Cell-Density Cultivation of Saccharomyces Cerevisiae for Glutathione Production. Process Biochem. 2007, 42, 108–111. [Google Scholar] [CrossRef]
- Wen, S.; Zhang, T.; Tan, T. Maximizing Production of Glutathione by Amino Acid Modulation and High-Cell-Density Fed-Batch Culture of Saccharomyces Cerevisiae. Process Biochem. 2006, 41, 2424–2428. [Google Scholar] [CrossRef]
- Liang, G.B.; Du, G.C.; Chen, J. A Novel Strategy of Enhanced Glutathione Production in High Cell Density Cultivation of Candida Utilis-Cysteine Addition Combined with Dissolved Oxygen Controlling. Enzym. Microb. Technol. 2008, 42, 284–289. [Google Scholar] [CrossRef]
Figure 1.
(I). Glucose, biomass, and dissolved oxygen levels (DO(%)) observed for oxidative stresses (top panel (I)) and reductive (bottom panel (II)) stresses. (A) S. cerevisiae, (B) P. pastoris, off-gas measurements of (C) S. cerevisiae, and (D) P. pastoris during chemostat cultures are in each panel. The feeding started right around the CO2 peak, which was around the 9th hour for S. cerevisiae and around the 12th hour for P. pastoris.


Figure 2.
(A) The amino acid response to oxidative and reductive stress for S. cerevisiae. The amino acids are grouped according to the metabolite in the central carbon metabolism from which they are produced. In each plot, solid lines represent the response to oxidative stress, while dashed lines represent the response to reductive stress, with the y-axis in each plot being the intracellular concentration in µmol/gDW and the x-axis being the time in minutes. (B) The amino acid response to oxidative and reductive stress for P. pastoris (bottom panel). The amino acids are grouped according to the metabolite in the central carbon metabolism from which these are produced. In each plot, solid lines represent the response to oxidative stress, while dashed lines represent the response to reductive stress, with the y-axis in each plot being the intracellular concentration in µmol/gDW and the x-axis being the time in minutes.


Figure 3.
The change in the biomass of total glutathione (left panel) as well as the fraction of the reduced form (GSH) (right panel) as a function of reductive (red) and oxidative (black) stresses for both yeasts (S. cerevisiae, dashed lines; P. pastoris, solid lines).
Figure 3.
The change in the biomass of total glutathione (left panel) as well as the fraction of the reduced form (GSH) (right panel) as a function of reductive (red) and oxidative (black) stresses for both yeasts (S. cerevisiae, dashed lines; P. pastoris, solid lines).


Table 1.
Steady-state data for aerobic glucose-limited S. cerevisiae and P. pastoris chemostat cultures, with D = 0.1 h−1. The q-rates are given in mmol DCW−1 h−1, and the recoveries are given in percentages.
Table 1.
Steady-state data for aerobic glucose-limited S. cerevisiae and P. pastoris chemostat cultures, with D = 0.1 h−1. The q-rates are given in mmol DCW−1 h−1, and the recoveries are given in percentages.
| Measured (Unbalanced) Specific Rates | ||||||
|---|---|---|---|---|---|---|
| - | - | C-Recovery | DoR-Recovery | |||
| S. cerevisiae | 1.046 ± 0.001 | 3.847 ± 0.004 | 2.450 ± 0.022 | 2.274 ± 0.029 | 100 ± 0.00 | 100 ± 0.01 |
| P. pastoris | 0.848 ± 0.010 | 3.713 ± 0.019 | 1.633 ± 0.081 | 1.438 ± 0.167 | 104 ± 0.01 | 104 ± 0.04 |
All the experimental data contain the average values of the biomass-specific rates and the % for recovery values of six chemostats prior to perturbation.
Disclaimer/Publisher’s Note: The statements, opinions and data contained in all publications are solely those of the individual author(s) and contributor(s) and not of MDPI and/or the editor(s). MDPI and/or the editor(s) disclaim responsibility for any injury to people or property resulting from any ideas, methods, instructions or products referred to in the content. |
© 2024 by the authors. Licensee MDPI, Basel, Switzerland. This article is an open access article distributed under the terms and conditions of the Creative Commons Attribution (CC BY) license (https://creativecommons.org/licenses/by/4.0/).
Share and Cite
MDPI and ACS Style
Şirin Kaya, B.; Nikerel, E. Distinct Short-Term Response of Intracellular Amino Acids in Saccharomyces cerevisiae and Pichia pastoris to Oxidative and Reductive Stress. Fermentation 2024, 10, 166. https://doi.org/10.3390/fermentation10030166
AMA Style
Şirin Kaya B, Nikerel E. Distinct Short-Term Response of Intracellular Amino Acids in Saccharomyces cerevisiae and Pichia pastoris to Oxidative and Reductive Stress. Fermentation. 2024; 10(3):166. https://doi.org/10.3390/fermentation10030166
Chicago/Turabian StyleŞirin Kaya, Burcu, and Emrah Nikerel. 2024. "Distinct Short-Term Response of Intracellular Amino Acids in Saccharomyces cerevisiae and Pichia pastoris to Oxidative and Reductive Stress" Fermentation 10, no. 3: 166. https://doi.org/10.3390/fermentation10030166
Note that from the first issue of 2016, this journal uses article numbers instead of page numbers. See further details here.