Article

Multi-Omics Analysis of the Co-Regulation of Wood Alcohol Accumulation in Baijiu Fermentation

1
Key Laboratory of Carbohydrate Chemistry and Biotechnology, Ministry of Education, School of Biotechnology, Jiangnan University, Wuxi 214122, China
2
Science Center for Future Foods, Jiangnan University, Wuxi 214122, China
3
Kweichow Moutai Co., Ltd., Renhuai 564501, China
4
Guizhou Key Laboratory of Microbial Resources Exploration in Fermentation Industry, Kweichow Moutai Group, Zunyi 564501, China
*
Author to whom correspondence should be addressed.
These authors contributed equally to this work.
Fermentation 2024, 10(4), 175; https://doi.org/10.3390/fermentation10040175
Submission received: 7 February 2024 / Revised: 29 February 2024 / Accepted: 5 March 2024 / Published: 22 March 2024
(This article belongs to the Special Issue Advances in Beverages, Food, Yeast and Brewing Research, 3rd Edition)

Abstract

:
Methanol, also known as wood alcohol, is a common hazardous by-product of alcoholic beverage fermentation and serves as a crucial indicator for assessing the safety of alcoholic beverages. However, the metabolic mechanisms of methanol production during the solid-state fermentation of Chinese Baijiu remain unclear. In this study, we sought to determine the primary stage of methanol production in Chinese Baijiu by measuring the methanol content at different stages of fermentation. High-throughput multi-omics sequencing techniques were employed to elucidate methanol metabolic pathways and associated microorganisms. In addition, a comprehensive analysis incorporating environmental factors and microbial interactions was conducted to explore their combined effects on methanol production. Methanol was predominantly produced during pit fermentation, with the most significant increase observed within the first seven days. Microorganisms such as Pichia kudriavzevii, Byssochlamys spectabilis, Penicillium, and Aspergillus played a regulatory role in methanol content during the first seven days through their involvement in butyrate and methane metabolic pathways and pectin degradation modules. During Baijiu production, various types of molds and yeasts participate in methanol production. Differences in their abundance within fermentation cycles may contribute to variations in methanol content between stages. Lactobacillus accumulated abundantly in the first seven days in each stage, suppressing methanol-metabolizing microorganisms. In addition, the increased acidity resulting from Lactobacillus metabolism may indirectly promote methanol generation.

1. Introduction

Methanol, also known as wood alcohol, is a harmful substance that is generated during the fermentation of alcoholic beverages. Its consumption can lead to neurodegeneration and exert a paralytic effect on the blood vessels. The inadvertent consumption of methanol or beverages containing excessive amounts of methanol can result in blindness, liver disease, and even death [1,2]. Countries worldwide have strict regulations on the methanol content in alcoholic beverages [3]. Therefore, a clear understanding of the mechanisms and factors influencing methanol production during Baijiu fermentation is essential for controlling its methanol content and ensuring the safety of Baijiu consumption.
Previous studies indicated that methanol production in alcoholic beverages primarily stems from the breakdown of pectin [4]. Pectin, which consists mainly of methyl-esterified polygalacturonic acid, is a heterogeneous and acidic polysaccharide with high molecular weight [5]. It is a major component of grains, vegetables, fruits, and fiber [6]. Pectin breaks down into methanol under high-temperature treatment, or its production is catalyzed by pectinesterase [7]. Previous studies on fruit wine production explored various aspects of the process, including the types of yeast used for brewing, possible contaminants that may be present [8], pectinase types and activity [9,10], and environmental factors [11] related to methanol production through the pectin pathway. Contrary to the commonly used single-strain liquid fermentation for fruit wine production, Chinese Baijiu production employs a multicycle solid-state fermentation process [12] (Figure 1) involving more complex substances, biological interactions, and variations [13,14]. The mechanisms of methanol production may differ in this context; however, research related to this topic is currently unavailable.
High-throughput sequencing technologies have been widely applied in microbial studies of the Baijiu fermentation processes. Amplicon sequencing can analyze microbial community structure and succession [15], whereas metagenomic sequencing can delve deeper into the distribution and expression of microbial functional genes in the community, determining the role of each microorganism in the community [16]. By detecting various physicochemical indicators such as flavor substances and environmental factors, correlation analysis can establish connections between environmental factors, microbial communities, and the substances under study [17,18].
In this study, we first determined the methanol content in fermented grains during the two major fermentation processes leading to Baijiu production, heap and pit fermentation, to identify the main stage at which methanol production occurs. Subsequently, metagenomic and metatranscriptomic sequencing was performed on the fermented grains at different time points during pit fermentation in the first stage, followed by species and functional annotation to construct the methanol metabolic pathway and identify the microorganisms involved in methanol metabolism. Finally, the detection of six environmental factors,16S rRNA amplicon sequencing, and Internal Transcribed Spacer (ITS) amplicon sequencing were performed on the fermented grains at different time points during pit fermentation in all stages. A redundancy analysis was used to observe the effects of environmental factors on the microbial community. Various statistical methods have been employed to investigate the microbial communities that may affect methanol content. Partial least squares path modeling (PLS-PM) was used to explore the influence of environmental factors and microorganisms on the methanol content in the main production cycle.
This study elucidated the methanol accumulation patterns during Baijiu fermentation. Additionally, it we explored the pathways of methanol accumulation, the microorganisms involved, and the environmental factors influencing methanol accumulation based on multi-omics analysis. This study provides a partial theoretical basis for guiding the regulation of methanol metabolism and controlling the methanol content during Baijiu fermentation, thereby contributing to the safety of Baijiu consumption.

2. Materials and Methods

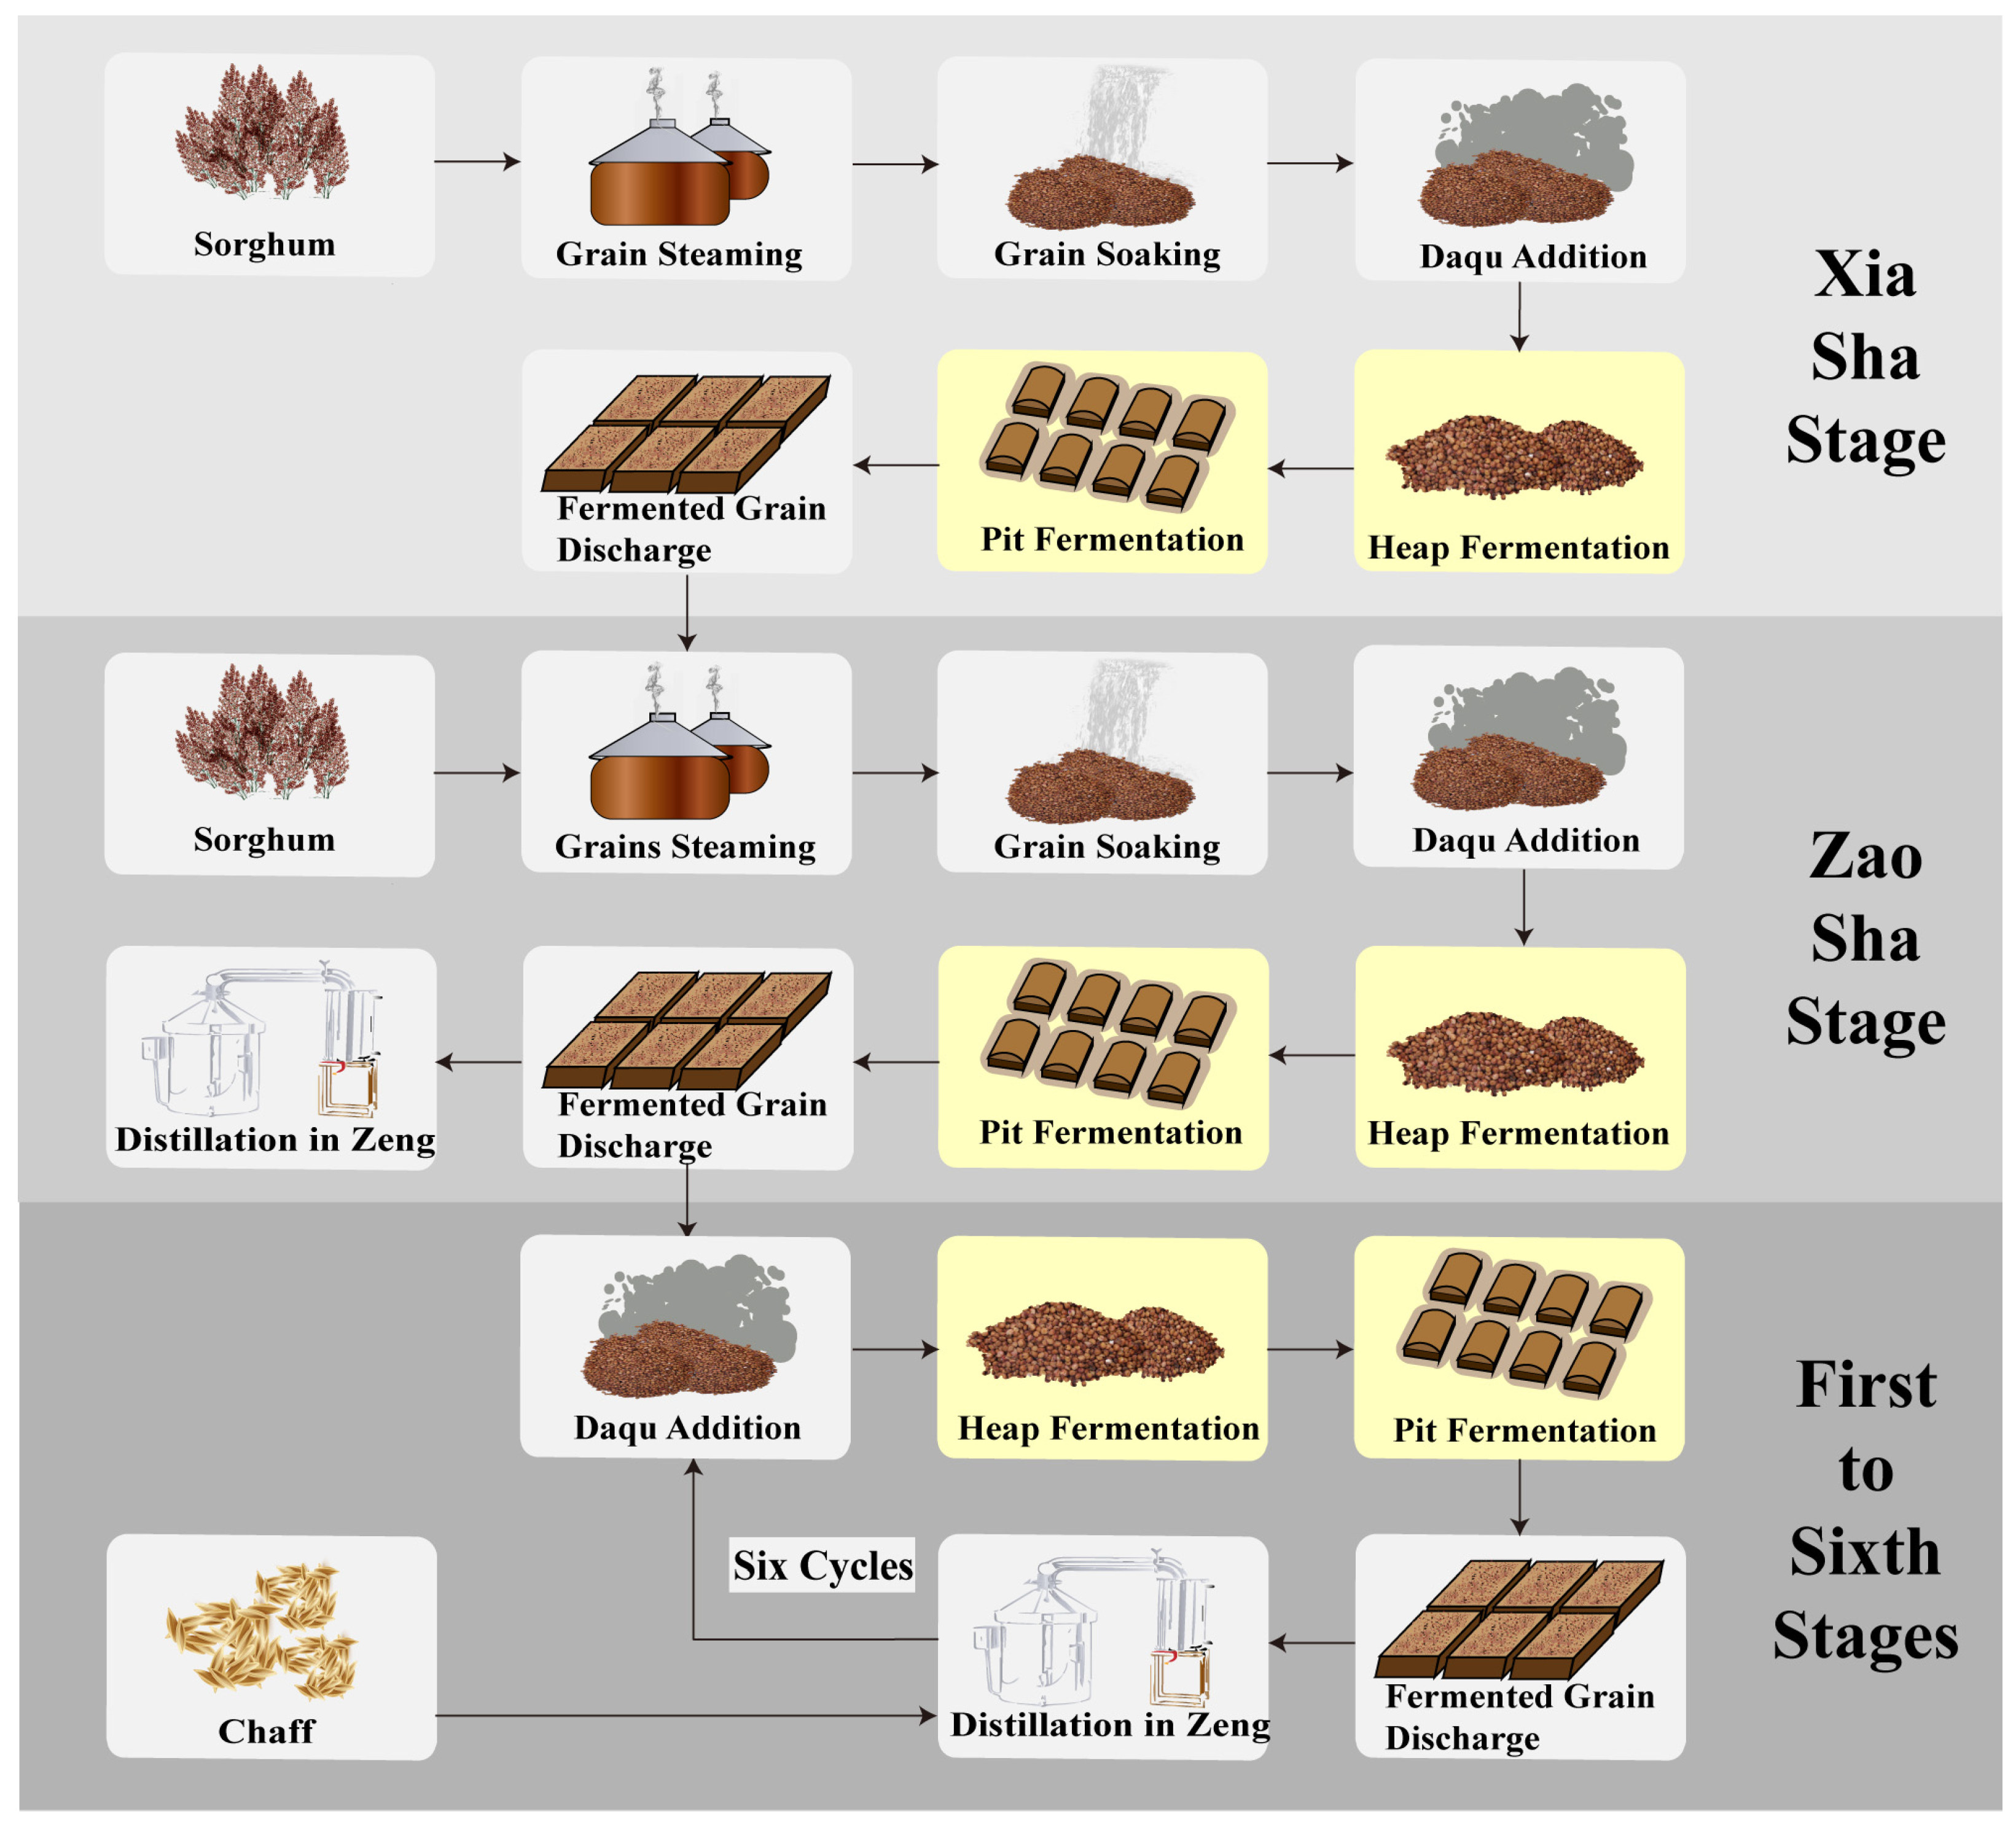
2.1. Sample Collection and Preprocessing

Several steps are involved in the fermentation process of Baijiu using steamed glutinous sorghum as the chief raw material, such as the representative variety “Hongyingzi”. The fermentation process consisted of eight stages, including Xiasha, Zhaosha, and additional six stages, each lasting approximately 40 d, with the entire fermentation cycle lasting approximately 10 months. In the Xiaosha stage, sorghum was crushed, steamed, and washed before being mixed with the fermentation starter, Daqu. After approximately 4 d of heap fermentation and 30 d of pit fermentation, the pit was opened, and the liquor was distilled. In the Zhaosha stage, after distillation, a portion of the distilled grain mash was mixed with additional sorghum, and the process was repeated in a manner similar to that of the Xiaosha cycle. No additional sorghum was added during the six final stages. After distillation, the distilled grain mash was mixed with Daqu and subjected to heap and pit fermentation. During distillation, chaff was added to evenly heat the grain mash and increase the alcohol yield (Figure 1). Samples were collected during the heap and pit fermentation processes from a Baijiu distillery in Guizhou province, China, (28.14° N, 106.18° E) in the years 2020 and 2021. Sampling was conducted at different times during all stages, i.e., the Xiasha, Zaosha as well as the last six stages. Heap surface samples were collected from a height of 0.6 m, 0.2 m away from the outer edge of the heap, and heap core samples were collected from a height of 0.6 m, 1.5 m away from the outer edge of the heap. Pit fermentation samples were collected 0.2 m from the pit wall and 1 m from the pit surface (Figure 2A) on days 0, 3, 7, 14, 21, and 28. Each sample, weighing 500 g, was placed in a sterile sealed bag and temporarily stored at −20 °C. The methanol content was determined for all samples. Environmental factors, such as ethanol, were measured for all pit fermentation samples, and 16S rRNA and ITS amplicon sequencing were performed. Metagenomic and metatranscriptomic sequencing was performed on the of pit fermentation samples from the first stage.

2.2. Chemical Indicator Detection

The methanol content of the fermented grain samples was determined by headspace gas chromatography. Specifically, 1 g of fermented grain was weighed into an extraction bottle, and 4 mL of distilled water was added along with 2-methyl-2-butanol as an internal standard. The analysis was conducted on a DB-23 capillary column under the following chromatographic conditions: temperature starting at 40 °C, held for 6 min, followed by an increase to 180 °C at 10 °C·min−1, with the final temperature held for 4 min. The detection was performed using a hydrogen flame ionization detector set to 250 °C. Nitrogen served as the carrier gas, with a 3:1 split ratio. The headspace injection volume was 1.0 µL, and the methanol retention time was 6.950 min (Figure S1A).
For pectin detection, 5 g of a fermented grain sample was homogenized with 50 mg of pectinase and 200 mL of hydrochloric acid solution (pH 4). After the homogenization and an ultrasound treatment, the supernatant was subjected to liquid chromatography–mass spectrometry (LC-MS) to determine the galacturonic acid content. A Waters Xbridge Amide liquid chromatography column, with an injection volume of 10 μL and acetonitrile–water (containing 5 mmol/L of acetic acid) as the mobile phase at a flow rate of 1 mL/min, was used, and detection was performed at a wavelength of 210 nm. The entire analysis took 20 min, with the galacturonic acid m/z ratio being 193.03 (Figure S1B).
Environmental factors, including moisture, acidity, and starch, reducing sugar, alcohol, and acetic acid contents, were measured in the fermented grain samples. The moisture content was determined by drying the samples at 125 °C until a constant weight was achieved. Acidity and the alcohol, starch, reducing sugar, and organic acid contents were determined using previously established protocols [16,19,20]. Six replicates were examined for each sample for the methanol content analysis, and three replicates for each sample for the other analyses.

2.3. Total DNA and Total RNA Extraction and Sequencing

Total DNA was extracted from the microbial samples using the DNeasy PowerSoil kit (Qiagen, Hilden, Germany). The DNA samples meeting the quality standards were subjected to random fragmentation using a sonicator after adding the fragmentation buffer. The resulting short DNA fragments were used for library construction. Total RNA was extracted from the microbial samples using the RNeasy PowerSoil kit (Qiagen, Hilden, Germany). Ribo-ZeroTM rRNA Removal kit (Illumina, San Diego, USA) and the Ribo-ZeroTM Magnetic Gold kit (Illumina, San Diego, USA) were used to remove rRNA from total RNA. Fragmented RNA was used for library construction. The libraries that passed the quality control were subjected to paired-end (PE) sequencing on an Illumina HiSeq 2500 high-throughput sequencing platform. Metagenomic and metatranscriptomic sequencing were conducted by Guangdong Magigene Technology Co., Ltd. (Guangdong, China).

2.4. DNA Extraction, Amplification, and Sequencing

After grinding the samples in liquid nitrogen, total DNA was extracted from the microbial samples using the DNeasy PowerSoil kit (Qiagen, Hilden, Germany). The concentration of the total microbial DNA was determined using a NanoDrop 2000 spectrophotometer, and the quality and integrity of the DNA were assessed using 1% agarose gel electrophoresis. For bacterial full-length 16S rDNA amplification, the primers used were 27F (5′-AGRGTTYGATYMTGGCTCAG-3′) and 1492R (5′-RGYTACCTTGTTACGACTT-3′). For fungal rDNA ITS1 region amplification, the primers were ITS1 (5′-CTTGGTCATTTAGAGGAAGTAA-3′) and ITS2 (5′-GCTGCGTTCTTCATCGATGC-3′). The PCR amplification conditions were as follows: initial denaturation at 94 °C for 3 min, denaturation at 94 °C for 30 s, annealing at 55 °C for 45 s, extension at 72 °C for 45 s, and, after 30 cycles, a final extension at 72 °C for 10 min. The full-length 16S rRNA amplification sequences were obtained using the PacBio sequencing platform, whereas the ITS amplification sequences were obtained using the Hiseq2500 sequencing platform. The amplification products were sequenced by Suzhou Genewiz Technology Co., Ltd. (Suzhou, China).

2.5. Data Analysis

For both metagenomic and metatranscriptomic data, low-quality sequences were removed using the Trimmomatic software (v0.39) [21]. De novo assembly was performed using Trinity (v2.4.0) [22]. Diamond (v2.0) [23] was used for sequence alignment, and the results were input into MEGAN (v6.0) to obtain microbial taxonomic information. High-quality reads were compared to sequences in non-redundant protein databases and the Kyoto Encyclopedia of Genes and Genomes (KEGG) database to obtain functional annotation information. Differential analysis was conducted using the DESeq2 package in R, and correlation heatmap analysis was performed using the pheatmap package. Spearman’s correlations among microorganisms were analyzed using SPSS (v27) with a significance level at p < 0.05. Significant relationships with |r| > 0.7 and p < 0.05 were visualized using the igraph package in R.
For the amplicon sequencing data, multiple sequencing results from the same molecule were processed to obtain accurate consensus sequences. Amplicons from different samples were then split using barcode information, and low-quality sequences were filtered out, obtaining raw reads. FLASH software (v1.2.11) was used to pair dual-end sequencing reads based on overlapping relationships, and chimeras were removed to obtain clean reads. Operational Taxonomic Units (OTUs) were clustered at 97% similarity using UPARSE software (v7.0.1090). Representative OTU sequences were matched against databases using UCHIME software (v3). The RDP classifier (v2.2) was used for species annotation. The bacterial OTUs were aligned with the Silva database, and the fungal OTUs were matched with the UNITE database. The community compositions of the samples were calculated at different taxonomic levels. Redundancy analysis was conducted using the vegan package in the R software (v4.2.1). Random forest analysis was performed using the rfPermute and randomForest packages. Partial least squares regression (PLSR) analysis was performed using the pls package, and PLS-PM was conducted using the plspm package. Possible Spearman’s rank correlations between microorganisms and methanol content were computed using SPSS (p < 0.05); the ggplot2 package was used for correlation visualization.

3. Results

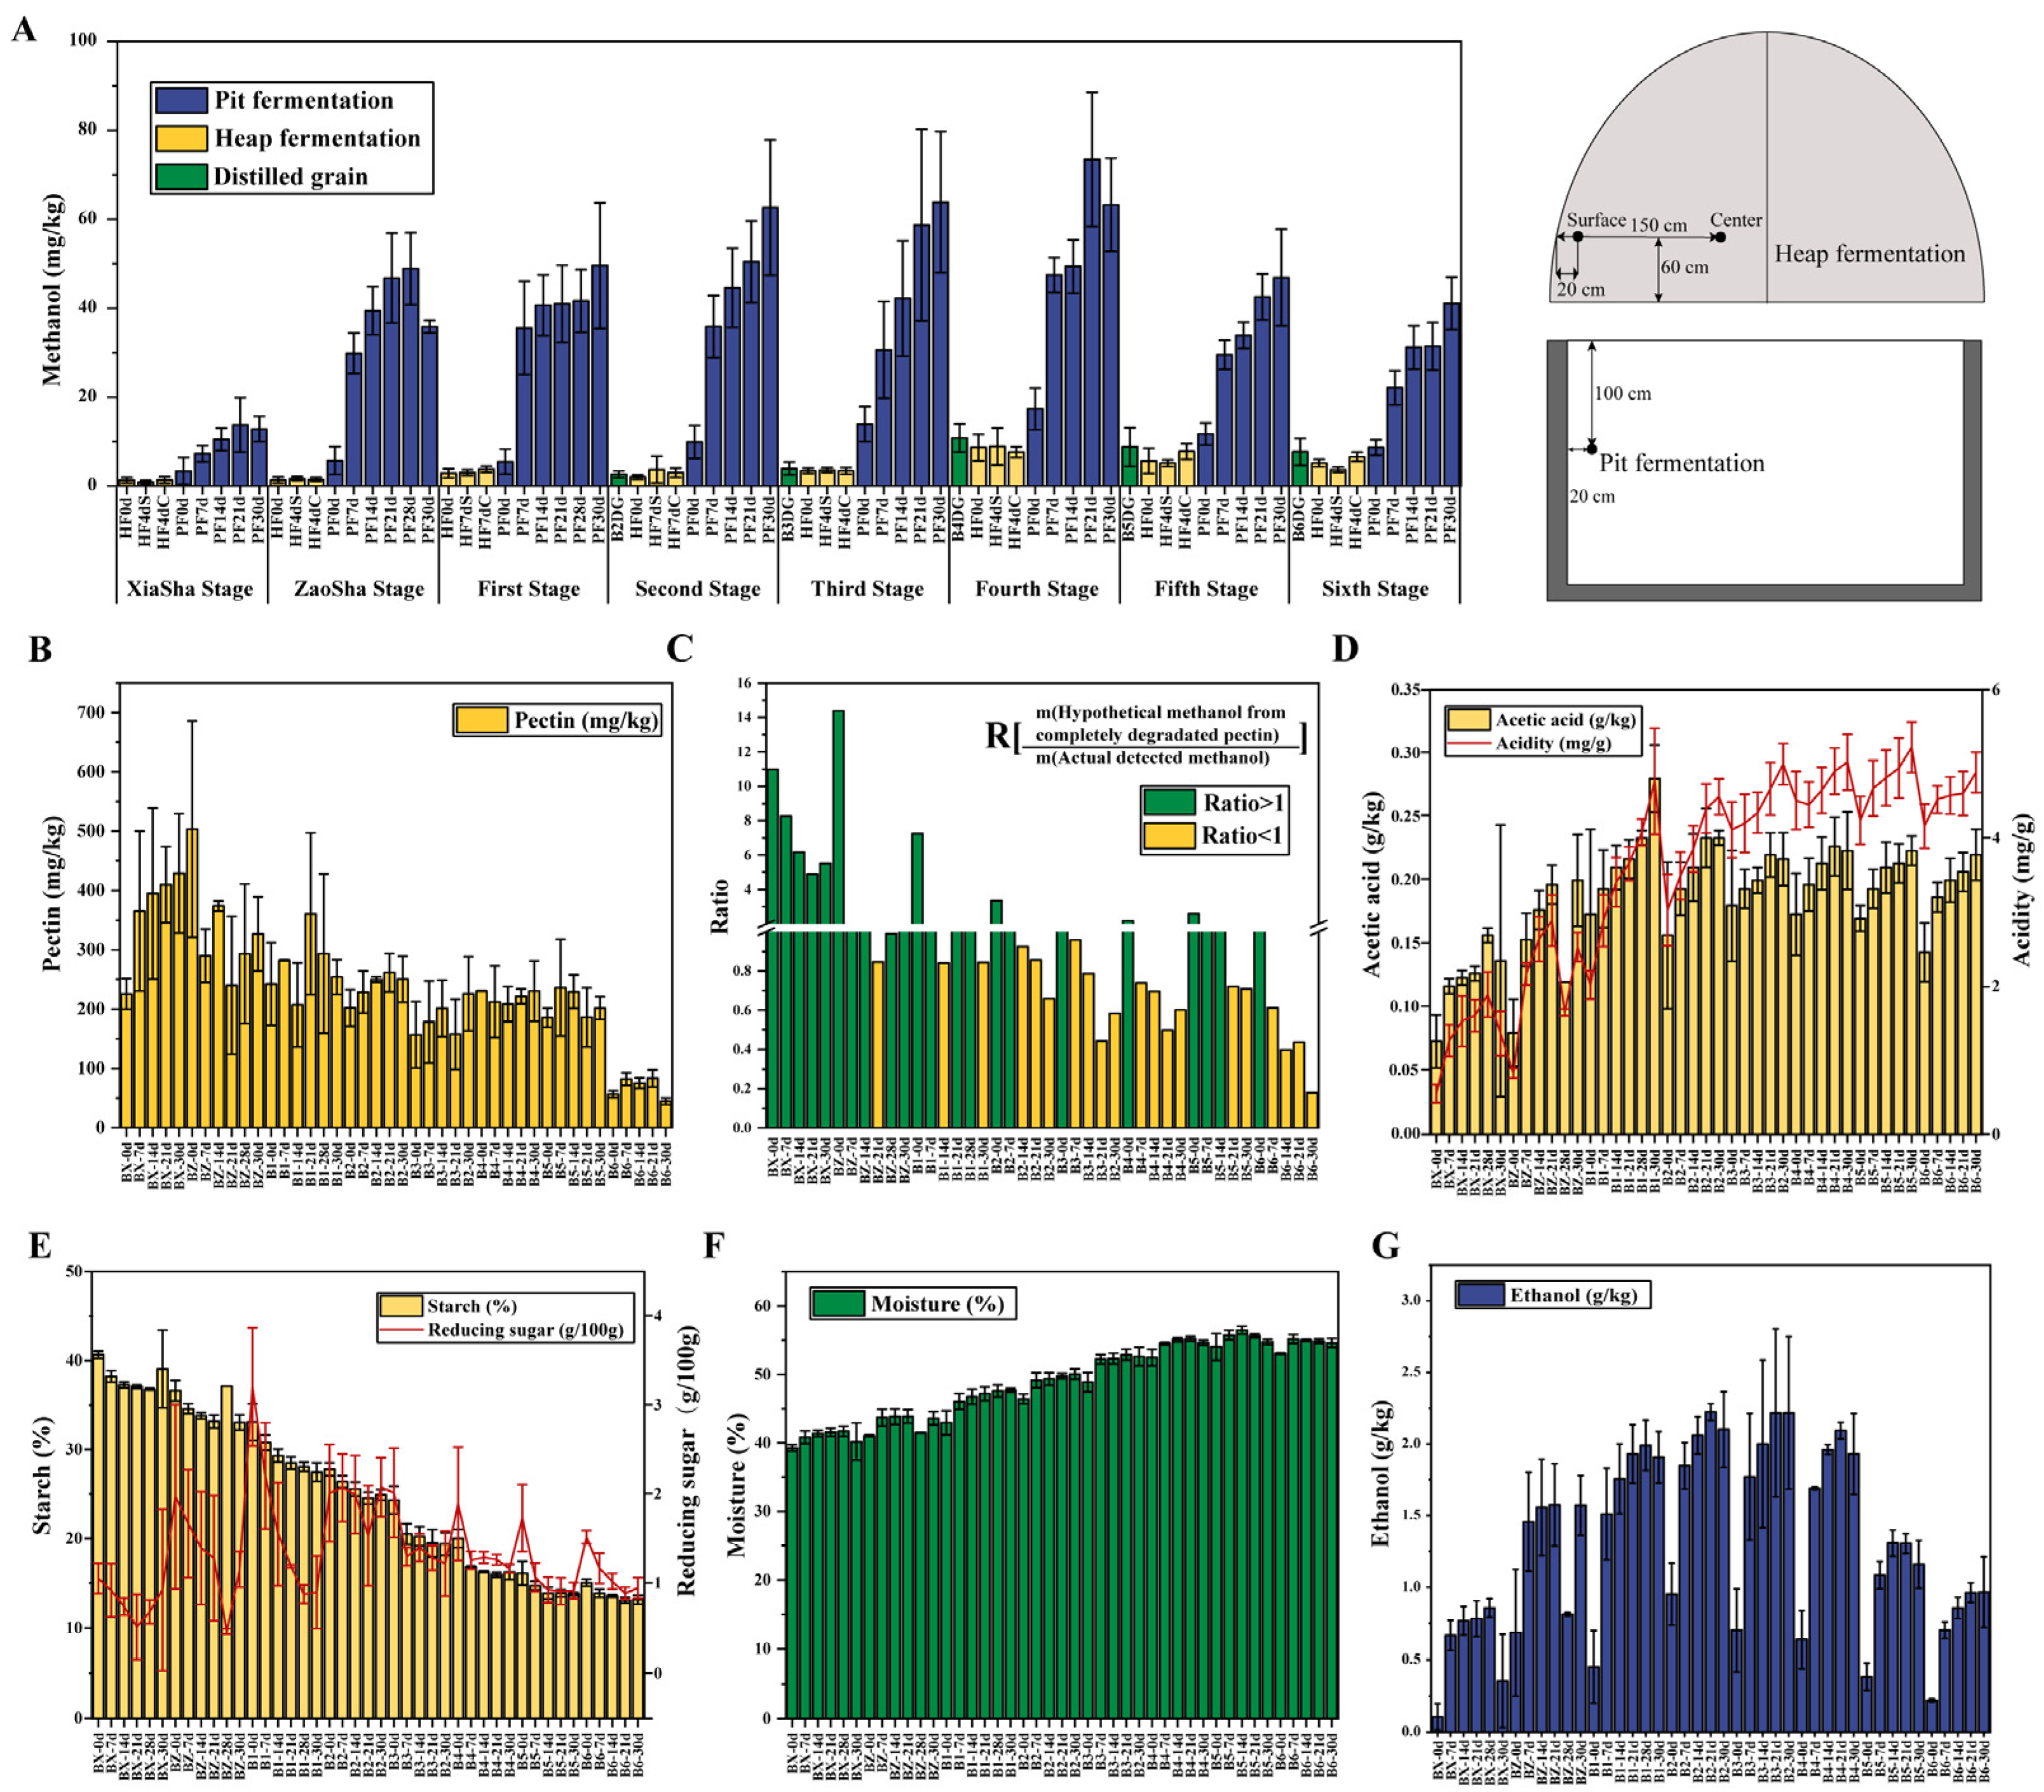
3.1. Trends in Methanol Content and Environmental Factors Variation during Fermentation across the Baijiu Production Cycles

The methanol content in the fermented grains during heap and pit fermentation was measured (Figure 2A). The changes in methanol content were relatively small during heap fermentation. However, upon starting pit fermentation, the methanol content in the fermented grains rapidly increased, especially during the first seven days. Therefore, pit fermentation is crucial for methanol metabolism. Throughout the production cycle, the methanol content initially increased and then decreased across different stages, reaching its peak in the fourth stage.
Furthermore, the pectin content in the fermented grains was measured during pit fermentation (Figure 2B). The pectin content increased in the Xiasha and Zaosha stages and then fluctuated during the last six stages. Overall, the pectin content showed a decreasing trend throughout the production cycle. To verify whether other pathways were involved in methanol production during pit fermentation, according to the chemical reaction in which one methyl ester molecule of galacturonic acid decomposes into one methanol molecule and one galacturonic acid residue, the proportion of methanol that could be provided by the complete conversion of pectin during pit fermentation to the actual detected methanol content was calculated (Figure 2C). To calculate the maximum amount of methanol that could be produced through the pectin degradation pathway, pectin was assumed to be completely composed of the methyl ester of galacturonic acid. For most samples in the last six stages, even though all pectin in the samples was converted to methanol, the measured methanol values were not reached. Therefore, it is speculated that other pathways may be involved in methanol metabolism during pit fermentation.
Finally, changes in environmental factors during pit fermentation were investigated. Regarding the variation in acid content (Figure 2D), acetic acid and acidity gradually accumulated in each stage. The acetic acid content first increased and then stabilized, whereas acidity showed a continuous upward trend over the production cycle. Regarding the changes in sugar content (Figure 2E), the starch content changed slightly, and the reducing sugar content gradually decreased in each stage, exhibiting fluctuations throughout the production cycle. The moisture content gradually increased during the production cycle (Figure 2F). Ethanol gradually accumulated in each stage (Figure 2G); its content initially increased, then decreased, similar to what in observed for methanol accumulation.

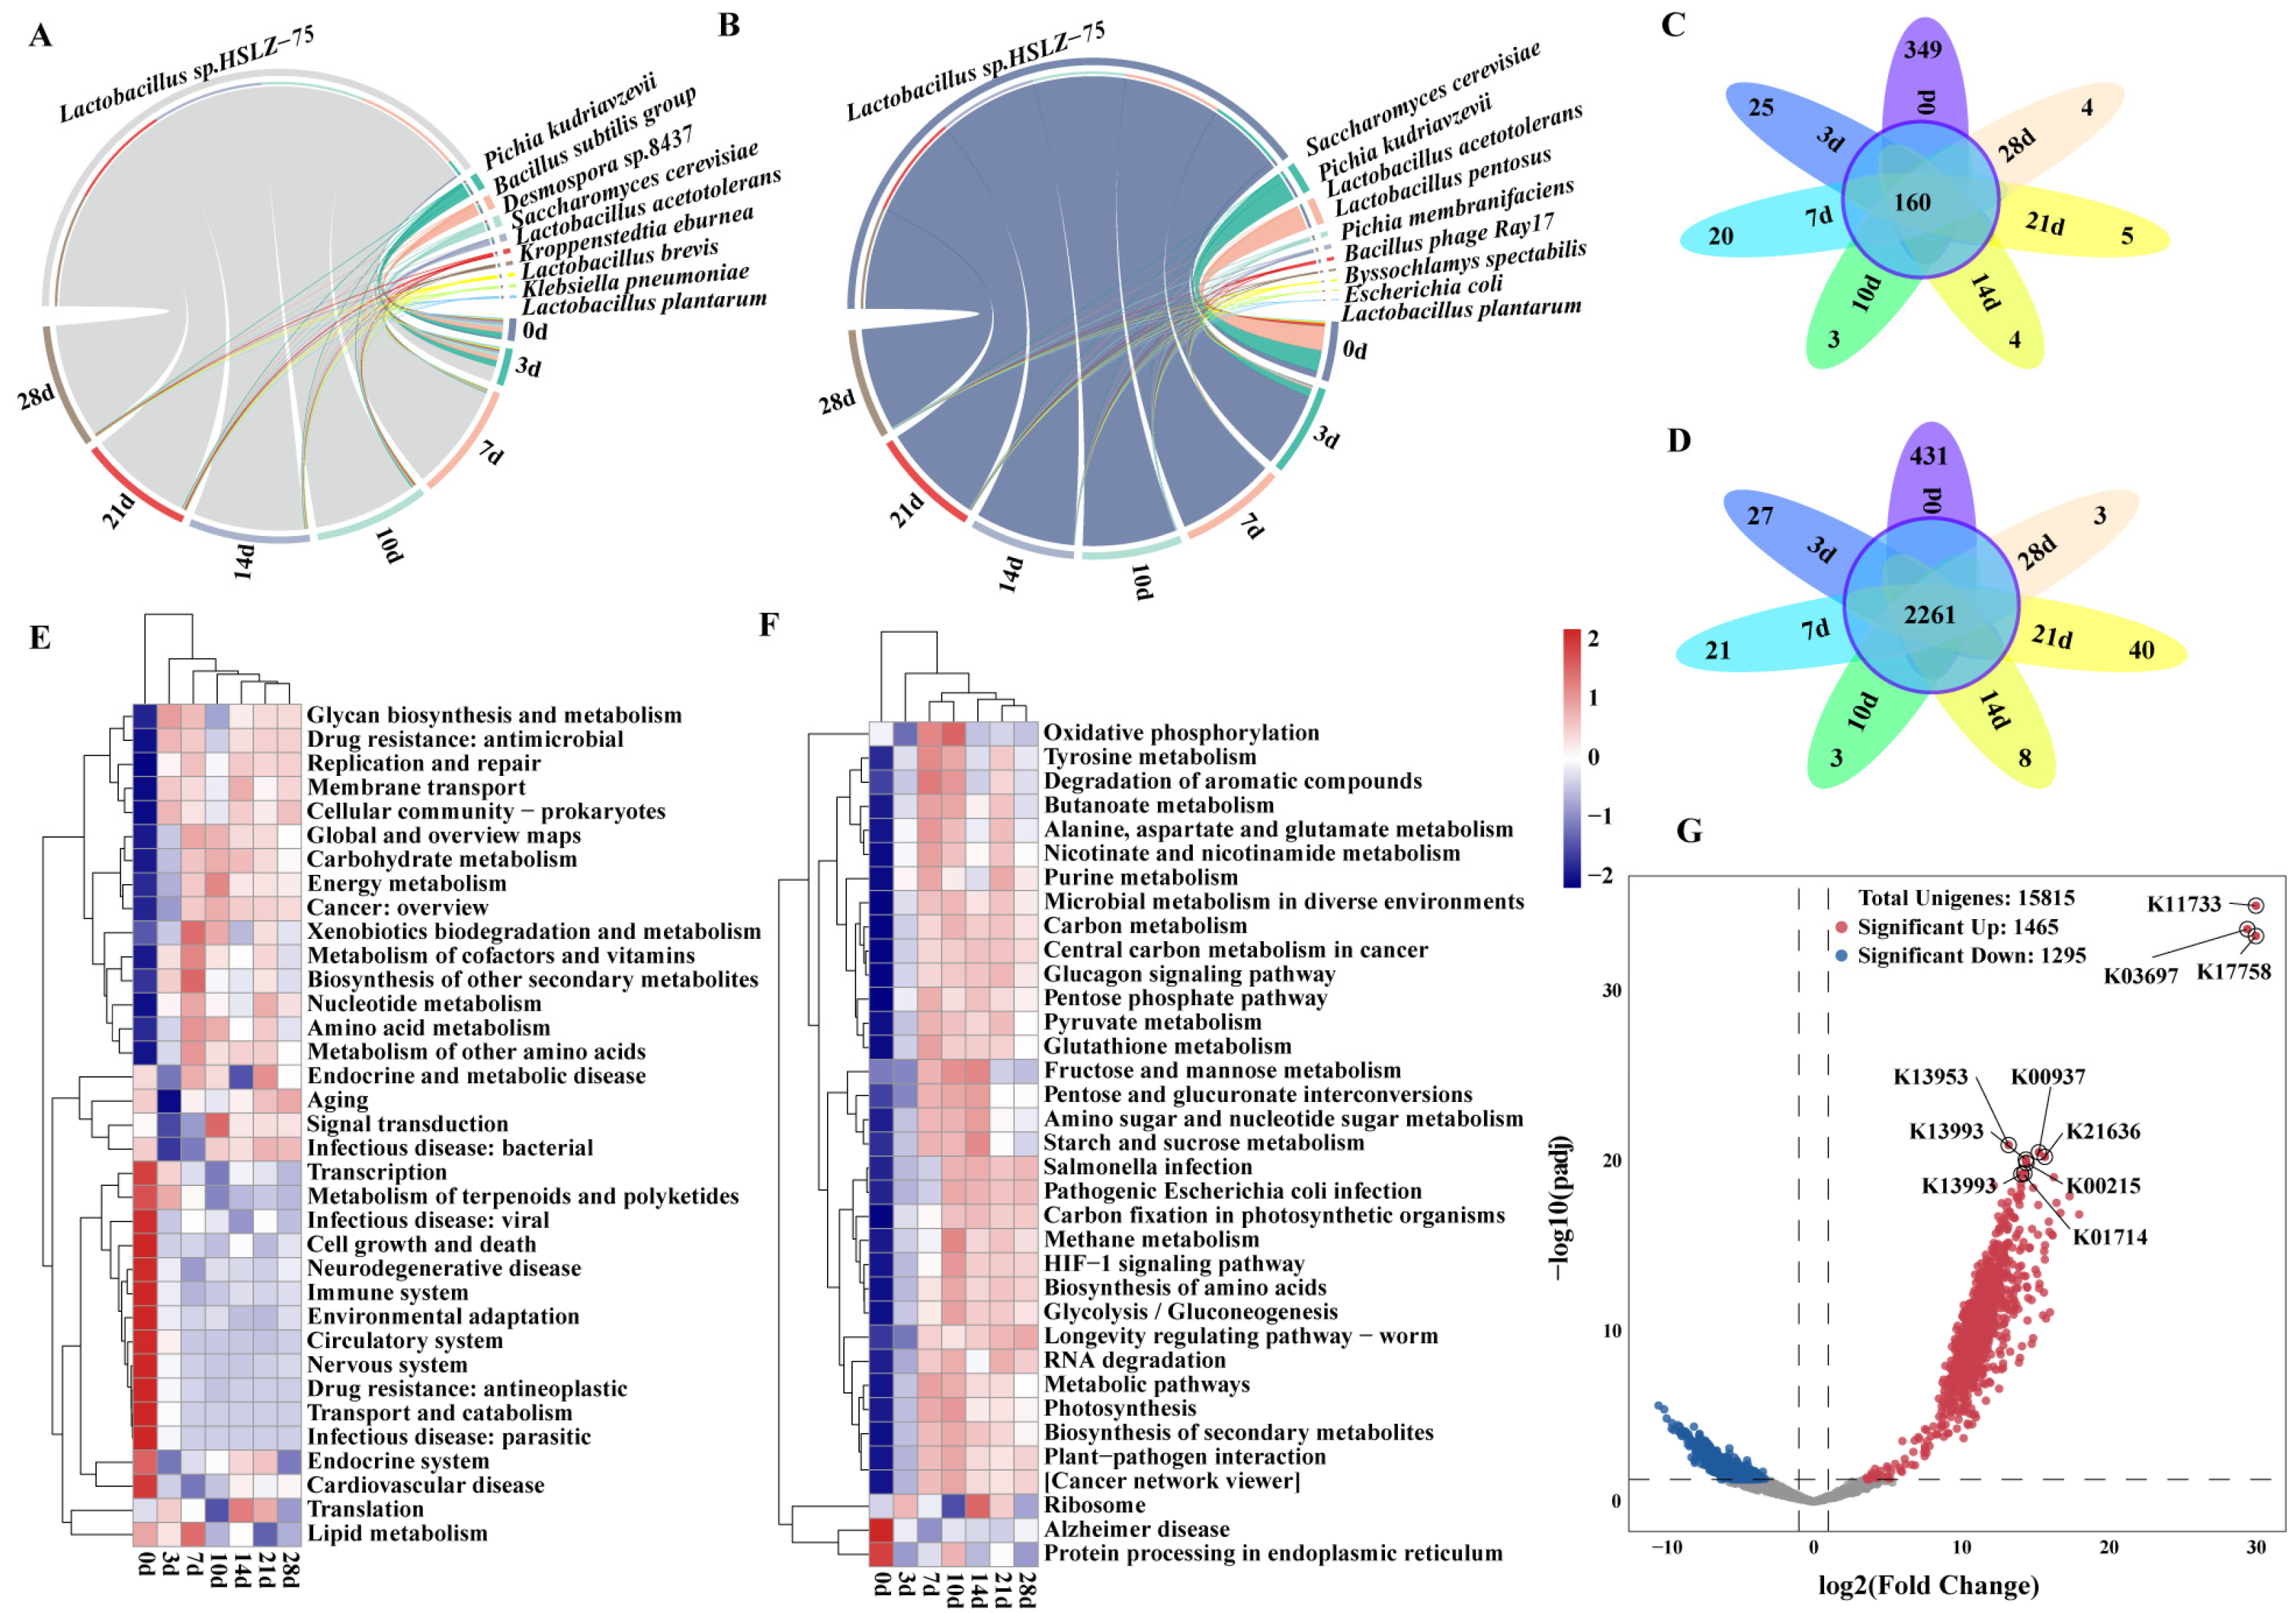
3.2. Analysis of the Changes in Dominant Species and Functions during Pit Fermentation

Through species annotation of the metagenome (Figure 3A) and metatranscriptome (Figure 3B), insights into the changes in microbial composition during pit fermentation were obtained. Lactobacillus sp. HSLZ-75 rapidly became the dominant species after starting pit fermentation, whereas the transcriptional activity of Pichia kudriavzevii was relatively high. Using Venn diagrams, changes in the number of annotated species (Figure 3C) and KEGG Orthology (KO) terms (Figure 3D) during pit fermentation are presented separately. The fermented grains on day 0 exhibited the highest number of unique species and functions. As pit fermentation progressed, the number of newly added species and functions decreased, eventually tending toward stability. The expression trends of the KEGG second (Figure 3E) and third-level classification pathways (Figure 3F) during pit fermentation are illustrated in a heatmap. The KEGG second-level classification pathways showed significant changes three days after starting pit fermentation. During pit fermentation, the pathways related to glycan biosynthesis and metabolism and carbohydrate and amino acid metabolism were generally upregulated, whereas those related to transcription were generally downregulated. Most of the KEGG third-level classification pathways showed significant changes seven days after starting pit fermentation, with overall upregulation observed in pathways such as pyruvate metabolism, carbon metabolism, and starch and sucrose metabolism. Further analysis of KO functional differences between samples on days zero and seven, where significant downregulation and upregulation of Unigenes were observed, revealed that the majority of upregulated KOs showed high fold changes, with the highest fold changes associated with lysine metabolism (K11733) and ATP metabolism (K03697).

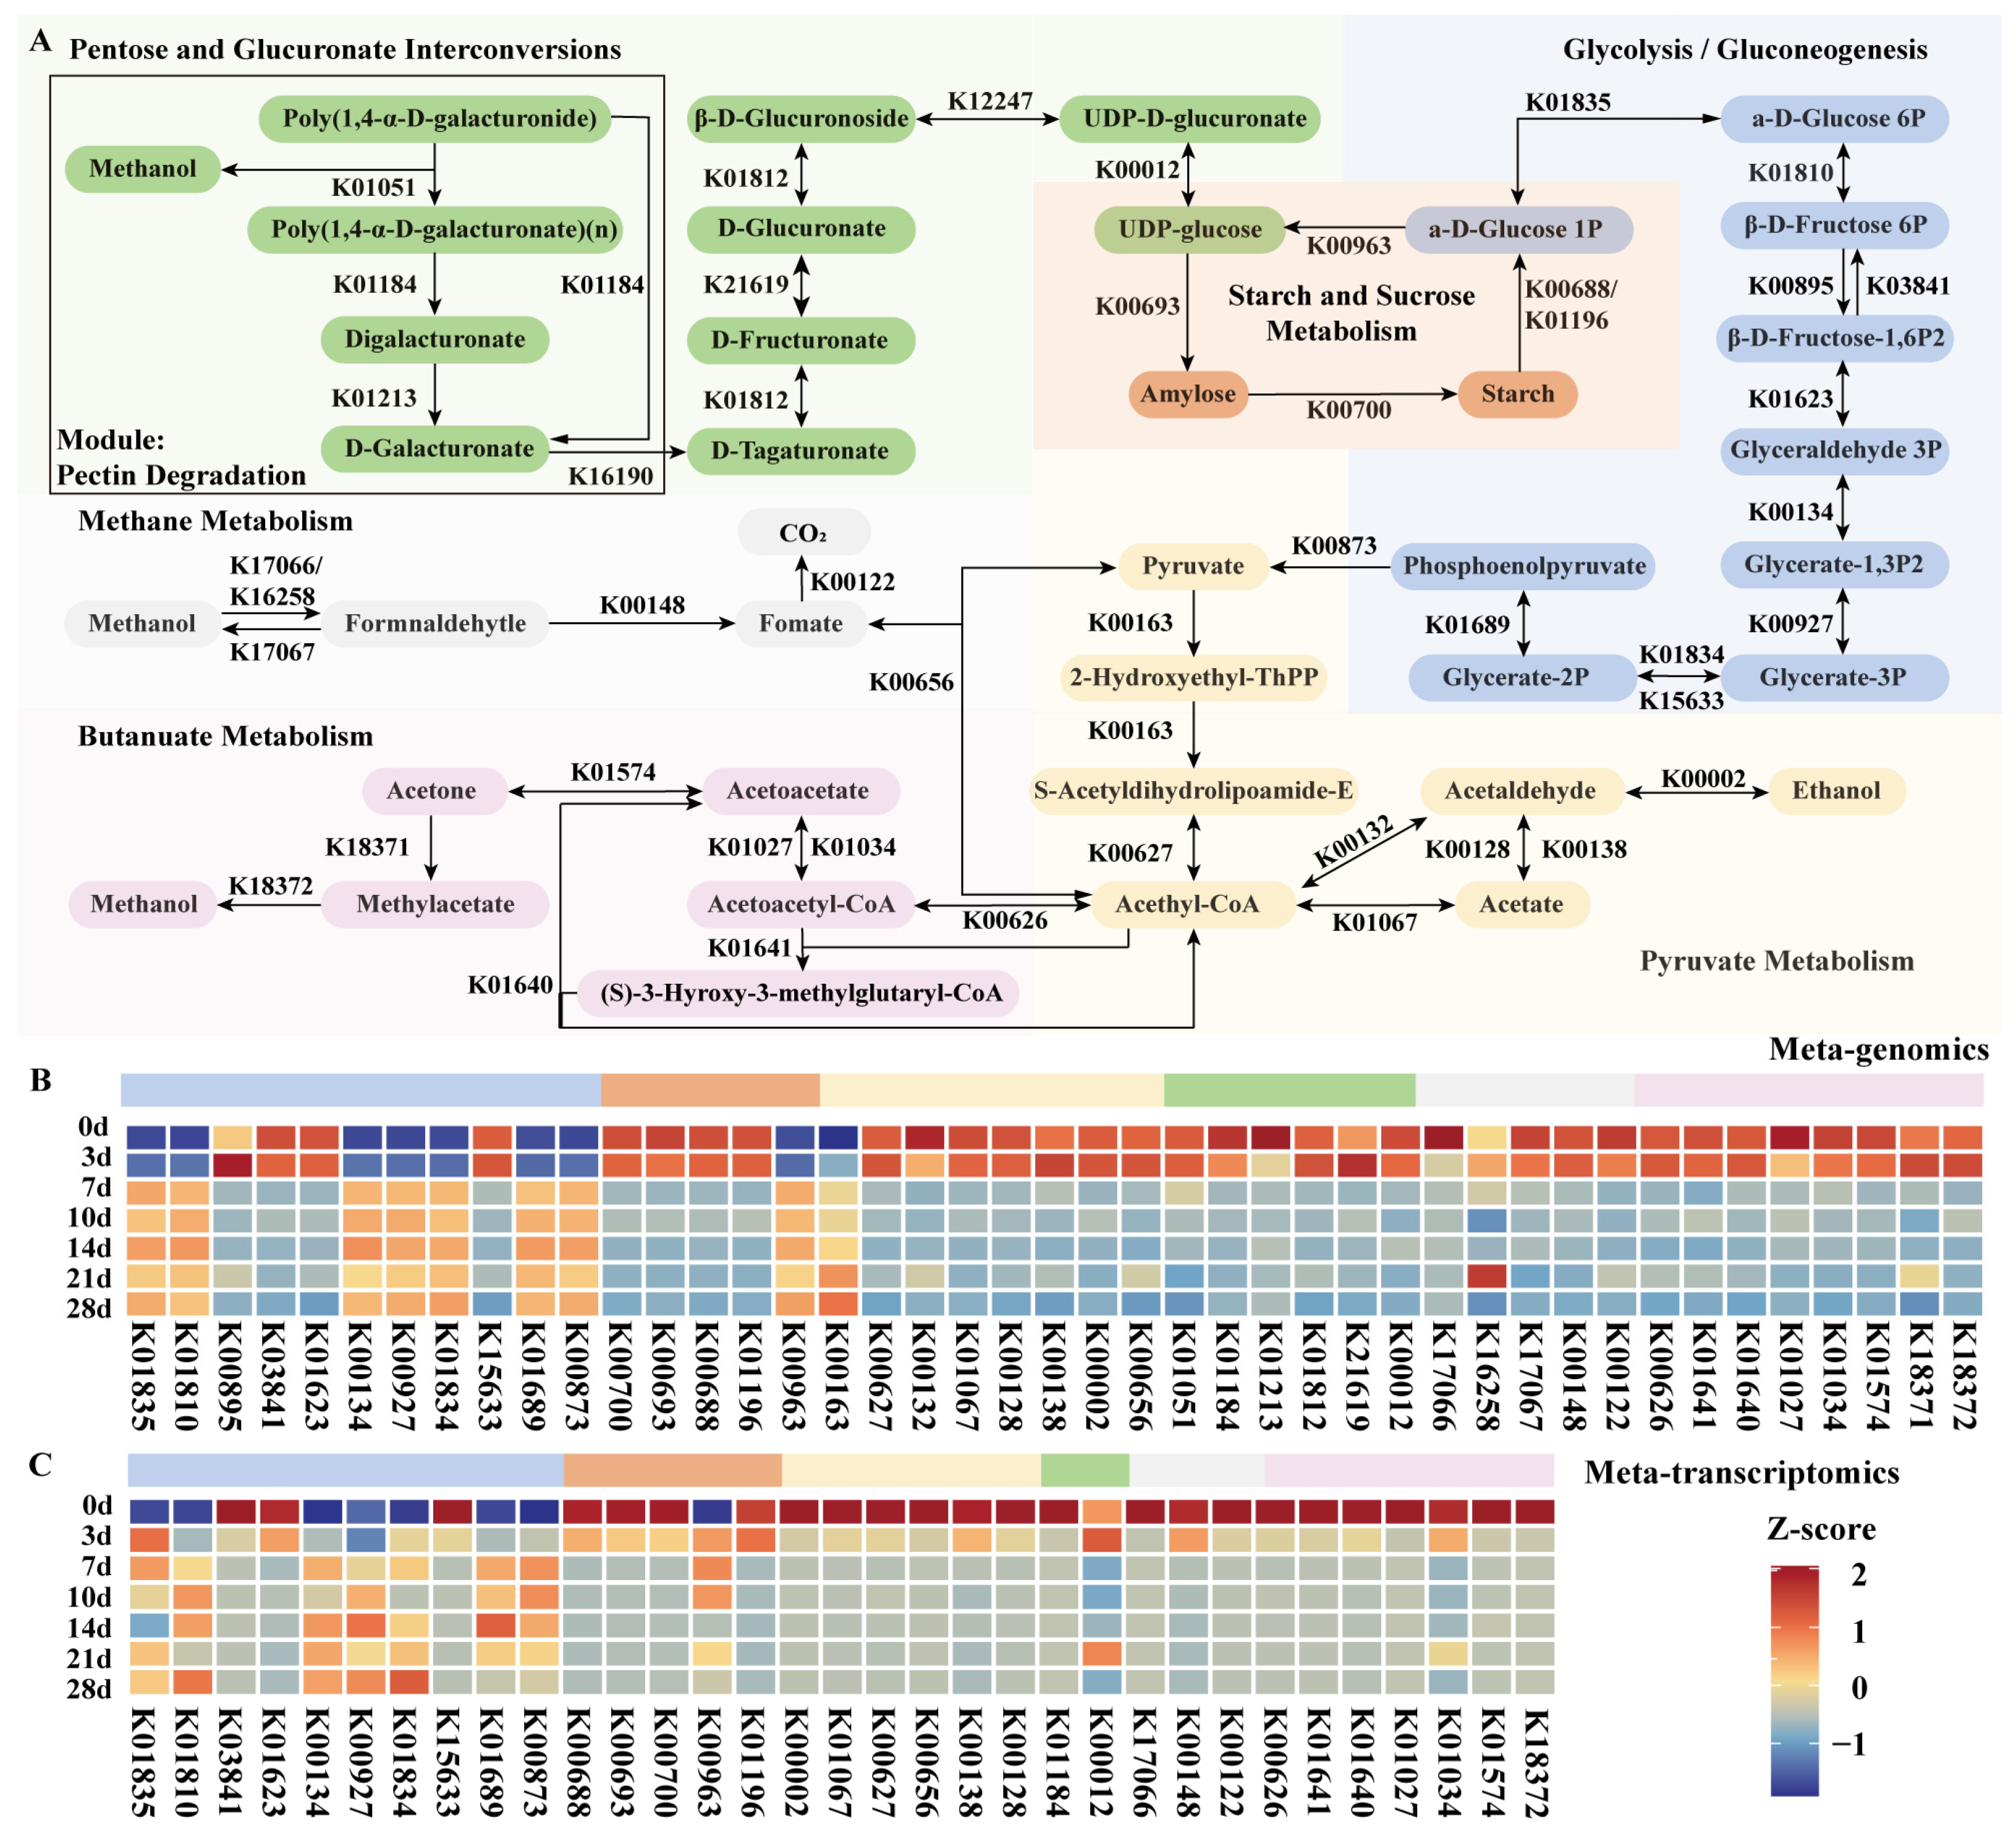
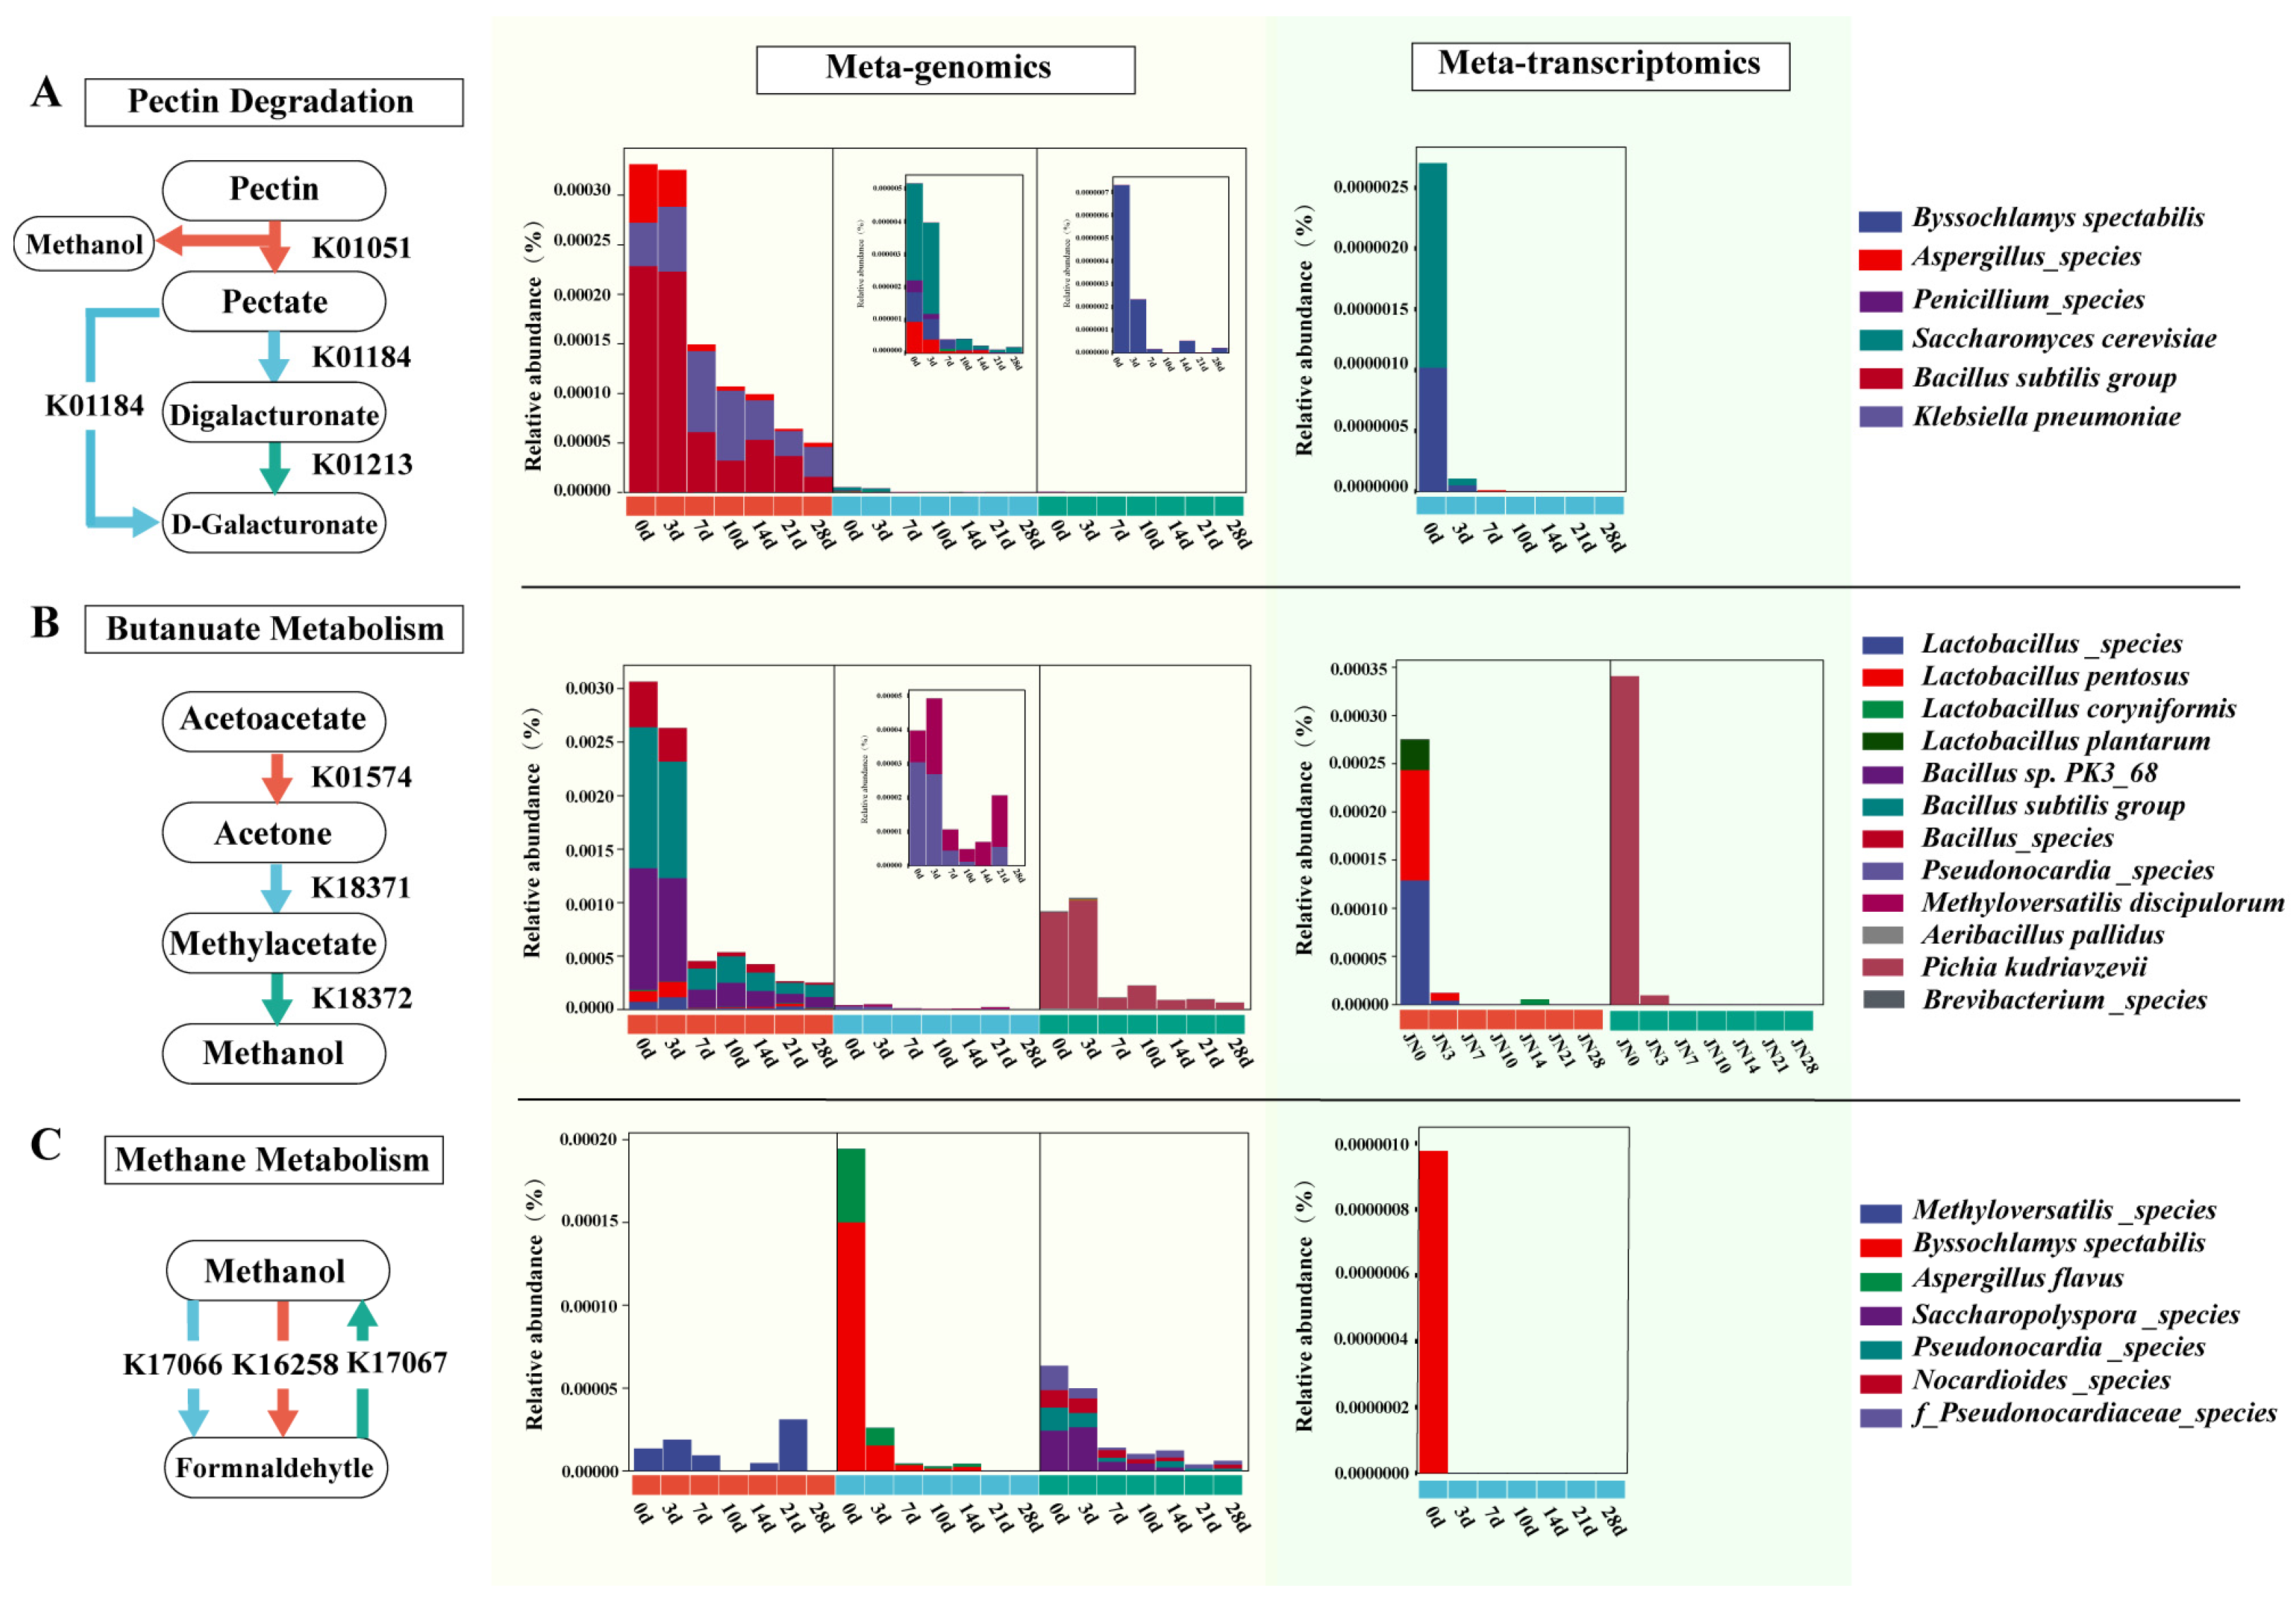
3.3. Analysis of Methanol Metabolism Pathways and Participating Microorganisms during Pit Fermentation

By annotating the metagenomic and metatranscriptomic sequencing data with the KEGG pathway database, a metabolic network for methanol was constructed. Environmental factors were selected during pit fermentation (Figure 4A). Additionally, all related KOs and their corresponding enzymes were compared (Table S2). The methanol metabolism network primarily included six pathways, with three pathways directly involved in methanol metabolism: the butanoate, and methane metabolism pathways and the pathway underlying the interconversion between pentose and glucuronate.
Major reactions of methanol metabolism within the pentose and glucuronate interconversion pathway occur in the pectin degradation module. In this module, the pectin, composed of poly(1,4-α-D-galacturonide), is converted into poly(1,4-α-D-galacturonate) by pectinesterase, simultaneously releasing methanol. Subsequently, galacturonic acid is transformed into digalacturonate by polygalacturonase and further converted into d-galacturonate by galacturan 1,4-alpha-galacturonidase. Simultaneously, the unesterified galacturonic acid residues can be directly converted into galacturonic acid by polygalacturonase. Another pathway for methanol production pathway is the butanoate metabolic pathway. Initially, in the starch and sucrose metabolism pathway, starch is converted into α-D-glucose-1p by glycogen debranching enzyme and glycogen phosphorylase, entering the glycolysis pathway to generate pyruvic acid. Subsequently, pyruvic acid is converted to acetyl-CoA through the pyruvate pathway, which then enters the butanoate metabolic pathway. In this pathway, acetyl-CoA is initially transformed into acetoacetyl-CoA by acetyl-CoA C-acetyltransferase. Through a series of reactions, it is further converted into methyl acetate, and methanol is generated through the action of methyl acetate hydrolase. In the methane metabolism pathway, formaldehyde is generated from methanol by methanol dehydrogenase. This pathway also involves methanol utilization. Methanol is converted to formaldehyde by alcohol oxidase and is further oxidized to formic acid by glutathione-independent formaldehyde dehydrogenase. Formic acid is then converted to carbon dioxide by formate dehydrogenase.
The corresponding changes in KO abundance for the annotated networks related to methanol and selected environmental factors were normalized (Figure 4B). The metagenomic results revealed that, in addition to the upregulation of the glycolysis pathway, the relative abundance of most KOs in the other five pathways, including those related to methanol metabolism, decreased after seven days and remained at a low level. Moreover, according to the metatranscriptomic results, the expression of genes corresponding to these KOs began to decline within the first three days. This also explains why the fastest methanol content increase occurred in the first seven days, after which it slowed down. Although the expression of enzymes related to methanol metabolism decreased, the enzymes that had already been expressed and the pectinases present in raw sorghum continued to function in the fermented grains, promoting the accumulation of methanol. For example, in a study on apple wine, pectin was still be broken down into methanol by pectinase during a 30 d aging process [24].
The Unigenes of KO related to methanol metabolism were annotated using species information (Figure 5). In the pectin degradation module, microorganisms such as Bacillus subtilis group, Aspergillus species, and Penicillium species catalyze the production of methanol through pectinesterase metabolism. Subsequently, Byssochlamys spectabilis and Saccharomyces cerevisiae break down large pectates into small d-galacturonates. In the butanoate pathway, lactic acid bacteria, such as Lactobacillus plantarum and Lactobacillus pentosus, transform acetoacetyl-CoA to acetone. Pseudonocardia species and Methyloversatilis discipulorum transform acetone into methyl acetate, and finally, Pichia kudriavzevii hydrolyzes methyl acetate into methanol. In the methane metabolism pathway, microorganisms such as Saccharopolyspora species convert formaldehyde to methanol, whereas Byssochlamys spectabilis transforms methanol into formaldehyde. Additionally, a certain amount of archaea, such as Methanobacterium, in the pit mud, possess methyl metabolism capabilities [25]. Therefore, they may be involved in methanol metabolism via this pathway.
Microorganisms interact with each other and potentially influence methanol metabolism. Previous studies indicated mutual inhibition between lactic acid bacteria and yeast populations [26,27]. This interaction has a significant impact on metabolic changes in a fermentation system. For example, the co-fermentation of multiple lactic acid bacteria with Pichia kudriavzevii can reduce the levels of organic acids, as shown for lactic acid [28,29]. We selected the 20 most abundant microorganisms as the dominant species and conducted a correlation analysis on these dominant during pit fermentation (Figure 6) with the aim of observing the main microbial interactions in the fermented grains. Among the dominant microorganisms, Bacillus subtilis and Pichia kudriavzevii can degrade pectin to generate methanol, whereas Byssochlamys spectabilis can utilize methanol. In terms of centrality, Saccharomyces cerevisiae was the most important microorganism during pit fermentation and was positively correlated with most microorganisms except Lactobacillus sp. HSLZ-75, suggesting a mutualistic relationship. Lactobacillus sp. HSLZ-75, the dominant microorganism in the later stages of pit fermentation, showed a negative correlation with the microorganisms involved in methanol production and utilization, indicating a potential inhibitory effect.

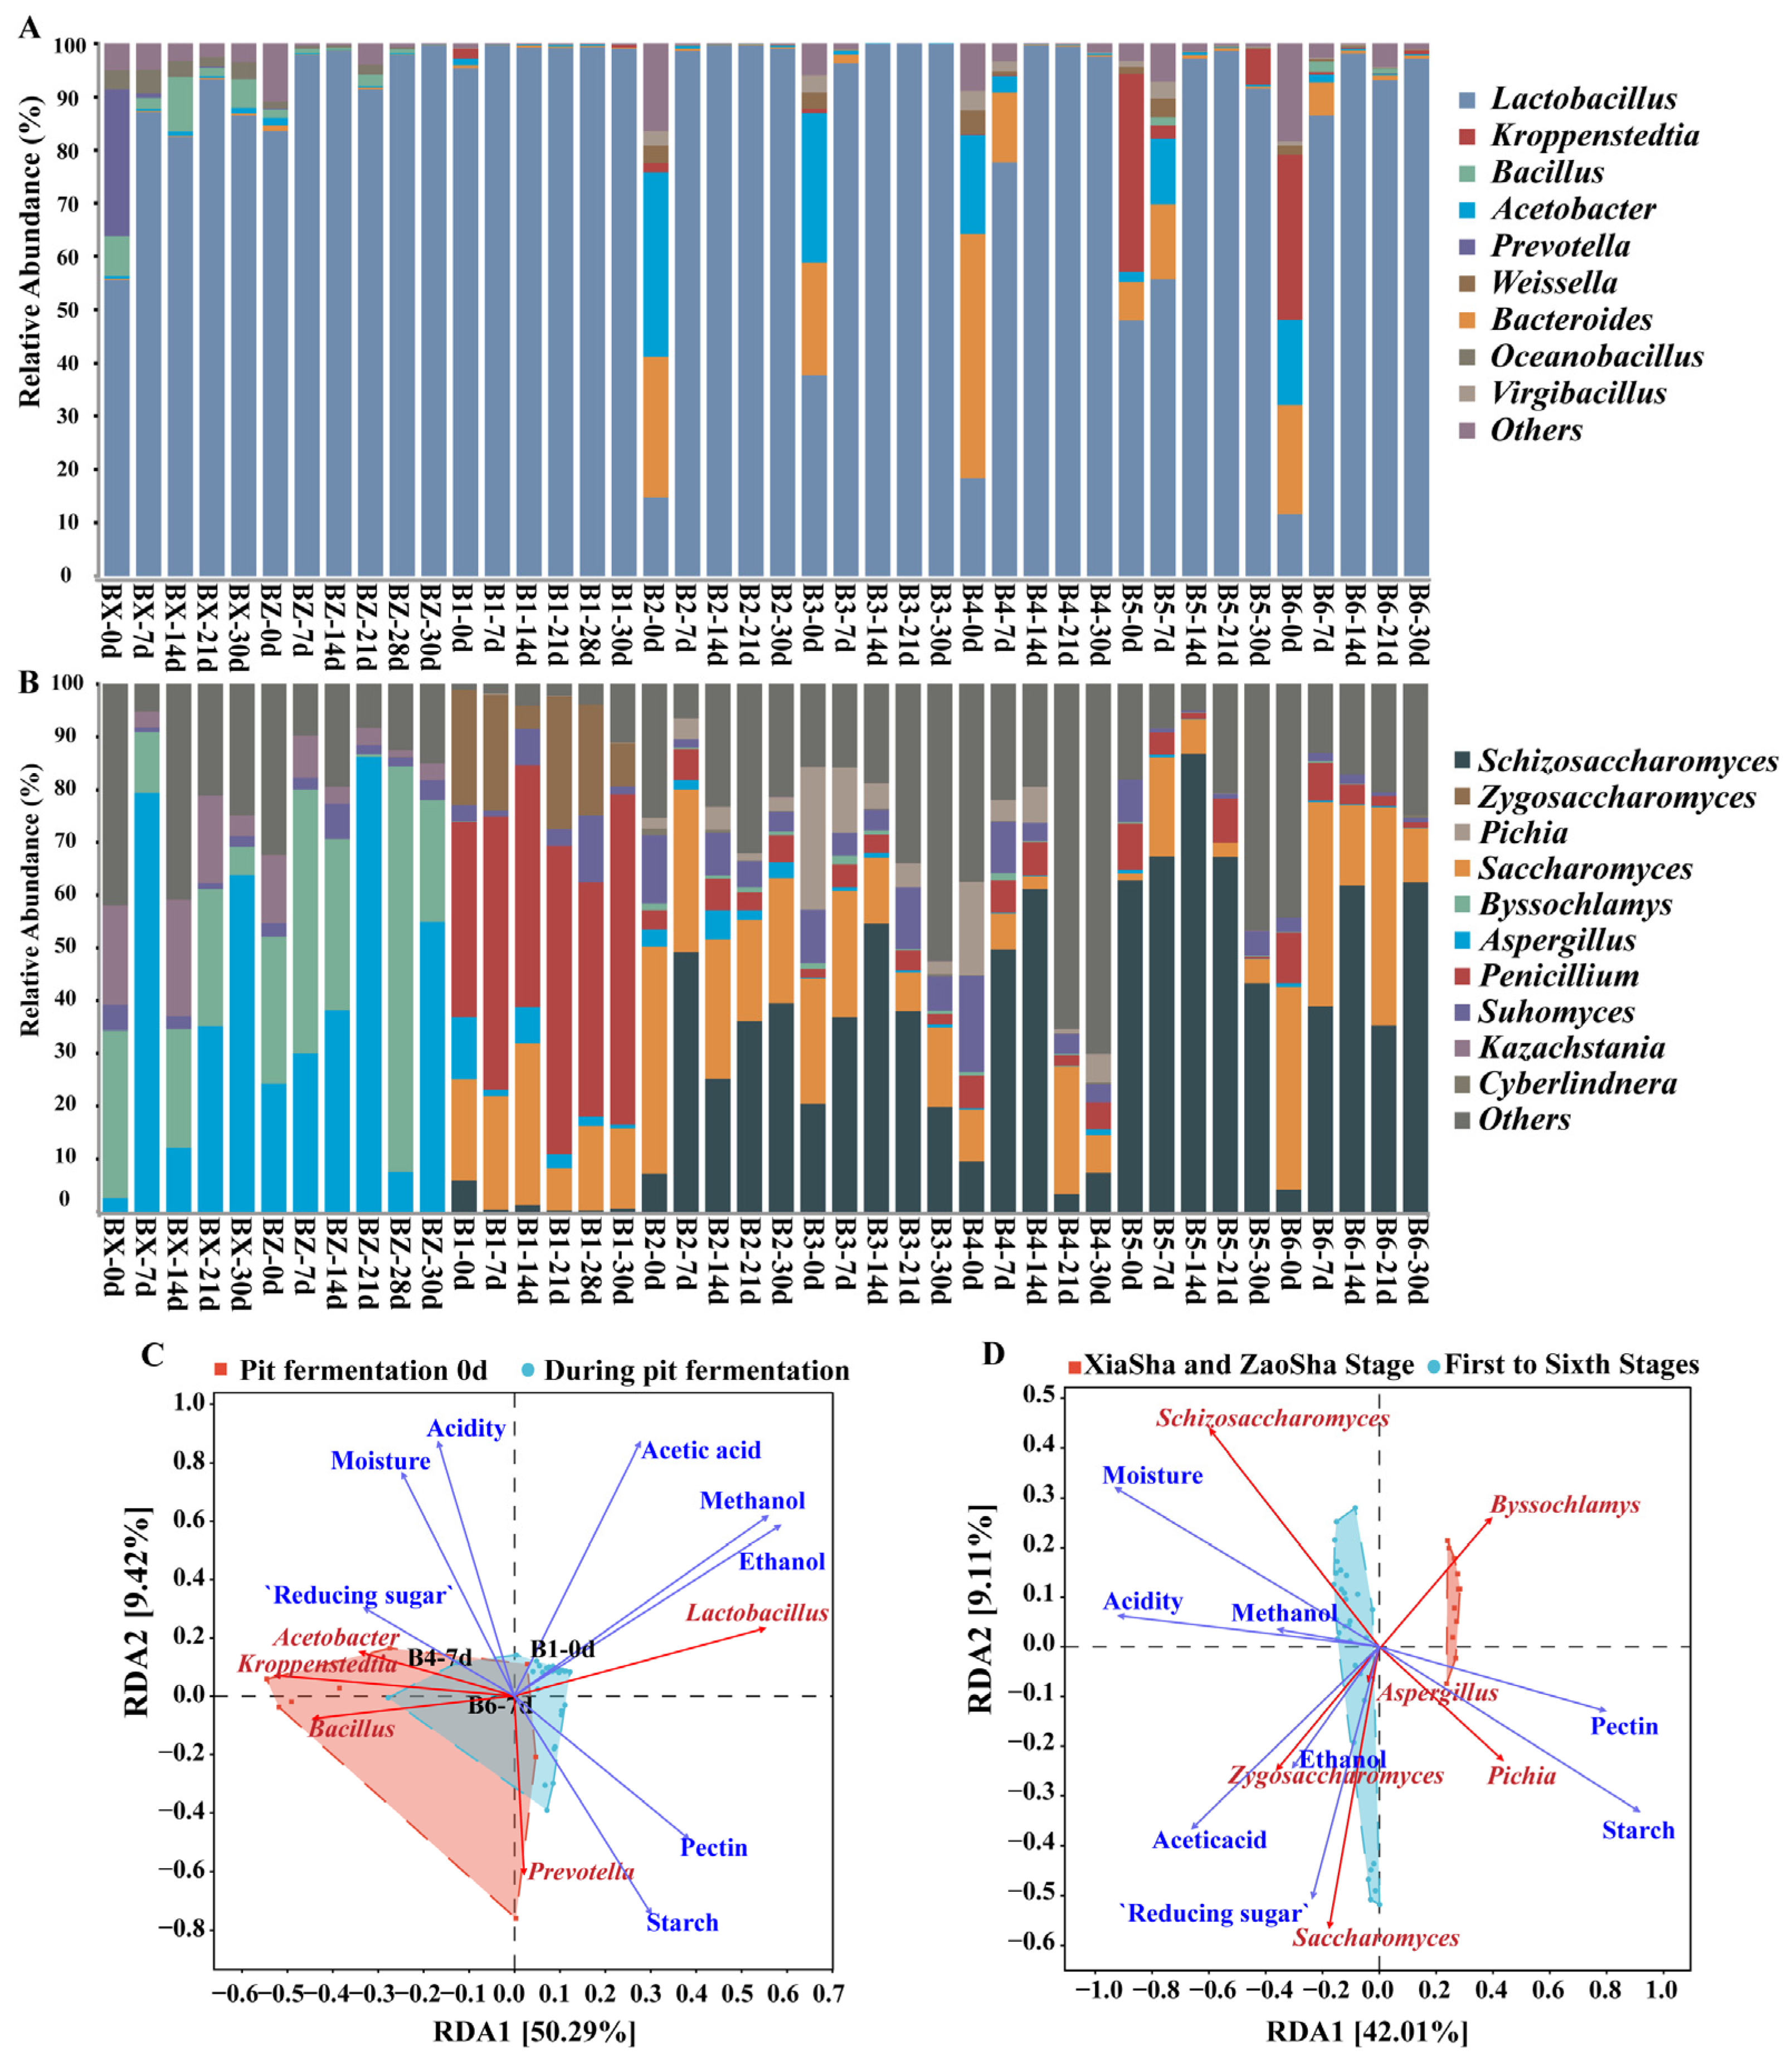
3.4. Microbial Succession and Driving Environmental Factors during Pit Fermentation across the Baijiu Production Cycles

After analyzing the metabolic mechanisms of methanol production in an individual stage, to comprehensively understand the impact of microorganisms during pit fermentation on the changes in methanol content throughout the production cycle, amplicon sequencing was conducted on fermented grains from all stages during the production cycle. The bar charts in Figure 7 illustrate the patterns of the microbial communities in the different stages. In terms of bacterial community composition (Figure 7A), Weissella was predominant in the Xiasha stage, whereas Kroppenstedtia and Bacillus were relatively abundant in the final second to sixth stages. Lactobacillus, a genus of lactic acid bacteria, rapidly increased in amount and became predominant in the fermented grains during pit fermentation in each stage, which is consistent with previous research [30]. Regarding the fungal community composition (Figure 7B), Saccharomyces, Pichia, and Byssochlamys were the dominant species in the Xiasha and Zaosha stages, whereas Schizosaccharomyces and Zygosaccharomyces were present in relatively large proportions in the second to sixth stages.
Using redundancy analysis to analyze the driving factors of microbial community succession during pit fermentation (Figure 7C,D), Lactobacillus, in the bacterial community, was observed to be positively correlated with the content of methanol and ethanol, whereas other dominant bacteria showed a negative correlation with the methanol content. In the fungal community, Pichia and Byssochlamys were negatively correlated with methanol exposure, whereas Aspergillus and Schizosaccharomyces were positively correlated with it. Acetic acid and acidity had significant effects on the succession of the fungal communities. Notably, the accumulation of acid and methanol in both bacterial and fungal communities showed a positive correlation. Additionally, there was a significant difference in the composition of bacteria between day zero and the other days of fermentation, whereas the difference in fungal composition was more significant between the Xiasha and the Zaosha stages and from the first to the sixth stage. An ANOSIM test was performed for bacterial and fungal grouping (Figure S2A,B), calculating the distances between all pairs of samples using the Bray–Curtis algorithm and sorting all distances from small to large. The results showed significant inter-group differences in both the bacterial and the fungal communities.

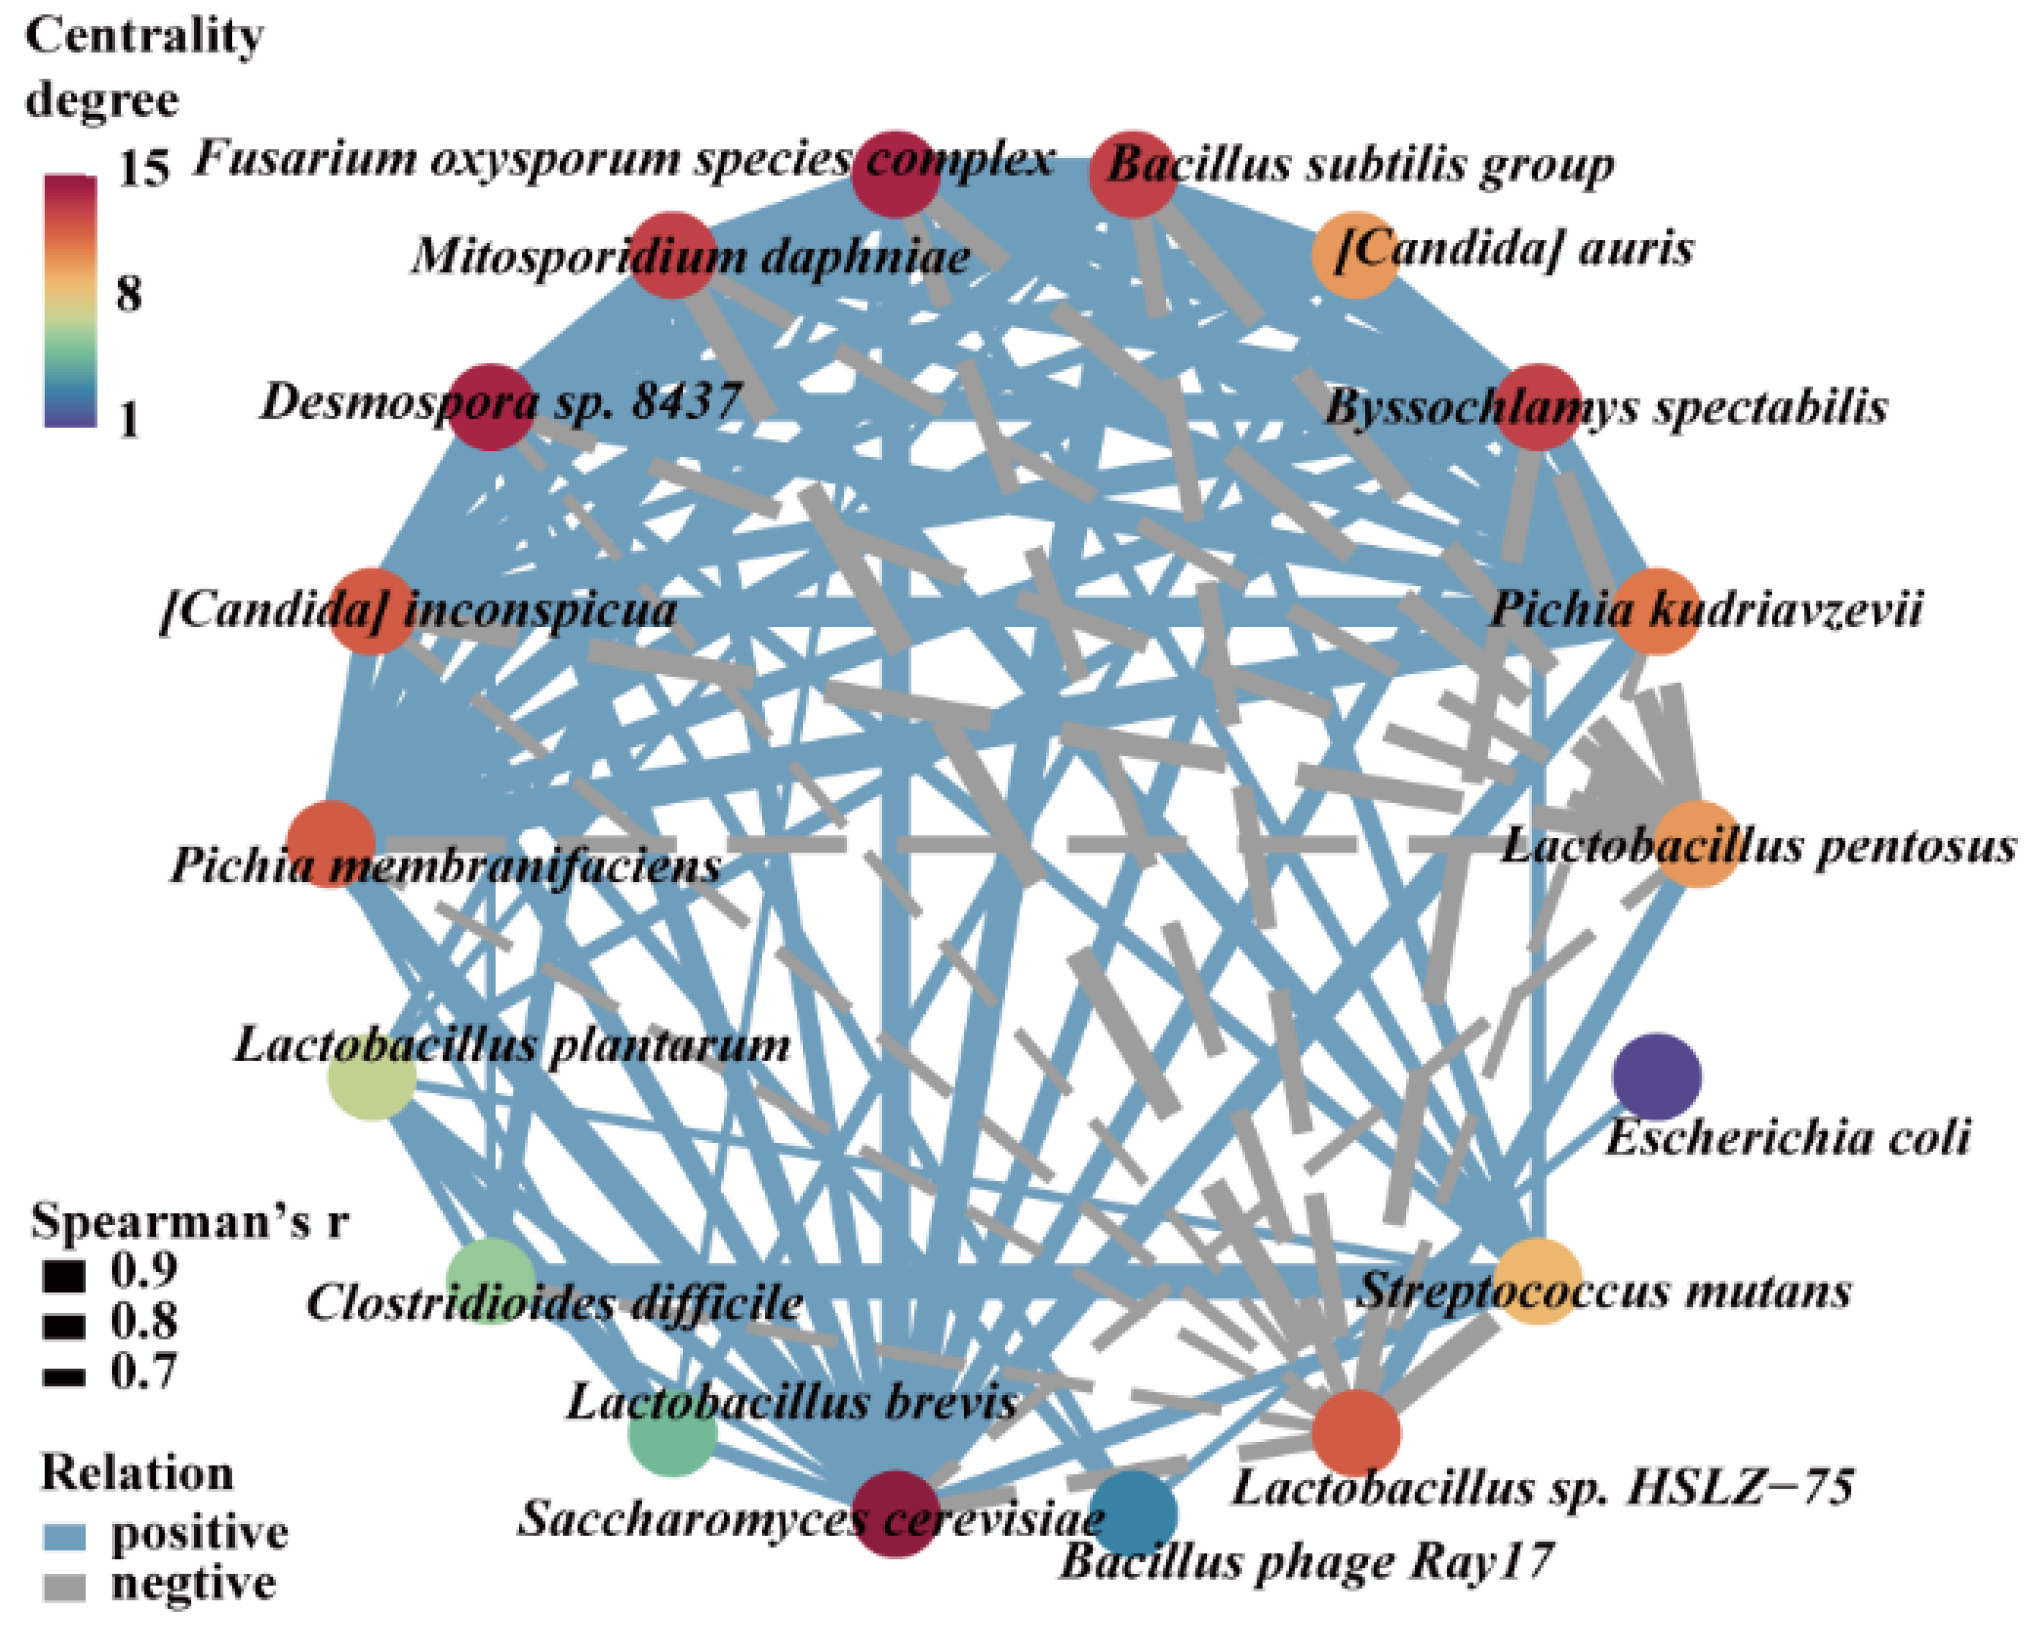
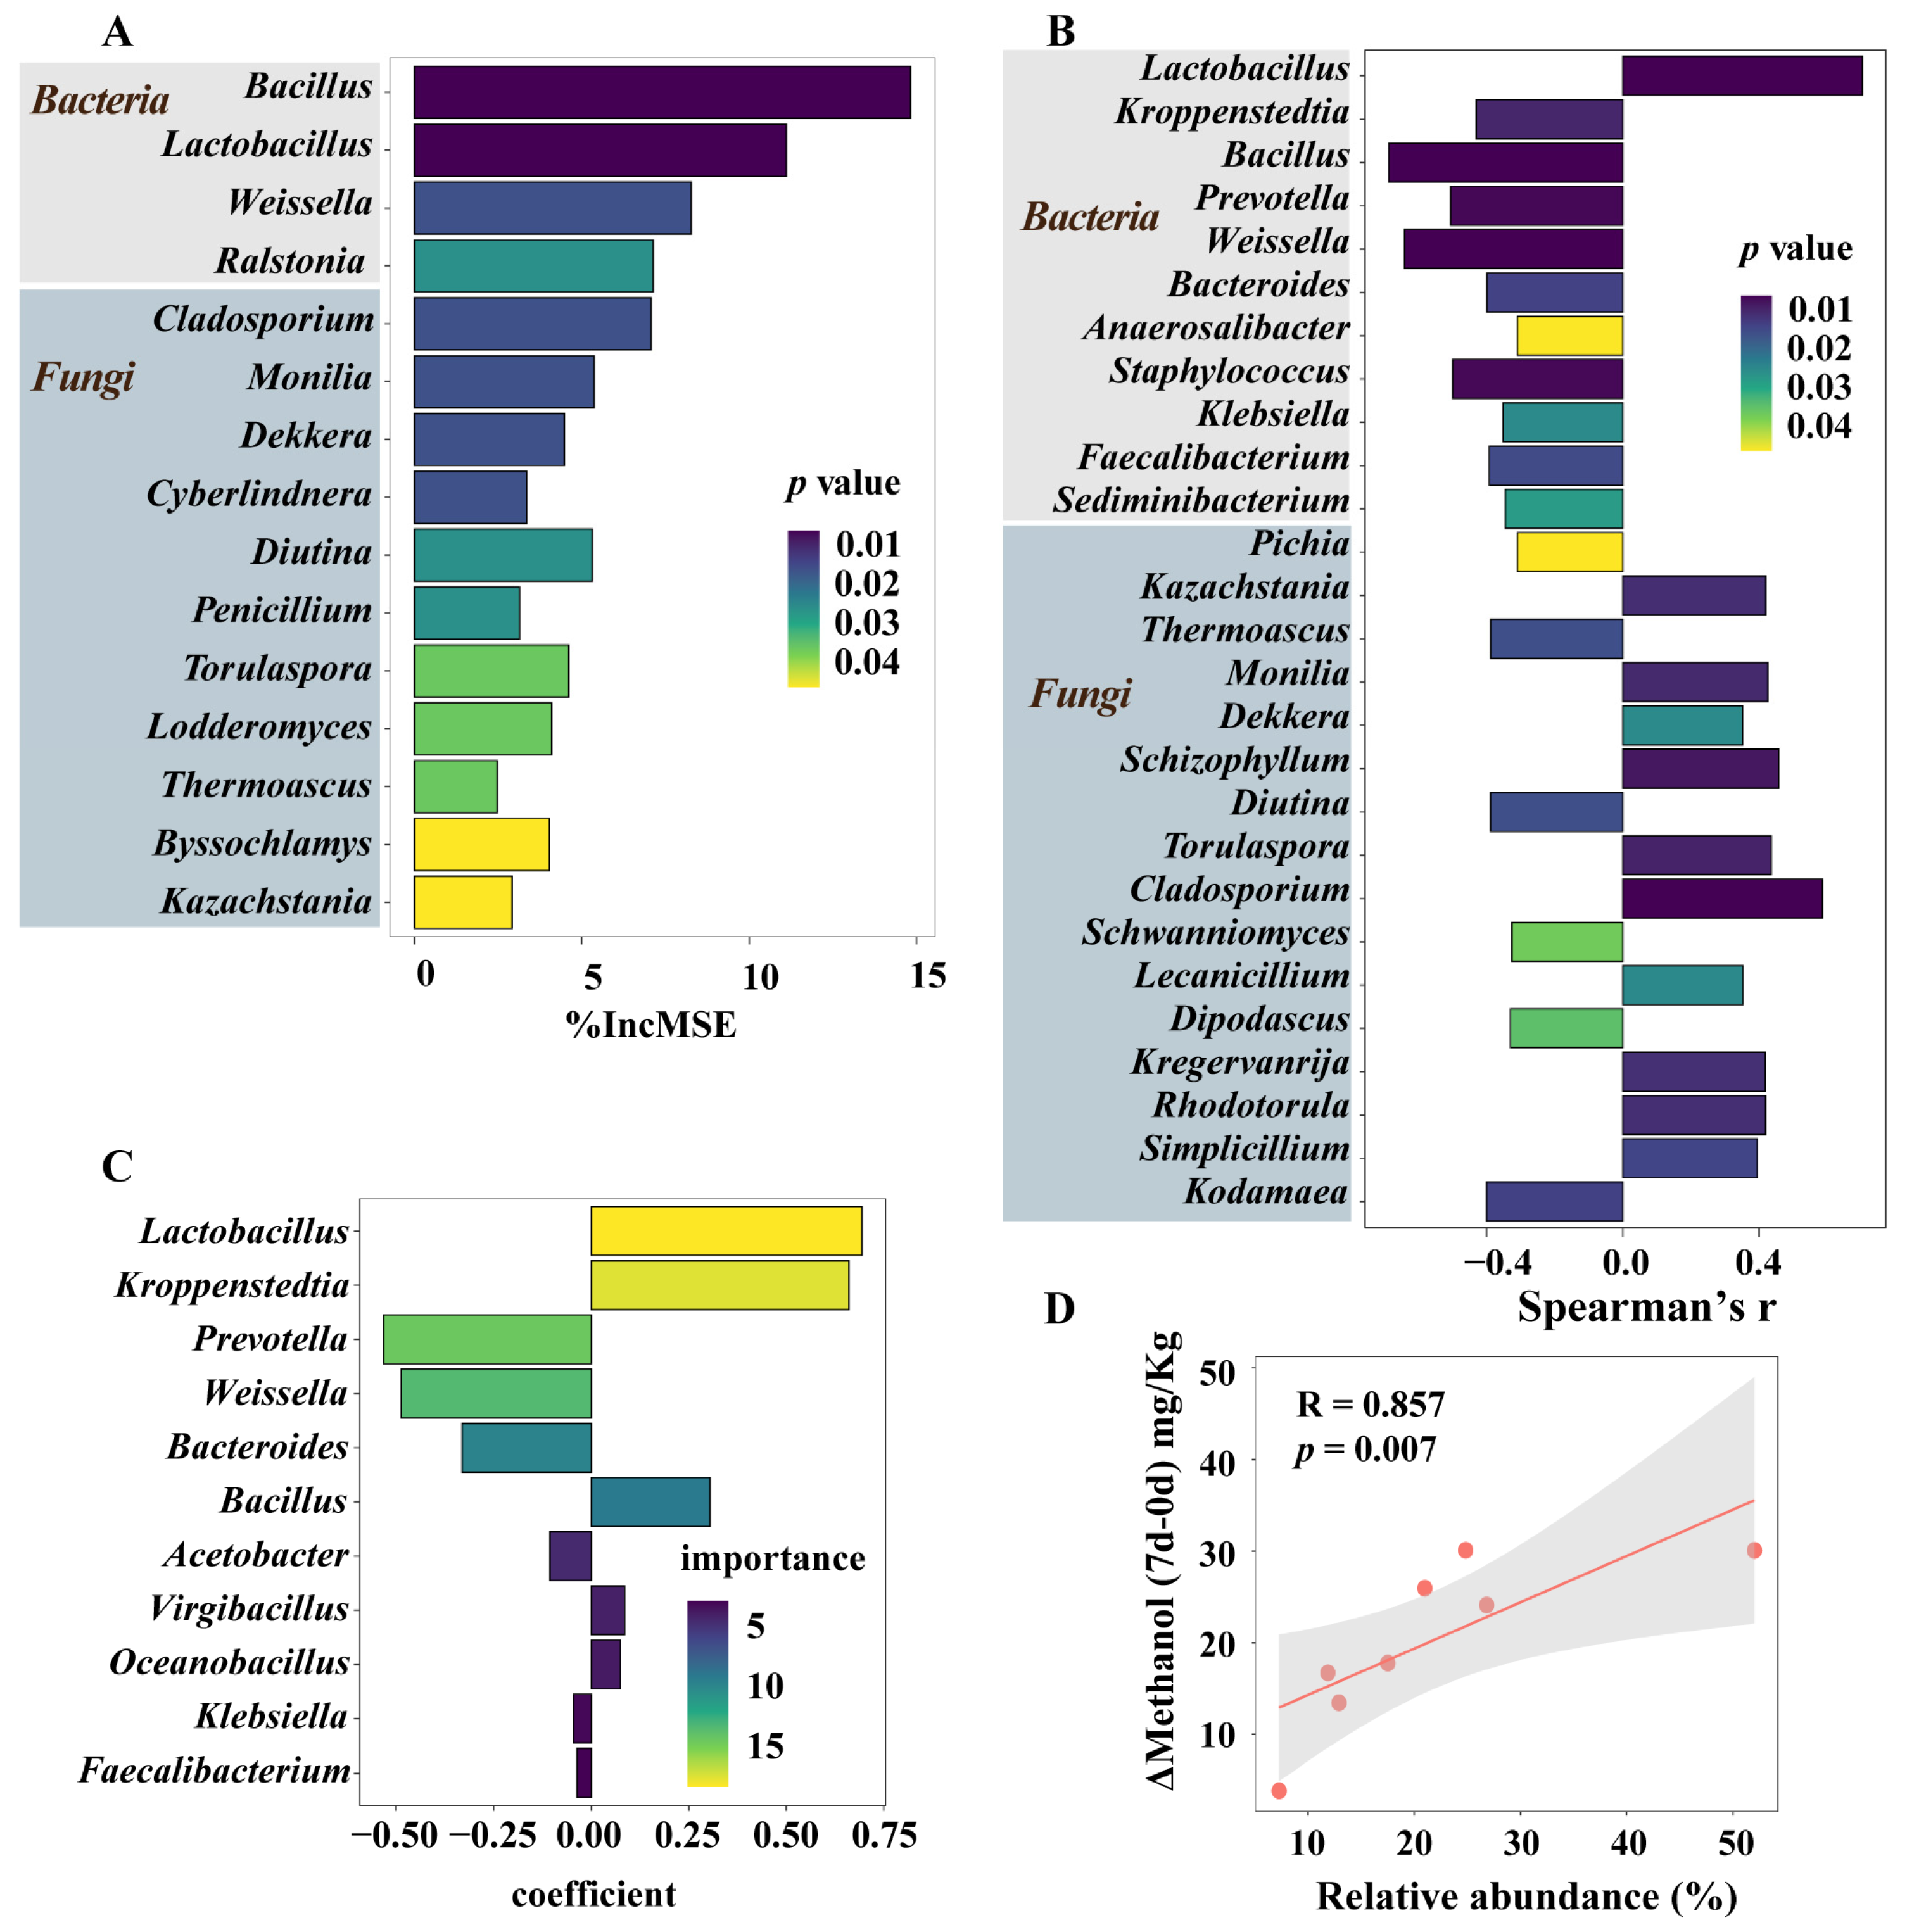
3.5. Microorganisms Having a Significant Impact on Methanol Accumulation during Pit Fermentation across the Baijiu Production Cycles

We analyzed the microorganisms involved in methanol metabolism within an individual stage through metagenomic and metatranscriptomic sequencing, but differences in microbial composition between different stages may introduce other microorganisms that could influence the methanol content. In this study, three statistical methods were employed to analyze the microorganisms associated with the changes in methanol content during pit fermentation in the production cycle.
Random forest is a supervised nonlinear predictive model commonly used to predict the correlation between microbial composition and environmental factors [31]. Using this model, bacteria, such as Lactobacillus and Bacillus, which may significantly influence the methanol content, were identified (Figure 8A). Bacillus, which utilizes pectin for methanol production, and Lactobacillus, along with Weissella, are associated with acid metabolism, potentially affecting methanol accumulation indirectly by influencing the accumulation of acids. In the fungal community, certain yeast and mold species such as Cladosporium and Monilia were found to have a potential impact on the methanol content. Aspergillus and Saccharomyces are known for their ability to produce methanol through pectin degradation modules.
Spearman’s correlation analysis was performed on the abundance of microbial genera and methanol content in the production cycle (Figure 8B). Among the bacterial communities, only Lactobacillus significantly promoted methanol production. For the fungi, some microorganisms, including yeasts such as Monilia and molds such as Cladosporium, overlapped with the random forest model predictions, confirming their potential influence on methanol content. Notably, Pichia showed a negative correlation with methanol content, possibly due to its utilization of methanol by alcohol oxidase [32]. A correlation between microorganisms in both the bacterial community (Figure S3) and the fungal community (Figure S4) was also observed. In the bacterial community, Lactobacillus and most other bacteria were negatively correlated, whereas Bacillus was mostly positively correlated with most other bacteria. In the fungal community, Pichia was significantly positively correlated with Byssochlamys, which is consistent with the metatranscriptomic results.
PLSR is a multivariate statistical method that addresses collinearity issues, simultaneously analyzes multiple dependent variables, and is useful for studying relationships with small sample sizes. Orthogonal partial least squares with discriminant analysis (O2PLS-DA) based on PLSR is often applied for dimensionality reduction and correlation analysis of microbial communities or flavor substances [33]. Using PLSR, we analyzed the microorganisms that significantly influenced the changes in methanol content during the production cycle (Figure 8C). In the bacterial community, Lactobacillus and Kroppenstedtia had a considerable impact on the methanol content, both with a promoting effect. However, when modeling fungal abundance and methanol content, the maximum R2 value remained small, indicating a poor fit (Figure S5C). Therefore, this method is unsuitable for predicting the relationship between fungal communities and methanol production.
By Combining the results of the three statistical methods, we found that the accumulation of Lactobacillus significantly promoted methanol production. Additionally, Bacillus positively affected methanol accumulation. Certain yeast and mold species may have an influence on methanol content, such as Cladosporium and Monilia.
The initial microbial community structure during pit fermentation significantly affects the fermentation process [34]. Spearman’s correlation analysis was conducted between the initial abundance of the methanol-producing microorganisms, Pichia, Saccharomyces, Aspergillus, and Penicillium, and the corresponding methanol production within the first 7 d. The analysis revealed a significant positive correlation, indicating that different initial concentrations of methanol-producing microorganisms may lead to differences in methanol content between stages.

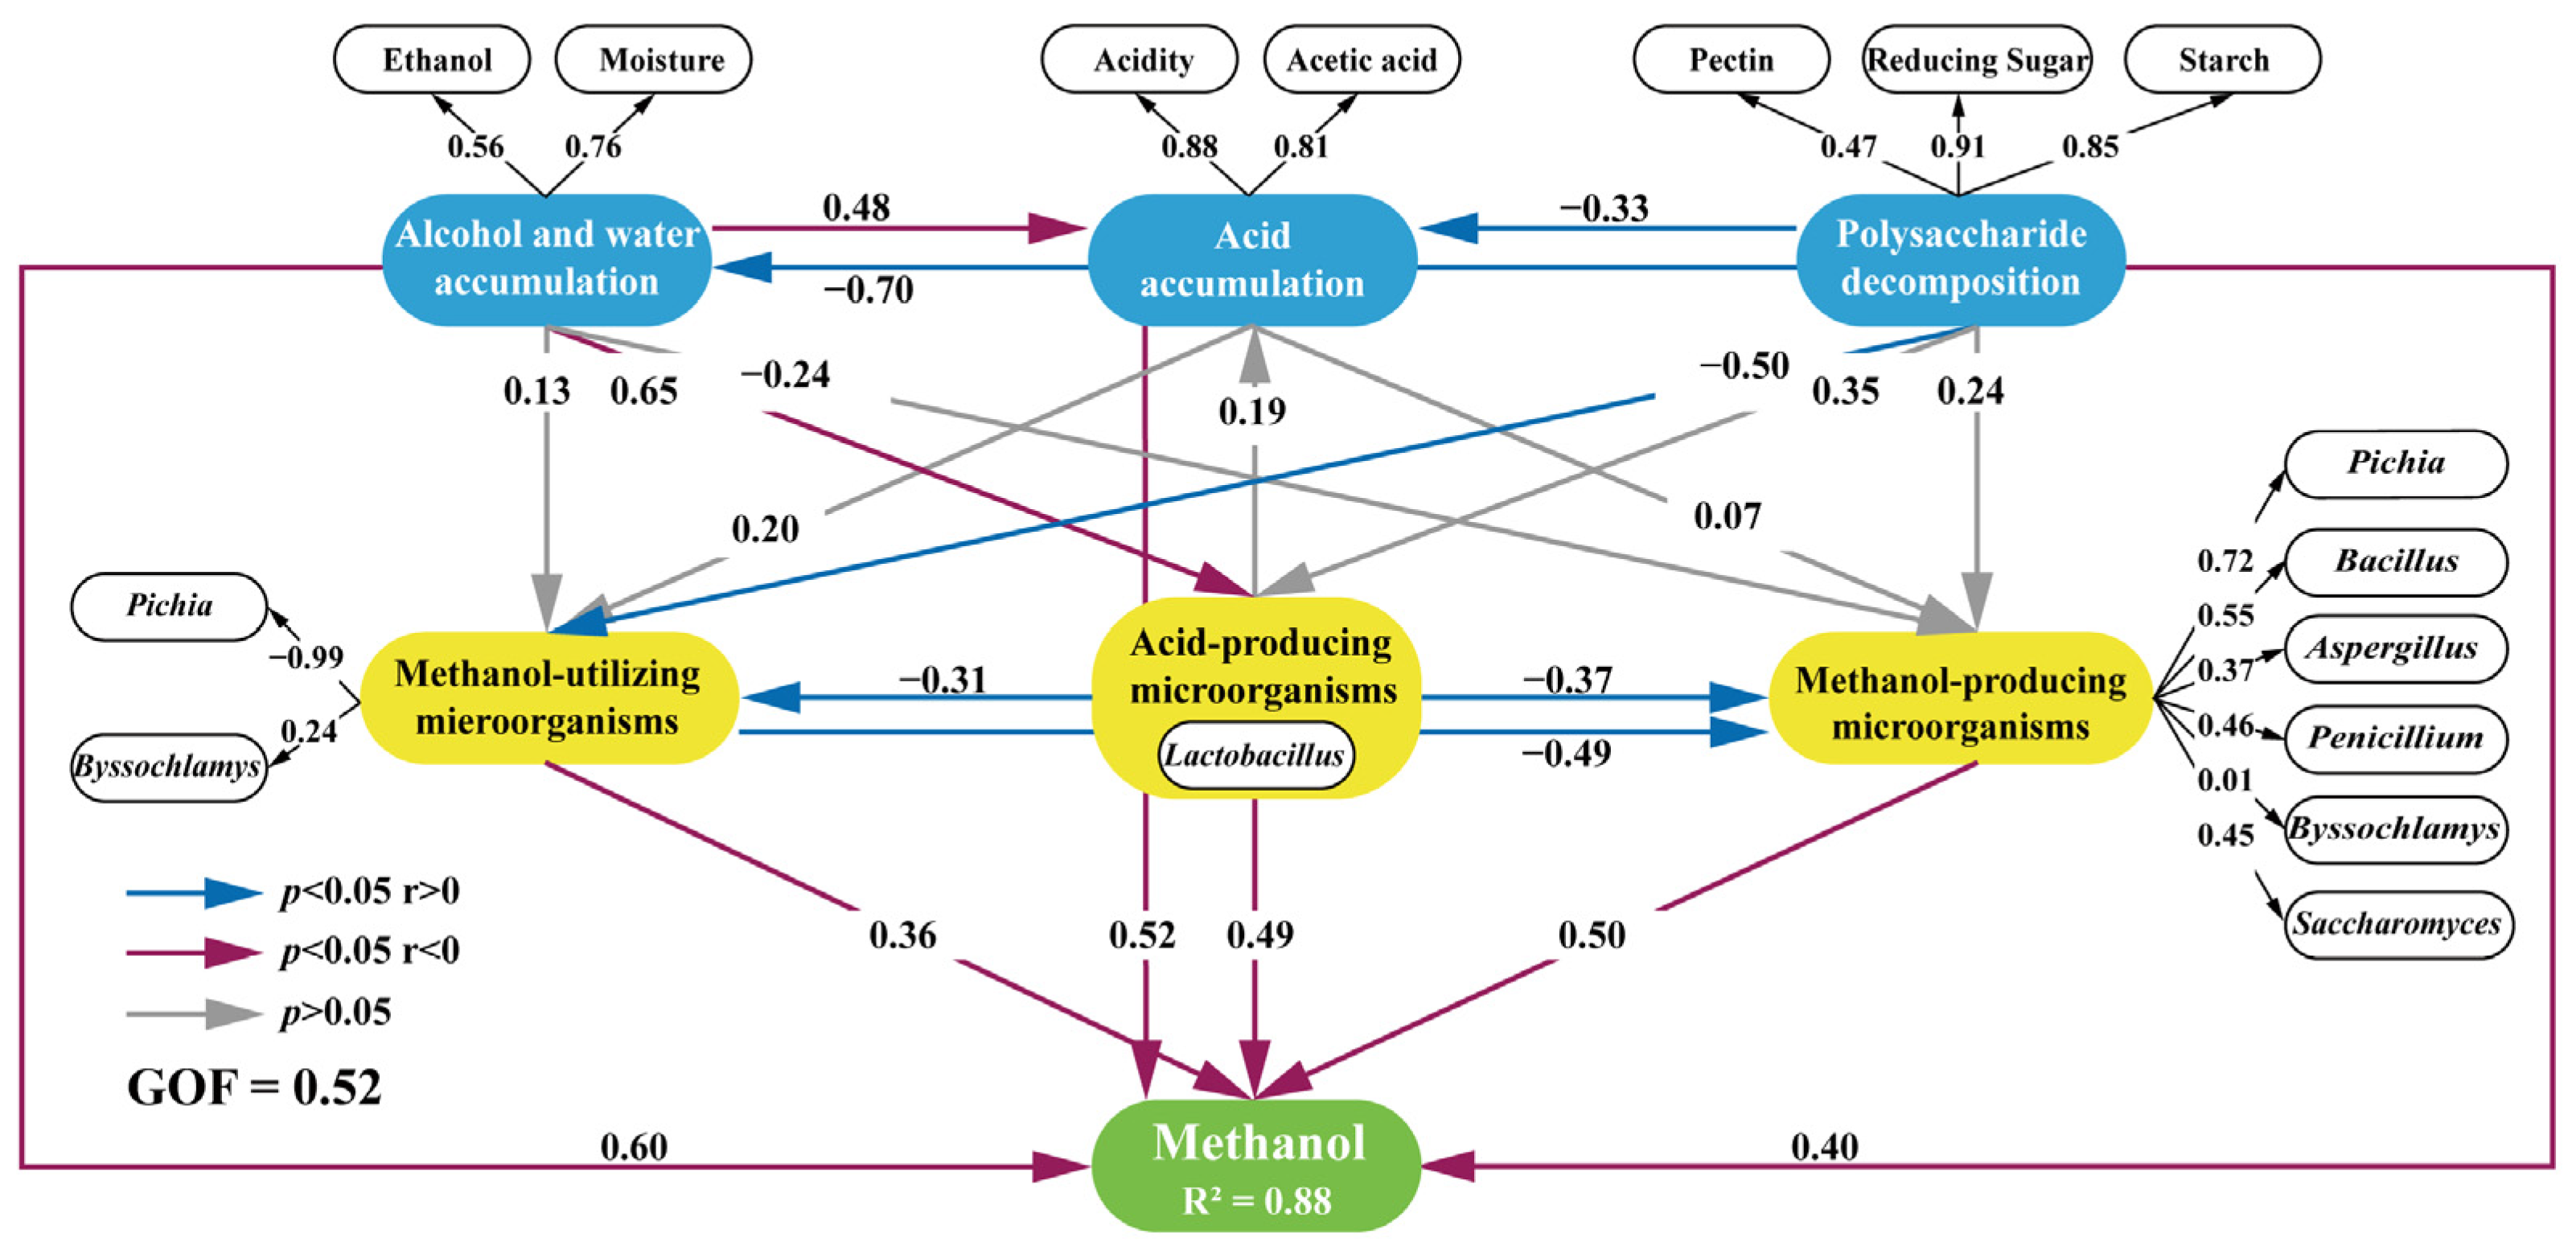
3.6. Integrated Impact of Environmental Factors and Microorganisms on Methanol Content Changes during Pit Fermentation across the Baijiu Production Cycles

PLS-PM is an extension of PLSR, which is commonly used in microbial research to study the impact of environmental factors on a community structure and downstream effects on other factors [35]. To explore the comprehensive effects of environmental factors and methanol-metabolizing microorganisms on the changes in methanol content during the production cycle of pit fermentation, we validated PLS-PM for the first to the sixth stages, considering the relative abundances of methanol-metabolizing microorganisms, environmental factors, and methanol content (Figure 9). The R2 of the methanol module reached 0.88, indicating that environmental factors and microorganisms related to methanol metabolism had a relatively high explanatory power for the observed changes in methanol content.
Regarding the influence of environmental factors on microorganisms, the polysaccharide decomposition module had a significant inhibitory effect on microorganisms when methanol was used. The accumulation of ethanol and moisture promotes the production of Lactobacillus. In terms of the interaction between acid-producing microorganisms and methanol-metabolizing microorganisms, acid-producing microorganisms exhibited inhibitory effects on methanol-metabolizing microorganisms, and a significant negative correlation was observed between methanol-consuming microorganisms and methanol-producing microorganisms, overall. Regarding the impact of environmental factors and microorganisms on the methanol content, various environmental factors and microorganisms had a significant promoting effect on methanol production. The overall contribution of methanol-consuming microorganisms, including Pichia and Byssochlamys, to methanol production was 0.36, possibly because of the stronger ability of Pichia to generate methanol via the butyrate metabolic pathway. Pichia also produces methanol by breaking down pectin using pectinesterase [36]. The overall contribution of methanol-producing microorganisms, including Pichia with the highest contribution (0.72), was 0.5, indicating a substantial impact on methanol production.

4. Discussion

As the major component of fermented grains, the chemical components in of sorghum have an impact on the flavor and quality of Baijiu [37,38], and chaff as an adjunct has an impact on the formation of the furfural flavor of Baijiu [39]. In this study, we noticed that there was a correlation between pectin degradation and methanol production in sorghum and chaff. From the perspective of Baijiu production, the main component of the fermented grains in the Xiasha stage was sorghum. In this stage, there may have been a gradual dissociation process of pectin from the sorghum cell walls, resulting in a gradually increasing trend. Simultaneously, as pectin did not completely dissociate from the cell walls, the amount of decomposed pectin was relatively low, leading to a significantly lower methanol production in the Xiasha stage than in the other stages. Additionally, both the sorghum added to the Xiasha stage and the chaff added to the final six stages contained pectin, which may have caused fluctuations in the pectin content across stages.
In this study, we found that the accumulation of methanol during pit fermentation was mainly through the degradation of pectin and the hydrolysis of methyl acetate. Previous studies showed that Bacillus is an important component of the bacterial community of fermented grains, with the ability to utilize polysaccharides and metabolic flavor substances [40,41] and to degrade pectin [42]. In addition, during brewing and in the presence of the starter culture of fermented grains Daqu, there were many strains of Penicillium and Aspergillus with strong pectinase activity [43,44]. The methyl acetate hydrolysis pathway, which involves metabolite transfer between lactic acid bacteria, methyl-metabolizing microorganisms, and Pichia kudriavzevii, was not reported in previous studies and still needs to be verified by solid-state simulated fermentation. In addition, we identified a methanol consumption pathway with Byssochlamys spectabilis as the main player, which was found to have the ability to produce amylhydrolase enzymes in previous studies [45], while its ability to utilize methanol has not been described and still needs to be verified.
By analyzing environmental factors in pit fermentation across the Baijiu production cycles, we observed a gradual utilization of polysaccharides such as starch and pectin in the fermented grains during the production cycle, accompanied by an increase in moisture content and acidity. Acid plays a crucial regulatory role in the Baijiu fermentation process [46]. Through redundancy analysis and PLS-PM analysis, we found a strong correlation between acid accumulation and methanol accumulation. Additionally, the abundance of Lactobacillus, which significantly increased, leading to the predominance of this species in the first seven days, was identified as highly correlated with changes in methanol content in various analyses. In fact, the activity of pectinase was detected in each stage of pit fermentation by Dai et al. [47], revealing an increasing trend during heap and pit fermentation, while pectin methylesterase often exhibits better activity in acidic environments [9]. We speculate that acid accumulation may be one of the factors through which acidity affects methanol accumulation.
Furthermore, many fungi, represented by Cladosporium and Monilia, were correlated with changes in methanol content during Baijiu fermentation. Previous studies showed that many yeasts and molds can metabolize pectinase [6]. Considering that the microorganisms involved in the three methanol metabolism pathways were mostly fungi, it was inferred that the predominant microorganisms regulating the methanol content during fermentation are fungi, with species such as Pichia kudriavzevii and Byssochlamys spectabilis playing crucial roles.

5. Conclusions

Methanol is a common harmful substance produced during the fermentation process of alcoholic beverages. Clearly, understanding its mechanisms of production and influencing factors in Baijiu fermentation is of crucial importance to ensure the safety of Baijiu consumption. In this study, we first compared the changes in methanol content during heap and pit fermentation and observed that methanol production occurred mostly during pit fermentation, with the highest increase occurring in the first 7 days of each stage. The methanol content in each stage initially increased and subsequently decreased over the production cycle, reaching its highest overall level in the fourth stage. Subsequently, through metagenomic and metatranscriptomic sequencing and analysis, we also discovered that methanol metabolism within the first stage was mainly concentrated during the first 7 days. The major methanol metabolic pathways included butyrate and methane metabolism and pectin degradation. The microorganisms involved included Pichia kudriavzevii, Byssochlamys spectabilis, Penicillium, and Aspergillus. Finally, through amplicon sequencing and analysis, Lactobacillus was observed to accumulate significantly during the first 7 days of each stage, inhibiting methanol-metabolizing microorganisms. However, the increase in acidity caused by its metabolic activity might provide a more favorable environment for the microbial metabolism of pectinesterase, thereby promoting methanol production. As for the fungal communities, certain types of molds and yeasts were found to be involved in methanol production, and differences in their abundance in the fermented grains in different stages led to variations in methanol content between stages. This study contributes to the understanding of the mechanism of methanol accumulation in Baijiu and provides a basis for regulating the methanol content in Baijiu.

Supplementary Materials

The following supporting information can be downloaded at: https://www.mdpi.com/article/10.3390/fermentation10040175/s1, Figure S1: A: Characteristic peak of the methanol retention time. B: Characteristic peak of the galacturonic acid m/z ratio. Figure S2: A: ANOSIM test for 16S grouping. B: ANOSIM test for ITS grouping (the “R” value was used to validate whether there were differences between different groups; the larger the R, the greater the differences between groups. The “p” value indicates the significance of the differences, with p < 0.05 indicating a significant correlation). Figure S3: Spearman’s correlation analysis of methanol and bacteria (with the sum of all samples’ relative abundance greater than 0.5%). Correlation matrix (Spearman test, p ≤ 0.05) showing the correlation coefficients between methanol content and bacteria genera. Positive correlations are displayed in blue, and negative correlations in red. The color intensity and size of the squares are proportional to the correlation coefficients. On the right side of the correlogram, the legend shows the correlation coefficients and the corresponding colors. Figure S4: Spearman’s correlation analysis of methanol and fungi (with the sum of all samples’ relative abundance greater than 0.5%). Correlation matrix (Spearman test, p ≤ 0.05) showing the correlation coefficients between the methanol content and fungal genera. Positive correlations are displayed in blue, and negative correlations in red. The color intensity and the size of the squares are proportional to the correlation coefficients. On the right side of the correlogram, the legend shows the correlation coefficients and the corresponding colors. Figure S5: The major parameters for model establishment. A: The use of random forest to model the changes in microbial abundance and methanol content (% Var explained represents the degree of explanation of the changes in the abundance of microbial communities in relation to the changes in methanol content). B: The analysis of bacterial abundance and methanol content changes by PLS regression (the number of components represents the number of selected principal components, MSEP is the predicted mean square error of the regression model—the larger the MSEP value, the greater the regression error—R2 is used to evaluate the degree of regression fit—the larger the R2 value, the better the regression fit). Table S1: Compound identification for methanol content detection. Table S2: The corresponding enzyme names for KOs related to methanol metabolism.

Author Contributions

Conceptualization, software, formal analysis, data curation, visualization, T.L. and Q.C.; investigation, Q.C.; writing—original draft preparation, T.L.; methodology, resources, validation, project administration, F.Y., J.L. (Jianjun Lu) and X.Z.; funding acquisition, supervision, writing—review and editing, J.L. (Jianghua Li), G.D., H.T. and Y.L. All authors have read and agreed to the published version of the manuscript.

Funding

This study was financially supported by the Guizhou Science and Technology Support Program, Grant/Award Number Qian Ke He [2022] 021.

Institutional Review Board Statement

Not applicable.

Informed Consent Statement

Not applicable.

Data Availability Statement

All data supporting the findings of this study are available within the paper and its Supplementary Materials. The datasets generated and analyzed during the current study are also available from the corresponding author upon request.

Conflicts of Interest

Authors Qingqing Cao, Fan Yang, Jianjun Lu, Xianglian Zeng, and HuabinTu were employed by Kweichow Moutai Distillery Co., Ltd. The authors declare that they have no competing financial interest or personal relationships that may have influenced the work reported in this study.

References

  1. Gurler, M.; Martz, W.; Tastekin, B.; Najafova, T.; Dettmeyer, R.B. Estimates of Non-Alcoholic Food-Derived Ethanol and Methanol Exposure in Humans. J. Anal. Toxicol. 2022, 46, 200–210. [Google Scholar] [CrossRef] [PubMed]
  2. Arslan, M.M.; Zeren, C.; Aydin, Z.; Akcan, R.; Dokuyucu, R.; Keten, A.; Cekin, N. Analysis of methanol and its derivatives in illegally produced alcoholic beverages. J. Forensic Leg. Med. 2015, 33, 56–60. [Google Scholar] [CrossRef] [PubMed]
  3. Pang, X.-N.; Li, Z.-J.; Chen, J.-Y.; Gao, L.-J.; Han, B.-Z. A Comprehensive Review of Spirit Drink Safety Standards and Regulations from an International Perspective. J. Food Prot. 2017, 80, 431–442. [Google Scholar] [CrossRef]
  4. Ohimain, E.I. Methanol contamination in traditionally fermented alcoholic beverages: The microbial dimension. Springerplus 2016, 5, 10. [Google Scholar] [CrossRef] [PubMed]
  5. Perez Espitia, P.J.; Du, W.-X.; Avena-Bustillos, R.d.J.; Ferreira Soares, N.d.F.; McHugh, T.H. Edible films from pectin: Physical-mechanical and antimicrobial properties—A review. Food Hydrocoll. 2014, 35, 287–296. [Google Scholar] [CrossRef]
  6. Haile, S.; Ayele, A. Pectinase from Microorganisms and Its Industrial Applications. Sci. World J. 2022, 2022, 1881305. [Google Scholar] [CrossRef] [PubMed]
  7. Tsouko, E.; Maina, S.; Ladakis, D.; Kookos, I.K.; Koutinas, A. Integrated biorefinery development for the extraction of value-added components and bacterial cellulose production from orange peel waste streams. Renew. Energy 2020, 160, 944–954. [Google Scholar] [CrossRef]
  8. Blumenthal, P.; Steger, M.C.; Einfalt, D.; Rieke-Zapp, J.; Bellucci, A.Q.; Sommerfeld, K.; Schwarz, S.; Lachenmeier, D.W. Methanol Mitigation during Manufacturing of Fruit Spirits with Special Consideration of Novel Coffee Cherry Spirits. Molecules 2021, 26, 2585. [Google Scholar] [CrossRef]
  9. Salas-Tovar, J.A.; Flores-Gallegos, A.C.; Contreras-Esquivel, J.C.; Escobedo-Garcia, S.; Morlett-Chavez, J.A.; Rodriguez-Herrera, R. Analytical Methods for Pectin Methylesterase Activity Determination: A Review. Food Anal. Methods 2017, 10, 3634–3646. [Google Scholar] [CrossRef]
  10. Mizutani, O.; Kakizono, D.; Takahashi, T.; Mukai, N.; Fukuda, H.; Yamada, O. The effect of Aspergillus luchuensis pectin methylesterase genes pmeA and pmeB on methanol production in sweet potato shochu. Biosci. Biotechnol. Biochem. 2023, 87, 777–785. [Google Scholar] [CrossRef]
  11. Wei, X.; Francoise, U.; Qin, M.; Chen, Q.; Li, Y.; Sun, X.; Fang, Y.-L. Effects of different fermentation and storage conditions on methanol content in Chinese spine grape (Vitis davidii Foex) wine. CyTA-J. Food 2020, 18, 367–374. [Google Scholar] [CrossRef]
  12. Jin, G.; Zhu, Y.; Xu, Y. Mystery behind Chinese liquor fermentation. Trends Food Sci. Technol. 2017, 63, 18–28. [Google Scholar] [CrossRef]
  13. Wang, L. Research trends in Jiang-flavor baijiu fermentation: From fermentation microecology to environmental ecology. J. Food Sci. 2022, 87, 1362–1374. [Google Scholar] [CrossRef] [PubMed]
  14. Tu, W.; Cao, X.; Cheng, J.; Li, L.; Zhang, T.; Wu, Q.; Xiang, P.; Shen, C.; Li, Q. Chinese Baijiu: The Perfect Works of Microorganisms. Front. Microbiol. 2022, 13, 57. [Google Scholar] [CrossRef]
  15. Ji, X.; Zhang, L.; Yu, X.; Chen, F.; Guo, F.; Wu, Q.; Xu, Y. Selection of initial microbial community for the alcoholic fermentation of sesame flavor-type baijiu. Food Res. Int. 2023, 172, 113141. [Google Scholar] [CrossRef]
  16. Song, Z.; Du, H.; Zhang, Y.; Xu, Y. Unraveling Core Functional Microbiota in Traditional Solid-State Fermentation by High-Throughput Amplicons and Metatranscriptomics Sequencing. Front. Microbiol. 2017, 8, 1294. [Google Scholar] [CrossRef] [PubMed]
  17. Liu, X.; Ma, D.; Yang, C.; Yin, Q.; Liu, S.; Shen, C.; Mao, J. Microbial community succession patterns and drivers of Luxiang-flavor Jiupei during long fermentation. Front. Microbiol. 2023, 14, 1109719. [Google Scholar] [CrossRef]
  18. Xu, Y.; Zhao, J.; Liu, X.; Zhang, C.; Zhao, Z.; Li, X.; Sun, B. Flavor mystery of Chinese traditional fermented baijiu: The great contribution of ester compounds. Food Chem. 2022, 369, 130920. [Google Scholar] [CrossRef]
  19. Tan, Y.; Zhong, H.; Zhao, D.; Du, H.; Xu, Y. Succession rate of microbial community causes flavor difference in strong-aroma Baijiu making process. Int. J. Food Microbiol. 2019, 311, 108350. [Google Scholar] [CrossRef] [PubMed]
  20. Jiang, J.; Liu, Y.; Li, H.; Yang, Q.; Wu, Q.; Chen, S.; Tang, J.; Xu, Y. Modeling and Regulation of Higher Alcohol Production through the Combined Effects of the C/N Ratio and Microbial Interaction. J. Agric. Food Chem. 2019, 67, 10694–10701. [Google Scholar] [CrossRef]
  21. Bolger, A.M.; Lohse, M.; Usadel, B. Trimmomatic: A flexible trimmer for Illumina sequence data. Bioinformatics 2014, 30, 2114–2120. [Google Scholar] [CrossRef]
  22. Guo, Y.; Li, C.-I.; Ye, F.; Shyr, Y. Evaluation of read count based RNAseq analysis methods. BMC Genom. 2013, 14, S2. [Google Scholar] [CrossRef]
  23. Buchfink, B.; Xie, C.; Huson, D.H. Fast and sensitive protein alignment using DIAMOND. Nat. Methods 2015, 12, 59–60. [Google Scholar] [CrossRef] [PubMed]
  24. Han, Y.; Du, J. Relationship of the methanol production, pectin and pectinase activity during apple wine fermentation and aging. Food Res. Int. 2022, 159, 111645. [Google Scholar] [CrossRef] [PubMed]
  25. Chai, L.; Qian, W.; Zhong, X.; Lu, Z.; Zhang, X.; Wang, S.; Shen, C.; Shi, J.; Xu, Z. Distribution of archaeal community in the mud pit during strong-flavor baijiu fermentation. Sheng Wu Gong Cheng Xue Bao = Chin. J. Biotechnol. 2020, 36, 2635–2643. [Google Scholar]
  26. Xue, T.D.; Zhang, J.H.; Wang, T.R.; Bai, B.Q.; Hou, Z.X.; Cheng, J.F.; Bo, T.; Fan, S.H. Reveal the microbial communities and functional prediction during the fermentation of Fen-flavor Baijiu via metagenome combining amplicon sequencing. Ann. Microbiol. 2023, 73, 16. [Google Scholar] [CrossRef]
  27. Chen, C.; Xiong, Y.; Xie, Y.H.; Zhang, H.X.; Jiang, K.X.; Pang, X.N.; Huang, M.Q. Metabolic characteristics of lactic acid bacteria and interaction with yeast isolated from light-flavor Baijiu fermentation. Food Biosci. 2022, 50, 102102. [Google Scholar] [CrossRef]
  28. Luo, H.; Zeng, X.; Chen, L.; Yan, F.; Du, H.; Huang, X. Microbial intervention to reduce lactic acid in Moutai-flavor liquor brewing. Food Ferment. Ind. 2023, 49, 63–68. [Google Scholar]
  29. Xiong, J.; Li, X.; Xie, S.; Yu, P.; Chen, J. Interaction between lactic acid bacteria and yeasts in light-aroma liquor. Microbiol. China 2017, 44, 1767–1776. [Google Scholar]
  30. Hu, X.; Huang, Y.; Tu, H.; Hu, F.; Cheng, P.; You, X. Bacterial Diversity Structure during the First Round of Pile and Pit Fermentation of Moutai-flavor Baijiu. Food Sci. 2020, 41, 175–182. [Google Scholar]
  31. Zhou, J.; Li, X.; Li, S.; Ding, H.; Lang, Y.; Xu, P.; Wang, C.; Wu, Y.; Liu, X.; Qiu, S. Airborne microorganisms and key environmental factors shaping their community patterns in the core production area of the Maotai-flavor Baijiu. Sci. Total Environ. 2023, 912, 169010. [Google Scholar] [CrossRef] [PubMed]
  32. Klepach, H.M.; Zakalskiy, A.E.; Zakalska, O.M.; Gayda, G.Z.; Smutok, O.V.; Gonchar, M.V. Alcohol Oxidase from the Methylotrophic Yeast Ogataea polymorpha: Isolation, Purification, and Bioanalytical Application. Methods Mol. Biol. 2021, 2280, 231–248. [Google Scholar] [PubMed]
  33. Pan, Y.Y.; Wang, Y.; Hao, W.J.; Zhou, S.; Duan, C.B.; Li, Q.S.; Wei, J.W.; Liu, G. Exploring the Role of Active Functional Microbiota in Flavor Generation by Integrated Metatranscriptomics and Metabolomics during Niulanshan Baijiu Fermentation. Foods 2023, 12, 4140. [Google Scholar] [CrossRef]
  34. Li, D.; Jia, F.; Wang, L.; Chang, F. The initial composition and structure of microbial community determined the yield and quality of Baijiu during the spontaneous fermentation. Int. Microbiol. 2023, 27, 143–154. [Google Scholar] [CrossRef]
  35. Yang, J.W.; Yu, Q.L.; Su, W.H.; Wang, S.J.; Wang, X.C.; Han, Q.; Qu, J.P.; Li, H. Metagenomics reveals elevated temperature causes nitrogen accumulation mainly by inhibiting nitrate reduction process in polluted water. Sci. Total Environ. 2023, 882, 163631. [Google Scholar] [CrossRef]
  36. Nakagawa, T.; Yamada, K.; Fujimura, S.; Ito, T.; Miyaji, T.; Tomizuka, N. Pectin utilization by the methylotrophic yeast Pichia methanolica. Microbiology 2005, 151, 2047–2052. [Google Scholar] [CrossRef]
  37. Du, C.; Jianlan, C.; Kejia, W.; Dounan, L.; Xiaoye, L.; Jie, C.; Shuyi, Q. Progress in understanding the effect of sorghum on the quality of maotai-flavor Baijiu. Food Sci. China 2022, 43, 356–364. [Google Scholar]
  38. Shi, W.; Zheng, H.; Chai, L.; Lu, Z.; Zhang, X.; Xu, Z. Research progress on the nutritional components and brewing performance of brewing sorghum. Food Ferment. Ind. 2022, 48, 307–317. [Google Scholar]
  39. Wei, Y.; Zhang, L.-Q.; Ran, M.-F.; Wang, S.-T.; Yang, J.-G.; Shen, C.-H. Investigation on fresh bamboo replacing rice husks for brewing light-aroma Baijiu. J. Food Sci. 2023, 88, 1224–1236. [Google Scholar] [CrossRef] [PubMed]
  40. Guo, X.; Fan, E.; Ma, B.; Li, Z.; Zhang, Y.; Zhang, Z.; Chen, Y.; Xiao, D. Research progress in functional bacteria in solid-state fermented Baijiu in China. Food Ferment. Ind. 2020, 46, 280–286. [Google Scholar]
  41. Xue, W.; Jian, L.; Qian, W.; Xueli, P.; Qifa, Z.; Wei, L.; Dewen, H.; Yang, N. Research Progress on the effect of Bacillus on flavor substances of Maotai flavor Baijiu. Food Sci. Technol. 2023, 43, e101422. [Google Scholar] [CrossRef]
  42. Liqin, Q.; Jinghao, M.; Erhao, L.; Yang, Z.; Bosi, Y.; Yuting, Z.; Qiuhua, W.; Jinying, T.; Xiuting, L.; Guangsen, F. Solation and identification of an amylase-producing bacterium from Beipai sauce-flavor Baijiu brewing environment and its characteristics research. China Brew. 2021, 40, 154–160. [Google Scholar]
  43. Zhu, L.; Yang, Q.; Jiang, W.; Li, Q.; Lin, B.; Tang, J.; Chen, S. Mold communities and enzyme activity characteristics in light-flavor Xiaoqu Baijiu. Food Ferment. Ind. 2022, 48, 70–77. [Google Scholar]
  44. Lei, X.; Zhao, D.; Zheng, J.; Qiao, Z.; Liu, D.; Zhang, X.; Li, Z. Isolation and identification of cultivable molds in the air of Baijiu-making environment of Wuliangye and their enzyme producing ability. Food Ferment. Ind. 2022, 48, 71–77. [Google Scholar]
  45. He, M.; Jin, Y.; Liu, M.; Yang, G.; Zhou, R.; Zhao, J.; Wu, C. Metaproteomic investigation of enzyme profile in daqu used for the production of Nongxiangxing baijiu. Int. J. Food Microbiol. 2023, 400, 110250. [Google Scholar] [CrossRef] [PubMed]
  46. Wu, Y.; Hou, Y.; Chen, H.; Wang, J.; Zhang, C.; Zhao, Z.; Ao, R.; Huang, H.; Hong, J.; Zhao, D.; et al. “Key Factor” for Baijiu Quality: Research Progress on Acid Substances in Baijiu. Foods 2022, 11, 2959. [Google Scholar] [CrossRef] [PubMed]
  47. Dai, Y.; Li, Z.; Tian, Z. Enzyme activity of fermented grains of sauce-flavor Baijiu and analysis of physical and chemical index of rounds Baijiu. China Brew. 2019, 38, 31–36. [Google Scholar]
Figure 1. Major fermentation stages during Baijiu production.
Fermentation 10 00175 g001
Figure 2. Changes in indicators during pit fermentation. (A): Changes in methanol content in each fermentation stage. (B): Changes in pectin content during pit fermentation. (C): The ratio of methanol content after complete pectin conversion to the actual methanol content during pit fermentation. (D): Changes in acetic acid content and acidity during pit fermentation. (E): Changes in starch and reducing sugar content during pit fermentation. (F): Changes in moisture content during pit fermentation. (G): Changes in ethanol content during pit fermentation.
Fermentation 10 00175 g002
Figure 3. Changes in species and functions during pit fermentation. (A): Relative abundances of the dominant microorganisms at the species level (top 10) during pit fermentation of Baijiu (by metagenomic sequencing results). (B): Relative abundances of the dominant microorganisms at the species level (top 10) during pit fermentation of Baijiu (by metatranscriptomic sequencing results). (C): Venn diagram of the numbers of species at each time point during pit fermentation. (D): Venn diagram of the numbers of KEGG Orthologs (KOs) at each time point during pit fermentation. (E): Heatmap showing the expression trends of the top 35 KEGG secondary pathways during pit fermentation. (F): Heatmap showing the expression trends of the top 35 KEGG tertiary pathways during pit fermentation. (G): Volcano plot of differentially expressed genes during pit fermentation from day zero to day seven.
Fermentation 10 00175 g003
Figure 4. Methanol metabolism pathways and interactions among dominant microorganisms during pit fermentation. (A): Metabolic network of methanol and environmental factors during pit fermentation of Baijiu. (B): Heatmap of corresponding KOs annotated from metagenomic sequencing results for methanol and environmental factors during pit fermentation. (C): Heatmap of corresponding KOs annotated from metatranscriptomic sequencing results for methanol and environmental factors during pit fermentation.
Fermentation 10 00175 g004
Figure 5. Microorganisms annotated from the metagenomic and metatranscriptomic sequencing results during pit fermentation corresponding to different methanol metabolic pathways. (A): Pectin degradation module. (B): Butyrate pathway. (C): Methane metabolism.
Fermentation 10 00175 g005
Figure 6. Correlation analysis of the dominant microorganisms (top 20 by abundance) during pit fermentation. Relationships with a Spearman’s correlation coefficient greater than 0.7 and a p-value less than 0.05 are displayed. The correlation index reflects the interaction between microorganisms, and the centrality index indicates the importance of different microorganisms in the community structure.
Fermentation 10 00175 g006
Figure 7. Evolution of microorganisms and driving environmental factors during the pit fermentation process throughout the production cycle. (A): Bacterial species composition during pit fermentation in all stages. (B): Fungal species composition during pit fermentation in all stages. (C): Redundancy analysis of environmental factors and bacterial composition during pit fermentation. (D): Redundancy analysis of environmental factors and fungal composition during pit fermentation.
Fermentation 10 00175 g007
Figure 8. Analysis of microorganisms (with the sum of all samples’ relative abundance greater than 0.5%) related to methanol production. (A): Analysis of important microbes for predicting methanol changes based on the random forest model (%IncMSE, increase in mean squared error, represents the importance of each microbe in influencing methanol content changes). (B): Spearman’s correlation analysis of methanol-related microbes. (C): Analysis of important microbes for predicting methanol changes based on the partial least squares regression (PLSR) model (“importance” indicates the degree of importance of microorganisms in predicting changes in methanol content, while the “coefficient” value indicates whether a microorganism has a positive or negative impact on the changes in methanol content). (D): Spearman’s correlation analysis of methanol-producing fungi on day zero and methanol changes in the first 7 d of pit fermentation.
Fermentation 10 00175 g008
Figure 9. Impact of environmental factors and methanol-metabolizing microbes on the changes in methanol content using PLS-PM. (Goodness of Fit (GOF) was used to evaluate the degree of fit of the model. In this context, “r” represents the path coefficient. A positive value of “r” indicates a significant positive correlation; conversely, a negative value indicates a significant negative correlation. The “p” value represents the significance level, with p < 0.05 indicating a significant correlation).
Fermentation 10 00175 g009
Disclaimer/Publisher’s Note: The statements, opinions and data contained in all publications are solely those of the individual author(s) and contributor(s) and not of MDPI and/or the editor(s). MDPI and/or the editor(s) disclaim responsibility for any injury to people or property resulting from any ideas, methods, instructions or products referred to in the content.

