Article

Transcriptional Analysis of Mixed-Culture Fermentation of Lachancea thermotolerans and Saccharomyces cerevisiae for Natural Fruity Sour Beer

1
Technology Center of Beijing Yanjing Beer Co., Ltd., Beijing Key Laboratory of Beer Brewing Technology, Beijing 101300, China
2
College of Environmental Science and Engineering, Beijing Forestry University, Beijing 100083, China
3
Institute of Nuclear and New Energy Technology, Tsinghua University, Beijing 100084, China
*
Author to whom correspondence should be addressed.
Fermentation 2024, 10(4), 180; https://doi.org/10.3390/fermentation10040180
Submission received: 17 November 2023 / Revised: 8 January 2024 / Accepted: 23 January 2024 / Published: 25 March 2024
(This article belongs to the Special Issue Advances in Beverages, Food, Yeast and Brewing Research, 3rd Edition)

Abstract

:
Increasingly high interest in yeast–yeast interactions in mixed-culture fermentation is seen along with beer consumers’ demands driving both market growth and requests for biotechnological solutions that can provide better sensory characteristics. In this study, Lachancea thermotolerans and Saccharomyces cerevisiae with a cell population ratio of 10:1 were inoculated for sour beer fermentation while the process conditions within the brewing industry remained unchanged. With L. thermotolerans producing lactic acid (1.5–1.8 g/L) and bringing down the pH to 3.3–3.4 whilst adding no foreign flavors herein, this study revealed a new natural, fruity sour beer with a soft, sour taste. In this study, the double-yeast mixed-culture fermentation produced more flavor substances than a single-culture process, and plenty of isobutyl acetate and isoamyl acetate enhanced the fruit aroma and balanced the sour beer with a refreshing taste. While playing a positive role in improving the beer’s quality, the double-yeast mixed-culture fermentation developed in this study helps to offer an alternative mass production solution for producing sour beer with the processes better controlled and the fermentation time reduced. The stress responses of the L. thermotolerans during the fermentation were revealed by integrating RNA sequencing (RNA-Seq) and metabolite data. Given that the metabolic flux distribution of the S. cerevisiae during the fermentation differed from that of the non-Saccharomyces yeasts, transcriptional analysis of non-Saccharomyces yeast and S. cerevisiae could be suitable in helping to develop strategies to modulate the transcriptional responses of specific genes that are associated with the aroma compounds released by S. cerevisiae and non-Saccharomyces yeasts. In the case of some non-Saccharomyces yeast species/strains, the diversion of alcoholic fermentation and the formation of a great number of secondary compounds may, in part, account for the low ethanol yield.

1. Introduction

In the world of beer, brewers’ quests for unique flavors often face significant technical hurdles. The use of mixed starters, namely selected strains of S. cerevisiae and non-Saccharomyces yeast, suggests a constructive strategy to improve beer with an aromatic complexity and desirable characteristics while reducing off flavors as compared with spontaneous fermentation [1,2]. Non-Saccharomyces yeasts are typically found in spontaneous fermentation and, in some cases, are used as starter cultures for brewing. Most of them belong to the following genera: Brettanomyces, Candida, Debaryomyces, Hanseniaspora, Ka-zachstania, Kluyveromyces, Lachancea, Metschnikowia, Meyerozyma, Pichia, Rhodotorula, Star-merella, Saccharomycodes, Saccharomycopsis, Torulaspora, Trichosporon, Wickerhamomyces, Wil-liopsis, Yarrowia, Zygoascus, and Zygosaccharomyces [3,4,5,6,7,8,9]. Brewers usually use Lachancea together with Saccharomyces in fermentations to produce a rapid drop in pH [10]. On the other hand, studies have shown that only three non-Saccharomyces (T. delbrueckii, S. pombe, and L. thermotolerans) possess enough fermentative power to properly ferment beer with ethanol levels of up to nearly 100%, and Lachancea is uniquely characterized by its ability to produce lactic acid, thus influencing both flavor and mouth feel.
Traditionally, crafting sour beers involves a complex interaction of multiple microbes and lengthy aging [11] while at the same time having to deal with finicky lactic acid bacteria that are sensitive to hops [12] and demand cross-contamination control. It is therefore of particular interest that strains producing high levels of lactic acid could potentially be used to make sour beer without adding bacteria, thus simplifying and shortening the process. Winemakers have found success with the mixed-culture fermentation technique, using Lachancea thermotolerans in combination with Saccharomyces cerevisiae and resulting in enhanced quality and a layered character. Could this approach be replicated in beer brewing, particularly on an industrial scale? This opens a new door. In this study, a combination of L. thermotolerans and S. erevisiae were used in the fermentation process without the addition of foreign flavors, and the process resulted in a broader spectrum of flavor compounds compared to single-culture processes.
In addition, the authors employed RNA high-throughput sequencing technology to unravel the transcriptome-level gene expression of S. cerevisiae and L. thermotolerans in a mixed fermentation environment. While delving deeper into the intriguing realm of yeast–yeast interactions, this technology can help to illuminate the research on the cellular adaptive responses of both yeasts, building upon previous genetic analyses of expression variations during beer fermentation [12,13,14]. Therefore, this study provides a framework for establishing the process and procedure of mixed-culture fermentation, which is expected to inspire the production of natural, fruity sour beer from industrial wort.

2. Materials and Methods

2.1. Strains and Media

Saccharomyces cerevisiae 68obg, Lachancea thermotolerans FBA-2, and Brettanomyces bruxellensis WDB24 were provided by the Laboratory Strain Preservation Center. Kluyveromyces marxianus 1695, Kluyveromyces marxianus 1042, and Lachancea thermotolerans 1548 were provided by the China Common Microbial Species Preservation and Management Center.
Expansion culture medium: wort was produced by the saccharification workshop of a company and was sterilized at 115 °C for 20 min.
Fermentation medium: 2% fructose syrup was added to the wort to increase the available sugar content of the non-Saccharomyces yeast, which was sterilized at 115 °C for 20 min.

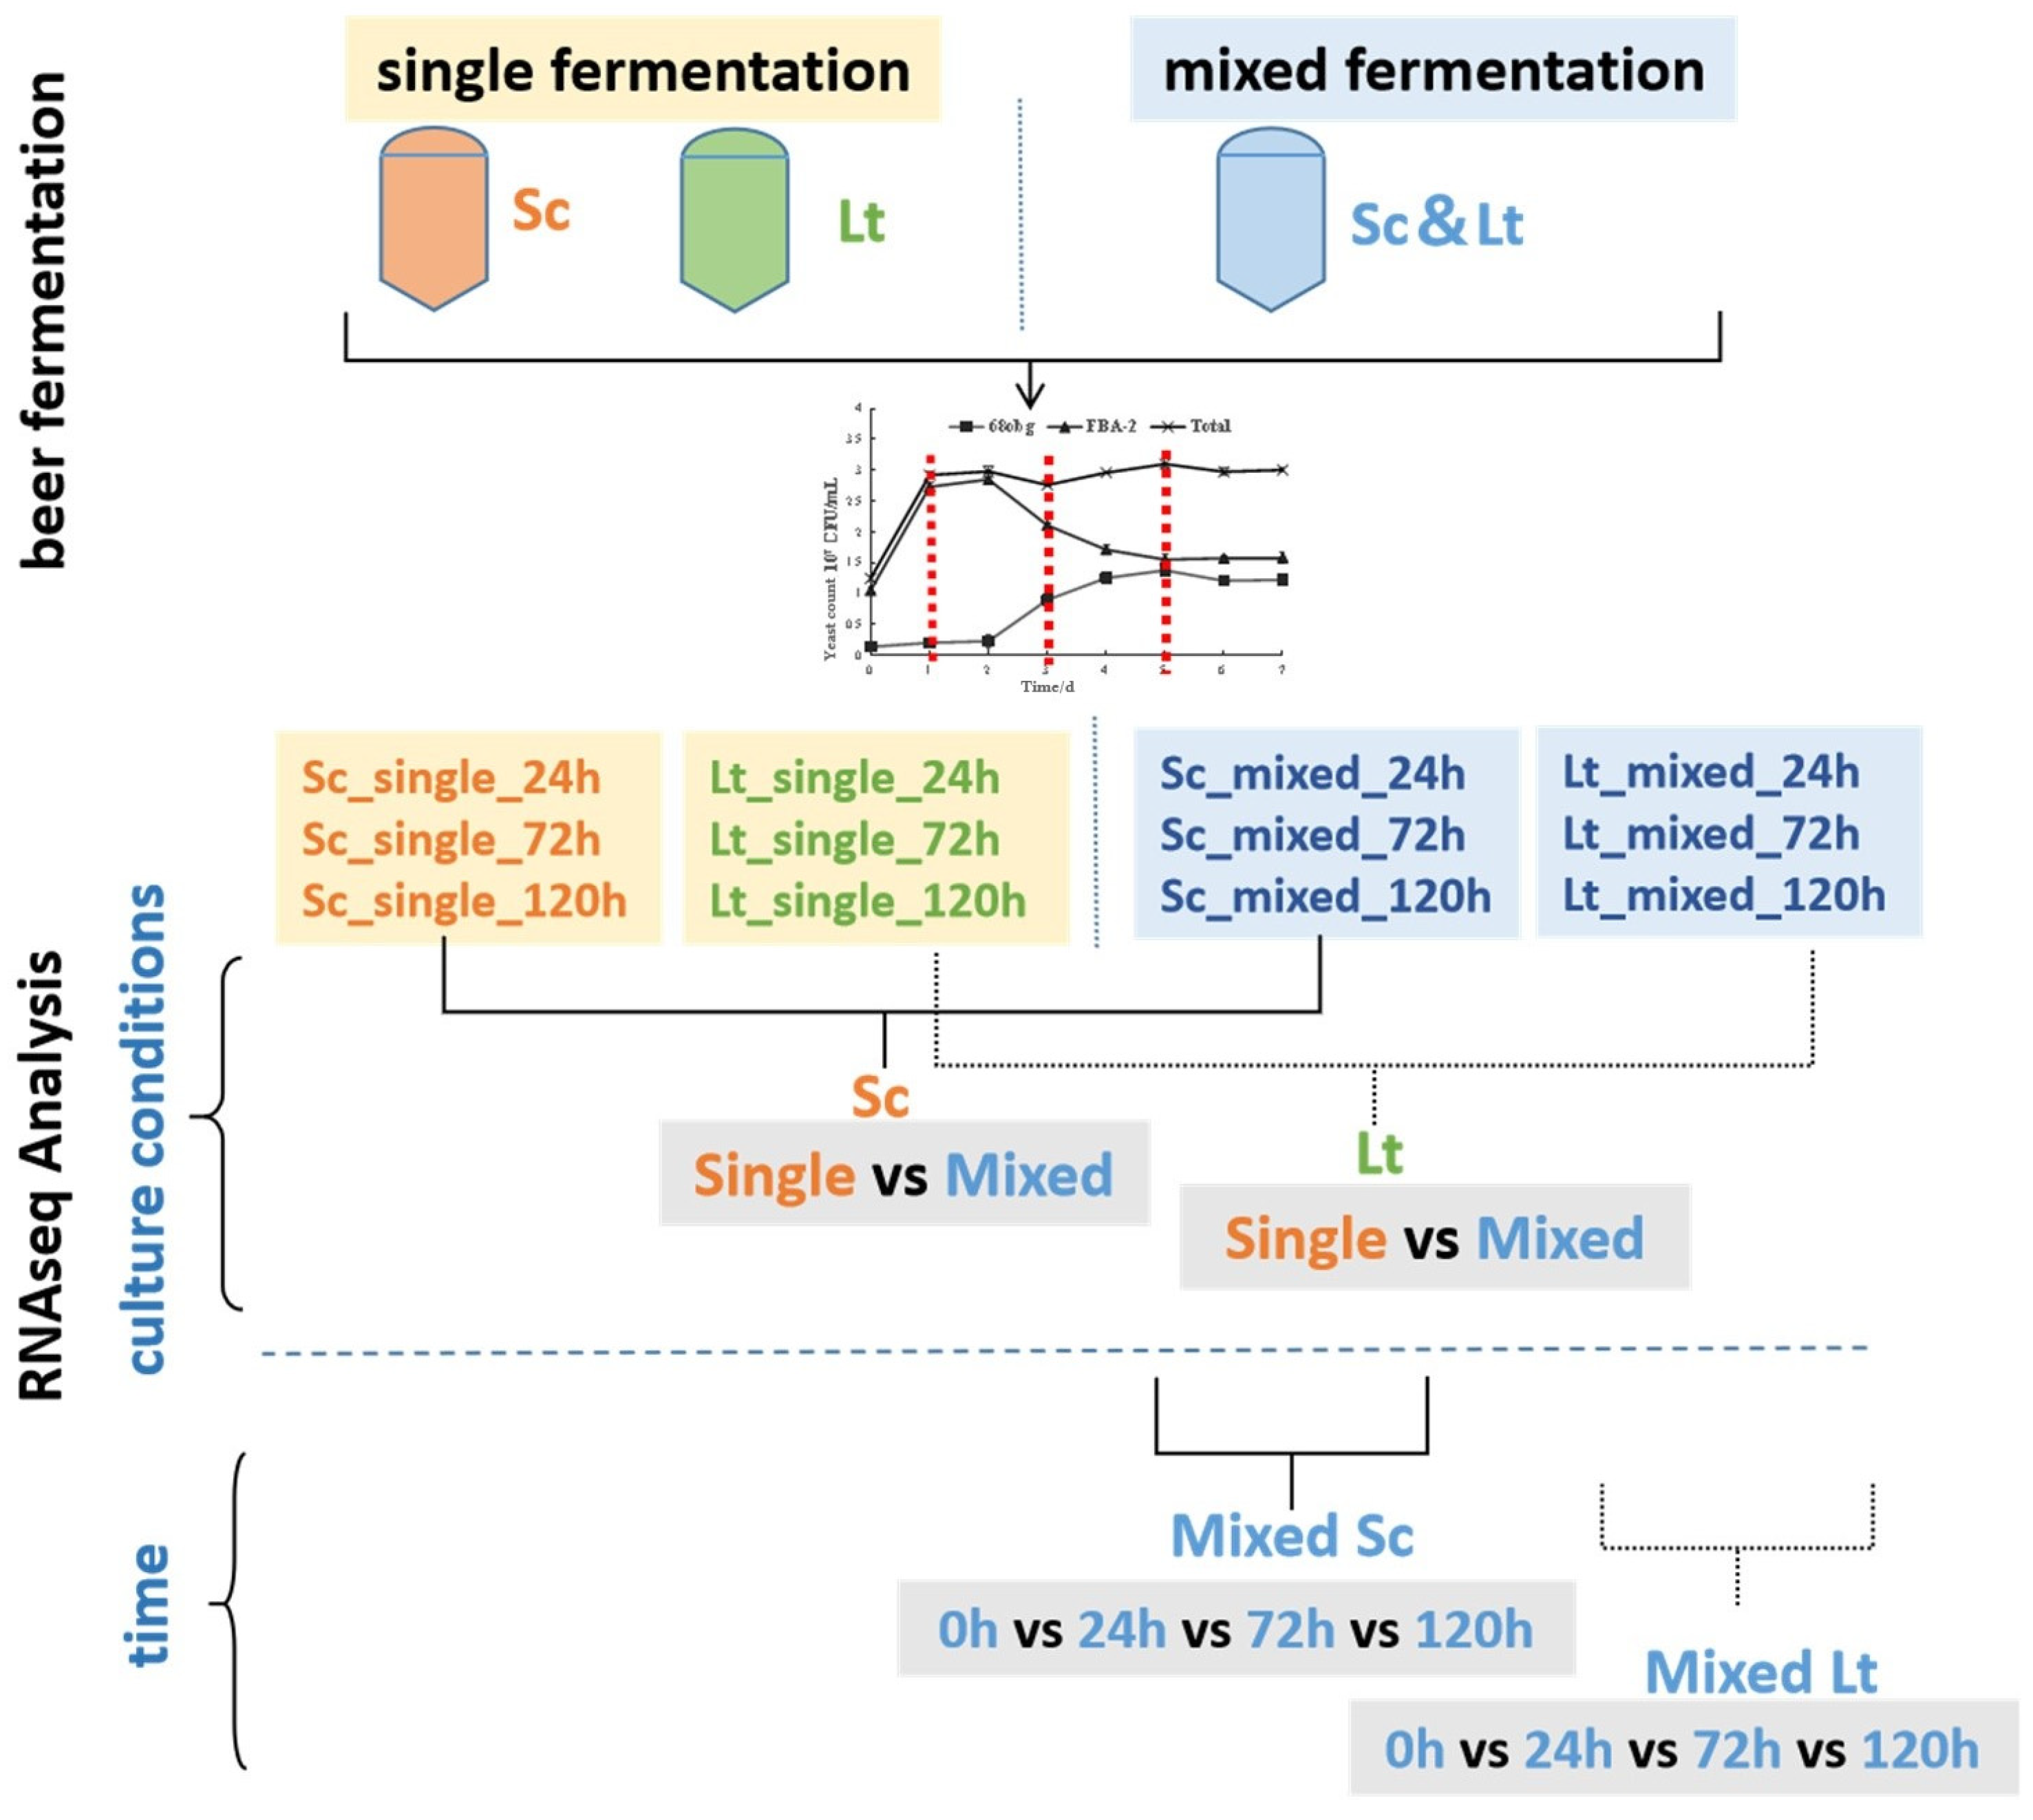
2.2. Beer Fermentation Experiment

After activation, the bacterial solution was inoculated into a 500 mL triangular flask containing 250 mL of wort and incubated at 25 °C for 24 h to prepare the seed solution. The inoculum was inoculated into the wort fermentation medium at an inoculum size of 1–1.2 × 10⁷ CFU/mL and incubated at 20 °C for 7 days. Then, 600 mL of the inoculum was fermented. The fermentation broth was injected into sterile clamp bottles, and the beer was stored at 0 °C for 7 days after capping (3 in parallel for each sample).

2.3. Analysis of Quantity Change of Different Yeast Species in Double-Yeast Mixed Fermentation System

qPCR and ethidium bromide azide were used to quantitatively analyze each strain in the double-yeast mixed-culture fermentation to characterize the dynamics of each yeast quickly.
Correlation analysis was performed using methylene blue staining method for micro-monitoring analysis of cell mortality [12], and the yeast mortality Color process was determined by the methylene blue staining method. The EMA pretreatment conditions suitable for the two yeast strains were determined as EMA concentration of 20 μmol/L upon placed in the dark for 10 min. Samples were exposed at a distance of 10 cm from a 500 W halogen lamp for 15 min, which could effectively inhibit the amplification of dead bacteria DNA and thus exclude dead bacteria Effect of DNA amplification from quantification of qPCR strains. The known concentration of yeast pure culture liquid, 10 times gradient dilution, and then EMA-qPCR was performed respectively, with the two yeast-specific primers being S. cerevisiae CESP-F: ATCGAATTTTTGAACGCACATTG, SCER-R: CGCAGAGAAACCTCTCTTTGGA [13]; L. thermotolerans LTH2-F CGCTCCTTGTGGGTGGGGAT, LTH2-R CTGGGCTATAACGCTTCTCC [14]. The 30 μL qPCR reaction system consisted of 12 μL Sybrgreen Mix (Tien root), 1 μL upstream and downstream primers, 1 μL mode Plate DNA, and 15 μL of sterilized water. The qPCR reaction program includes 95 °C for 5 min and 40 cycles, with each cycle at 95 °C for 30 s, 60 °C for 30 s, and 72 °C for 60 s. Finally, the standard curves of 104, 105, 106, 107, 108 and 109 CFU/mL viable cells were obtained to determine the correlation between the corresponding cycle threshold (Ct) of qPCR and plate count, completing the quantitative analysis of each strain. At last, EMA-qPCR monitoring technology was used to characterize instantly the growth status of each single bacteria in the double-yeast mixed-culture fermentation.

2.4. Analytical Determinations

Gas chromatograph was used to determine the flavor substances in the fermented liquor after distillation [12]. The real fermentability and alcohol were determined according to GB/T 4928-2008 (Beer Analysis Method) [15]. High performance liquid chromatraphy (HPLC, Agilent 6890, Santa Clara, CA, USA)) was used to determine the main sugars in the fermentation broth [16].
Organic acids greatly influence the flavor and taste of beer and are important indicators in sour beer evaluation. The organic acids (lactic acid, acetic acid, formic acid, propionic acid, pyruvate, succinic acid, tartaric acid, oxalic acid, fumaric acid and citric acid) in liquor were identified by ion chromatography (DX-320, Dionex, Sunnyvale, CA, USA). The mixed standard solution and the sample to be tested were injected onto the ion chromatograph respectively, then the response value (peak area) of each organic acid was measured. The concentration of organic acid content of the sample to be tested was determined by comparing the response value (peak area) with the standard solution chromatogram. The pH was determined using an FE28 pH meter (Mettler Toledo Shanghai, Shanghai, China).
For sensory evaluation of beer, quantitative descriptive analysis (QDA) is a descriptive method widely performed in the beer industry nowadays, and a group of 10 beer sensory evaluation attributes is used to describe the texture, taste and aroma to score beer on a scale of flavor intensity.

2.5. RNA Extraction Samples and RNA-Seq Analysis

Cell samples for RNA-sequencing were obtained from both single and mixed culture fermentations at 24 h, 72 h and 120 h respectively. Total RNAs were extracted using the hot phenol method [17]. Concentration and purity of RNA were determined by spectrophotometry and integrity was confirmed using an Agilent 2100 Bioanalyzer with an RNA 6000 Nano Assay (Agilent Technologies, Palo Alto, CA, USA). RNA samples with RNA integrity number (RIN) over 8, and 280:260 ratios of over 2 were further used for the RNA-sequencing purpose. Complementary DNA (cDNA) library was generated using TruSeq® Library Prep Kit v2. Paired-end reads were sequenced on the Illumina NextSeq platform. RNAseq data processing Low quality reads (<Q20), polyA-reads as well as ambiguous reads (containing N) were removed using FastX 0.0.13 [18]. Furthermore, reads less than 35 bp were removed with Short Read [19] and adapters on the remaining reads were trimmed using cutadapt [20].
Annotation of genomic features was performed using the reference genomes of S. cerevisiae S288c and L. thermotolerans CBS6340. In the case of L. thermotolerans, unknown genes were identified by the homology with the S. cerevisiae S288c genome. Reads from L. thermotolerans and S. cerevisiae monoculture fermentation samples were aligned with the reference genomes of the two yeasts with TopHat v2.0.13 [21]; and reads that were non-primary mapping or had a mapping quality ≤ 20, were removed. Subsequently, cross-mapping between S. cerevisiae S288c and L. thermotolerans was evaluated to determine the effect of genomes merging. Cross mapping between the two yeasts was found to be less than 1%; consequently, pre-processed reads of all fermentations were aligned with the reference genome of S288cplusLT. The obtained bam files were converted into gff files for further data analysis. Reads in the alignments that overlap with gene features were counted using htseq-count 0.6.1p1 [22]. Genes which all samples had and are less than 1 count-per-million were removed, and the full quantile normalization using the EDASeq package from Bioconductor was applied to correct sample-specific variation typically arising out of differences in library size and RNA composition. Transcript abundance was measured in Fragments Per Kilobase of exon per Million mapped reads (FPKM).

2.6. Statistical Analysis

To evaluate the statistical significance of the chemical and organoleptic data of the beer, these were subjected to one-way analysis of variance using the SuperANOVA software (version 1.1, for Macintosh OS 9.1). The significant differences among the data were determined using the Duncan test, at p < 0.05.

3. Results and Analysis

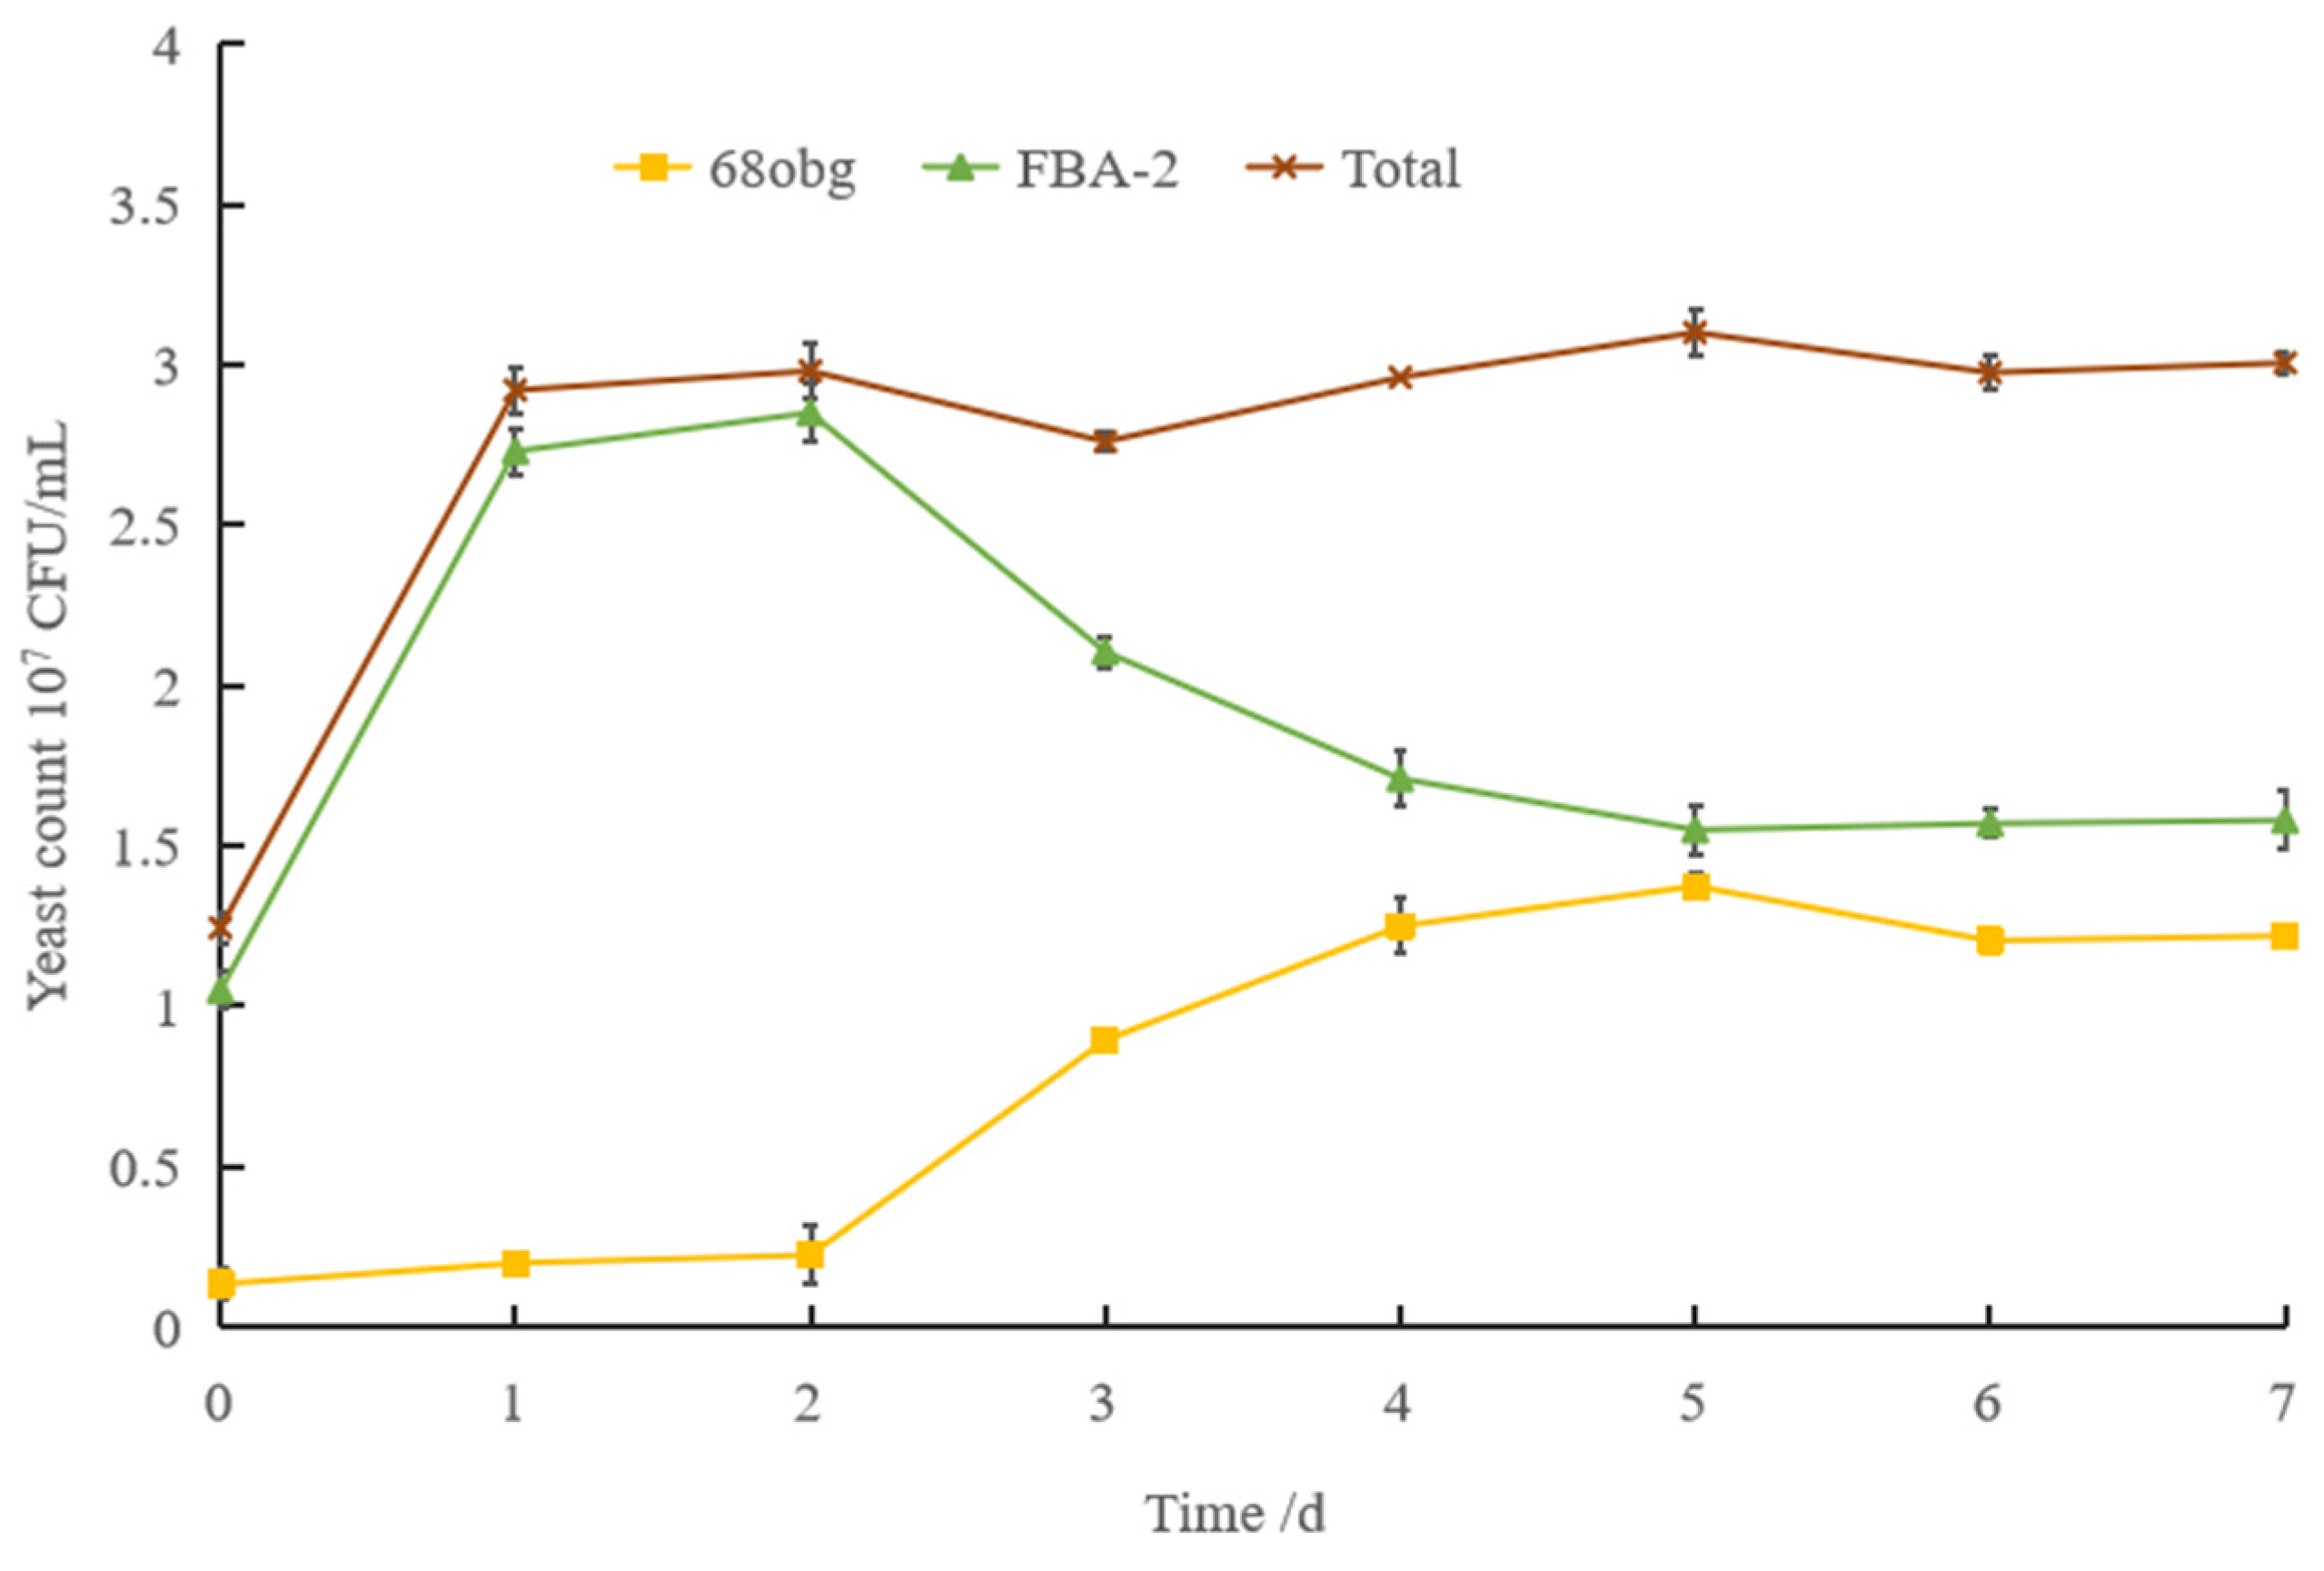
3.1. Non-Saccharomyces Yeast to Saccharomyces cerevisiae in Mixed-Culture Beer Fermentation

Non-Saccharomyces yeasts of both certain acid capacity and wort fermentation properties were analyzed with reference to relevant studies [23,24,25]. The results showed that, in contrast to S. cerevisiae 68obg, in most cases non-Saccharomyces yeasts only used the glucose, fructose and sucrose in the wort, while not metabolizing maltose-trisaccharides such as maltose and maltotriose. An exception is L. thermotolerans FBA-2, which used a small amount of maltose, and delivered a metabolic rate that was significantly lower than that of S. cerevisiae.
As shown in Table 1, analysis of the organic acid species and yield of the five non-Non-Saccharomyces yeast strains, L. thermotolerans FBA-2 presented the highest lactate yield at 2.573 g/L. Given the lactic acid and organic acid concentrations higher than those in the other strains, the sensory evaluation showed that the L. thermotolerans FBA-2, which presented a better balanced and drinkable taste, was the best choice for brewing sour beer.
Single-culture fermentation experiments were performed with S. cerevisiae 68obg and L. thermotolerans FBA-2. S. cerevisiae 68obg resulted efficient fermentation and rich esters with a strong clove flavor [26]. As shown in Figure 1A, L. thermotolerans FBA-2 exhibited low rate of maltose use, zero rate of maltose oligosaccharides use such as maltotriose, delivering higher residual sugar content. As shown in Table 1, L. thermotolerans FBA-2 presented the highest yields of lactic acid and total acid, and yields of major hetero-alcohols such as isobutanol and isoamyl alcohols significantly lower than S. cerevisiae 68obg as the capacity of using carbon sources of the single strain limits the flavor substances, resulting in lower total alcohol but higher ester content compared with S. cerevisiae 68obg.
Figure 1B shows the weight loss in the fermentation process. L. thermotolerans FBA-2 presented a slower fermentation rate than S. cerevisiae 68obg and delivered 16.65 g/L (2.11%vol) alcohols in fermentation broth versus 53.26 g/L (6.75%vol) in fermentation broth of S. cerevisiae 68obg. The sensory evaluation of L. thermotolerans FBA-2 revealed bold acidity, on top of little other flavors, which reflected on the balanced and drinkable taste of beer body and exhibited flavors significantly different from standard beer out of S. cerevisiae 68obg fermentation. The study of wine [27] also showed that fermentation by mixing heat-resistant L. thermotolerans and S. cerevisiae increased the total acidity and yields of glycerol, polysaccharide and 2-phenyl ethanol, while reducing the volatile acidity of wine. In conclusion, using S. cerevisiae 68obg as the base yeast and L. thermotolerans FBA-2 as the featured yeast, the dual-yeast mixed-culture fermentation will brew sour beer with acidity acting as a balanced flavor element.
Interaction of different yeasts looks obvious in the mixed fermentation. Many studies have revealed [28,29] differences in metabolic activities between fermentation of mixing non-Saccharomyces yeast and S. cerevisiae and the single-culture fermentation, and the ratio of strains in the mixed fermentation plays a decisive role in the final taste of beer.
L. thermotolerans FBA-2 and S. cerevisiae 68obg were inoculated at 1:100, 1:50, and 1:10 for the mixed-culture fermentation, S. cerevisiae 68obg presented higher growth rates than those of L. thermotolerans FBA-2, and S. cerevisiae 68obg was the dominant strain. In the case of wort supplemented with high fructose syrup, the featured yeast L. thermotolerans FBA-2 also failed to dominate the growth due to competing with the base yeast S. cerevisiae 68obg for glucose, fructose, and sugar, resulting in insignificant change to the composition of the final beer product.
However, the featured strain L. thermotolerans FBA-2 was found to dominate the growth when L. hermotolerans FBA-2 and S. cerevisiae 68obg were inoculated at 100:1 and 50:1, and S. cerevisiae 68obg demonstrated constant weakness in yeast population even at late fermentation stages. In contrast, upon mixing the L. thermotolerans FBA-2 and S. erevisiae 68obg at 10:1, the L. thermotolerans FBA-2 started fermentation, declined in the middle stage and finally failed in fermentation while S. cerevisiae 68obg started to dominate to allowing continuous fermentation until completion.

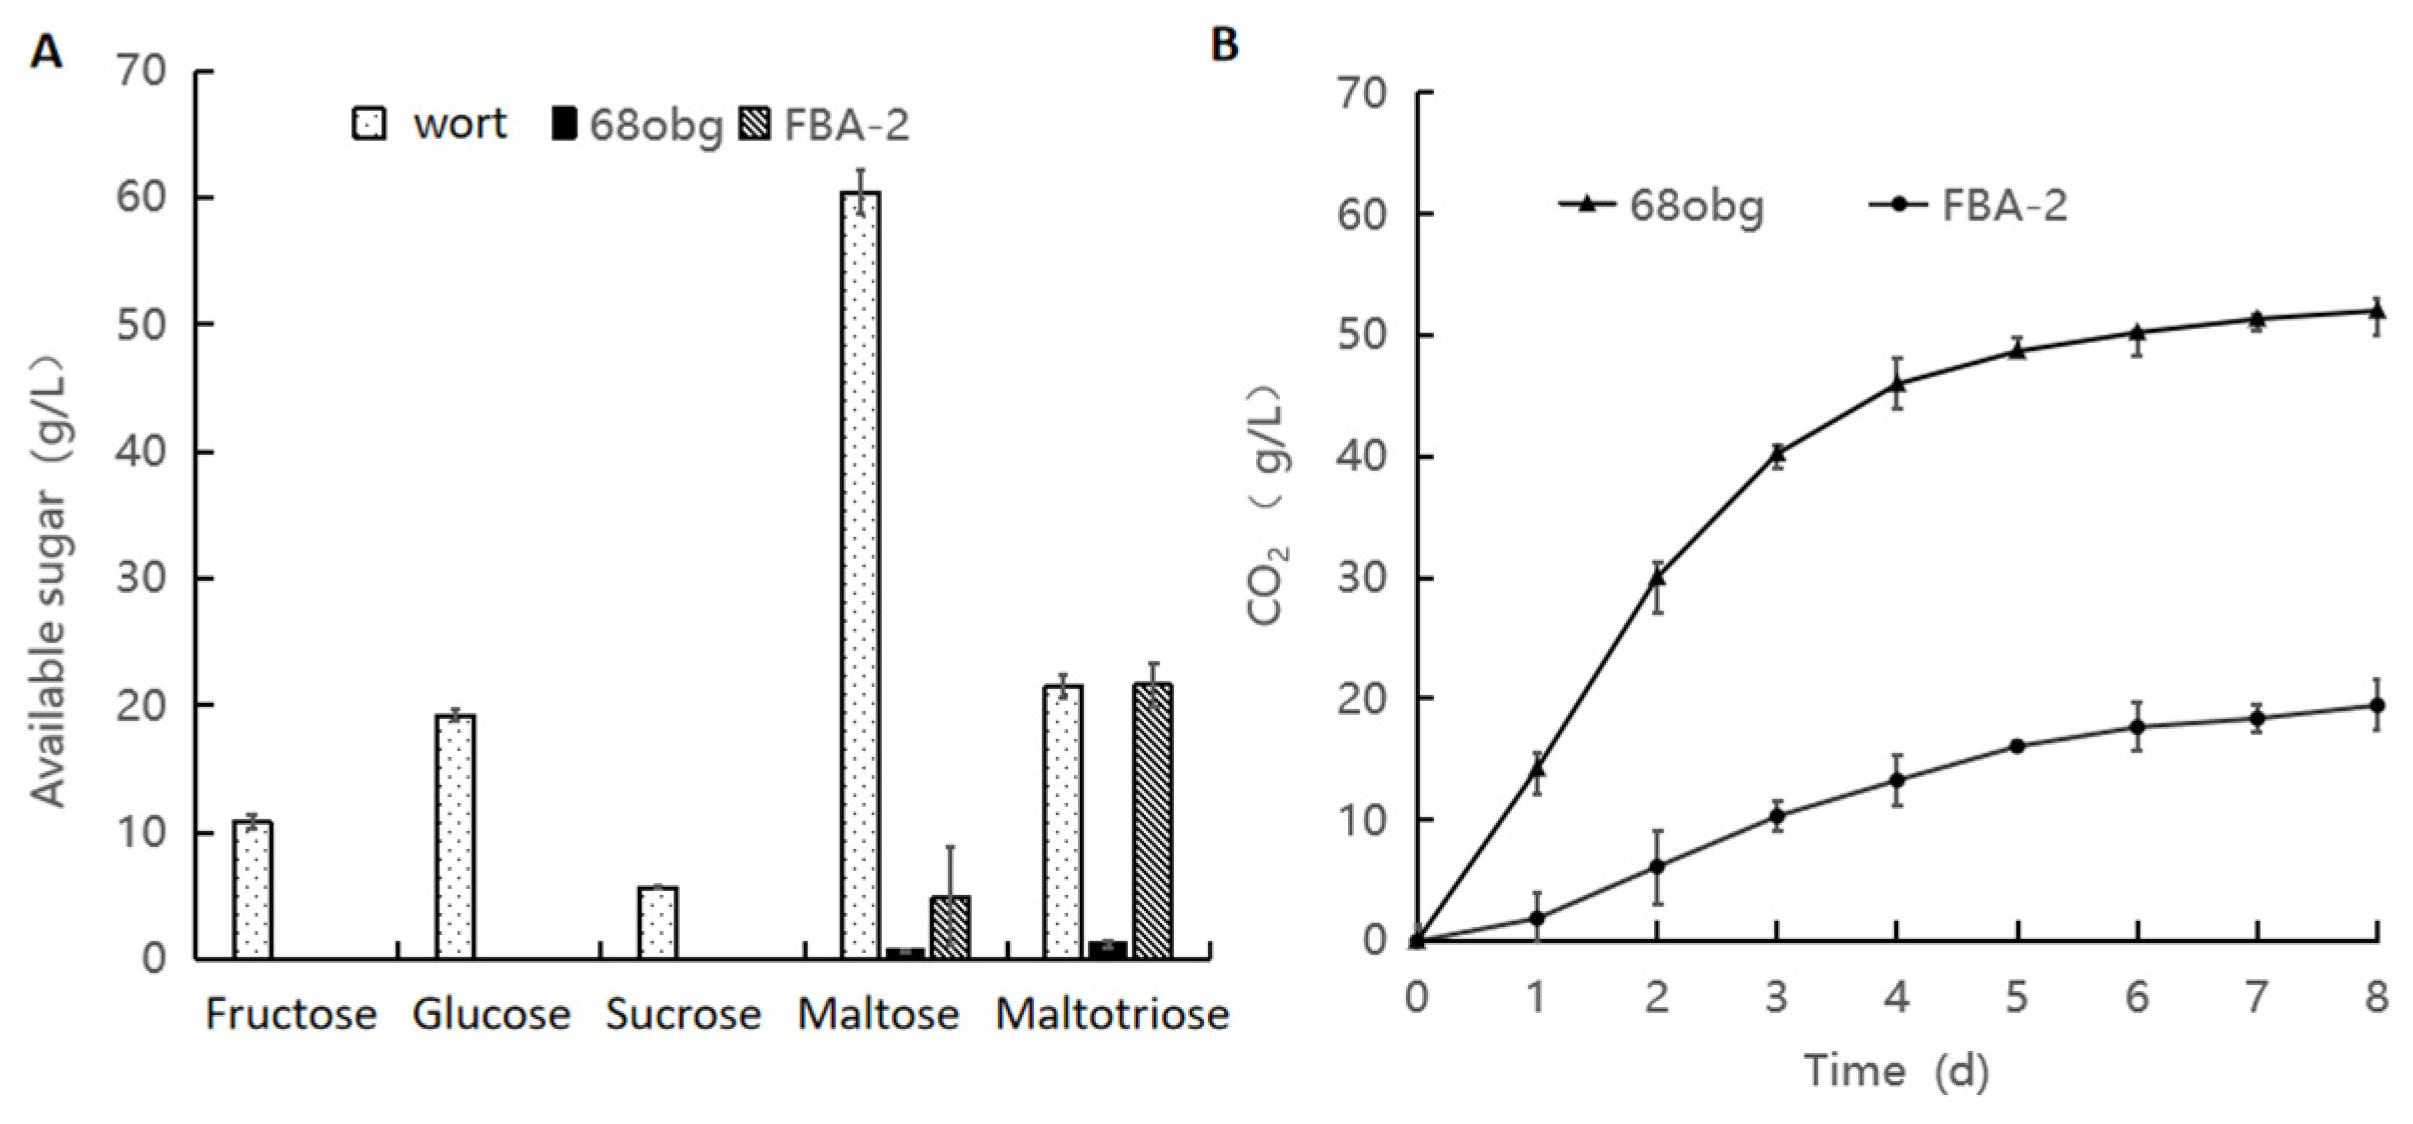
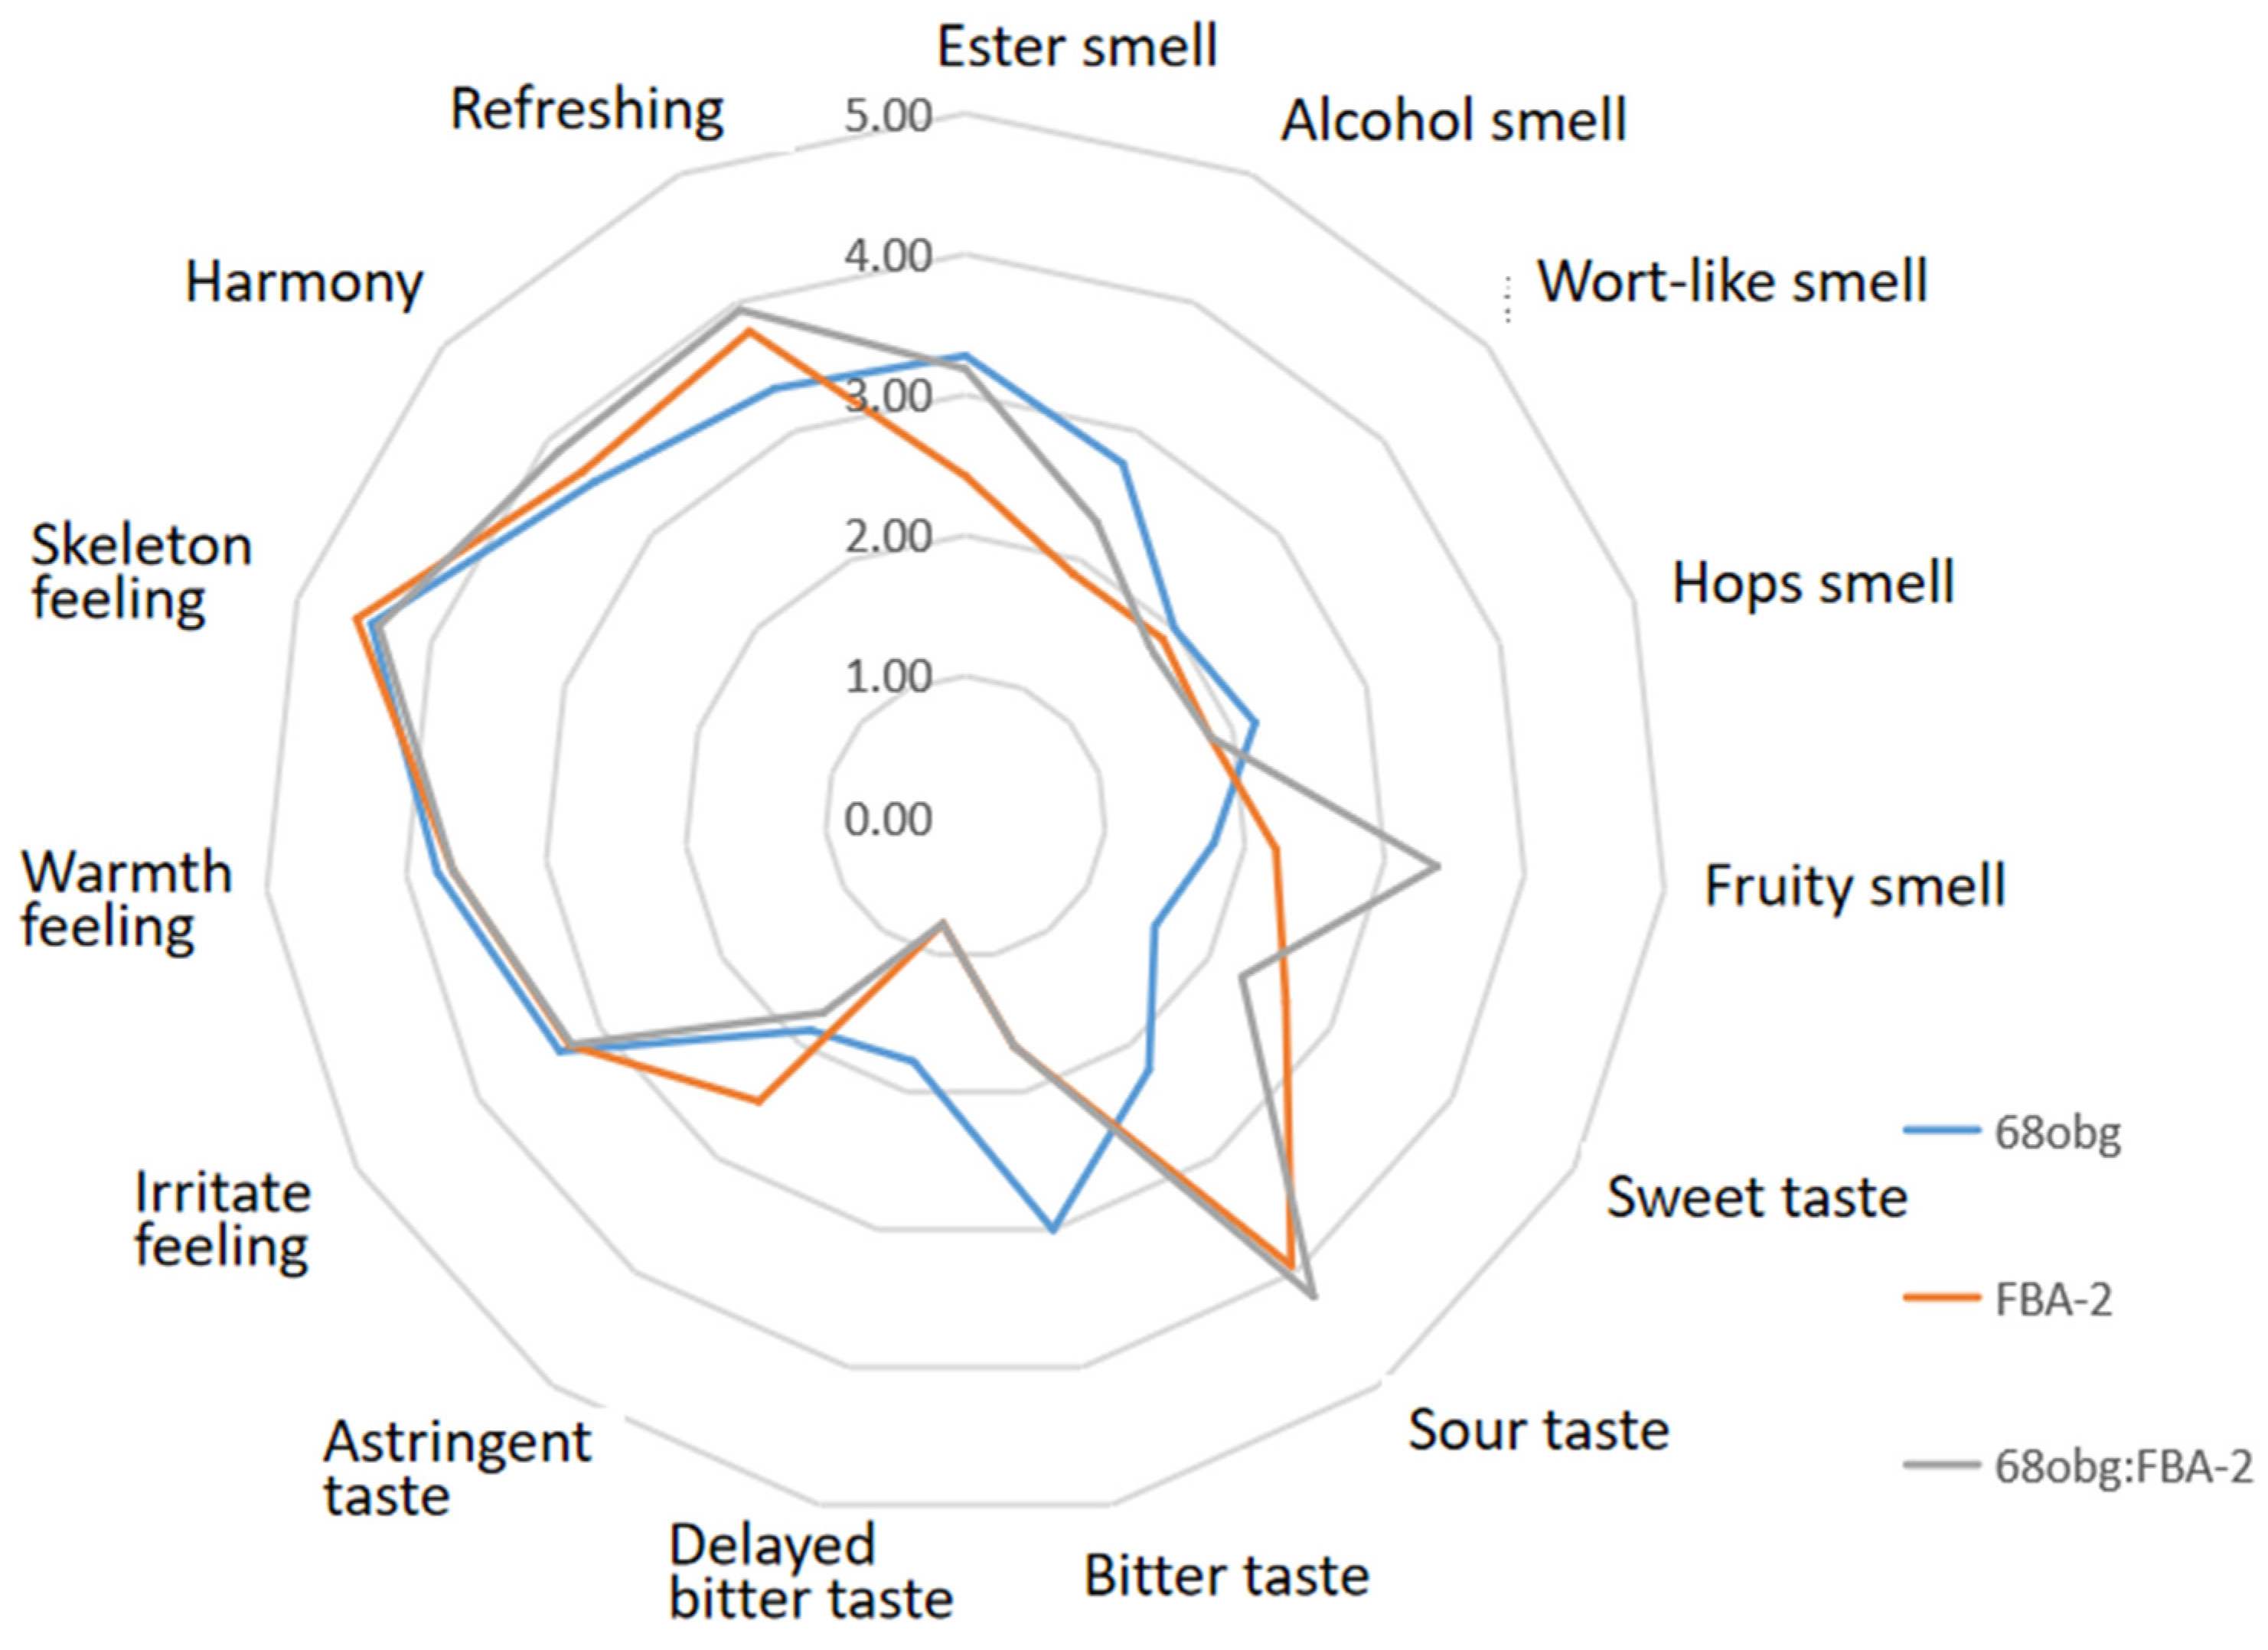
3.2. Wort with L. thermotolerans and S. cerevisiae Fermentation to Produce New Fruity Sour Beer

Taking account of the flavor analysis and sensory evaluation results, we chose L. thermotolerans FBA-2 and S. cerevisiae 68obg with an inoculation ratio of 10:1 and a total number of yeast in wort in a controlled range of 1~1.2 × 10⁷ CFU/mL, and applied the EMA-qPCR monitoring technology to characterize the growing dynamics of each single fungus during the double-yeast mixedculture fermentation.
Standard curves between viable cell content and Ct values were established using EMA-qPCR for L. thermotolerans FBA-2 and S. cerevisiae 68obg, respectively. Ct values showed a linear relationship with viable concentration. The standard curve equation for L. thermotolerans FBA-2 was y = −3.118x + 38.952, and the correlation coefficient was R2 = 0.9883 and the standard curve equation for S. cerevisiae 68obg was: y = −3.222x + 37.235, the correlation coefficient was R2 =0.9938, showing healthy linear relationships. EMA−qPCR is able to shorten the detection time to 3~4 h, compared with 36 h of the traditional plate counting method, a marked improvement in detection efficiency.
EMA−qPCR technology was used to characterize the growth status of single bacteria during the dual-yeast mixed-culture fermentation. Figure 2 showed that L. thermotolerans FBA-2 presented a significant increase in yeast population after 1 day in the tank, and became the dominant strain. the pH of the fermentation broth decreased from 5.42 to 3.51 after 1 day and was 3.33 after 2 days, which remained until Day 7. Upon fermentation of 2 days, L. thermotolerans FBA-2 demonstrated declined activity due to depletion of available sugars, while S. cerevisiae 68obg continued to increase its yeast population by utilizing fermentable sugars left in the fermentation solution such as maltose and maltotriose. As greatly inhibited in the early stage when L. thermotolerans FBA-2 was dominant, S. cerevisiae 68obg showed limited growth of yeast population of up to 1.38 × 10⁷ CFU/mL compared with single-culture fermentation of S. cerevisiae 68obg. Therefore, the fermentation liquor came with a relatively content of alcohols produced by S. cerevisiae 68obg, and alcohol of 43.79 g/L (5.55% vol).
Scaling up the effective fermentation volume from the laboratory conditions to a wort fermentation experiment of 100 L fermenter, monitoring of relevant key parameters in the fermentation process showed that the lactic acid content was 1.5–1.8 g/L, the pH value of the liquor was 3.3–3.4, and the alcohol was about 39.45 g/L (5%vol). It can be concluded that the double-yeast mixed-culture fermentation consisting of non-Saccharomyces yeast and S. cerevisiae has a certain stability to function.
Interaction between non-Saccharomyces yeast and S. cerevisiae [30] may help to yield more enzymes and volatile compounds. In addition to lactic acid and a lower pH, more aromas of great complexity may be also brought by the L. thermotolerans FBA-2. Double-yeastmixed fermentation delivered more flavored substances by producing more isobutyl acetate and isoamyl acetate ester, enhancing the fruity aroma of sour beer. The sensory evaluation also showed a combination of attributes of two yeasts in the resulting sour beer, such as instantly recognizable fruity flavors and positive influence on the beer’s quality (Figure 3).

3.3. Overview of Transcriptional Response in Single- and Mixed-Culture Fermentations

Effect of the mixing (MIX) on the gene transcription in S. cerevisiae and L. thermotolerans was assessed by comparing the transcriptome of the mixed cultures to the monocultures under beer fermentations (Figure 4). Genes uniquely and differentially expressed in the mixed fermentations compared to monocultures were identified. In the initial global analysis, the differentially expressed genes (DEGs) were visualized by overlaying the data on the Biocyc Omics dashboard. Generally, the interaction between the single-and mixed-culture fermentations elicited a stronger response in L. thermotolerans than in S. cerevisiae. Compared with the single fermentation, the transcription level of the two yeasts changed significantly during the mixed fermentation. In order to better adapt to the environment, S. cerevisiae enhanced the ribosome-related functions, up-regulated the expression of genes related to the integrity of cell wall and membrane structure, and enhanced the level of cell competition by absorbing more carbon and nitrogen sources. However, genes related to cell aggregation, death and response to osmotic stress were significantly up-regulated in L. thermotolerans. The results showed that the response of L. thermotolerans than in S. cerevisiae was different during double-yeast mixed fermentation.

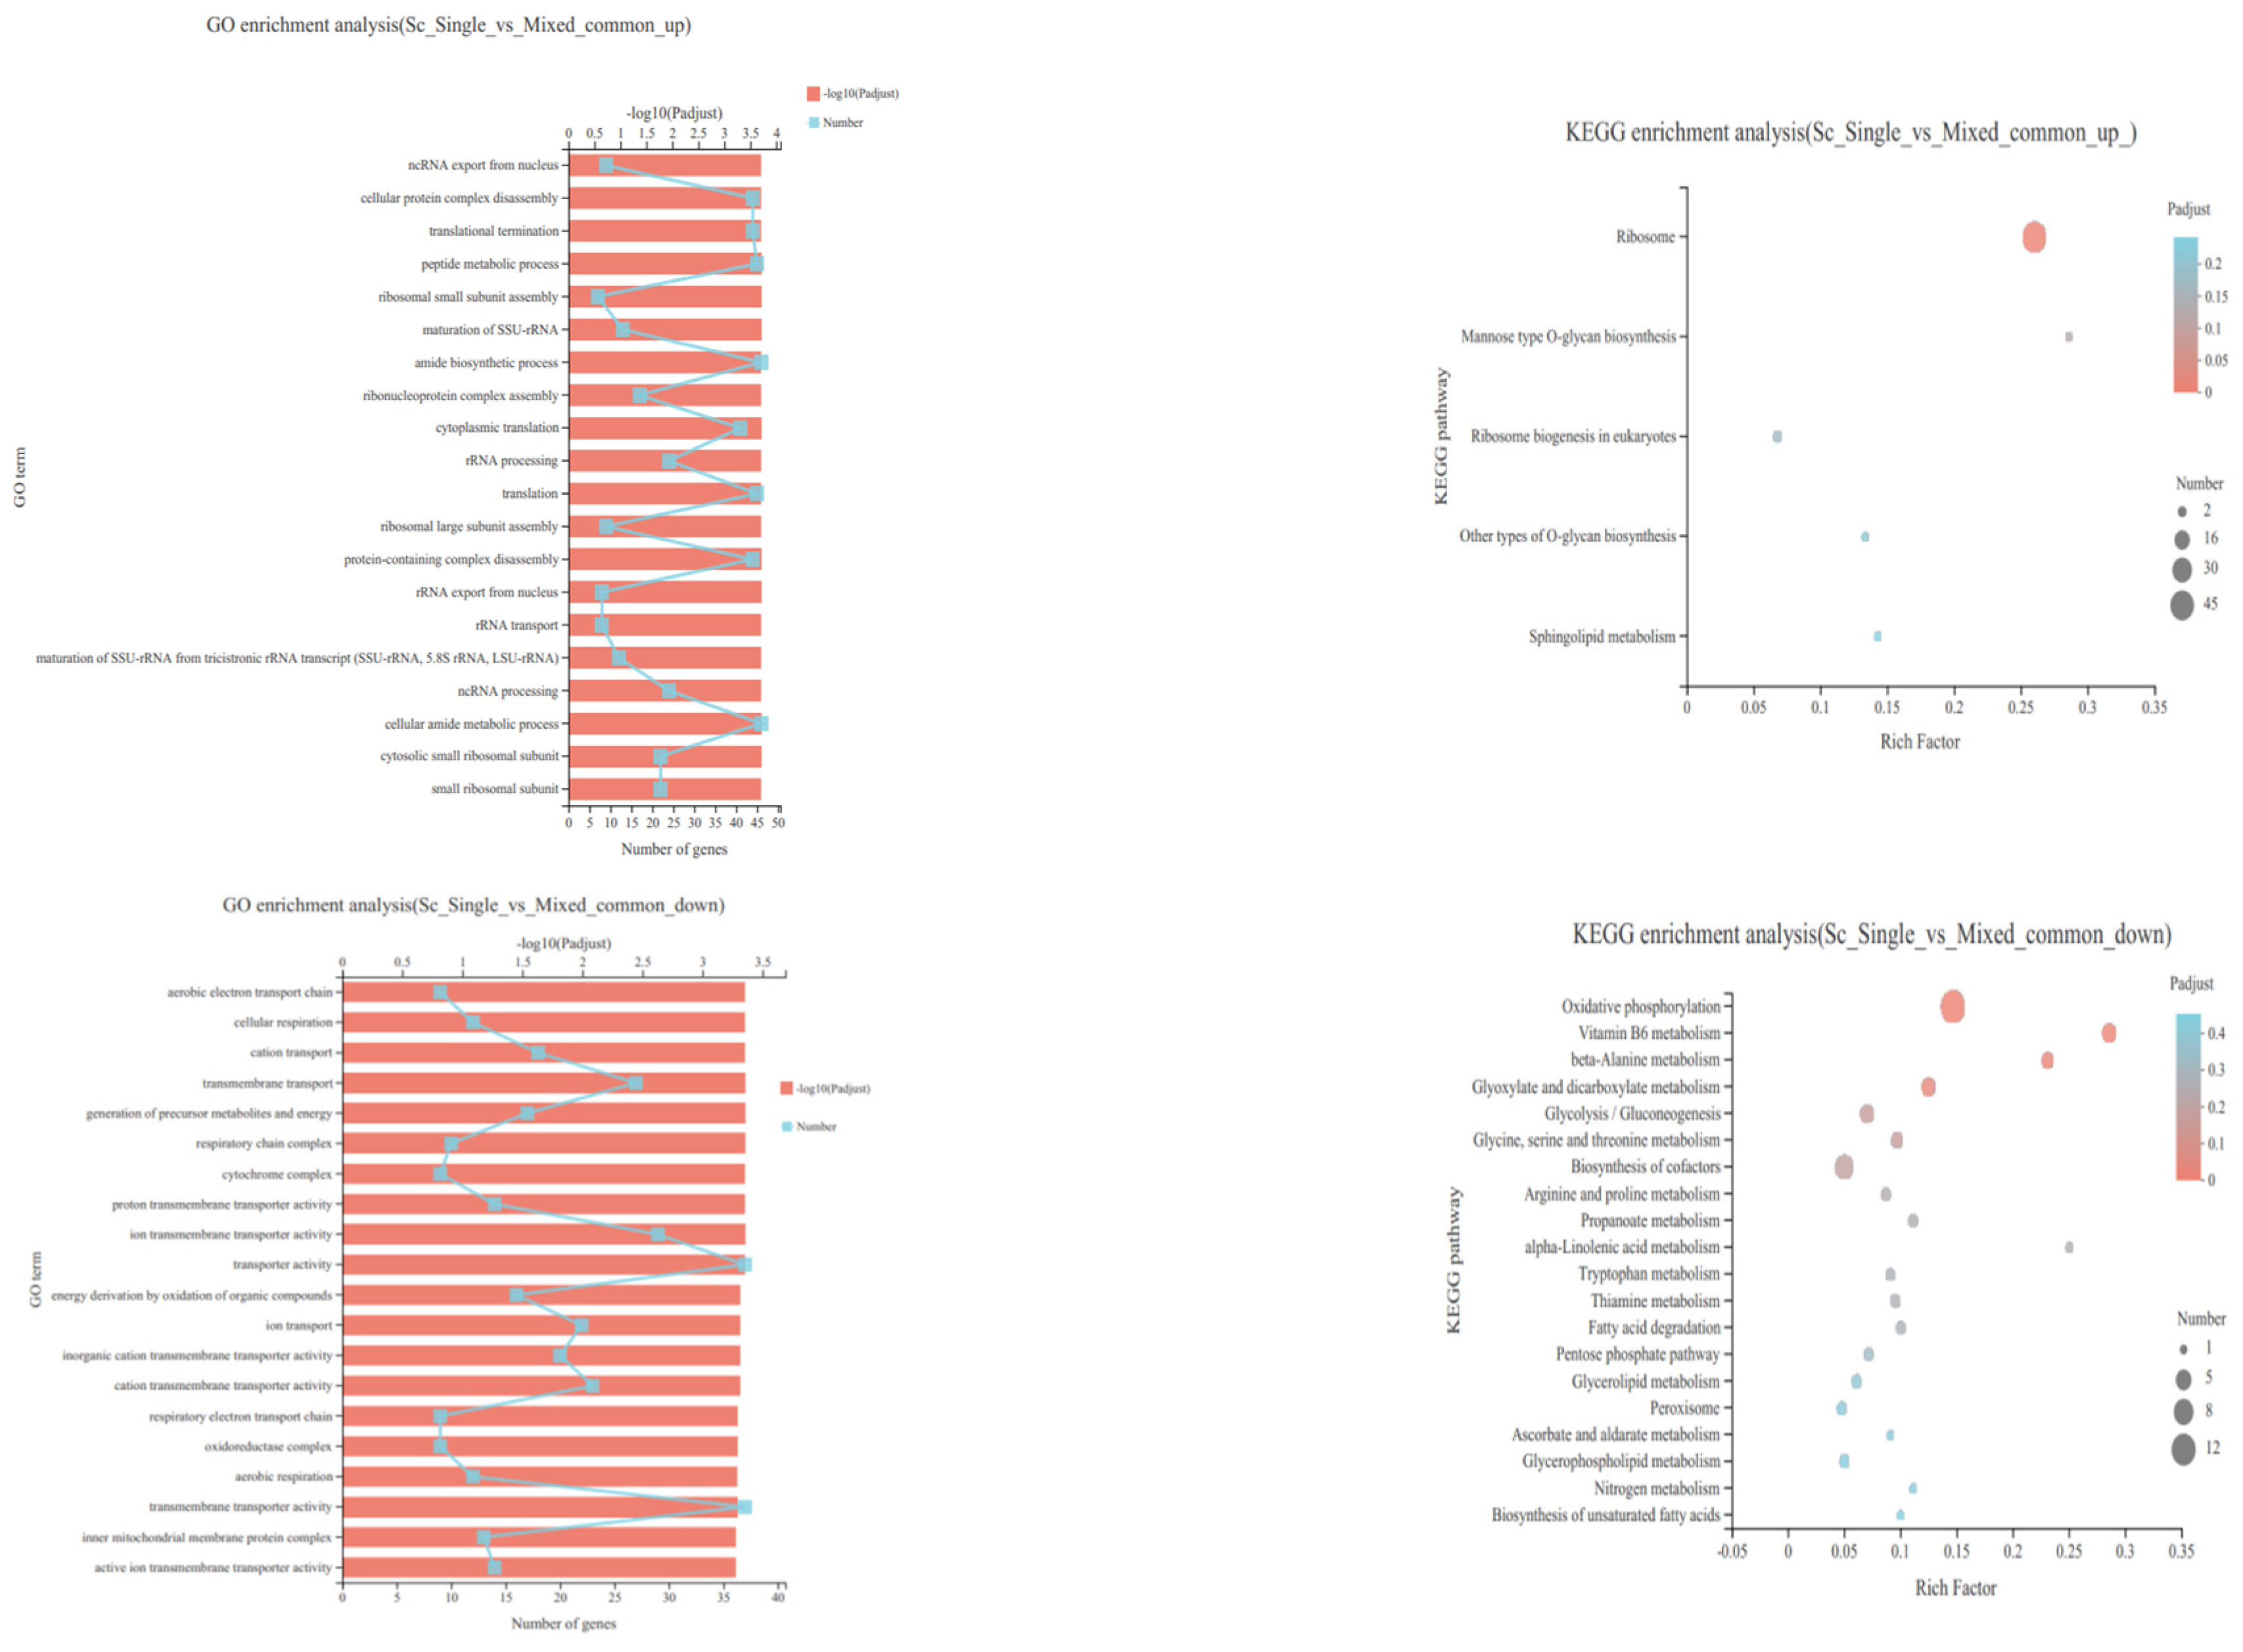
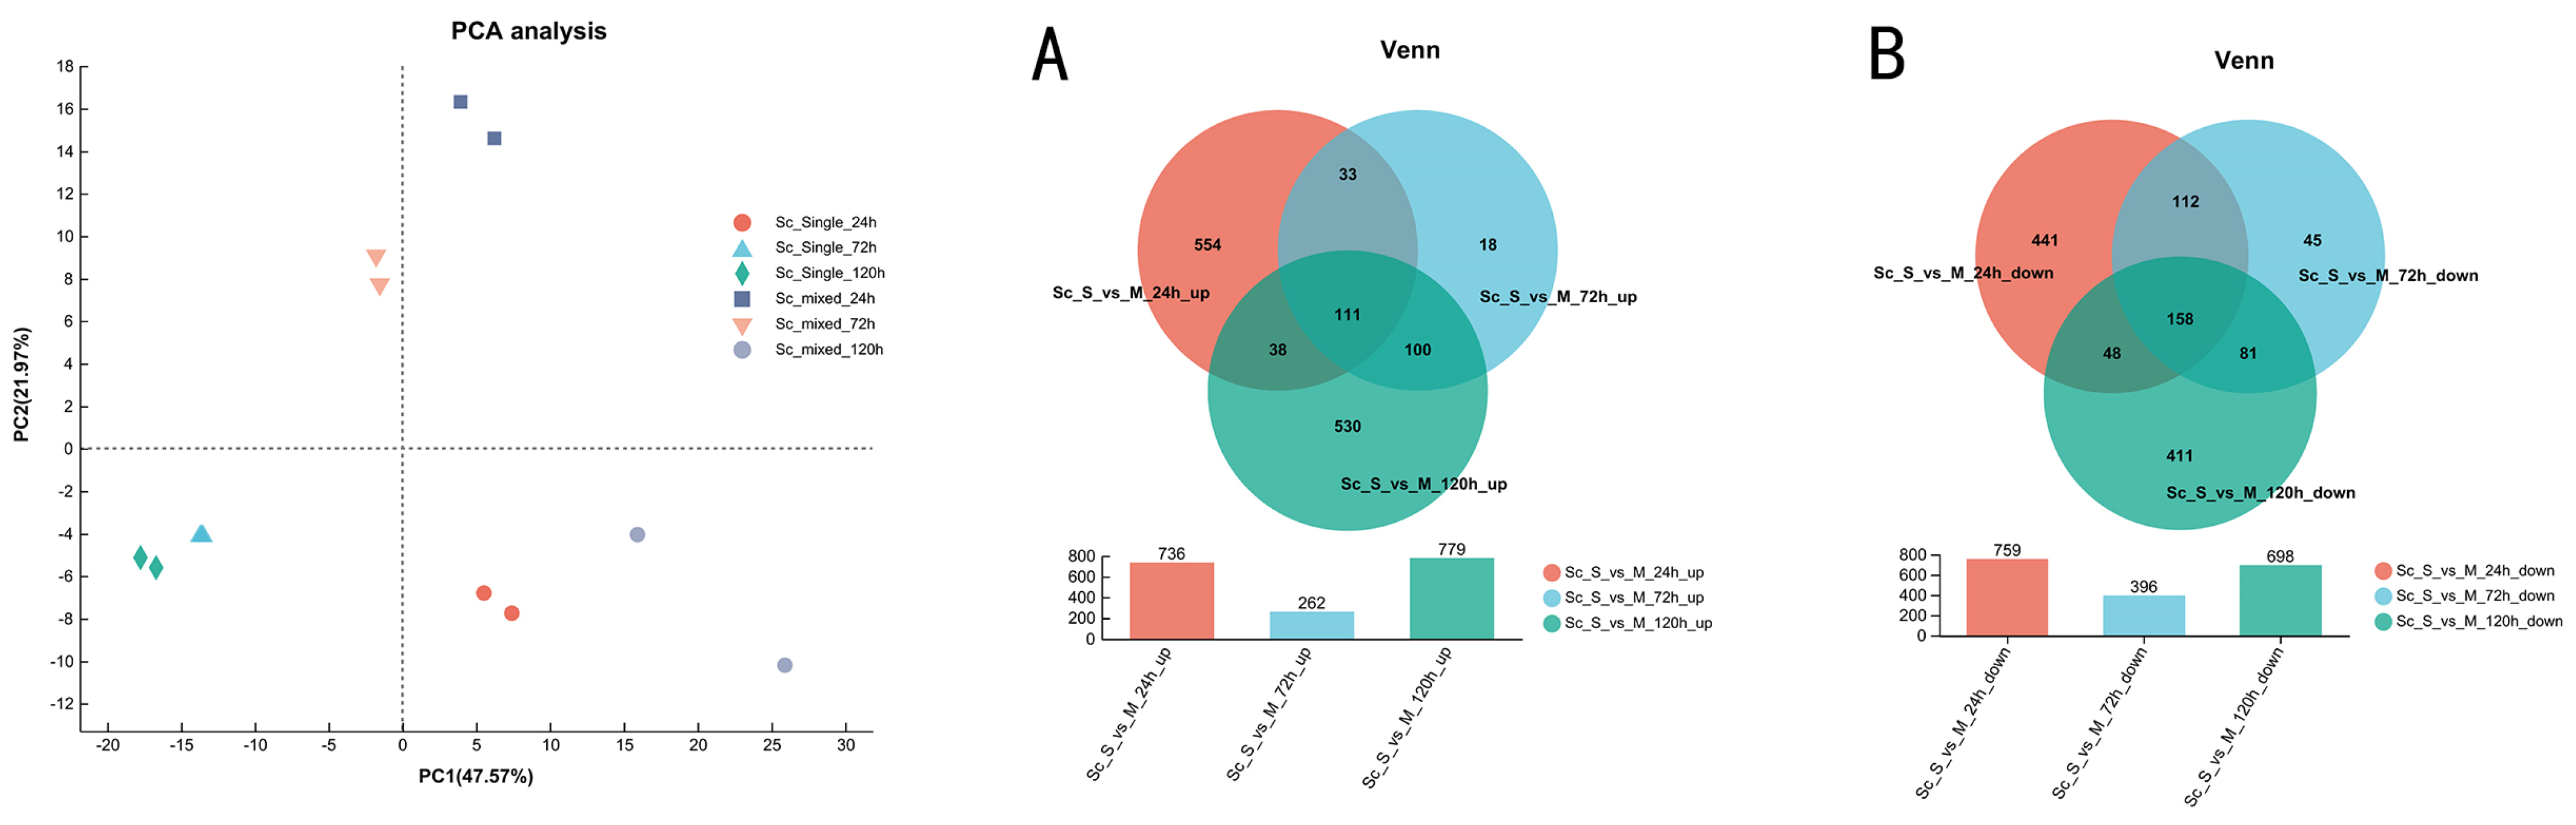
3.4. Transcriptional Profiling of S. cerevisiae in Single- and Mixed-Culture Fermentations

The transcriptomic profiling of the mixed-culture fermentation was performed at three time-points, the mid-exponential growth phase (24 h), the early stationary-phase (72 h), and the late stationary growth-phase (120 h). Principal Component Analysis (PCA) was used to check the data obtained from the microarray’s experiments, in order to get a global view on how the presence of S. cerevisiae impacted the transcriptome of S. cerevisiae throughout the mixed-culture fermentation in Figure 5. Notably, the S. cerevisiae genomic expression indicated the maximal variation at later fermentation stages, in agreement with the much higher number of genes that was found to be differentially in the pair-wise comparisons performed between the two fermentations at the same time-point. As denoted by Maligoy et al. [31], caution should be taken when analyzing transcriptome data from two parallel cultures, since the observed variance of transcript levels could be either specific to the comparison of the two culture conditions or linked to a difference in the dynamics of the two cultures. To assure that the observed changes in the expression of S. cerevisiae genes truly reflects the influence of the presence of L. hermotolerans, rather than being attributable to different fermentation stages of the mixed and single cultures, the expression of a given gene in a given fermentation stage was compared to its mean expression (calculated taking the average of the expression levels obtained in the three time points analyzed). Although the mean expression value of each gene along the fermentation is merely an arbitrary reference point, such way of analyzing gene expression mitigates the influence exerted by fermentation dynamics, while maintaining the aptitude to identify expression differences [32].
Compared with the pure breed fermentation of a single strain, the strain S. cerevisiae based on the double-yeast mixed fermentation system had 1495 DEGs at the initial 24 h of fermentation, of which 736 DEGs were up-regulated and 759 DEGs were down-regulated. This is because the inoculation ratio of the strain S. cerevisiae in the early stage of fermentation was only one tenth of that of L. thermopolerans, which was greatly affected by the dominant strain L. thermopolerans in the mixed fermentation system. The differentially expressed genes of S. cerevisiae were significant in the mixed fermentation system. With the middle stage of fermentation, the strain S. cerevisiae gradually formed growth advantages in the mixed fermentation system. Therefore, compared with single-culture fermentation, S. cerevisiae had gene differential expression decreased at 72 h, only 658 DEGs, of which 262 DEGs were up-regulated and 396 DEGs were down-regulated, and 1477 genes were differentially expressed at 120 h in the late stage of fermentation, of which 779 DEGs were up-regulated and 698 DEGs were down-regulated. It can be seen that in the process of mixed fermentation, S. cerevisiae was significantly affected by L. thermopolerans in the double-yeast mixed fermentation system, which caused a huge disturbance in the level of gene expression, and a large number of genes had regulatory changes. It can be seen that the mixed fermentation mode had a significant impact on the fermentation of S. cerevisiae.
A closer look into the functional categories of genes included in each cluster revealed that the herein observed alterations of the S. cerevisiae transcriptome along beer fermentation, either in single or in mixed-culture, are consistent with the results reported in other studies carried out with different S. cerevisiae strains and/or exploring different fermentation conditions [23,25,26,27,33].
Through the GO function enrichment analysis of the differentially expressed genes in single culture and mixed culture beer fermentation of S. cerevisiae, it was found that among the 111 up-regulated genes, the decomposition of cellular protein complex, the translation termination, the peptide metabolism process, the maturation of small ribosomal RNA subunits of SSU-rRNA. The positive regulation enrichment rate of GO items such as cytoplasmic translation, translation translation, protein-containing complex decomposition, cellular amide metabolic process is the highest. The translation process of S. cerevisiae is significantly up-regulated in the double-yeast mixed fermentation system, which is consistent with the KEGG enrichment analysis result that the expression of ribosome-related genes is significantly enriched. As shown in the Figure 6, S. cerevisiae can improve its translation level in the double-yeast mixed fermentation system to form growth advantages.
Among the 158 down-regulated genes, a large number of GO entries related to transmembrane protein and transmembrane transport process were significantly enriched and down-regulated. The results of KEGG enrichment analysis of 158 down-regulated genes showed that the genes related to oxidative phosphorylation, carbon source metabolism and nitrogen source metabolism were significantly enriched and down-regulated. In conclusion, in the double-yeast mixed fermentation system, S. cerevisiae was competitive with L. thermopolerans. The expression of related energy synthesis and carbon and nitrogen source metabolism regulation is affected, which is also consistent with the production of main products of mixed fermentation lower than that of pure yeast.

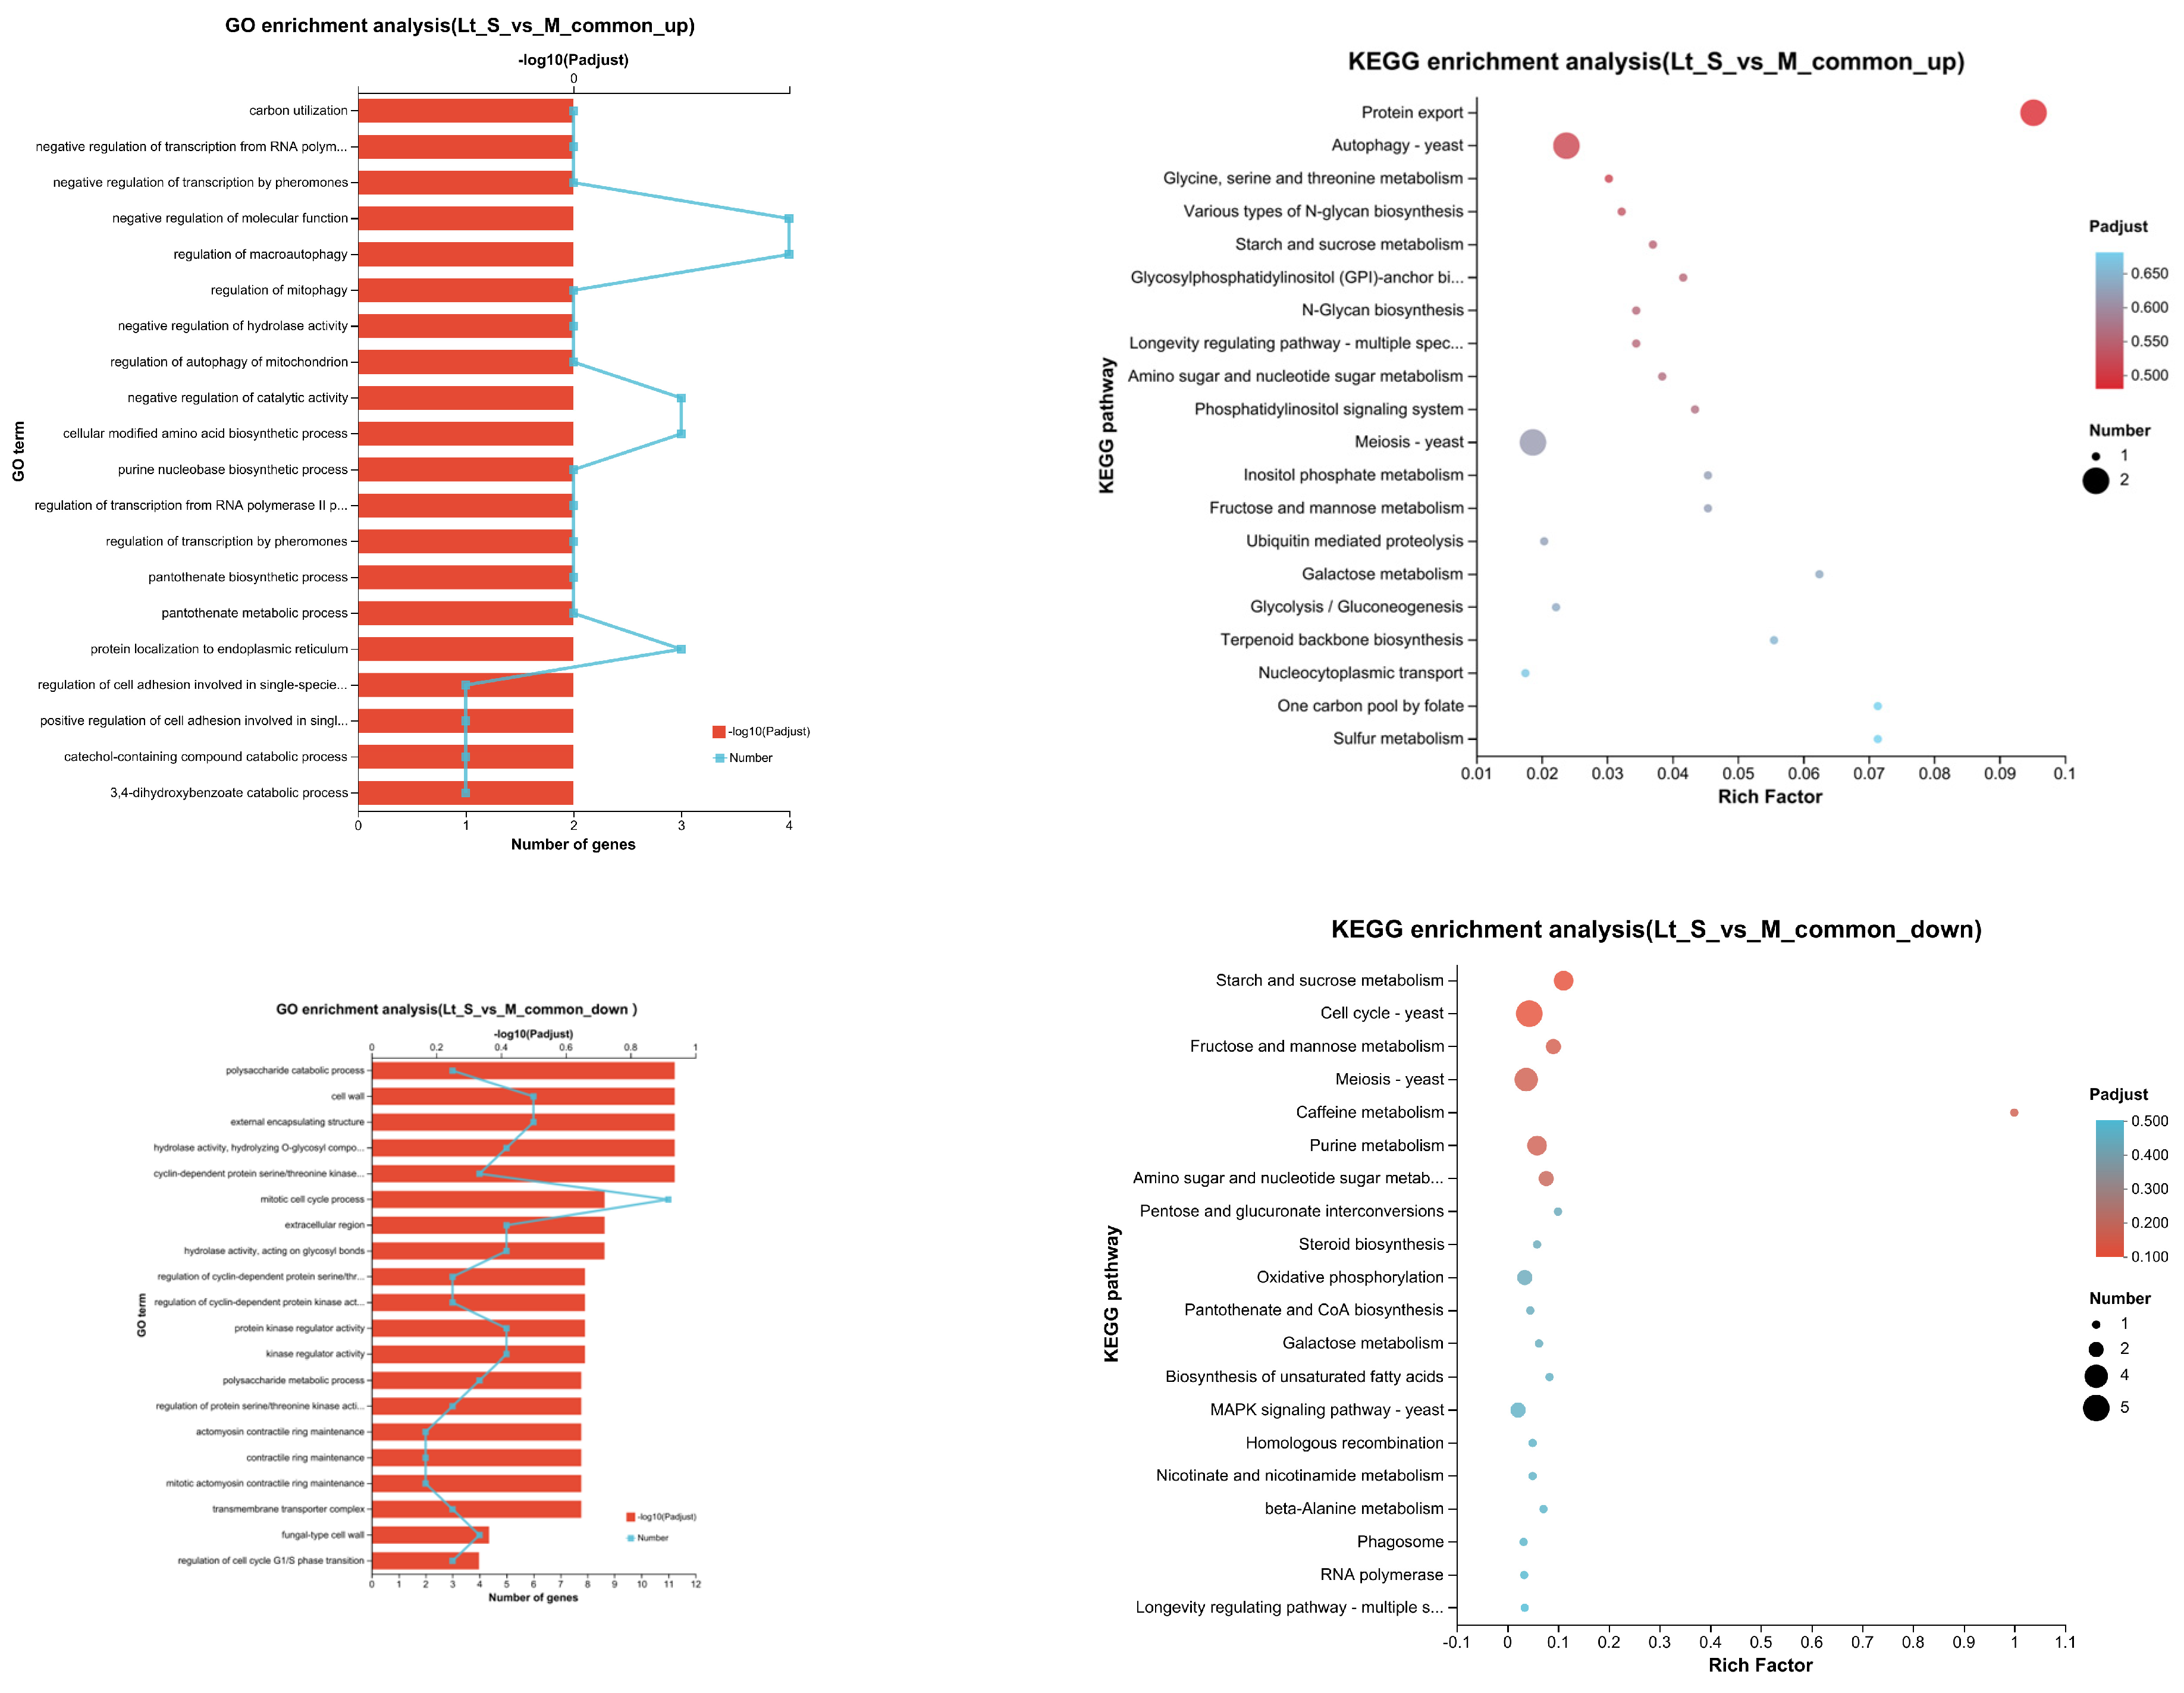
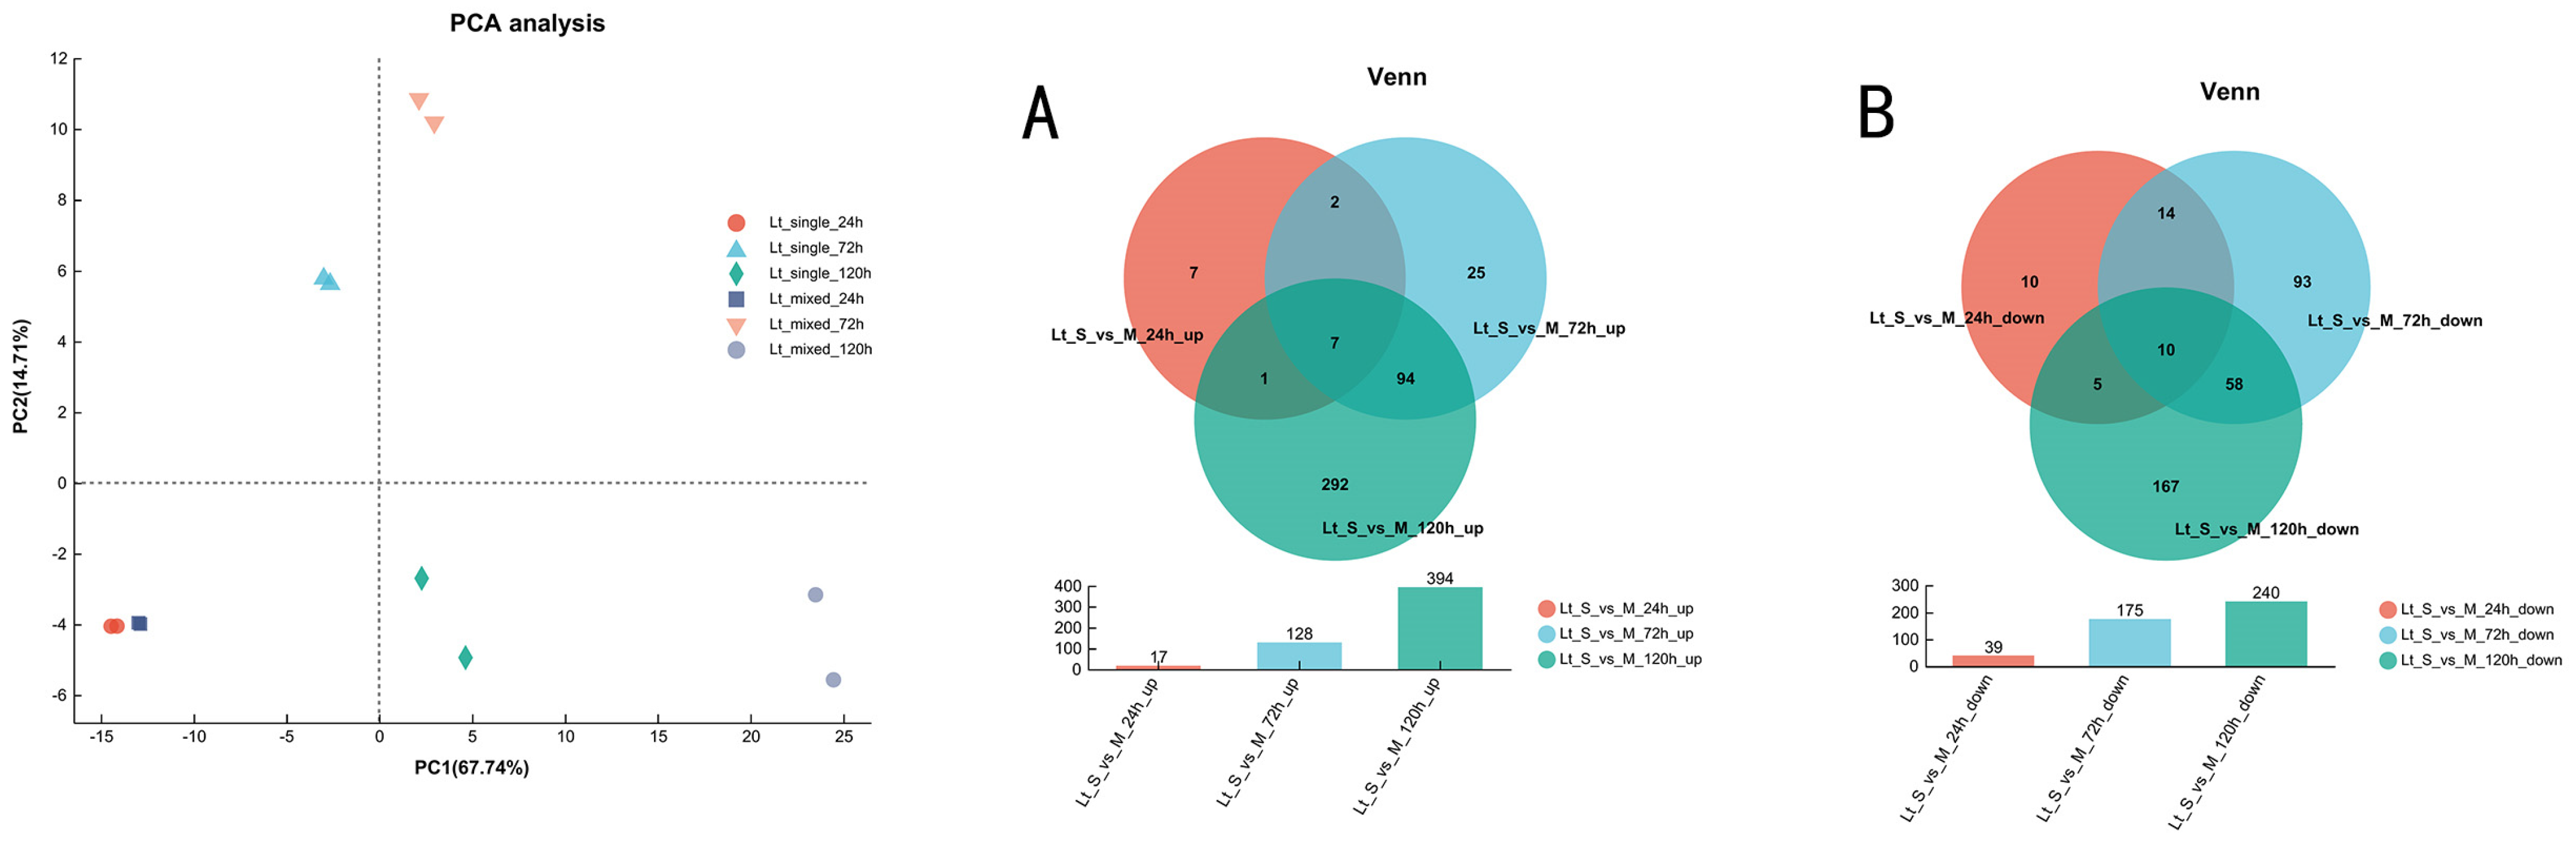
3.5. Transcriptional Profiling of L. thermotolerans in Single- and Mixed-Culture Fermentations

In order to clarify the mechanism of changes in L. thermotolerans during the double-yeast mixed fermentation, Venn analysis was performed on the up- and down-regulated genes based on the expression matrix, and the co- and specifically expressed genes/transcripts of samples could be obtained, as shown in Figure 7. A total of 7 up-regulated genes and 10 down-regulated genes were found in L. thermotolerans in the mixedfermentation, and were further analyzed for functional enrichment.
GO function enrichment analysis of differentially co-expressed genes in single and mixed culture beer fermentation of L. thermotolerans, indicated that among the 101 up-regulated genes, carbon utilization and negative regulation of transcription from RNA polymerase II promoter by pheromone regulation Synthesis ones, negative regulation of transcription by synthesis ones, negative regulation of molecular function), autophagy regulation macroautophagy, regulation of mitophagy, regulation of autophagy of mitochondrion, negative regulation of hydrolytic enzymes and catalytic activities Hydrolase activity, negative regulation of catalytic activity), modified amino acid biosynthesis (cellular modified amino acid biosynthetic process) and other GO items have the highest positive regulation enrichment rate, which is consistent with KEGG enrichment analysis results, as shown in Figure 8. In the study of beer mixed-culture fermentation [34], L. termotolerans usually declines in the early stage of fermentation. The fatal factors include its own low ethanol tolerance, low concentration of dissolved oxygen in the fermentation system and the interaction between different strains. Such as nutrient competition between strains, accumulation of harmful metabolites, contact between cells and antimicrobial peptides secreted by other strains, etc. Usually, these factors do not exist separately, but act on the whole fermentation process. The results showed that L. termotolerans constantly adjusted its gene expression in order to adapt to the harsh environment such as nutrient competition and accumulation of harmful metabolites during the middle and later stages of mixed fermentation, as the growth advantage of S. cerevisiae gradually formed in the mixed fermentation.

4. Conclusions

This study explored a novel mixed-culture fermentation strategy for sour beer production using a 10:1 ratio of L. thermotolerans and S. cerevisiae under standard industrial brewing conditions. L. thermotolerans produced lactic acid (1.5–1.8 g/L), lowered the pH to 3.3–3.4 and produced a naturally fruity sour beer with a gentle tartness, all without the addition of foreign flavoring agents. Compared to single-yeast fermentation, this double-yeast mixed fermentation yielded an enhanced fruity aroma and a more refreshing taste, as isobutyl acetate and isoamyl acetate contribute to an augmented fruity aroma, effectively balancing the sour notes and giving the beer a refreshing taste. Beyond its positive impact on beer quality, this mixed-culture fermentation method explored the potential of mixed-culture fermentation with L. thermotolerans and S. cerevisiae for the production of sour beer, while remaining harmonious with the established framework of traditional brewing practices.
Although co-fermentation remains uncommon in beer brewing due to technical challenges, this study used RNA high-throughput sequencing technology to reveal distinct shifts in gene expression at the transcriptome-level for S. cerevisiae and L. thermotolerans in mixed fermentation. The data gained from RNA sequencing can provide valuable insights into yeast behavior in mixed cultures. S. cerevisiae, to better adapt to the mixed environment, increased ribosome-related functions, up-regulated genes associated with cell wall and membrane integrity, and increased carbon and nitrogen uptake. In contrast, L. thermotolerans exhibited significant upregulation of genes linked to cell aggregation, cell death, and osmotic stress response. These findings suggest divergent adaptive strategies: S. cerevisiae, stimulated by the competitive pressure of being outnumbered, accelerated nutrient uptake and became the dominant strain by mid-fermentation, surpassing L. thermotolerans in biomass. The elevated ethanol and hypoxia conditions generated by S. cerevisiae posed a stress challenge to L. thermotolerans, as evidenced by their weaker adaptation and up-regulation of stress-related genes, highlighting their vulnerability in this mixed-culture system.
This study provides new insights into the role of RNA-seq in analyzing changes in the transcriptome of mixed cultures. Combining RNA sequencing (RNA-Seq) and metabolite data helps to better understand the distribution of metabolic fluxes in S. cerevisiae and non-Saccharomyces yeasts, potentially leading to strategies to modulate transcriptional responses associated with aroma compounds.

Author Contributions

Methodology, X.F.; Software, Y.L. and X.C.; Validation, L.G.; Formal analysis, X.F.; Investigation, X.F.; Writing—original draft, X.F.; Writing—review & editing, X.F.; Supervision, Y.S. and S.L. All authors have read and agreed to the published version of the manuscript.

Funding

This research received no external funding.

Institutional Review Board Statement

Not applicable.

Informed Consent Statement

Not applicable.

Data Availability Statement

The data are contained within the article.

Conflicts of Interest

Authors Xiaofen Fu, Liyun Guo and Yumei Song were employed by the company Technology Center of Beijing Yanjing Beer Co., Ltd. The remaining authors declare that the research was conducted in the absence of any commercial or financial relationships that could be construed as a potential conflict of interest. The authors declare no conflicts of interest.

References

  1. Ciani, M.; Comitini, F.; Mannazzu, I.; Domizio, P. Controlled mixed culture fermentation: A new perspective on the use of non-Saccharomyces yeasts in winemaking. FEMS Yeast Res. 2010, 10, 123–133. [Google Scholar] [CrossRef]
  2. Comitini, F.; Gobbi, M.; Domizio, P.; Romani, C.; Lencioni, L.; Mannazzu, I.; Ciani, M. Selected non-Saccharomyces wine yeasts in controlled multistarter fermentations with Saccharomyces cerevisiae. Food Microbiol. 2011, 28, 873–882. [Google Scholar] [CrossRef]
  3. Hansen, E.H.; Nissen, P.; Sommer, P.; Nielsen, J.C.; Arneborg, N. The effect of oxygen on the survival of non-Saccharomyces yeasts during mixed culture fermentations of grape juice with Saccharomyces cerevisiae. J. Appl. Microbiol. 2001, 91, 541–547. [Google Scholar] [CrossRef]
  4. Quirós, M.; Rojas, V.; Gonzalez, R.; Morales, P. Selection of non-Saccharomyces yeast strains for reducing alcohol levels in wine by sugar respiration. Int. J. Food Microbiol. 2014, 181, 85–91. [Google Scholar] [CrossRef]
  5. Shekhawat, K.; Bauer, F.F.; Setati, M.E. Impact of oxygenation on the performance of three non-Saccharomyces yeasts in co-fermentation with Saccharomyces cerevisiae. Appl. Microbiol. Biotechnol. 2017, 101, 2479–2491. [Google Scholar] [CrossRef]
  6. Ciani, M.; Beco, L.; Comitini, F. Fermentation behavior and metabolic interactions of multistarter wine yeast fermentations. Int. J. Food Microbiol. 2006, 108, 239–245. [Google Scholar] [CrossRef] [PubMed]
  7. Ciani, M.; Capece, A.; Comitini, F.; Canonico, L.; Siesto, G.; Romano, P. Yeast interactions in inoculated wine fermentation. Front. Microbiol. 2016, 7, 555. [Google Scholar] [CrossRef]
  8. Moenne, M.I.; Saa, P.; Felipe Laurie, V.; Ricardo Pérez-Correa, J.; Agosin, E. Oxygen incorporation and dissolution during industrial-scale red wine fermentations. Food Bioprocess Technol. 2014, 9, 2627–2636. [Google Scholar] [CrossRef]
  9. Boulton, R.B.; Singleton, V.L.; Bisson, L.F.; Kunkee, R.E. Principles and Practices of Winemaking; Springer-Verlag Inc.: New York, NY, USA, 1996. [Google Scholar]
  10. Gobbi, M.; Comitini, F.; Domizio, P.; Romani, C.; Lencioni, L.; Mannazzu, I.; Ciani, M. Lachancea thermotolerans and Saccharomyces cerevisiae in simultaneous and sequential co-fermentation: A strategy to enhance acidity and improve the overall quality of wine. Food Microbiol. 2013, 33, 271–281. [Google Scholar] [CrossRef] [PubMed]
  11. Sadoudi, M.; Tourdot-Marechal, R.; Rousseaux, S.; Steyer, D.; Gallardo-Chacon, J.J.; Ballester, J.; Vichi, S.; Guerin-Schneider, R.; Caixach, J.; Alexandre, H. Yeast-yeast interactions revealed by aromatic profile analysis of sauvignon blanc wine fermented by single or co-culture of non-Saccharomyces and Saccharomyces yeasts. Food Microbiol. 2012, 32, 243–253. [Google Scholar] [CrossRef] [PubMed]
  12. Soden, A.; Francis, I.L.; Oakey, H.; Henschke, P.A. Effect of co-fermentation with Candida stellata and Saccharomyces cerevisiae on the aroma and composition of chardonnay wine. Aust. J. Grape Wine Res. 2000, 6, 21–30. [Google Scholar] [CrossRef]
  13. Nissen, P.; Nielsen, D.; Arneborg, N. Viable Saccharomyces cerevisiae cells at high concentrations cause early growth arrest of non-Saccharomyces yeasts in mixed cultures by a cell-cell contact- mediated mechanism. Yeast 2003, 20, 331–341. [Google Scholar] [CrossRef] [PubMed]
  14. Pérez-Nevado, F.; Albergaria, H.; Hogg, T.; Girio, F. Cellular death of two non-Saccharomyces wine-related yeasts during mixed fermentations with Saccharomyces cerevisiae. Int. J. Food Microbiol. 2006, 108, 336–345. [Google Scholar] [PubMed]
  15. Albergaria, H.; Francisco, D.; Gori, K.; Arneborg, N.; Girio, F. Saccharomyces cerevisiae CCMI 885 secretes peptides that inhibit the growth of some non-Saccharomyces wine-related strains. Appl. Microbiol. Biotechnol. 2010, 86, 965–972. [Google Scholar] [CrossRef]
  16. Rossouw, D.; Meiring, S.; Bauer, F.F. Modifying Saccharomyces cerevisiae adhesion properties regulates yeast ecosystem dynamics. mSphere 2018, 3, e00383-18. [Google Scholar] [CrossRef] [PubMed]
  17. Schmitt, M.E.; Brown, T.A.; Trumpower, B.L. A rapid and simple method for preparation of RNA from Saccharomyces cerevisiae. Nucleic Acids Res. 1990, 18, 3091–3092. [Google Scholar] [CrossRef] [PubMed]
  18. HannonLab. Fastx-Toolkit. 2010. Available online: http://hannonlab.cshl.edu/fastx_toolkit/index.html (accessed on 10 May 2016).
  19. Morgan, M.; Anders, S.; Lawrence, M.; Aboyoun, P.; Pagès, H.; Gentleman, R. ShortRead: A Bioconductor package for input, quality assessment and exploration of high-throughput sequence data. Bioinformatics 2009, 25, 2607–2608. [Google Scholar] [CrossRef] [PubMed]
  20. Martin, M. Cutadapt removes adapter sequences from high-throughput sequencing reads. EMBnet J. 2011, 17, 10–12. [Google Scholar] [CrossRef]
  21. Trapnell, C.; Pachter, I.; Salzberg, S.L. TopHat: Discovering splice junctions with RNA-seq. Bioinformatics 2009, 25, 1105–1111. [Google Scholar] [CrossRef]
  22. Anders, S.; Pyl, P.T.; Huber, W. HTSeq-a Python framework to work with highthroughput sequencing data. Bioinformatics 2015, 31, 166–169. [Google Scholar] [CrossRef]
  23. Barbosa, C.; Mendes-Faia, A.; Lage, P.; Mira, N.P.; Mendes-Ferreira, A. Genomic expression program of Saccharomyces cerevisiae along a mixed-culture wine fermentation with Hanseniaspora guilliermondii. Microb. Cell Factories 2015, 14, 124. [Google Scholar] [CrossRef] [PubMed]
  24. Bron, P.A.; Wels, M.; Bongers, R.S.; van Bokhorst-van, V.; Wiersma, A.; Overmars, L.; Marco, M.L.; Kleerebezem, M. Transcriptomes reveal genetic signatures underlying physiological variations imposed by different fermentation conditions in Lactobacillus plantarum. PLoS ONE 2012, 7, e38720. [Google Scholar] [CrossRef] [PubMed]
  25. de Groot, M.J.L.; Daran-Lapujade, P.; van Breukelen, B.; Knijnenburg, T.H.; Pronk, J.T.; Slijper, M.; Heck, A.J.R. Quantitative proteomics and transcriptomics of anaerobic and aerobic yeast cultures reveals post-transcriptional regulation of key cellular processes. Microbiology 2007, 153, 3864–3878. [Google Scholar] [CrossRef] [PubMed]
  26. Gasch, A.P.; Spellma, P.T.; Kao, C.M.; Carmel-Harel, O.; Eisen, M.B.; Storz, G.; Botstein, D.; Brown, P.O. Genomic expression programs in the response of yeast cells to environmental changes. Mol. Biol. Cell 2000, 11, 4241–4257. [Google Scholar] [CrossRef] [PubMed]
  27. Koskenniemi, K.; Laakso, K.; Koponen, J.; Kankainen, M.; Greco, D.; Auvinen, P.; Savijoki, K.; Nyman, T.A.; Surakka, A.; Salusjarvi, T.; et al. Proteomics and transcriptomics characterization of bile stress response in probiotic Lactobacillus rhamnosus GG. Mol. Cell. Proteom. 2011, 10, M110.002741. [Google Scholar] [CrossRef] [PubMed]
  28. Lee, J.Y.; Pajarillo, E.A.; Kim, M.J.; Chae, J.P.; Kang, D.K. Proteomic and transcriptional analysis of Lactobacillus johnsonii PF01 during bile salt exposure by iTRAQ shotgun proteomics and quantitative RT-PCR. J. Proteome Res. 2013, 12, 432–443. [Google Scholar] [CrossRef] [PubMed]
  29. Mostert, T.T.; Divol, B. Investigating the proteins released by yeasts in synthetic wine fermentations. Int. J. Food Microbiol. 2014, 171, 108–118. [Google Scholar] [CrossRef]
  30. Rossouw, D.; Du Toit, M.; Bauer, F.F. The impact of co-inoculation with Oenococcus oeni on the transcriptome of Saccharomyces cerevisiae and on the flavour-active metabolite profiles during fermentation in synthetic must. Food Microbiol. 2012, 29, 121–131. [Google Scholar] [CrossRef]
  31. Baumann, K.; Dato, L.; Graf, A.A.B.; Frascotti, G.; Dragositis, M.; Porro, D.; Mattanovich, D.; Ferrer, P.; Branduardi, P. The impact of oxygen on the transcriptome of recombinant S. cerevisiae and P. pastoris–a comparative analysis. BMC Genom. 2011, 12, 218. [Google Scholar] [CrossRef]
  32. Hodgins-Davis, A.; Adomas, A.B.; Warringer, J.; Townsend, J.P. Abundant geneby-environment interactions in gene expression reaction norms to copper within Saccharomyces cerevisiae. Genome Biol. Evol. 2012, 11, 1061–1079. [Google Scholar] [CrossRef]
  33. Rivero, D.; Berná, L.; Stefanini, I.; Baruffini, E.; Bergerat, A.; Csikász-Nagy, A.; Filippo, C.; Cavalieri, D. Hsp12p and PAU genes are involved in ecological interactions between natural yeast strains. Environ. Microbiol. 2015, 17, 3069–3081. [Google Scholar] [CrossRef] [PubMed]
  34. Henschke, P.; Jiranek, V. Yeasts-metabolism of nitrogen compounds. In Wine Microbiology and Biotechnology; Fleet, G.H., Ed.; Harwood Academic: Chur, Switzerland, 1993; pp. 77–164. [Google Scholar]
Figure 1. Available sugars content and CO2 release of pure-culture wort fermentation. (A) available sugars content of pure-culture wort fermentation. (B) CO2 release of pure-culture wort fermentation.
Fermentation 10 00180 g001
Figure 2. Quantitative analysis of different strains during double-yeast mixed fermentation by EMA-qPCR.
Fermentation 10 00180 g002
Figure 3. Sensory properties for the three different beer produced by pure and double-yeast mixed fermentation.
Fermentation 10 00180 g003
Figure 4. Simplified scheme of the strategy followed in the transcriptomic.
Fermentation 10 00180 g004
Figure 5. Principal Component Analysis (PCA) plot of the biological replicates of transcripts for each time point in mixed ande single beer fermentation of S. cerevisiae (Sc). (A,B) Venn diagram showing up-regulated and down-regulated significant genes (DEGs) commonly regulated for each time point in mixed ande single beer fermentation of S. cerevisiae (Sc).
Fermentation 10 00180 g005
Figure 6. DEGs associated with the enrichment of the cellular component GO terms in S. cerevisiae.
Fermentation 10 00180 g006
Figure 7. Principal Component Analysis (PCA) plot of the biological replicates of transcripts for each time point in mixed ande single beer fermentation of L. thermotolerans. (A,B) Venn diagram showing up-regulated and down-regulated significant genes (DEGs) commonly regulated for each time point in mixed and single beer fermentation of L. thermotolerans.
Fermentation 10 00180 g007
Figure 8. DEGs associated with the enrichment of the cellular component GO terms in L. thermotolerans.
Fermentation 10 00180 g008
Table 1. Organic acid production from wort fermented by 5 non-Saccharomyces yeast strains.
Organic Acid
mg/L
Yeast Strains
K. marxianus 1695K. marxianus 1042L. thermotolerans 1548L. thermotolerans FBA-2B. bruxellens
WDB24
S. cerevisiae 68obg
Lactic acid539.6 ± 2.31 d966.83 ± 6.13 c1517.57 ± 6.75 b2573.18 ± 3.66 a254.66 ± 4.18 e156.37 ± 3.63 f
Acetic acid168.12 ± 3.81 d239.23 ± 0.45 b226.6 ± 1.42 c121.92 ± 2.14 f324.17 ± 2.43 a104.31 ± 1.59 e
Formic acid3.75 ± 0.44 cd4.3 ± 0.10 c4.15 ± 0.07 cd11.54 ± 0.57 a8.87 ± 0.52 b3.64 ± 0.33 d
Pyruvic acid106.68 ± 4.16 d132.15 ± 0.78 c98.59 ± 2.52 e145.94 ± 1.95 b130.74 ± 1.78 c157.38 ± 2.73 a
Succinic acid249.27 ± 4.43 c249.83 ± 1.69 c312.49 ± 0.50 b209.69 ± 2.33 d212.37 ± 3.29 d513.41 ± 10.21 a
Oxalic acid26.22 ± 0.45 c29.52 ± 1.22 b22.7 ± 1.25 d37.33 ± 0.92 a24.86 ± 0.84 cd29.54 ± 2.71 b
Fumaric acid2.08 ± 0.17 c2.59 ± 0.07 c2.45 ± 0.29 c2.68 ± 0.33 c3.31 ± 0.08 b5.36 ± 0.75 a
Citric acid 195.50 ± 1.11 c194.17 ± 0.56 c212.52 ± 0.88 b193.26 ± 2.99 c188.97 ± 1.29 d293.41 ± 1.23 a
Data are means ± standard deviations of three separate replicates. Values with different superscript letters (a,b,c,d,e,f) within each row are significantly different, according to the Duncan test (p > 0.05).
Disclaimer/Publisher’s Note: The statements, opinions and data contained in all publications are solely those of the individual author(s) and contributor(s) and not of MDPI and/or the editor(s). MDPI and/or the editor(s) disclaim responsibility for any injury to people or property resulting from any ideas, methods, instructions or products referred to in the content.

