1. Introduction
Carbohydrates comprise a variety of sugars, mainly lower-molecular carbohydrates which share certain traits regarding chemical structure and reactivity. Carbohydrates form the largest portion of the organic matter in plants and feed materials, so are of great importance as storage compounds, structure elements, and energy sources. They can be assigned to different groups based on certain traits, such as chemical structure (e.g., mono-, di-, oligo-, and polysaccharides, sugar alcohols, sugar phosphates), physico-chemical properties (e.g., redox potential, hydrolytic stability, solubility in different solvents), and function (e.g., storage or matrix/cell wall carbohydrates). Regarding the detection of the carbohydrate fractions in plant and feed materials, it is advisable to divide them into non-structural (NSC) and structural (SC) carbohydrates. The SC comprise hemicelluloses, celluloses, and pectins, as well as plant gums. In contrast to cellulose, hemicelluloses are the polysaccharide part of the plant which can be more easily accessed by chemicals, e.g., by extraction with bases. Mono-, di-, and oligosaccharides, starch, and fructans represent the major compounds of the NSC fraction.
The detection of sugar monomers and fructans provides important information for the evaluation of carbohydrate metabolism in plants and animals. Single sugars can be analysed by enzymatic or chromatographic methods. Although enzymatic assays are characterised by high specificity and sensitivity, only one sugar species can be detected. Hall [
1] reported that reducing sugars and condensation assays are widely used for the analysis of water soluble carbohydrates in feeds. They require the hydrolysis of oligo- and polysaccharides to monomers which will be measured, which means that specific carbohydrates are not detected. In contrast, chromatographic methods (gas-chromatography, GC, and high-performance liquid chromatography, HPLC), offer the advantage of the simultaneous detection of a variety of sugars with rapid, specific, and sensitive measurement. HPLC is mainly used for sugar analysis in foods [
2,
3]. Furthermore, HPLC is the most common chromatographic method for analysing these compounds in plants and feed materials. An overview, with references, of HPLC methods which are used for sugar analysis in forages is given in
Table 1.
For the detection of sugar monomers by HPLC, they must be present in a soluble state. In most cases water or ethanol is used as the extraction solvent.
However, which sugar fractions can be separated by chromatography is affected by the solvent used, and its concentration. While aqueous extracts may contain mono-, di-, and oligosaccharides, and fructans [
10,
11,
12], only a small proportion of lower-molecular fructans dissolve in 80% ethanol [
5,
13]. The lower the concentration of ethanol in the extracting agent, the more higher-polymeric fructans will be extracted [
14].
For the separation of single sugars by HPLC, various columns and detectors can be used. According to Scott [
2], columns with polymer-based cations have low detection limits and can be employed in combination with a refraction index (RI) detector. The individual sugars form complexes with cations, e.g., Ca
2+ and Pb
2+, whose binding strength is affected by the chemical structure of the sugar and the cation species. Deionised water is used as an eluent, and a flow gradient is not needed. In most cases, the column is heated to a temperature of 85 °C. However, Scott [
2] reported problems with using this method to separate sucrose from maltose and mentioned, despite reasonable column stability, damage to the column by organic acids, methanol, and salts.
Glucose, fructose, and sucrose belong to the group of the most frequently-occurring lower-molecular carbohydrates in plants. Other monosaccharides, which can be detected after hydrolysis of cell-wall components of plants for food and feed use, are summarised in
Table 2.
Fructans represent the most prominent storage carbohydrates in temperate and cool zone grasses [
23]. Fructans are mainly determined in feeds and forages for horses as they can cause, if overfed, diseases, such as laminitis, in this species [
24]. In the literature, five types of fructans in plants are described [
25], all with β-linkage: inulin β 2-1, levan β 2-6, branched β 2-1 and 2-6, inulin neoseries β 2-1, and levan neoseries β 2-6. The HPLC methods mostly use inulin as a standard. According to Apolinário et al. [
26], the extraction, isolation, and characterisation of inulin-type fructans have gained attention in recent years due to their wide distribution in nature, and their significant role in industry.
This study aims to develop a rapid, sensitive, and reproducible analytical method to determine a variety of sugar monomers and fructans in aqueous extracts of plants and feed materials. For this purpose, an existing HPLC system using an RI detector was enhanced with regard to column type and temperature, eluent, and flow rate. Moreover, the recovery (RC) rate of single sugars and the precision of the method were determined. The scope of the method concerning the detection of fructans with inulin as a standard is discussed.
2. Materials and Methods
2.1. Chemicals
The reference sugars were: sucrose (purity > 99.5%), d-(+)-glucose (purity > 99.5%), d-(−)-fructose, (purity > 99%), d-(+)-maltose monohydrate (purity > 99%), d-(+)-lactose monohydrate (ACS reagent), l-xylose (purity > 99%), d-(+)-galactose (purity > 99%), l-rhamnose (purity 98%), d-(+)-mannose (purity > 99%), d-(−)-ribose (purity > 99%), isomaltose (purity 98%), mannitol (ACS reagent), verbascose (purity 98%), as well as inulin, which were all obtained from Sigma-Aldrich (now Fa. Merck, Darmstadt, Germany). In addition, stachyose (purity 98%), d-(+)-cellobiose (purity 98%), and d-(+)-raffinose pentahydrate (98%) from Roth GmbH, and d-arabinose (purity 99%) from Alfa Aesar were used. HPLC-grade water and 0.01 N sulfuric acid solution (Fa. Merck, Darmstadt, Germany) were used as mobile phases.
2.2. Preparation of Standard Solutions and Mixtures of Standard Solutions
To estimate the retention times of single sugars in the tested chromatographic system, in each case 100 mg of the following single sugars were weighed in a 100 mL calibrated flask: verbascose, stachyose, raffinose, cellobiose, sucrose, isomaltose, maltose, lactose, glucose, xylose, galactose, arabinose, fructose, ribose, mannitol, and inulin.
A six-point calibration curve was developed for each of the following nine single sugars: sucrose, maltose, lactose, glucose, xylose, glactose, arabinose, fructose, and ribose, as well as the sugar alcohol mannitol, and the polysaccharide inulin.
For the quantification of mixtures of single sugars, a stock solution containing either 100 mg (low standard) or 300 mg (high standard) of each sugar species was prepared in a 100 mL calibrated flask. After the transfer of the required sugar quantity, HPLC-grade water was added up to the calibration mark. At first, inulin was weighed in the flask, supplemented with approximately 30 mL of water, and dissolved in a hot water bath. After complete dissolution and cool-down of the inulin solution, the remaining sugar species were added and, finally, the flask was filled with water up to the calibration mark.
The series of standard solutions for external calibration was prepared by decanting differing volumes of the stock solution into a 25 mL flask, which was subsequently filled up to the calibration mark with HPLC-grade water:
Low standard: 1.25, 2.50, 3.75, 5.00, 6.25, 7.50 mL, respectively, in a 25 mL flask, representing concentrations of individual sugars of 5, 10, 15, 20, 25, or 30 mg/100 mL
High standard: 1.25, 2.50, 5.00, 12.50, 20.00, 25.00 mL, respectively, in a 25 mL flask, giving final concentrations of individual sugars of 15, 30, 60, 150, 240 and 300 mg/100 mL.
For the quantification of fructan (as inulin) alone, 300 mg of inulin was weighed in a 100 mL calibrated flask and dissolved in water. Next, the flask was shaken in a hot water bath for some minutes. As soon as possible after cooling the serial dilution was prepared: 1.25, 2.50, 5.00, 12.50, 20.00, and 25.00 mL, respectively, in 25 mL flasks, giving final concentrations of inulin of 15, 30, 60, 150, 240, and 300 mg/100 mL.
2.3. Optimisation of Chromatographic Analysis for Separation of Carbohydrates
The HPLC system used in this study (LC 20, Shimadzu, Germany) was composed of a pump, an autosampler with a storage temperature of 4 °C, a column oven, and a refraction index detector (RID), and was run isocratically. The following columns were tested: Knauer Eurokat Pb, Nucleosil CHO 620 and Nucleosil CHO 682 (Pb), Machery-Nagel, and BioRad Aminex HPX-87C; all with a length of 300 mm × 7.8 mm particle size, and combined with a pre-column cartridge (21 × 4.6 mm).
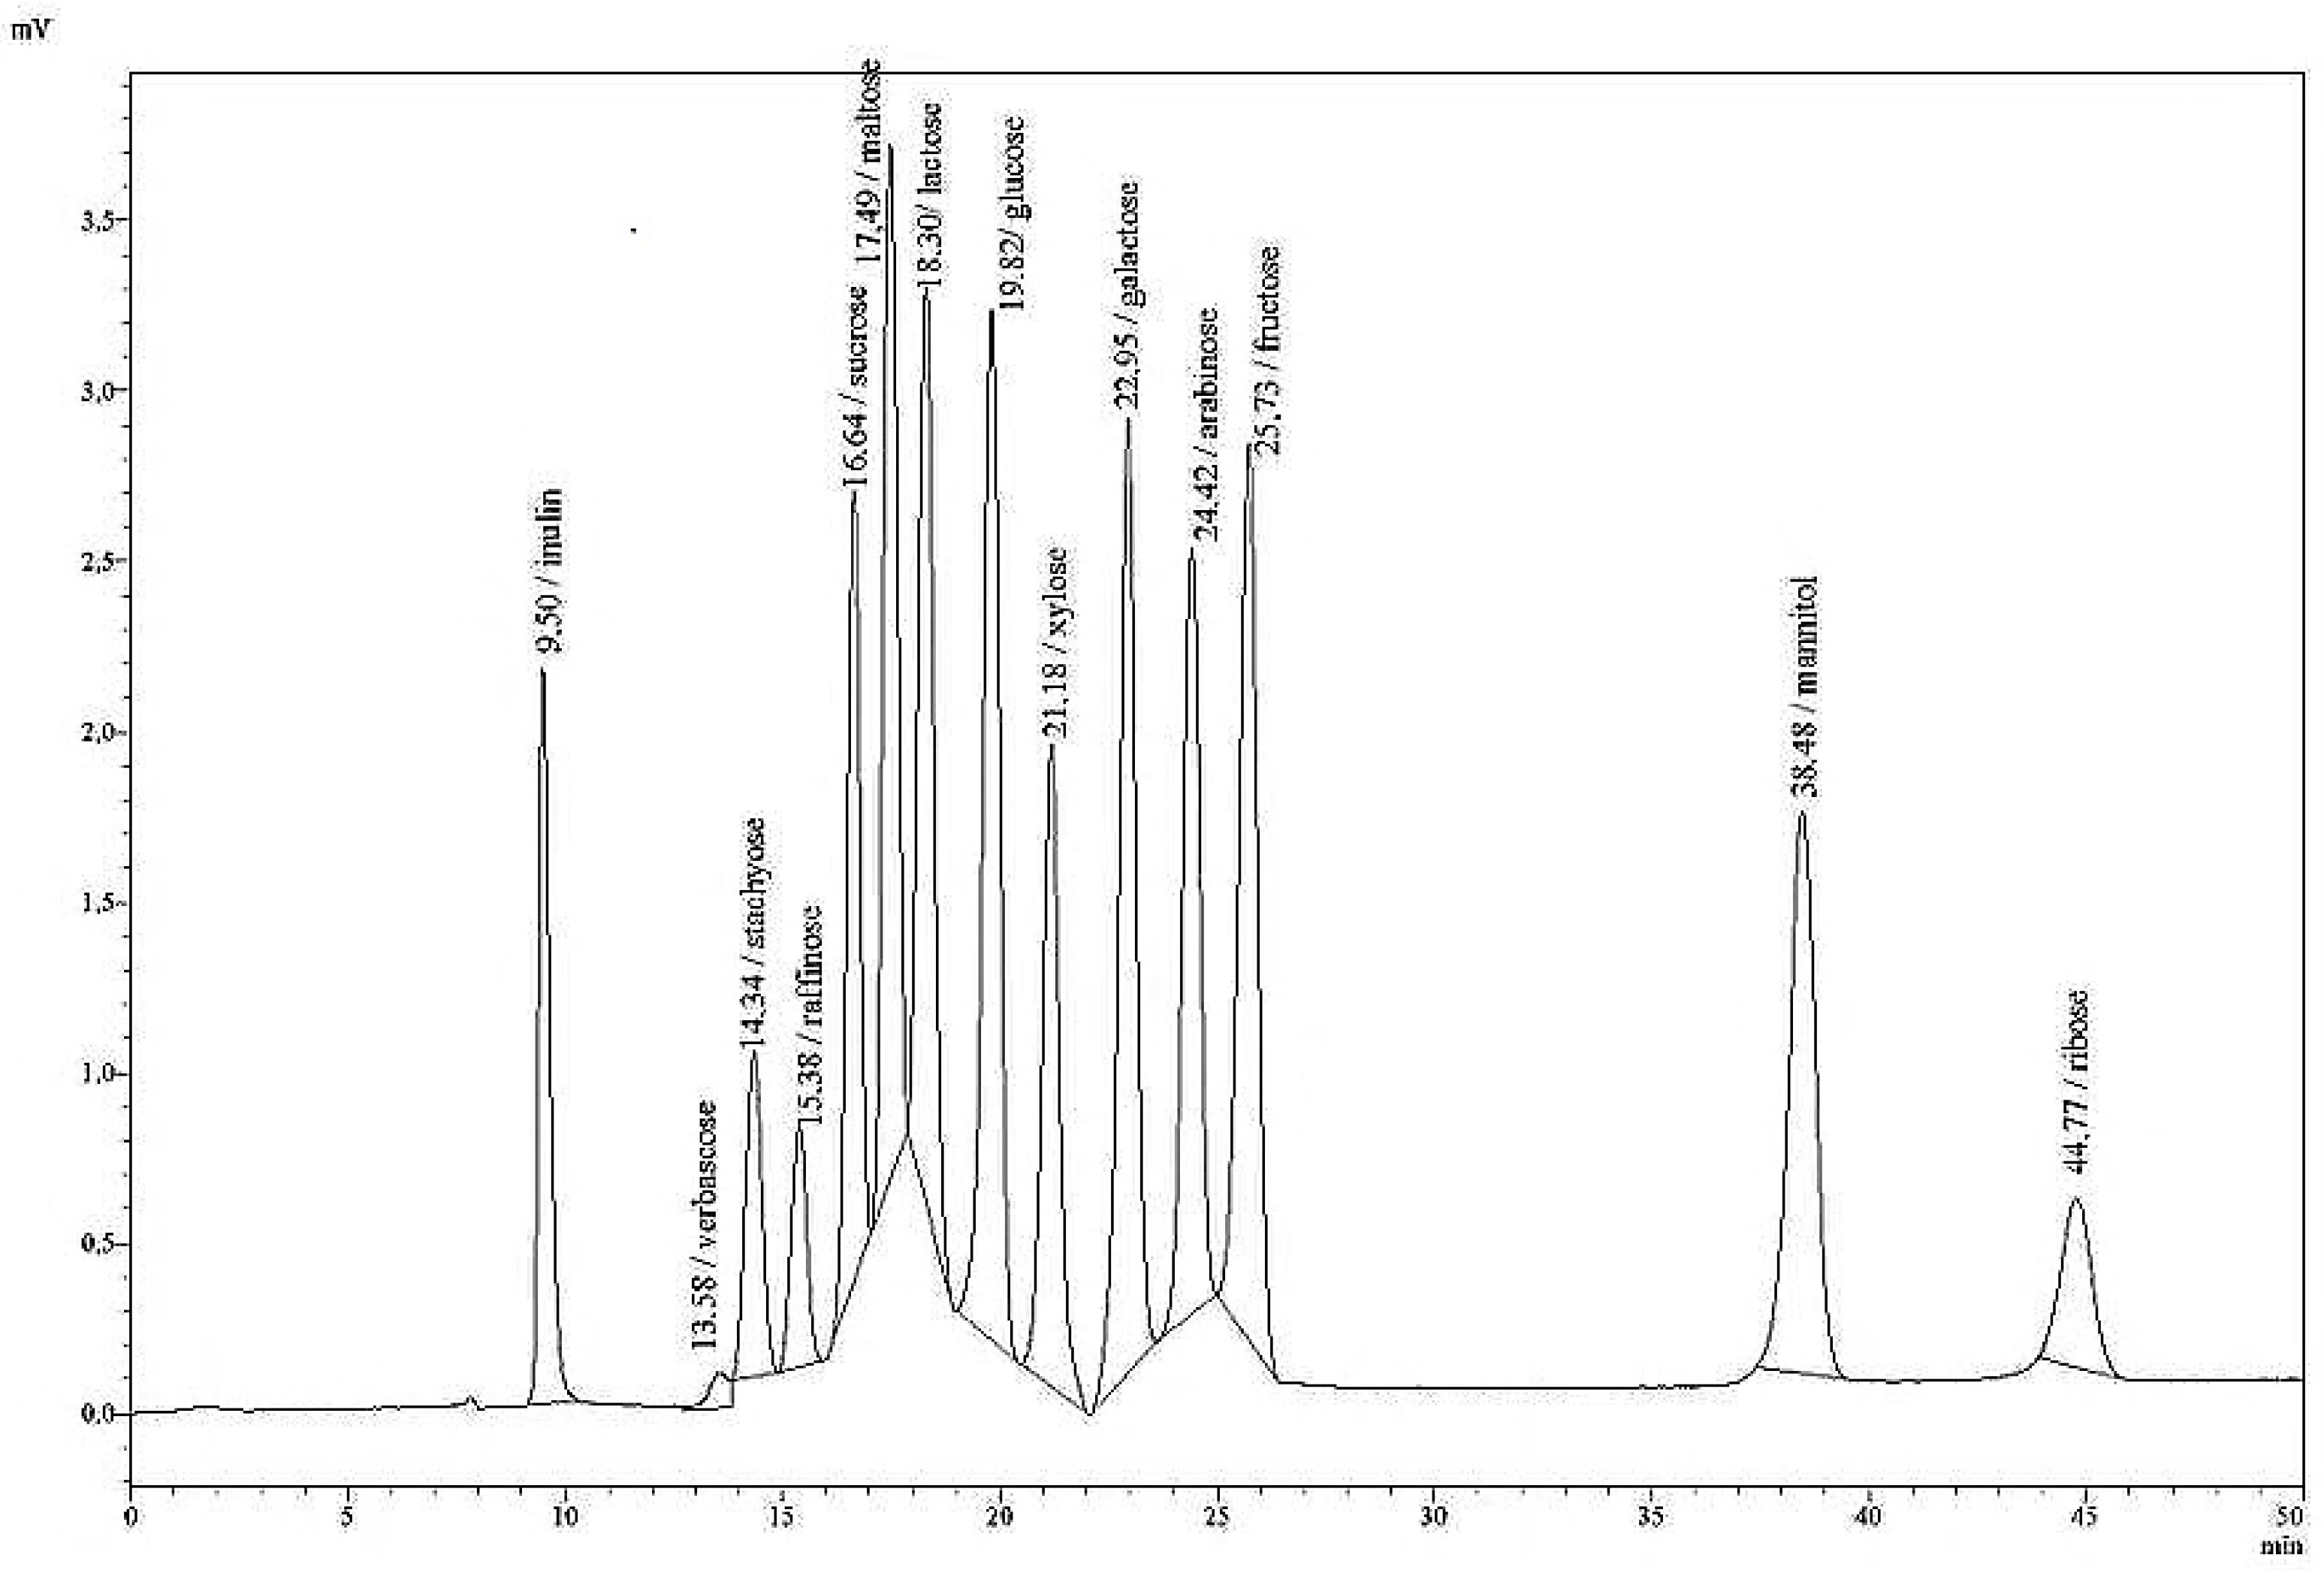
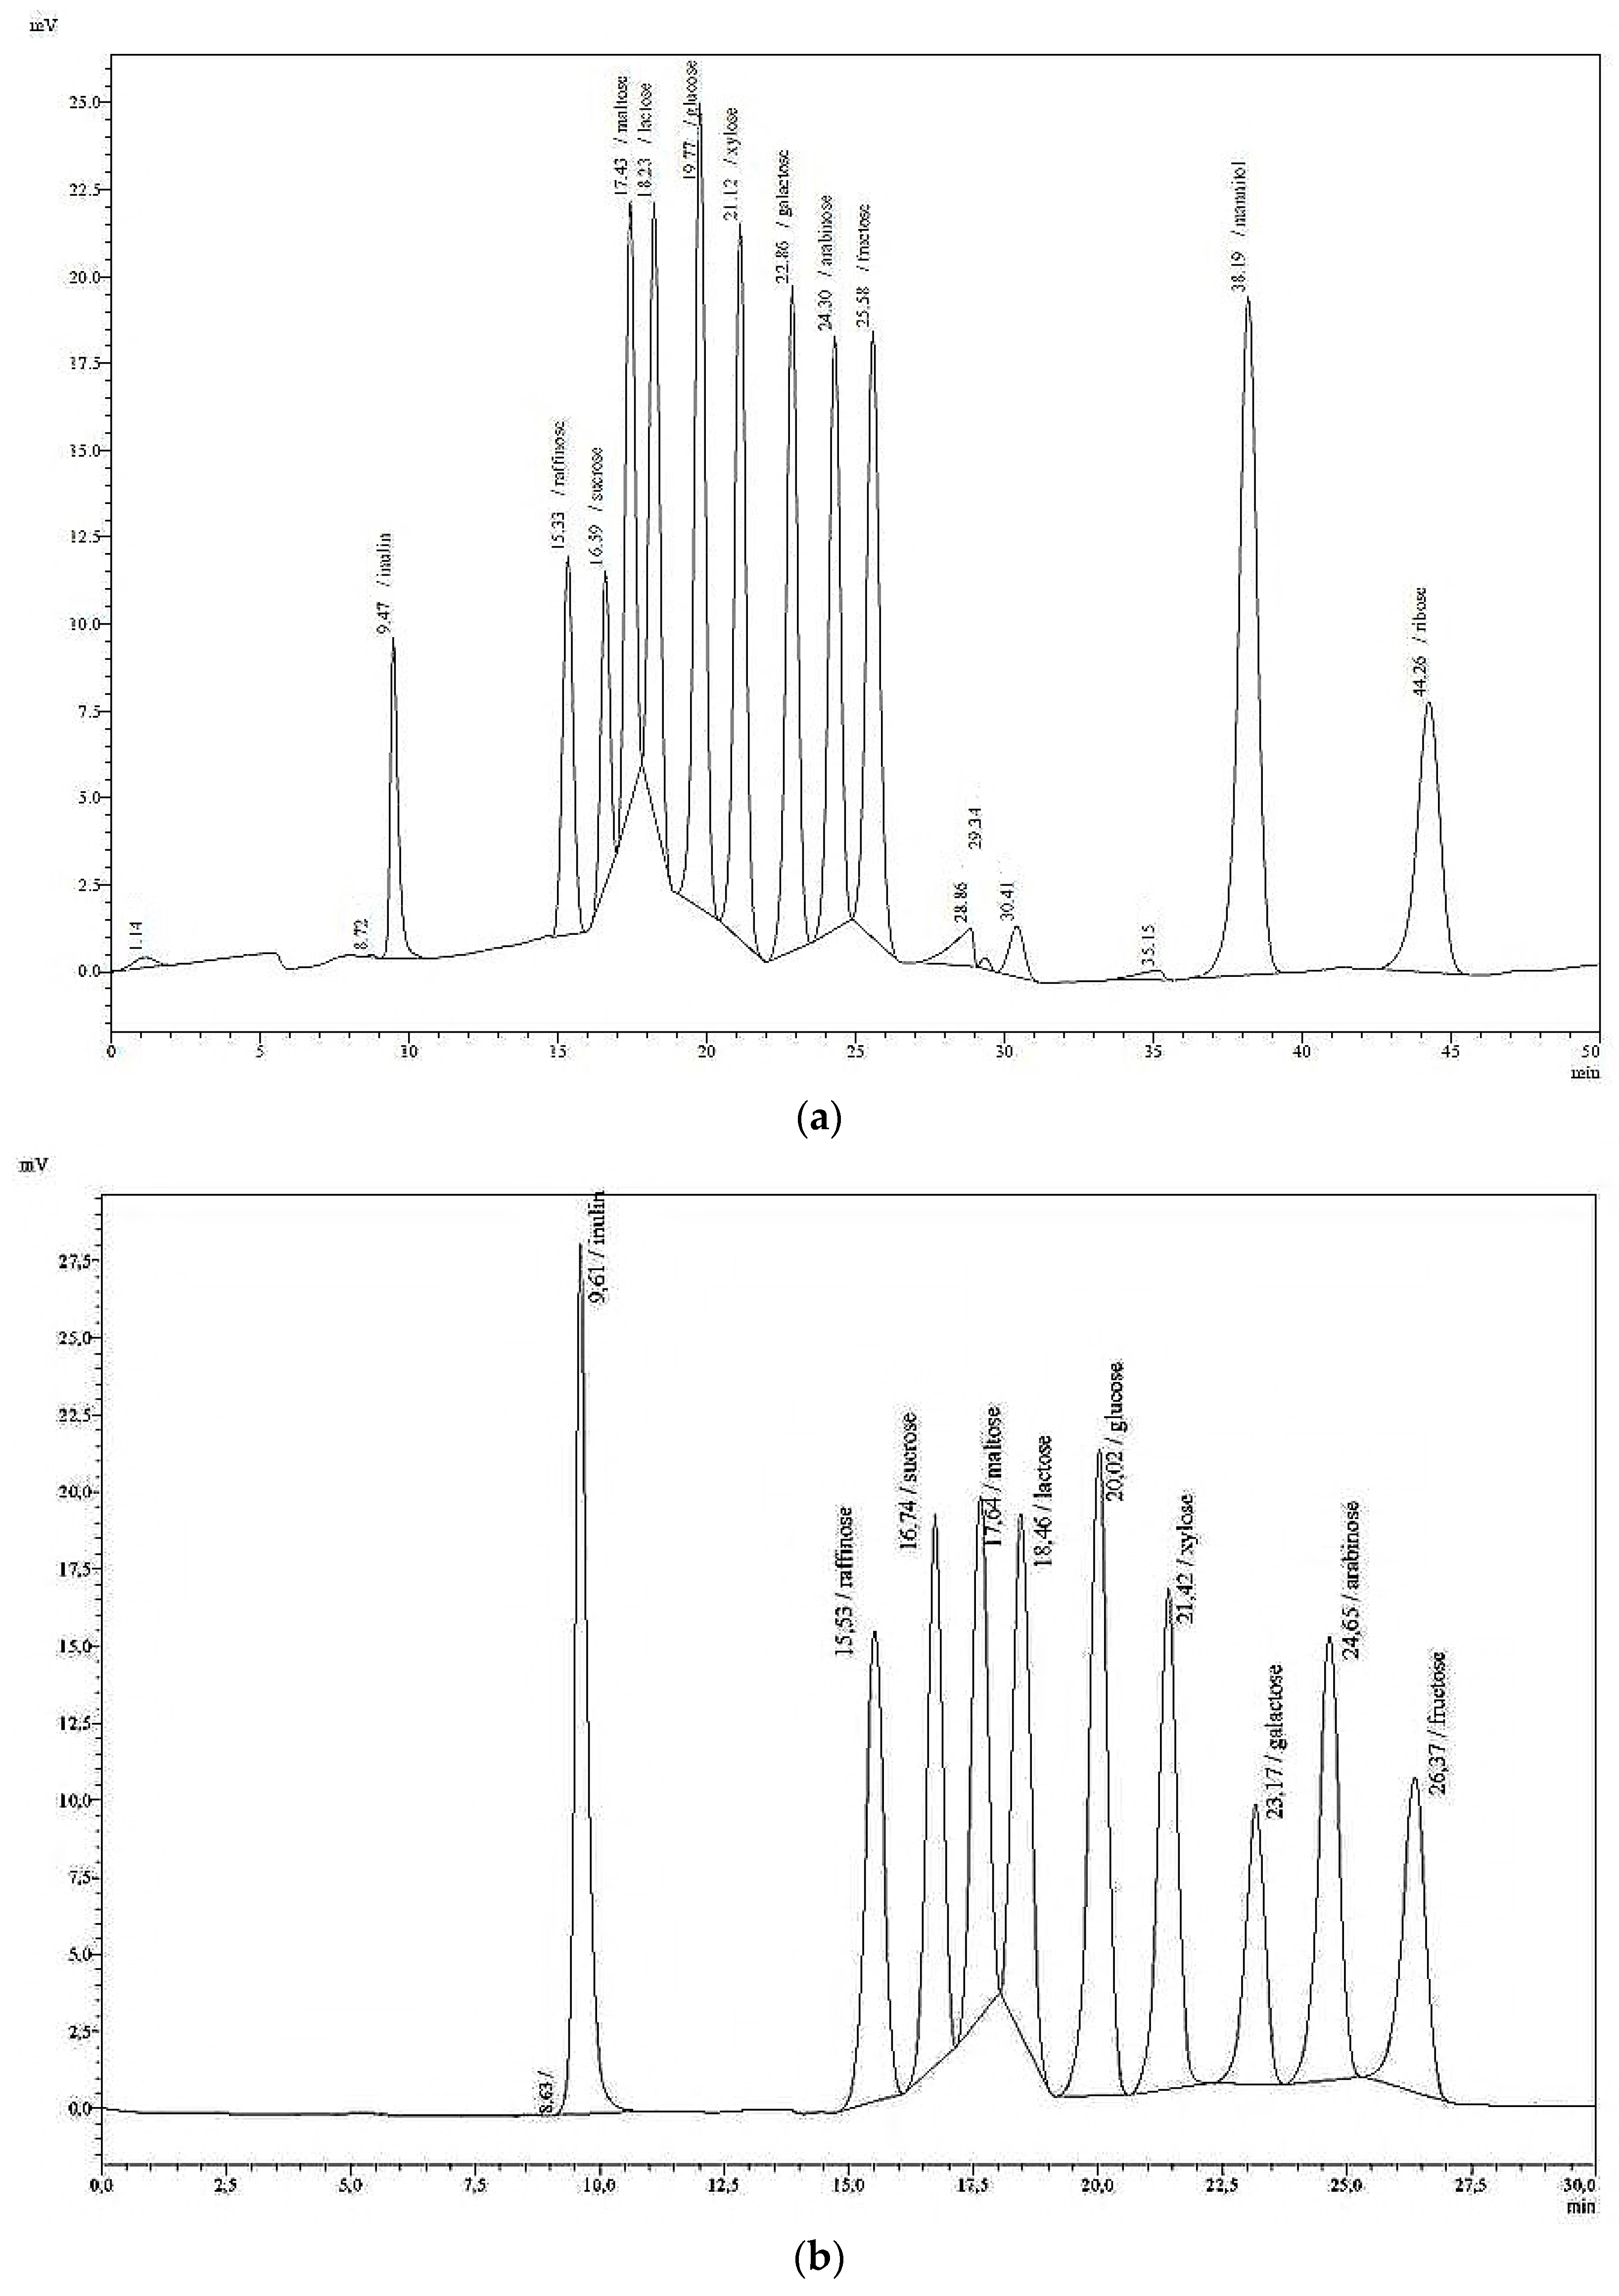
The standard solutions (low and high), as well as the single sugar solutions were analysed in the HPLC system with an RID under the following varying analytical conditions: column type, eluent water or 0.01 N sulphuric acid, oven/column temperature (35, 60, 80, 85 °C), injection volume (10, 20, 30, and 50 µL), and flow rate (0.4, 0.5, 0.6, 0.65 mL/min). Those conditions that yielded the best resolution in compound separation were selected for the new sugar HPLC method. After a range of modifications to the original HPLC protocol, the following final analytical conditions for the detection of aqueous solutions of individual sugars, and mixtures thereof were employed: isocratic eluation with HPLC-grade water; a flow rate of 0.4 mL/min; an oven temperature of 85 °C; an injection volume of 20 µL; column type Nucleosil CHO 682 (Pb) with pre- and main column (21 mm, ID 4.6 mm; 300 mm, ID 7.8 mm). Data given in
Table 3 summarise the retention times (
rt) of a variety of mono-, di-, oligo-, and polysaccharides in pure solutions. A single analytical run lasted 50 min. At longer intervals, if the separation deteriorated, the polymer of the column was cleaned with a 50% aqueous solution of acetonitrile at a column temperature of 65 °C, and an eluation of 0.1 mL/min overnight. The following day, the acetonitrile solution is replaced by water at 0.1 mL/min until high pressure has subsided.
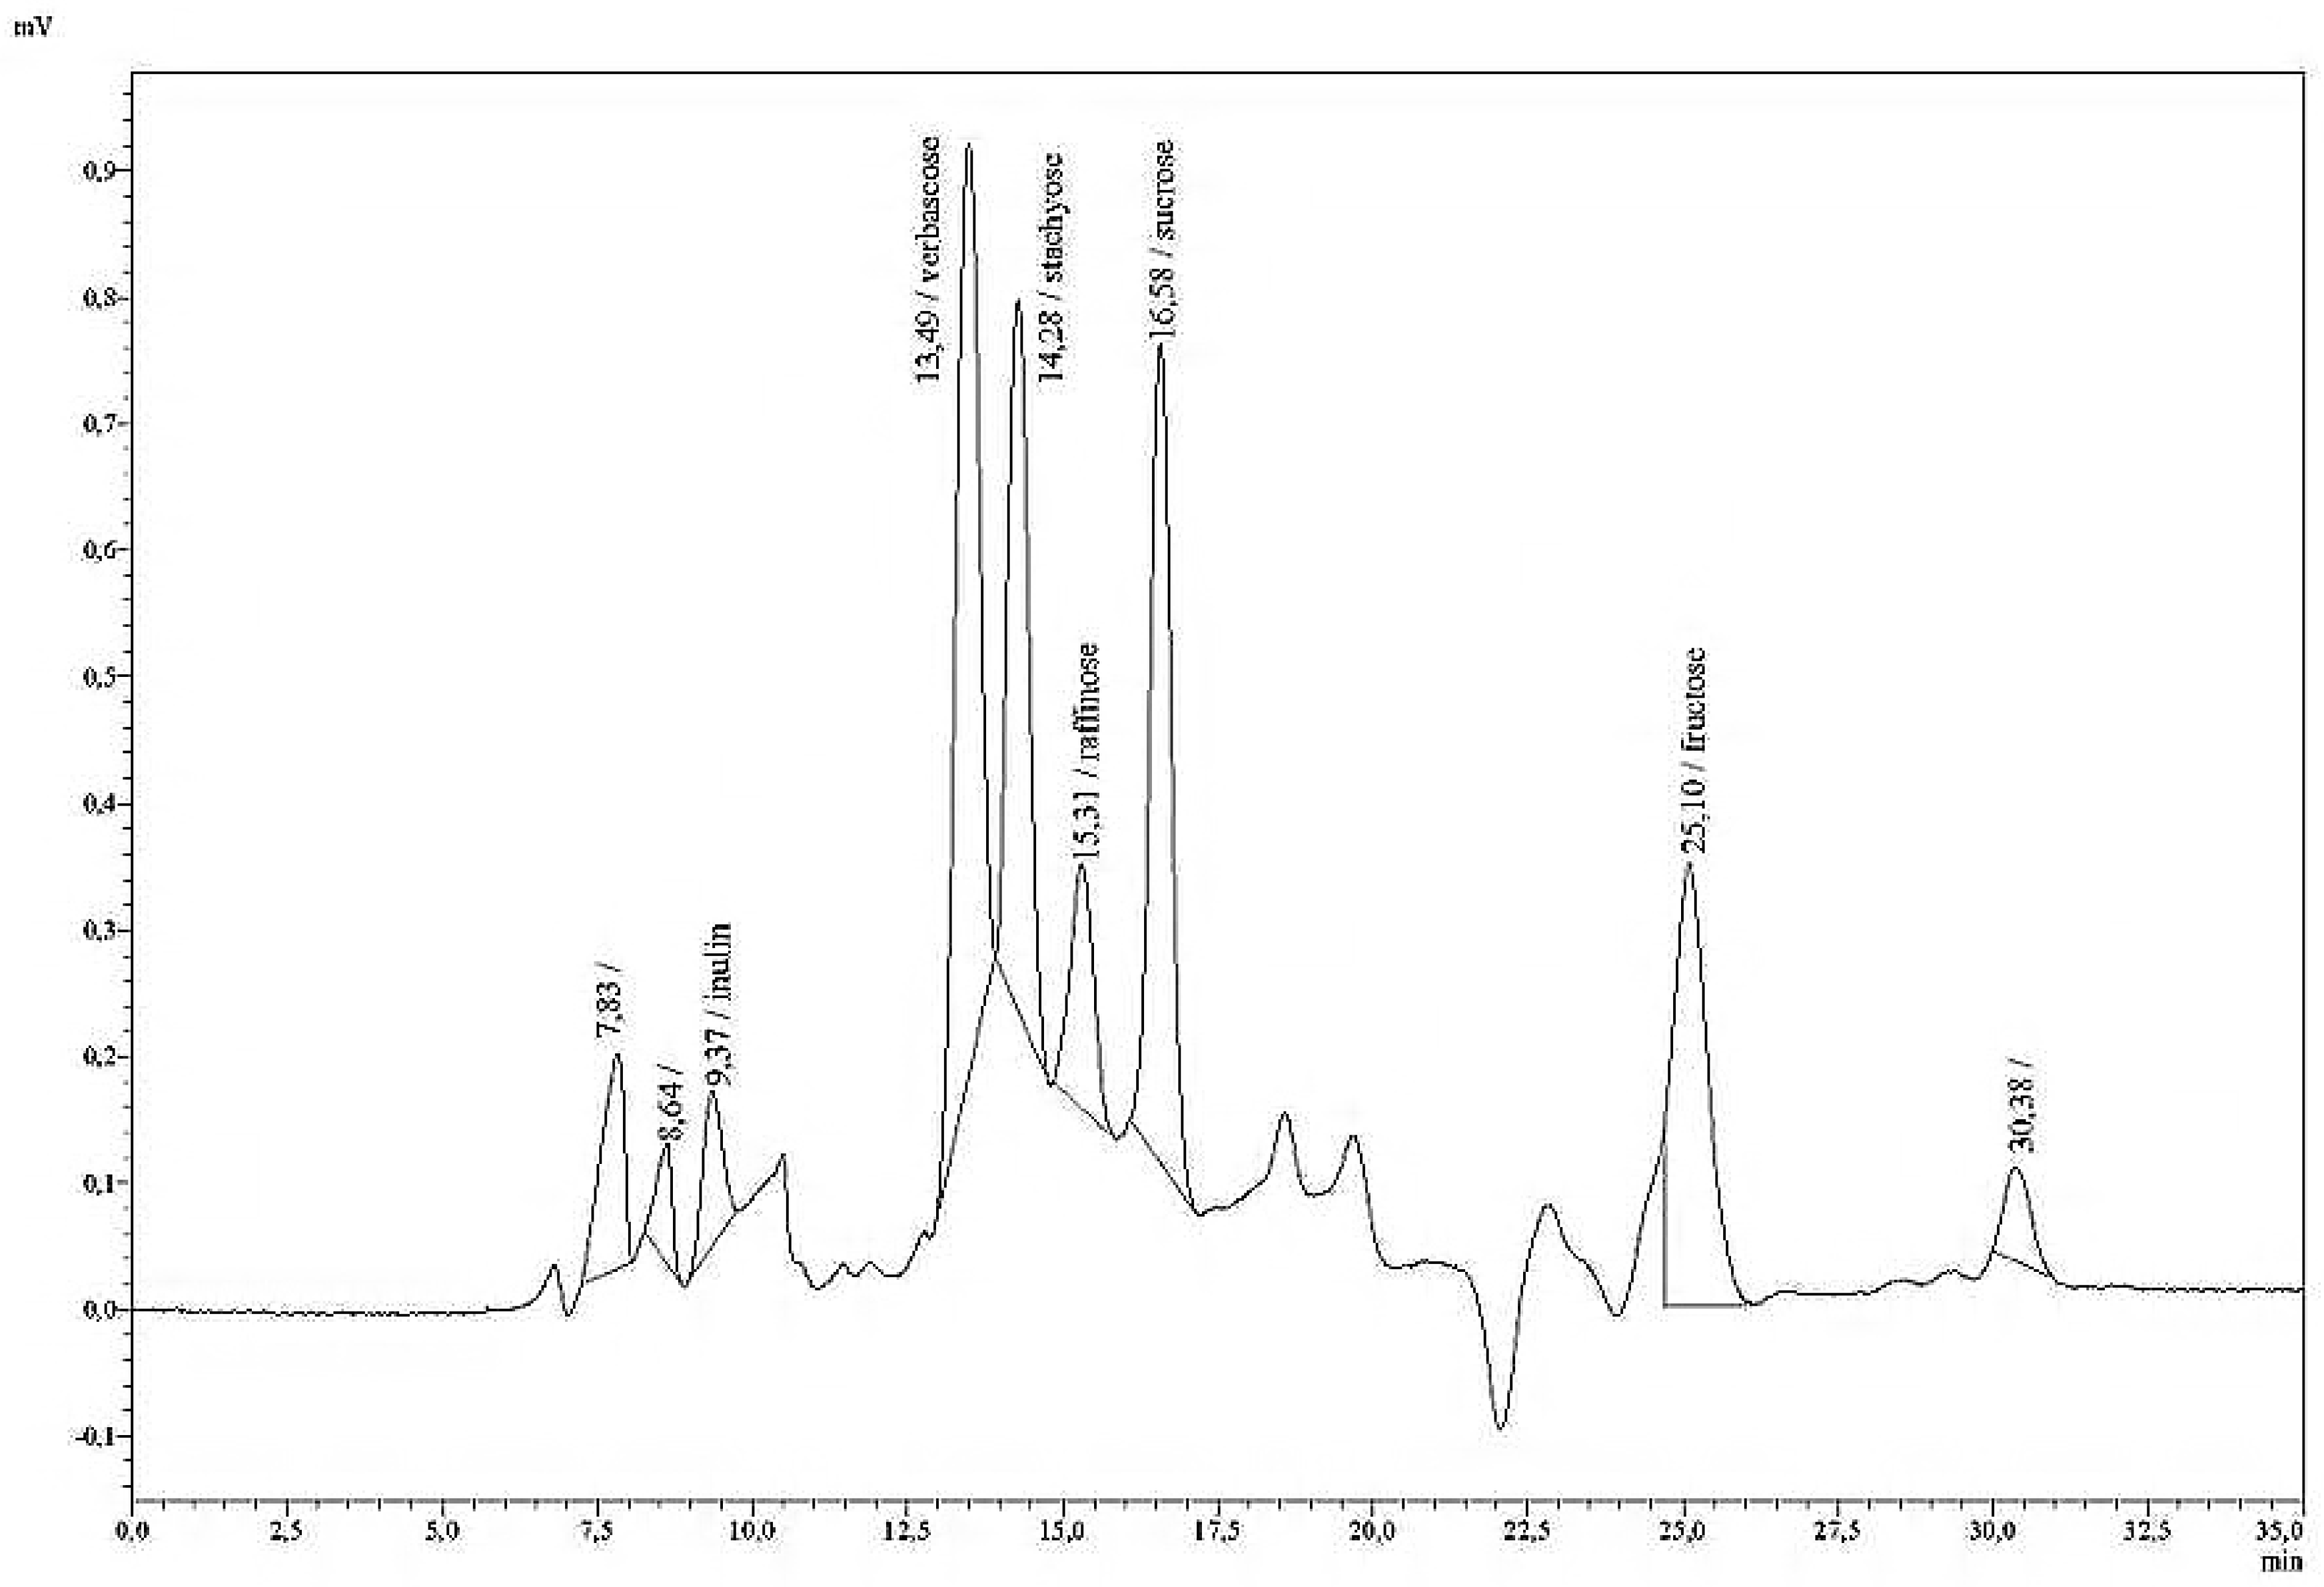
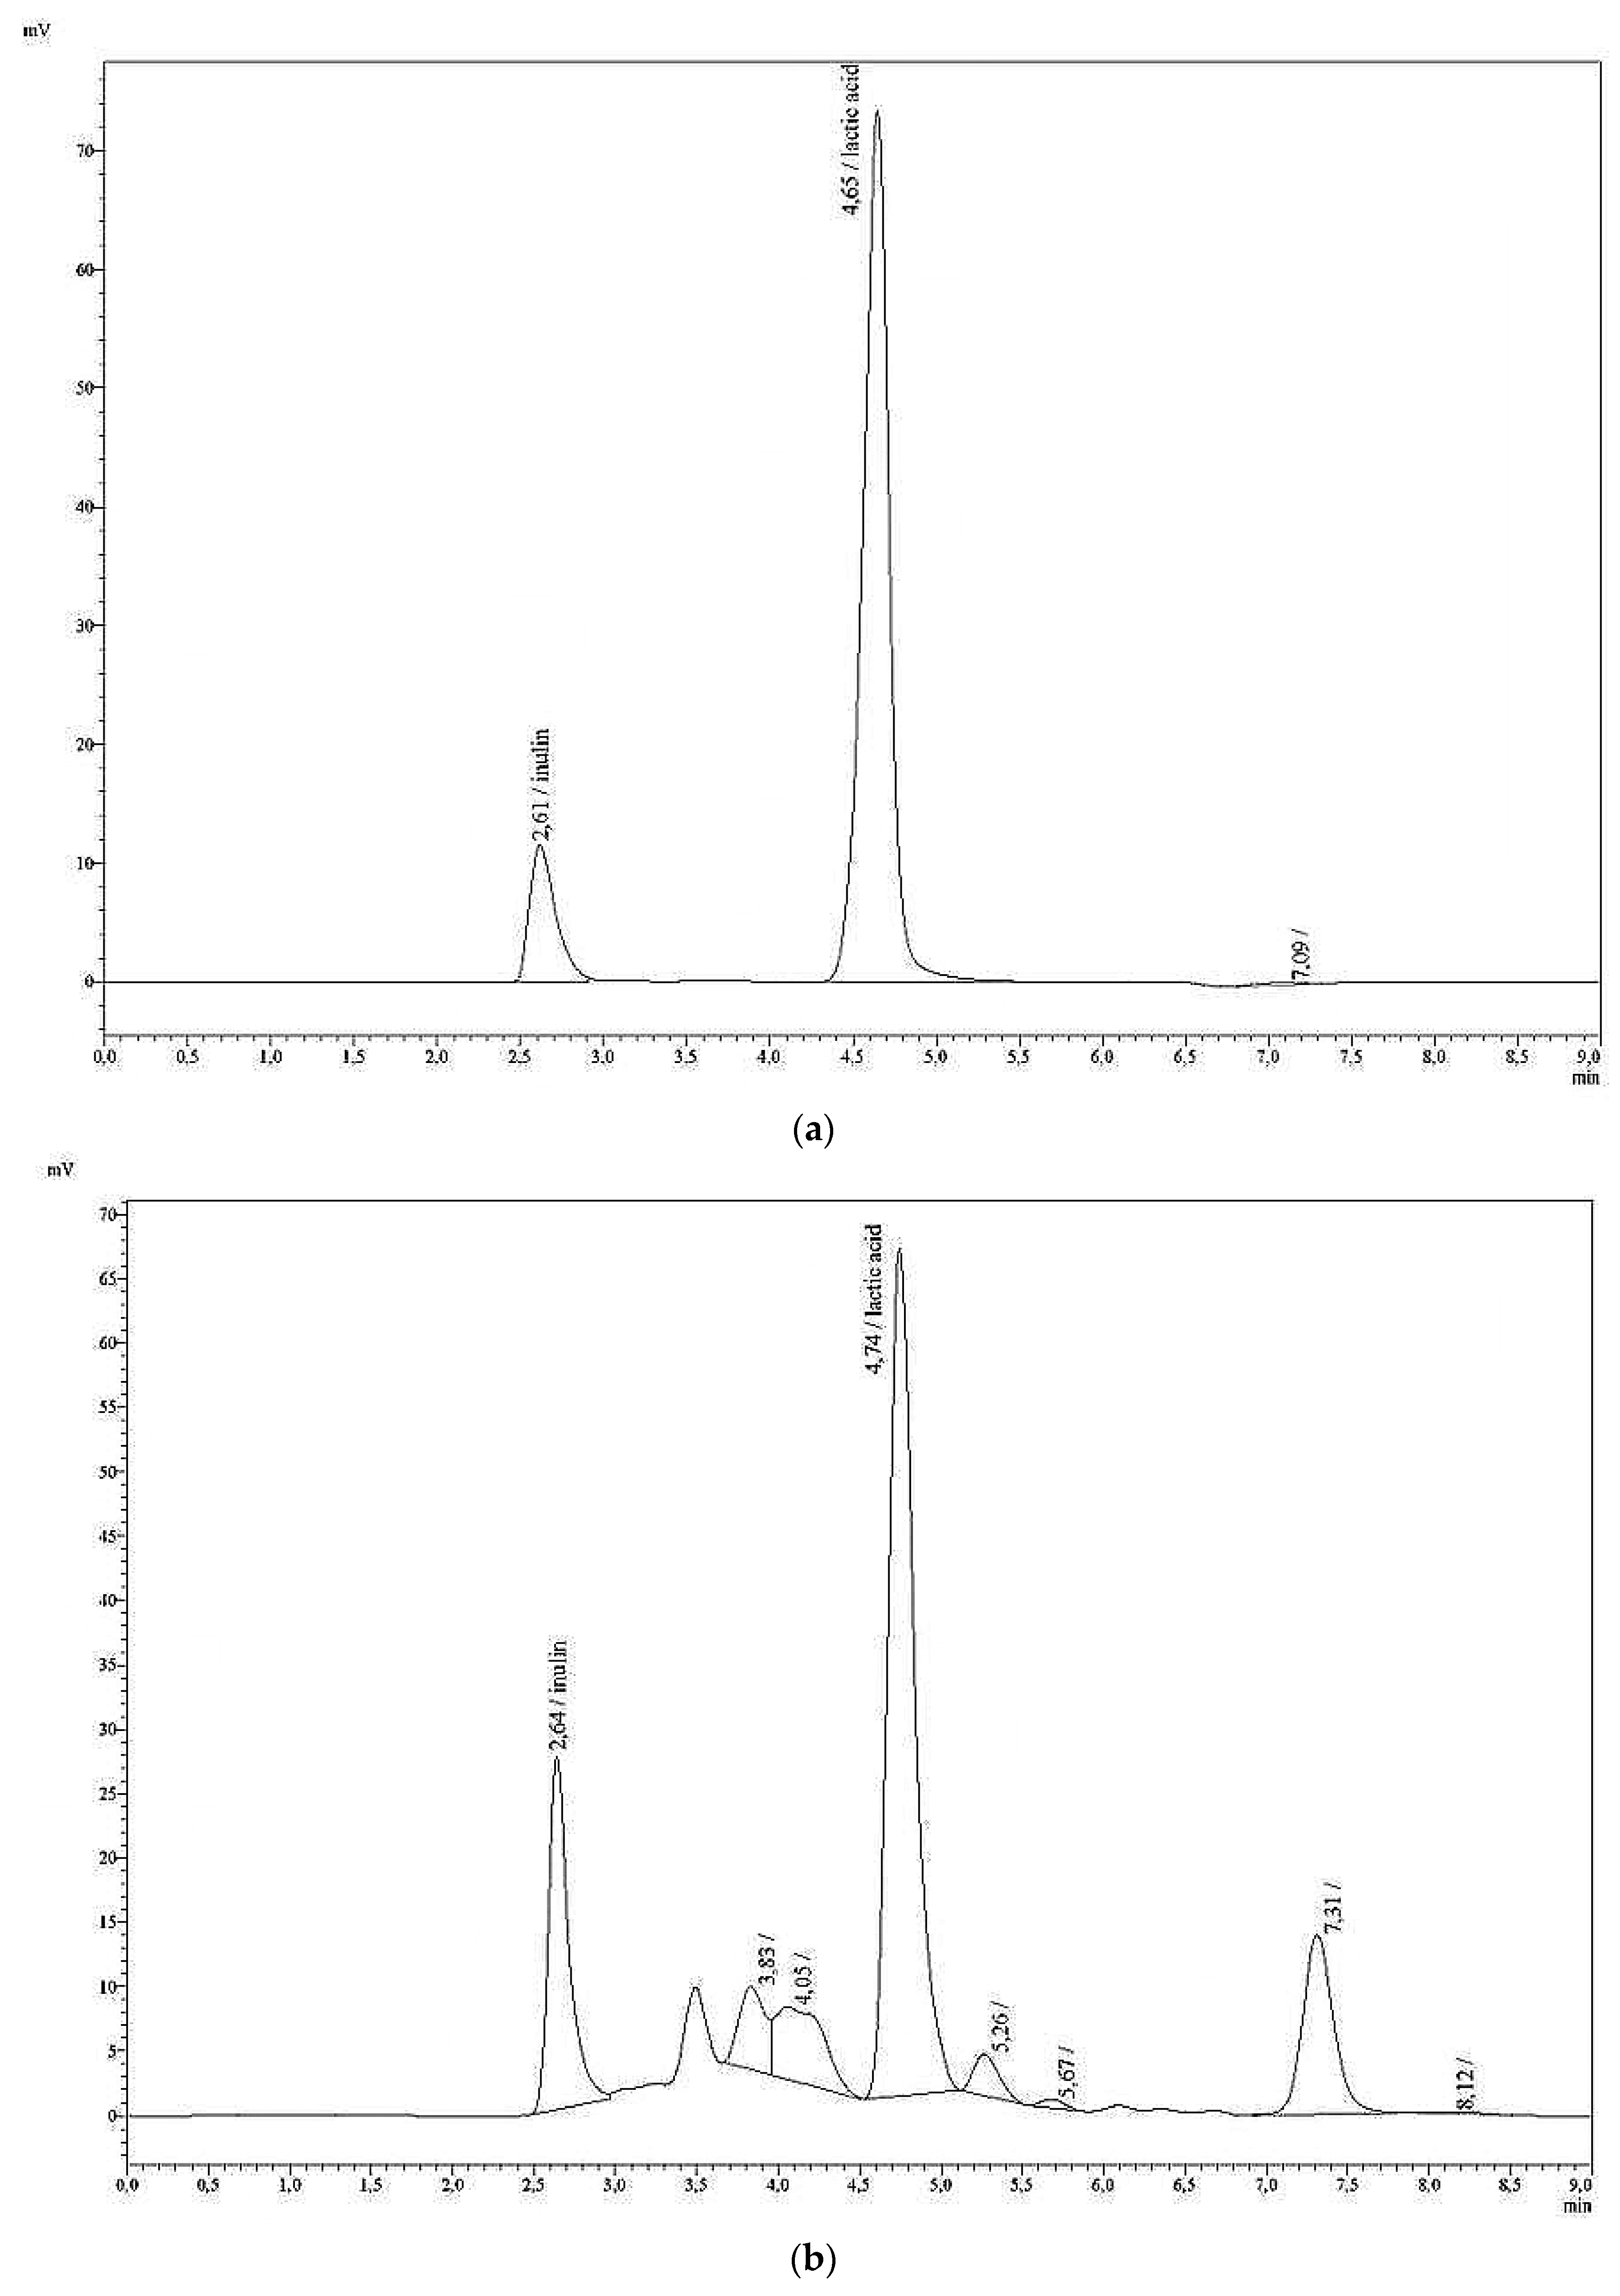
Fructans with inulin as standard were analysed as a second method, using the column Polypore H (Brownlee, pre-column: 30 mm × 4.6 mm, main column: 220 mm × 4.6 mm ID) and the following HPLC conditions: a column temperature of 80 °C; an eluent of 0.01 H2SO4; and a flow rate of 0.5 mL/min. The retention time was found to be rt = 2.62 min.
2.4. Precision and Recovery Rate of Chromatographic Analysis
The optimised HPLC method was verified, regarding its precision and recovery rate, to detect nine individual sugar monomers, as well as mannitol and fructan with inulin as the standard in model solutions. Standard deviations (absolute, SD; and relative, RSD) were calculated to estimate the precision.
The recovery (RC) was calculated: RC (%) = Mean of measured value × 100%/Set value.
At first the precision and RC of the method for nine single sugars and mannitol was tested by repeated analysis (10 times during the course of a day) of the same sample. Model solution I contained 60 mg of each sugar species per 100 mL (set value conc. 1), and model solution II contained 300 mg of each sugar species per 100 mL (set value conc. 2).
The next step was to estimate the RC and precision for nine single sugars, mannitol, and inulin after repeated analysis (n = 5) on five different days in six different model solutions. The solutions I–VI contained differing concentrations—15, 30, 60, 150, 240, and 300 mg/100 mL—of each sugar species, mannitol, and inulin.
To characterise the precision and RC of the sugar HPLC method in forage sample solutions, aqueous maize and grass silage extracts were used. These extracts were taken at random from silage quality projects. They served to represent the matrix of forage samples. The extracts were filtered at first over a folded paper filter (diameter 125 mm in a funnel), and second through a 0.45 µm minisart filter (Sartorius) into a 1.5 mL HPLC vial, and stored in a freezer at −18 °C until measurement.
Based on an aqueous maize silage extract that had been fortified (spiking) with six standard solutions at a 1:1 ratio, the measurements were repeated three times per day. The solutions I–VI contained differing concentrations—15, 30, 60, 150, 240, and 300 mg/100 mL—of each sugar species and mannitol. After measurement of the aqueous maize silage extract (n = 3), at a ratio of 1:1 with HPLC-water, the set values for each sugar in each model solution were calculated: [content in maize silage extract + set value]/2. The data concerning precision and recovery rate in spiked grass silage extracts were collected from the measurements of one grass silage sample extract with low and high standard solutions. The first part covered the low standard concentration of 5–30 mg/100 mL, and the second part covered the high standard concentration of 15–300 mg/100 mL calibration solution. The grass silage extract was combined with HPLC water at a ratio of 1:1, and was measured first. This extract was then spiked with six standard solutions of low, then high, standard, also in a ratio of 1:1, and the set values for each sugar and inulin were calculated: (content in grass silage extract + set value)/2.
For the estimation of the RC and SD of inulin analyses with the Brownlee-H column, two model solutions (9 mg/100 mL and 135 mg/100 mL) were measured 10 times in one day. An external six-point calibration was assumed: 15, 30, 60, 150, 240 and 300 mg/100 mL. Additionally, solutions I–VI were used for the estimation of RC and SD five times on different days.
2.5. Comparative Analysis of Sugars in Plant and Feed Materials
This study involved a total of 36 freeze-dried and milled (1 mm sieve) samples (six legumes, five legume-grass mixes, 22 grass mixes, one forage maize, and two whole-crop cereals), and 18 lyophilised and milled samples of sugar beet pulp silages. Of the dried and milled sample, 0.5 g was weighed in a weighing crucible and transferred into a sealable plastic bottle of minimum 120 mL volume, and 100 mL deionised water was added. Subsequently, the bottles were placed in a horizontal shaker, set at 30 revolutions/min for one hour.
After shaking, the contents of the bottle were filtered through a folded paper filter (diameter 125 mm in a funnel) into a 100 mL Erlenmeyer flask. The resulting clear extract was filtered through a 0.45 µm minisart filter (Sartorius) into a 1.5 mL HPLC vial, exactly 1.5 mL. A volume of 20 µL was injected per sample. The compound identification was based on the comparison of retention time with authentic standards. Quantification was performed by the external standard method, and using the high standard.
These plant samples were also analysed by ion chromatography by the University of Kiel, Germany, to compare the accuracy of different methods for glucose and fructose detection. To achieve this, the dried and milled samples were extracted with hot water (five minutes at 100 °C) and centrifuged.
For the analysis, a Carbo Pac PA100 column was used in a Dionex Ionenchromatograph System ICS 2500. The mobile phase consisted of HPLC-water and 200 mM NaOH (pH 10.0–13.5) and the samples were analysed in a gradient mode.
More comparative analyses of sugars have already been conducted and will be published.
4. Comparative Analyses
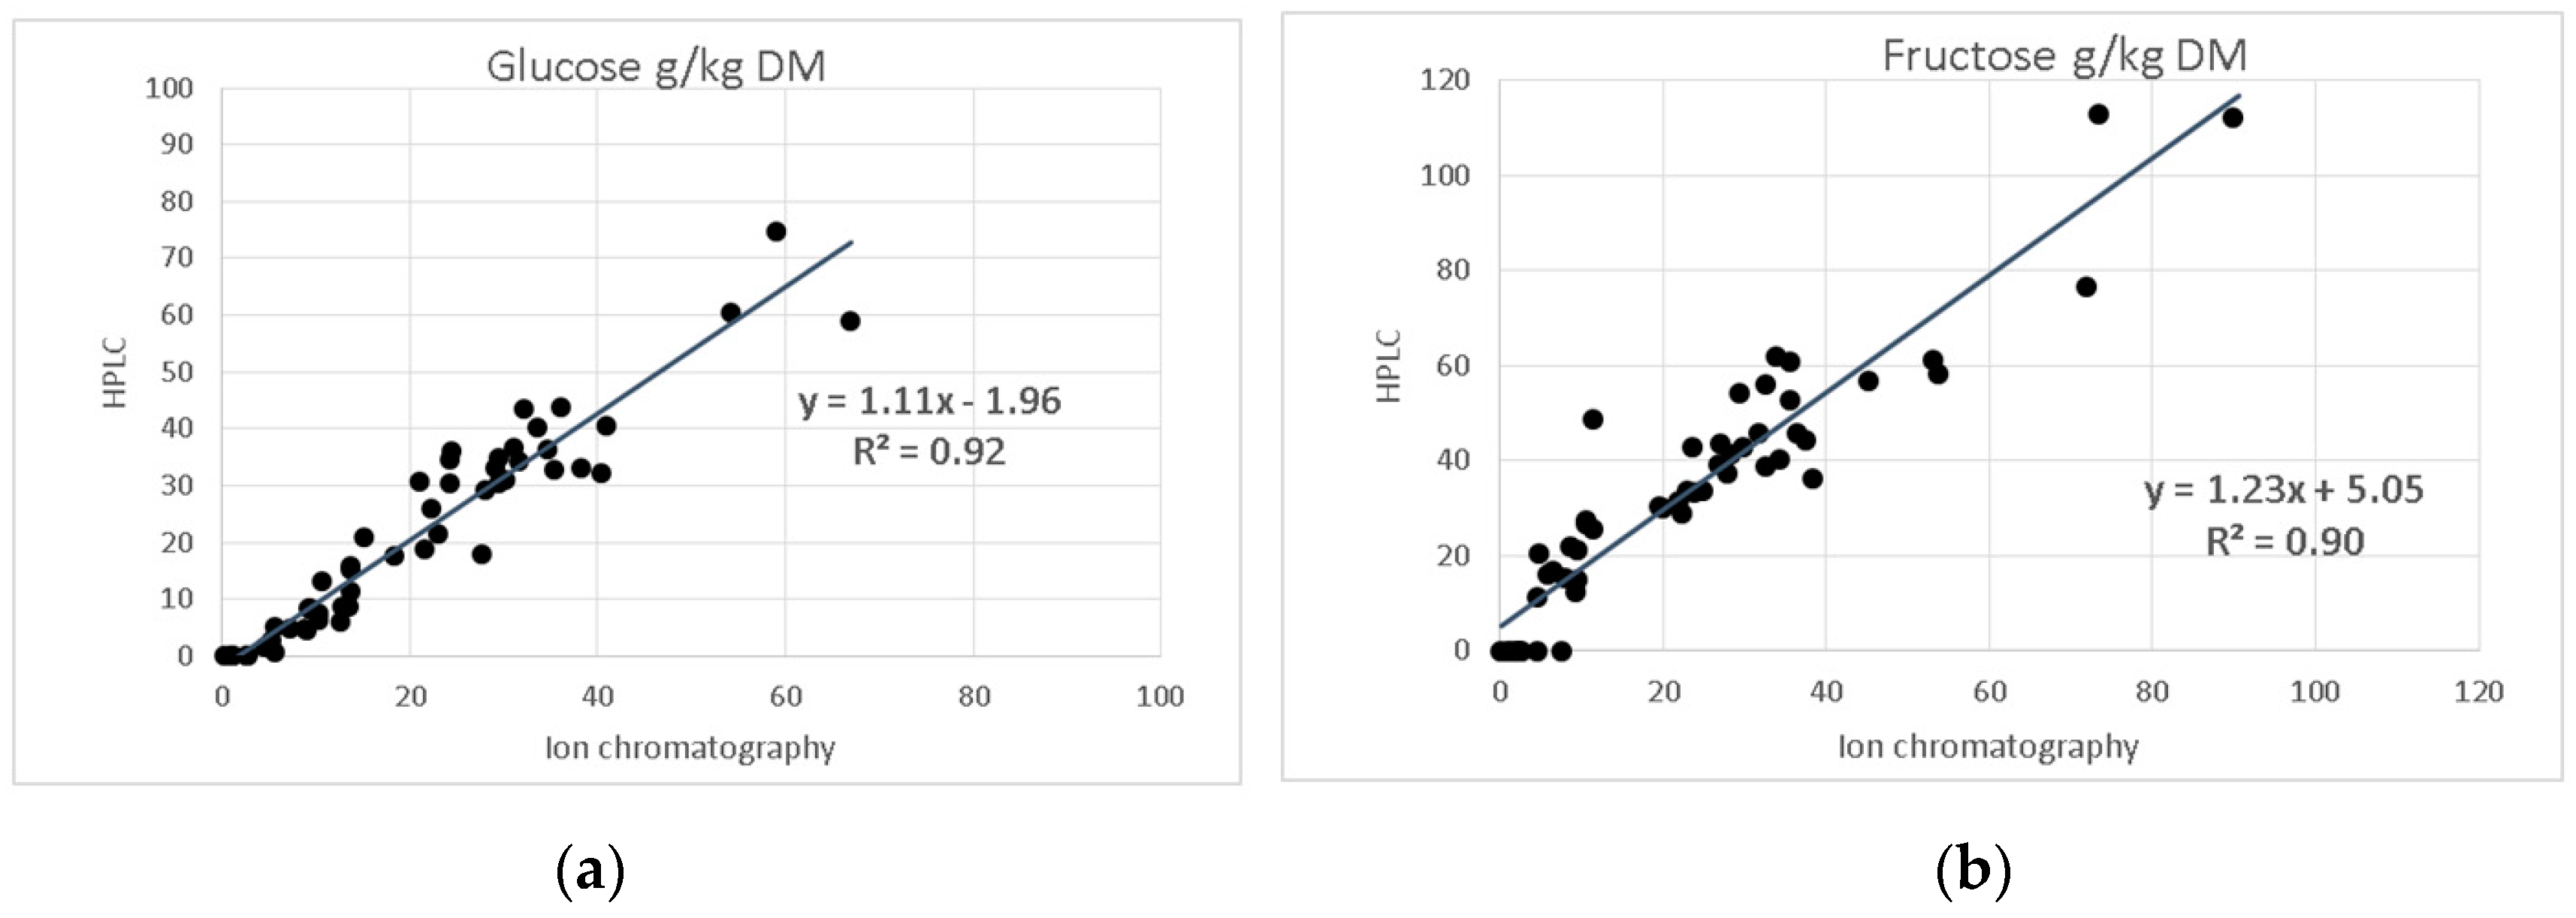
The freeze-dried samples from forages (n = 36) and sugar beet pulp silages (n = 18) were subjected to cold-water extraction and filtration, and subsequently analysed with the HPLC method described herein. The results from the sugar species glucose and fructose were compared with those obtained by the laboratory of the University of Kiel, which uses an ion-chromatographic method after hot-water extraction. By HPLC with RID, glucose was detected at up to 74.86 g/kg DM, whereas fructose was found at up to 123.90 g/kg DM. Moreover, very low levels of sucrose ranging between 1.22 and 9.35 g/kg DM were detected with the HPLC method in eight samples. In addition, three samples with concentrations between 16.85 and 21.73 g/kg DM were found using the HPLC method. These results were not confirmed by ion-chromatography. In sugar beet pulp silage samples sucrose was also not detectable using the HPLC method.
As shown in
Figure 5, a very close correlation exists between HPLC and ion-chromatography data for glucose (
R2 = 0.92) and fructose (
R2 = 0.90), regardless of the different conditions of extraction and detection. In addition, xylose was found in 20 samples at 2.99 to 30.15 g/kg DM and lactose in 11 samples at 28.11 to 38.88 g/kg DM using the HPLC method. For these and other individual sugar species, and fructan, comparative results are not available.
The comparison of the determined HPLC-RID values on glucose and fructose with those analysed by ion chromatography revealed a high degree of correlation, although the fructose contents detected were consistently higher with ion-chromatography.
To the authors’ knowledge, an official reference method for the detection of a variety of sugar species in plants and feed materials does not exist. Sugar analyses by other laboratories also only cover the most frequently occurring sugars—glucose, fructose, and sucrose—and are unpublished in-house methods.
Further studies comparing different methods, e.g., colorimetry, and separation conditions are underway, and are currently being prepared for publication.
5. Effect of Sample Preparation and Storage Temperature on Sugar Concentration Analyses
It is well-known that changes can occur in the composition of water-soluble carbohydrates (WSC) in plant materials between sampling and analysis. For conservation and sample storage, freeze-drying of the sample is superior to oven-drying because microbial activity in the early stages of the oven-drying process cannot be ruled out. According to Smith [
34], drying at temperatures below 50 °C allows time for DM losses by respiration and enzymatic conversions. Heat-drying at temperatures above 80 °C can cause thermo-chemical degradation. McGrath [
35] published a study concerning water-soluble carbohydrates in ryegrass, and found that heating at temperatures over 100 °C resulted in a loss of WSC, since values were lower than those obtained after freeze-drying. In general, lower sugar concentrations can be expected in oven-dried samples when compared with a lyophilised specimen. Furthermore, Smith [
34] concluded that changes occur in non-structural carbohydrate concentrations during the storage of both freeze- and heat-dried tissues, and that the analyses should be conducted as soon as possible after sampling. It should be stressed that, from extraction to analysis, the degradation of sugars by microorganisms must be prevented. Extraction should also be carried out as quickly as possible, and the samples measured immediately, if possible. Samples should be stored at 4 °C in the HPLC sampler until injection, as significant sugar losses may otherwise occur. In particular, it was found that the concentrations of glucose and fructose were markedly lower in the samples that had not been stored in the fridge after extraction. This is likely to have been caused by microbial sugar degradation. According to Smith [
34] this probably reflects the resistance of enzymes to the temperature effects before and during the drying process. Attempts to stabilise the extracts with solutions of either silver chloride or sodium azide (0.01%) failed due to interference regarding sugar separation, and resulted in extensive/laborious regeneration processes of the Pb
2+-column.
Comparative measurements of fructan with a Brownlee-H column in 36 aqueous silage extracts either immediately after extraction, or after storage in the freezer showed a very high degree of correlation (R2 = 0.92) with low RSD, varying between 0% and 2.18%. Preliminary evidence suggests that fructans can also be detected without loss in silage extracts which had been stored in the freezer. In most cases, the silage extracts are weakly acidic (pH under 5 or 4) and conserved with toluol, which is used as an inhibitor for microbial activity.


