Article

Impact of Glucose Concentration and NaCl Osmotic Stress on Yeast Cell Wall β-d-Glucan Formation during Anaerobic Fermentation Process

by
Vassileios Varelas
1,*,
Evangelia Sotiropoulou
1,
Xara Karambini
1,
Maria Liouni
1 and
Elias T. Nerantzis
2
1
Laboratory of Industrial Chemistry, Department of Chemistry, School of Science, National and Kapodistrian University of Athens, PO Box 157 71, Zografou, Athens 157 72, Greece
2
Laboratory of Biotechnology & Industrial Fermentations, Department of Oenology and Beverage Technology, School of Food Technology and Nutrition, Technological Educational Institute (TEI) of Athens, Egaleo 122 43, Greece
*
Author to whom correspondence should be addressed.
Fermentation 2017, 3(3), 44; https://doi.org/10.3390/fermentation3030044
Submission received: 13 July 2017 / Revised: 1 September 2017 / Accepted: 7 September 2017 / Published: 13 September 2017
(This article belongs to the Special Issue Yeast Biotechnology 2.0)

Abstract

:
Yeast β-glucan polysaccharide is a proven immunostimulant molecule for human and animal health. In recent years, interest in β-glucan industrial production has been increasing. The yeast cell wall is modified during the fermentation process for biomass production. The impact of environmental conditions on cell wall remodelling has not been extensively investigated. The aim of this research work was to study the impact of glucose and NaCl stress on β-glucan formation in the yeast cell wall during alcoholic fermentation and the assessment of the optimum fermentation phase at which the highest β-glucan yield is obtained. VIN 13 Saccharomyces cerevisiae (S. cerevisiae) strain was pre-cultured for 24 h with 0% and 6% NaCl and inoculated in a medium consisting of 200, 300, or 400 g/L glucose. During fermentation, 50 mL of fermented medium were taken periodically for the determination of Optical Density (OD), cell count, cell viability, cell dry weight, β-glucan concentration and β-glucan yield. Next, dry yeast cell biomass was treated with lytic enzyme and sonication. At the early stationary phase, the highest β-glucan concentration and yield was observed for non-NaCl pre-cultured cells grown in a medium containing 200 g/L glucose; these cells, when treated with enzyme and sonication, appeared to be the most resistant. Stationary is the optimum phase for cell harvesting for β-glucan isolation. NaCl and glucose stress impact negatively on β-glucan formation during alcoholic fermentation. The results of this work could comprise a model study for yeast β-glucan production on an industrial scale and offer new perspectives on yeast physiology for the development of antifungal drugs.

Graphical Abstract

1. Introduction

Saccharomyces cerevisiae is the model microorganism most commonly used in the study of yeast and higher eukaryotic cell physiology [1]. A major substrate for its growth is sugars, which are degraded through an aerobic or anaerobic fermentation process with the production of CO2 or alcohol and CO2, respectively [2]. Nowadays, the biotechnological research and industrial applications of S. cerevisiae have extended far beyond food and beverage production to medicine development, molecular biology and genetics, and environmental protection technologies [3].
In yeast, the plasma membrane is surrounded by the cell wall, a structure of 100–200 nm width that consists of consecutive layers. The main structural elements of the yeast cell wall are constructed of three groups of polysaccharides: (a) mannoproteins (or mannans): α-mannose polymers, which account for around 40% of the cell wall dry weight [4]; (b) α- and β-glucans: d-glucose homopolymers with α- or β-glycosidic bonds between C-1 and C-2, C-3, C-4, and C-6 of glucopyranose rings; they account for approximately 30–60% of the cell wall dry weight (β-d-glucans are the main cell wall glucans in which two different types are found: a major β-1,3-d-glucan (85%), which is the main β-glucan, representing more than 50–55% of cell wall, and a minor β-1,6-d-glucan (15%), representing 5–10% of cell wall dry weight [5,6,7,8]); and (c) chitin: β-1,4-d-Ν-acetyl-glucosamine homopolymers, equates to around 2% of the yeast cell wall dry weight [8,9]. The plasma membrane is an extension of the cell wall to the interior of the yeast cell. Its width is 7.5 nm and it consists of lipids and proteins that are found in much lower proportions compared to the cell wall components [10,11]. Yeast β-glucans (β-1,3-d-glucan and β-1,6-d-glucan) belong to biological response modifiers (BRMs) due to their ability to enhance and stimulate the human immune system presenting antitumor, anti-inflammatory, antimicrobial, wound healing, coronary heart disease prevention, hepatoprotective, weight loss, and antidiabetic properties [12,13,14].
Depending on the yeast growth and cultivation conditions, the cell wall dry weight may vary between 10% and 25% of the total cell dry weight [15]. The cell wall has four main functions: to (1) protect the cell from osmotic stress by maintaining its turgidity [10]; (2) protect the cell from mechanical stress; (3) maintain the cell’s shape; and (4) act as a hold for the cell’s surface proteins [15,16].
During yeast cell batch fermentation, the cell wall is modified. These changes are affected by the yeast strain and cell growth conditions [17,18,19,20]. The conditions of cell growth, such as pH, temperature, aeration, carbon sources, limitation of nitrogen, and the mode of cultivation, affect the cell wall polysaccharide composition, structure and morphology [21]. Also, the addition of supplements (SDS, ethylenediaminetetraacetic acid (EDTA), NaCl) in the yeast culture medium and the conditions during alcoholic fermentation for beer production impact variously on the cell wall β-glucan concentration at the end of the fermentation process [22] as it also modifies the polysaccharide structure of produced spent yeast biomass [23].
The remodelling of the yeast cell wall, as a response to various environmental stresses, is controlled by: (a) the cell wall integrity (CWI) and (b) high osmotic glycerol (HOG) through mitogen-activated protein kinase (MAPK) signalling pathways that modulate the cell wall gene expression and lead to the construction of a newly modified cell wall [24,25]. In addition to the HOG pathway, the cell growth, carbon storage and stress response are regulated by the RAS-cAMP PKA pathway [26], while during rapid hyperosmotic shocks the yeast cell sensitivity is regulated by the cell wall elasticity increase through the inactivation of the Crh family of cell wall cross-linking enzymes [25].
The impact of glucose concentration and NaCl osmotic stress on yeast performance during anaerobic fermentation has been well studied [27,28,29,30,31,32,33,34,35], but their impact on cell wall β-glucan production has not been studied until now.
The aim of this work was the investigation of yeast cell wall β-glucan production during the anaerobic fermentation process under the influence of hyperosmotic stress of fermented media glucose concentration and NaCl pre-cultured cells used for defined media inoculation. The motivations for this research study were: (a) the fact that there are few reports concerning yeast growth conditions and cell wall polysaccharide composition; (b) the lack of studies of the impact of different environmental stresses on yeast cell wall structure during the fermentation process and the yeast cell osmoadaptation responses against an osmotic shock; (c) the lack of knowledge of the entire physiological role of β-glucan in the yeast cell; (d) the fact that the monitoring of the yeast cell wall is a dynamic and unexplored research field that offers potential biotechnological applications and purposes; (e) the increasing interest in the industrial production of β-glucan from various yeast sources (medium cultures, brewery and winery waste yeast biomass) due to its proven immunostimulant properties and its incorporation in medicines, cosmetics and functional foods; and (f) the potential benefits from the study of the yeast cell wall in the creation of new antifungal drugs. Furthermore, the study of the yeast cell wall under various conditions can offer new perspectives on the biochemical pathways involved in the alcoholic fermentation process and the biology of the stressed yeast cell.

2. Materials and Methods

2.1. Yeast Cells and Culture Growth Conditions

Yeast cells S. cerevisiae VIN 13 strain (commercial dry yeast) used for laboratory experiments were provided by Anchor Yeast (Cape Town, South Africa). Yeast cells were grown in a medium containing (per litre of deionised water): 100 g d-glucose, 1 g K2HPO4, 1 g KH2PO4, 0.2 g ZnSO4, 0.2 g MgSO4, 2 g yeast extract and 2 g NH4SO4. All the media components were purchased from the Sigma Chemical Company (St. Louis, MO, USA).

2.2. Yeast Cell Preconditioning and Inoculum Preparation

One gram dry weight of yeast was resuspended in 100 mL of deionised water in an Erlenmeyer flask of 250 mL volume, at 30–35 °C, for 30 min with NaCl 6% w/v. The inoculum for experimental fermentations was prepared as follows: after 24 h of pre-culturing, 10 mL was collected and centrifuged at 5000 rpm for 15 min. Cells were resuspended in deionised water and re-centrifuged. This was repeated twice prior to the determination of total cell number and cell viability in the final washed inoculum; 2 × 10⁵ of living cells were used to inoculate 1000 mL of medium substrate [27].

2.3. Preparation of Yeast Fermentation Medium

The medium for laboratory batch fermentations consisted of the following: 200, 300, 400 g/L glucose, 1 g/L K2HPO4, 1 g/L KH2PO4, 0.2 g/L ZnSO4, 0.2 g/L MgSO4, 2 g/L yeast extract and 2 g/L NH4SO4 (Sigma-Aldrich Co., St. Louis, MO, USA). Mineral components and glucose were sterilised separately at 120 °C, and 2 atm pressure for 20 min. The pH was set to 4.0 with the use of 1 N HCl. Batch fermentations were carried out in 2000 mL volume flasks containing 1000 mL of growth medium with NaCl-preconditioned cells without shaking at 25 °C [36].

2.4. Cell Wall Treatment with Lytic Enzyme and Sonication

Yeast cells were treated with lytic enzyme Glucanex®200G (β-1,3-glucanase with some β-1,6-glucanase) (Novozymes, Kobenhavn, Denmark) for the cell wall lysis (pH 4.64/50 °C/5 h/10 times higher than the normal dose of 0.015 g/L, optical density of the resuspended cells with 10 mM citrate buffer adjusted to approximately 1.0 OD at 600 nm, 15% w/v cell concentration) [18,37,38] and sonication for the cell disruption at 35 kHz/70 W/6 min (u = 230 V/AC, I = 1.6 A, f = 50/60 Hz) in an ice bath with a Transsonic 570/H sonicator (Elma, Singen, Germany) [39].

2.5. Determination of Cell Concentration

Yeast cell number was determined by counting using a hemocytometer (Neubauer type) [36].

2.6. Cell Viability Determination

Cell viability was determined using a haemocytometer (Neubauer type) and according to the methylene blue method: 1 mL of sample medium was taken and diluted in 9 mL of deionised water. 1 mL of this solution was dissolved with 1 mL of 10% v/v methylene blue solution and left for 10 min. Aliquots of 1 μL were placed on the haemocytometer using a Pasteur pipette. The haemocytometer was then microscopically observed with an optical microscope (Olympus model CHK2-F-GS microscope). Yeast cell viability was calculated and expressed as follows:
Viability (%) = a/n × 100,
where
  • a: number of metabolically active cells
  • n: total cell number [27].

2.7. Monitoring of Fermentation Kinetics

OD at 600 nm was determined spectrometrically (phasmatophotometer mini 1240, SHIMADZU, Beijing, China) and was used for the monitoring of fermentation kinetics and the discrimination of exponential, lag and death phase of cells growth during the fermentation process [18].

2.8. Determination of Cell Dry Weight

The sediment of yeast cells was frozen (−80 °C/24 h), lyophilised (−50 °C /vacuum/24 h) using a Thermo Fischer (Waltham, MA, USA) drying digital unit. The weight of each yeast cells freeze dried sample was measured gravimetrically with an analytical balance (Kern, Kern and Sohn GmbH, Balingen, Germany) with an accuracy of four decimal places.

2.9. Determination of β-Glucan Concentration (%)

The determinations of total yeast β-glucan concentration in lyophilised yeast biomass were performed with the use of Enzymatic K-EBHLG Yeast β-Glucan Assay Kit (Megazyme, Bray, Ireland).

2.10. Determination of β-Glucan Yield (%)

The yield of β-glucan was calculated as the product of yeast cells’ dry weight with β-glucan purity [40].

2.11. Statistical Analysis

Each experiment was carried out in triplicate and the reproducibility was within the range of ±5%. Results are displayed as means of three determinations in all methods with standard deviation. Experiments were set up in a completely randomised design while for the determination of significant differences between the different treatments and the tested parameters, all results were analysed using two-way analysis of variance (ANOVA) run on XLSTAT software (Addinsoft Co., New York, NY, USA), with significant differences indicated at p ≤ 0.05.

3. Results

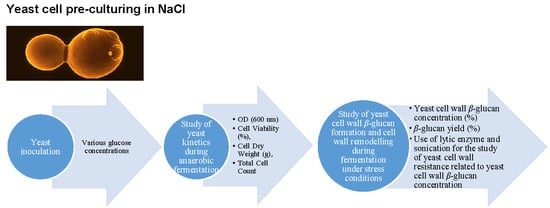
3.1. Experimental Design
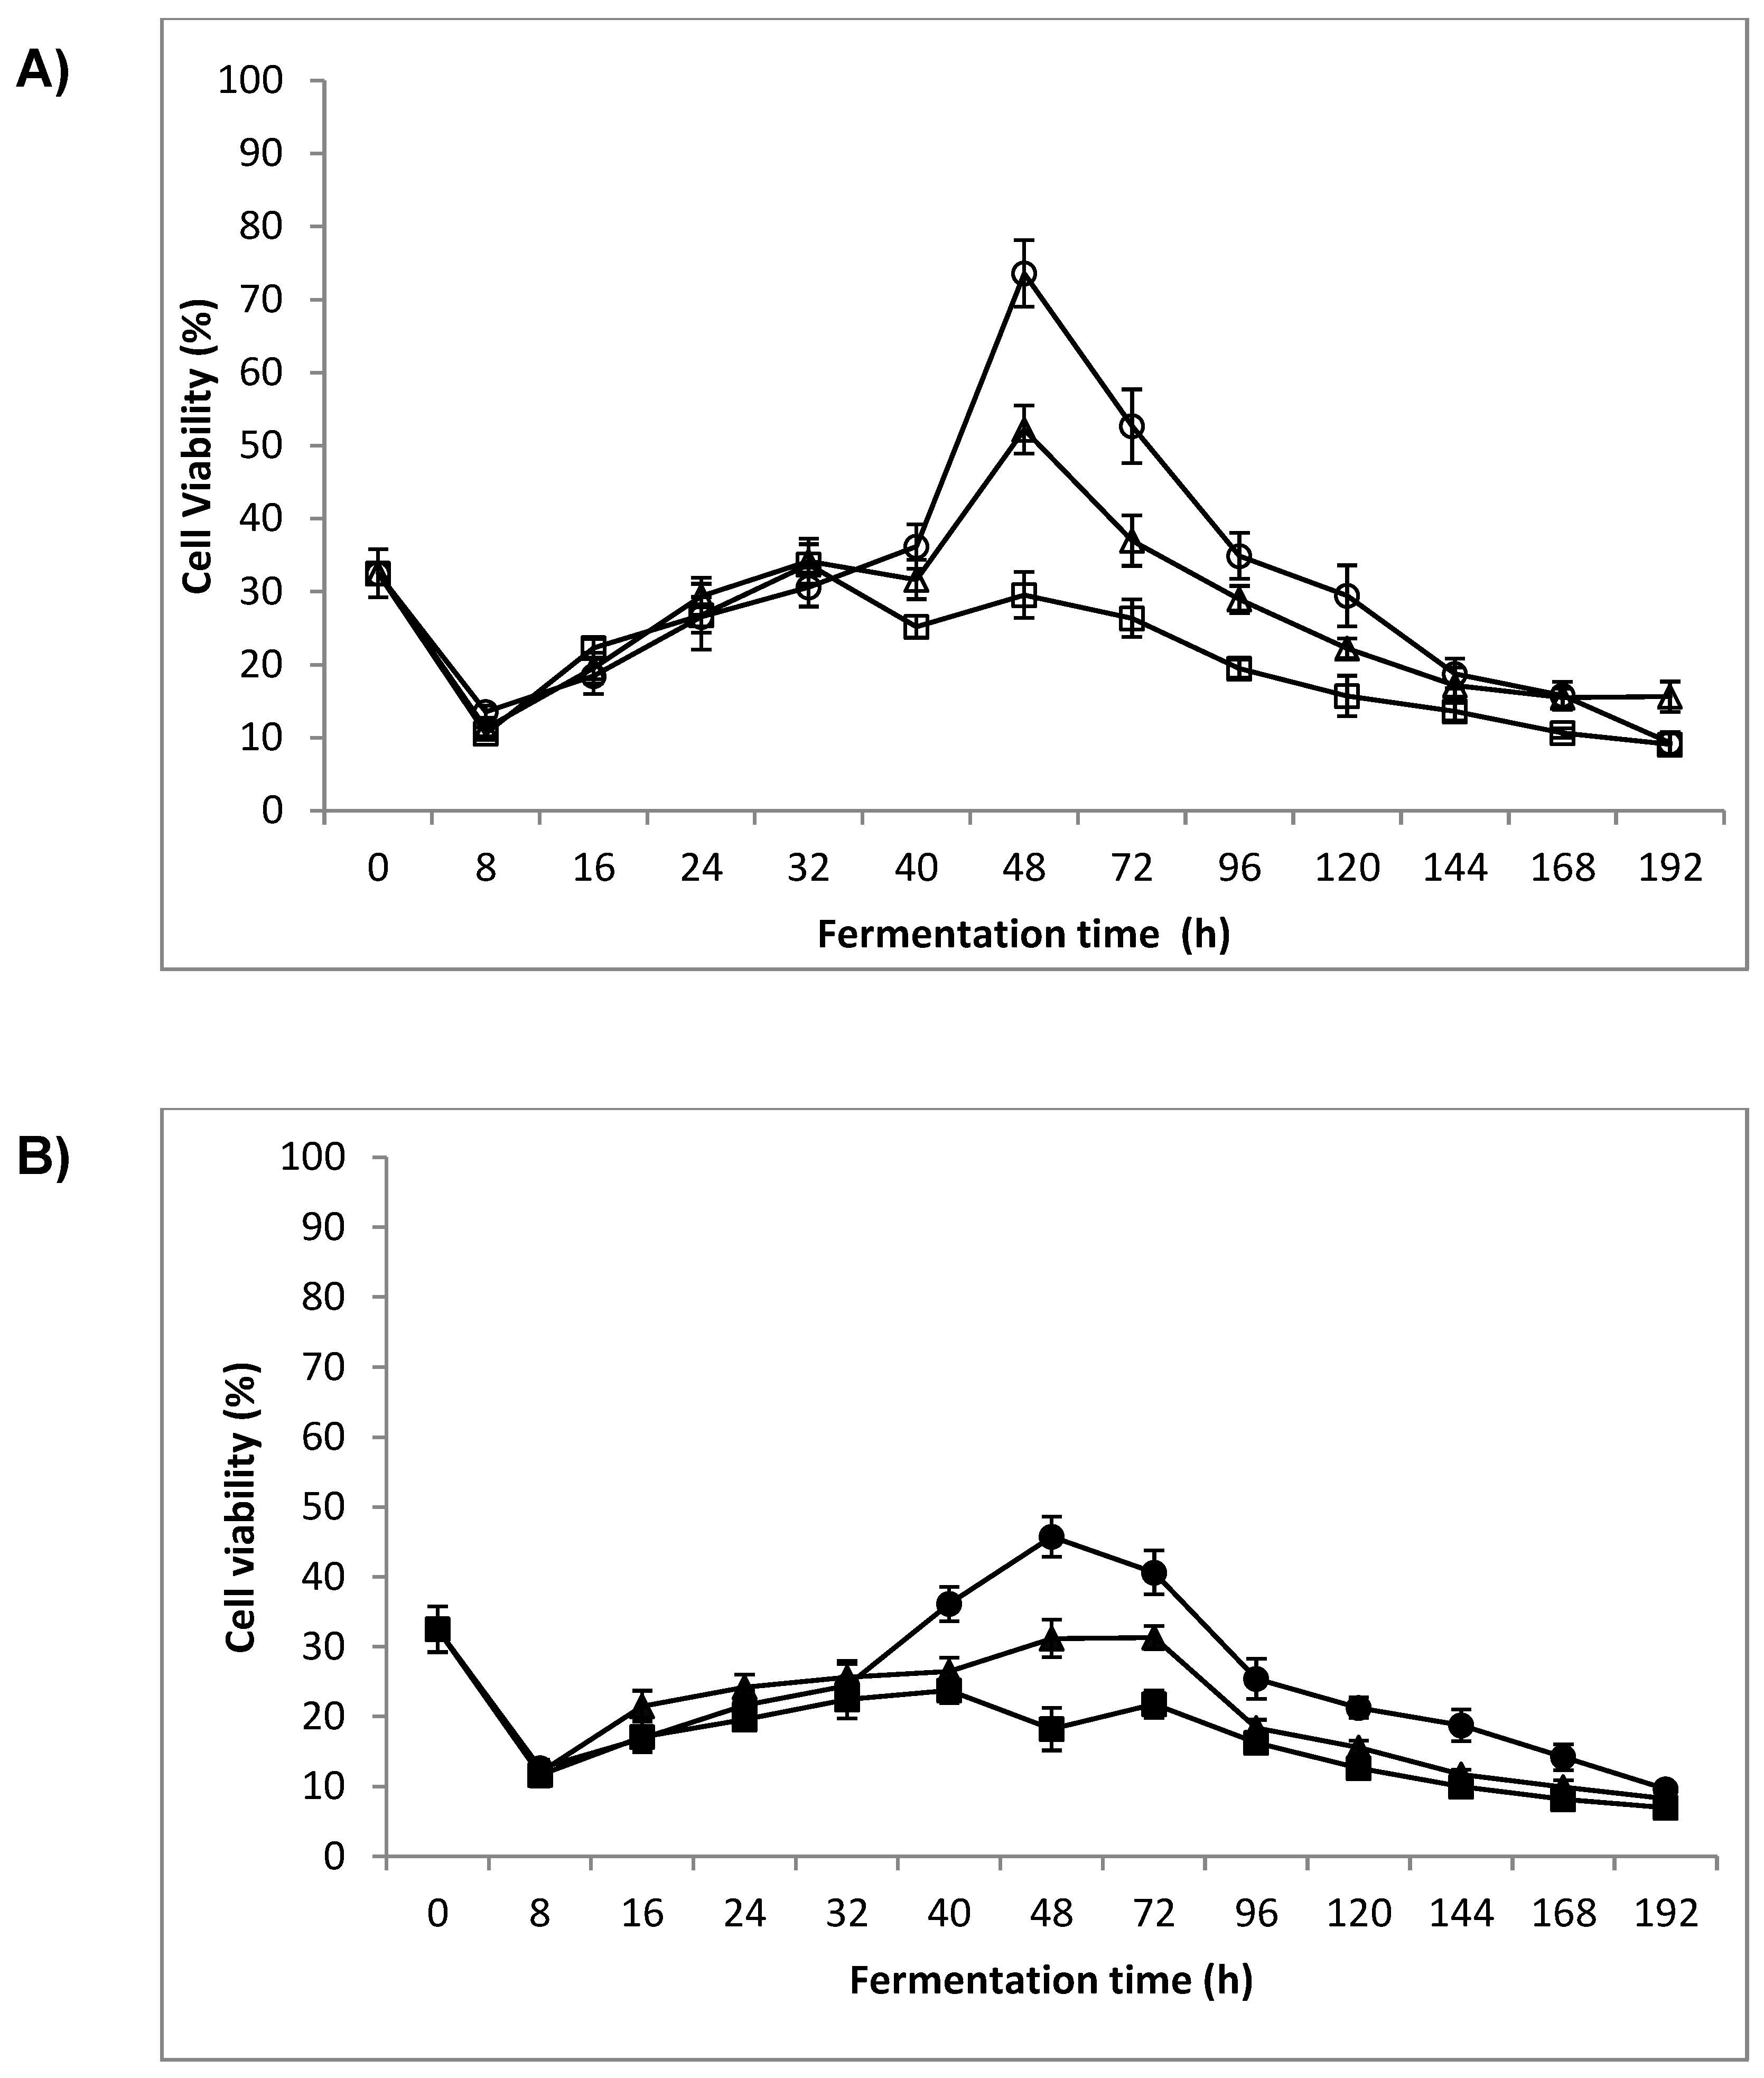
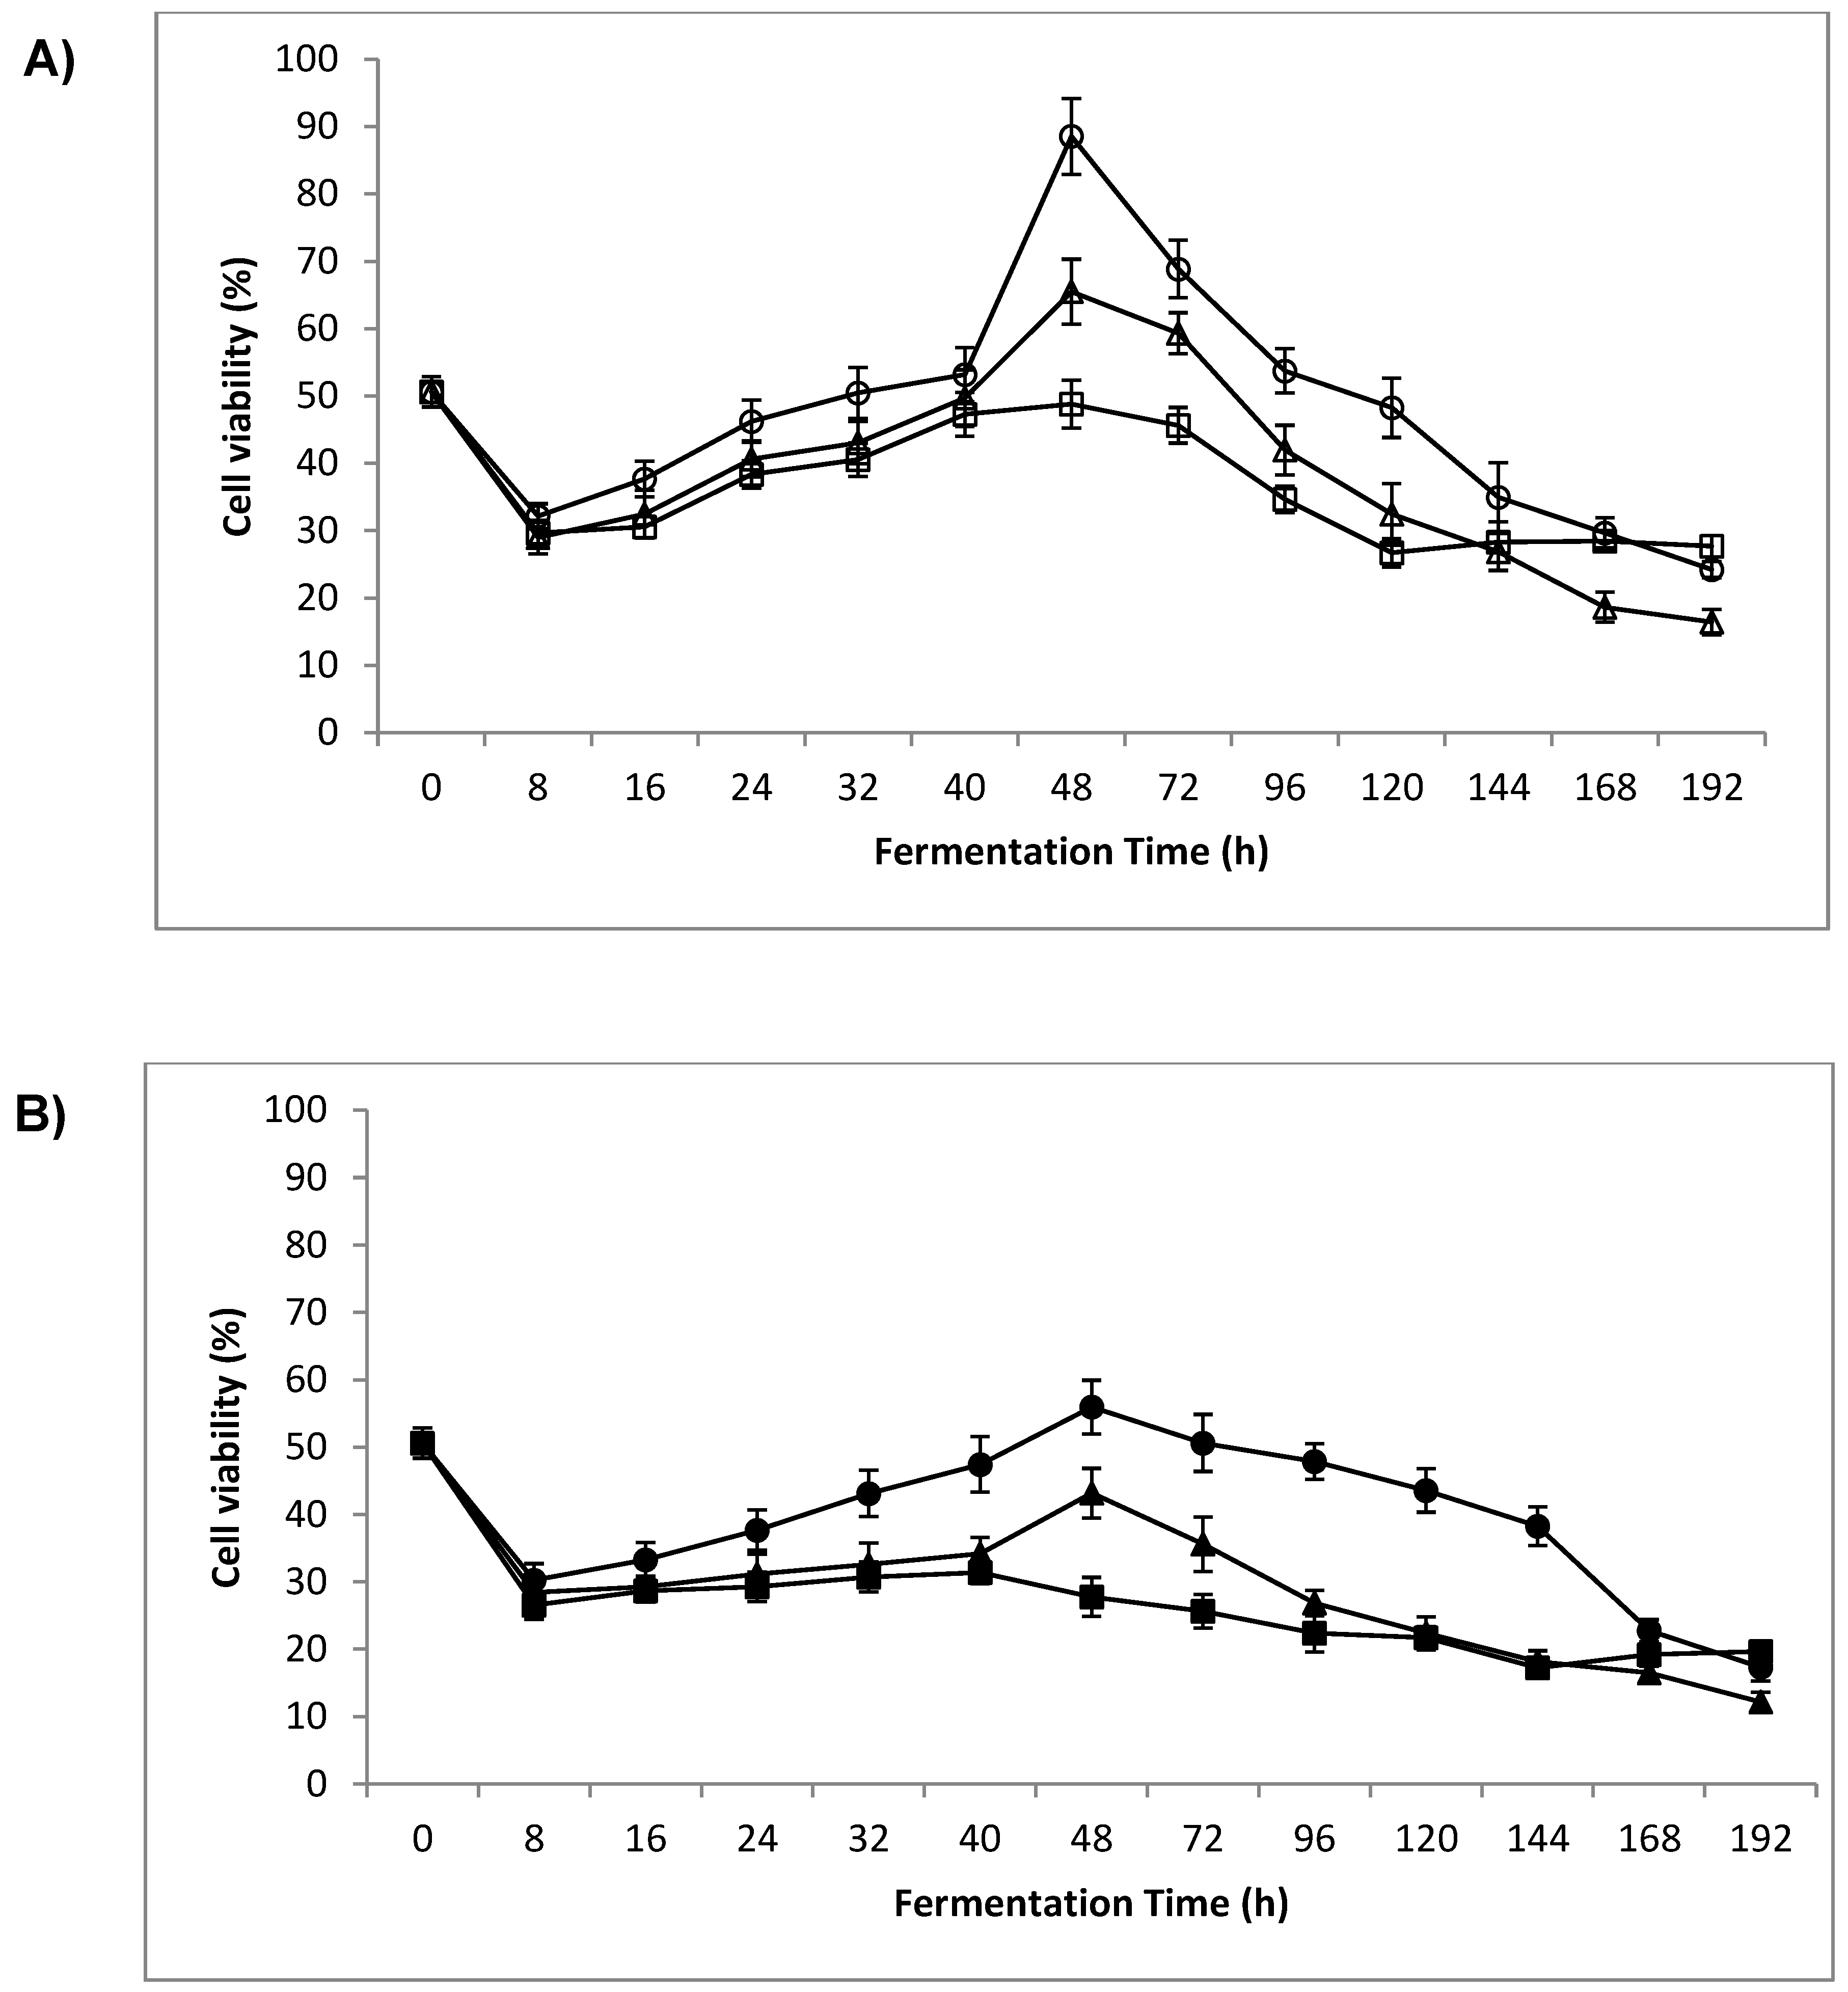
Yeast cells S. cerevisiae VIN 13 strain were inoculated in a medium containing three different glucose concentrations: 200, 300, or 400 g/L. The inoculation of each sample of the fermentation batch was performed according to the instructions of the yeast company (Anchor Yeast, Cape Town, South Africa) for wine production with 2 × 10⁵ living cells of 0.1 g dry yeast preconditioned in 0% and 6% NaCl for 24 h before the inoculation according to the procedure described by Logothetis et al. (2013) [41]. The volume of the inoculated substrate was 1000 mL for each sample. During alcoholic fermentation, for the monitoring of fermentation kinetics, samples of 50 mL from each fermented medium were collected every 8 h after homogenisation of the fermented medium for the direct determination of cell viability and optical absorption (OD). In a next step, these 50 mL samples were centrifuged (5000 rpm/10 min) and the sediment (yeast biomass) was freeze dried for the determination of cell dry weight and the yeast cell β-glucan concentration. Subsequently, the freeze-dried yeast cells were treated with lytic enzyme and sonication for the estimation of cell wall resistance and its correlation with cell wall β-glucan amount. After the centrifugation of the samples and before their freeze drying, they were washed three times with distilled water for the removal of the possible glucose that may have remained in the sample. This was applied in order to avoid glucose weight being taken into account in the determination of the dry weight of the sample, which might cause subsequent data errors to arise. After 192 h for the completion of the alcoholic fermentation, the suspension was separated from the yeast biomass sediment (centrifugal/5000 rpm/10 min) for the determination of various oenological analytical parameters, while the sediment was freeze-dried for β-glucan determination in yeast cell biomass.

3.2. Cell Viability

For all the samples, cell viability rose during the early exponential phase of fermentation and reached a first peak after 16 h. At this point, cells of samples (200 g/L glucose, 0% NaCl), (200 g/L glucose, 6% NaCl) and (300 g/L, 6% NaCl) showed the highest viability (%) (97.78 ± 2.04%, 97.36 ± 1.59% and 97.28 ± 1.02% respectively) while NaCl-stressed cells of samples (300 g/L glucose, 6% NaCl) and (400 g/L glucose, 6% NaCl) had higher viability portions (97.28 ± 1.02% and 93.43 ± 1.44% respectively) compared to the corresponding (300 g/L, 0% NaCl) and (400 g/L glucose, 0% NaCl) ones (93.94 ± 1.42% and 89.89 ± 1.13% respectively) (Figure 1). The cell viability reached a second, lower peak during the end of the exponential and the beginning of the stationary phase for all samples. The more viable cells were counted for samples (200 g/L glucose, 0% NaCl) and (200 g/L glucose, 6% NaCl) (97.84 ± 2.03% and 93.54 ± 1.88% respectively) (Figure 1). At the death phase (48–120 h), the cell viability decreased for all the samples, with a higher decrease for samples (300 g/L glucose, 6% NaCl) and (400 g/L glucose, 6% NaCl) (Figure 1). From 120 to 192 h, an increase in cell viability occurred for all samples, but this was more abrupt for NaCl-stressed cells of samples (300 g/L glucose, 6% NaCl) and (400 g/L glucose, 6% NaCl). Despite this increase, for all samples, after 192 h of fermentation, cell viability was lower when compared to values of the second peak. Finally, the viability of NaCl preconditioned and non-preconditioned yeast cells growing in a medium containing 200 g/L glucose was similar at the end of the fermentation (85.34 ± 1.3% and 83.44 ± 0.8% respectively) (Figure 1).

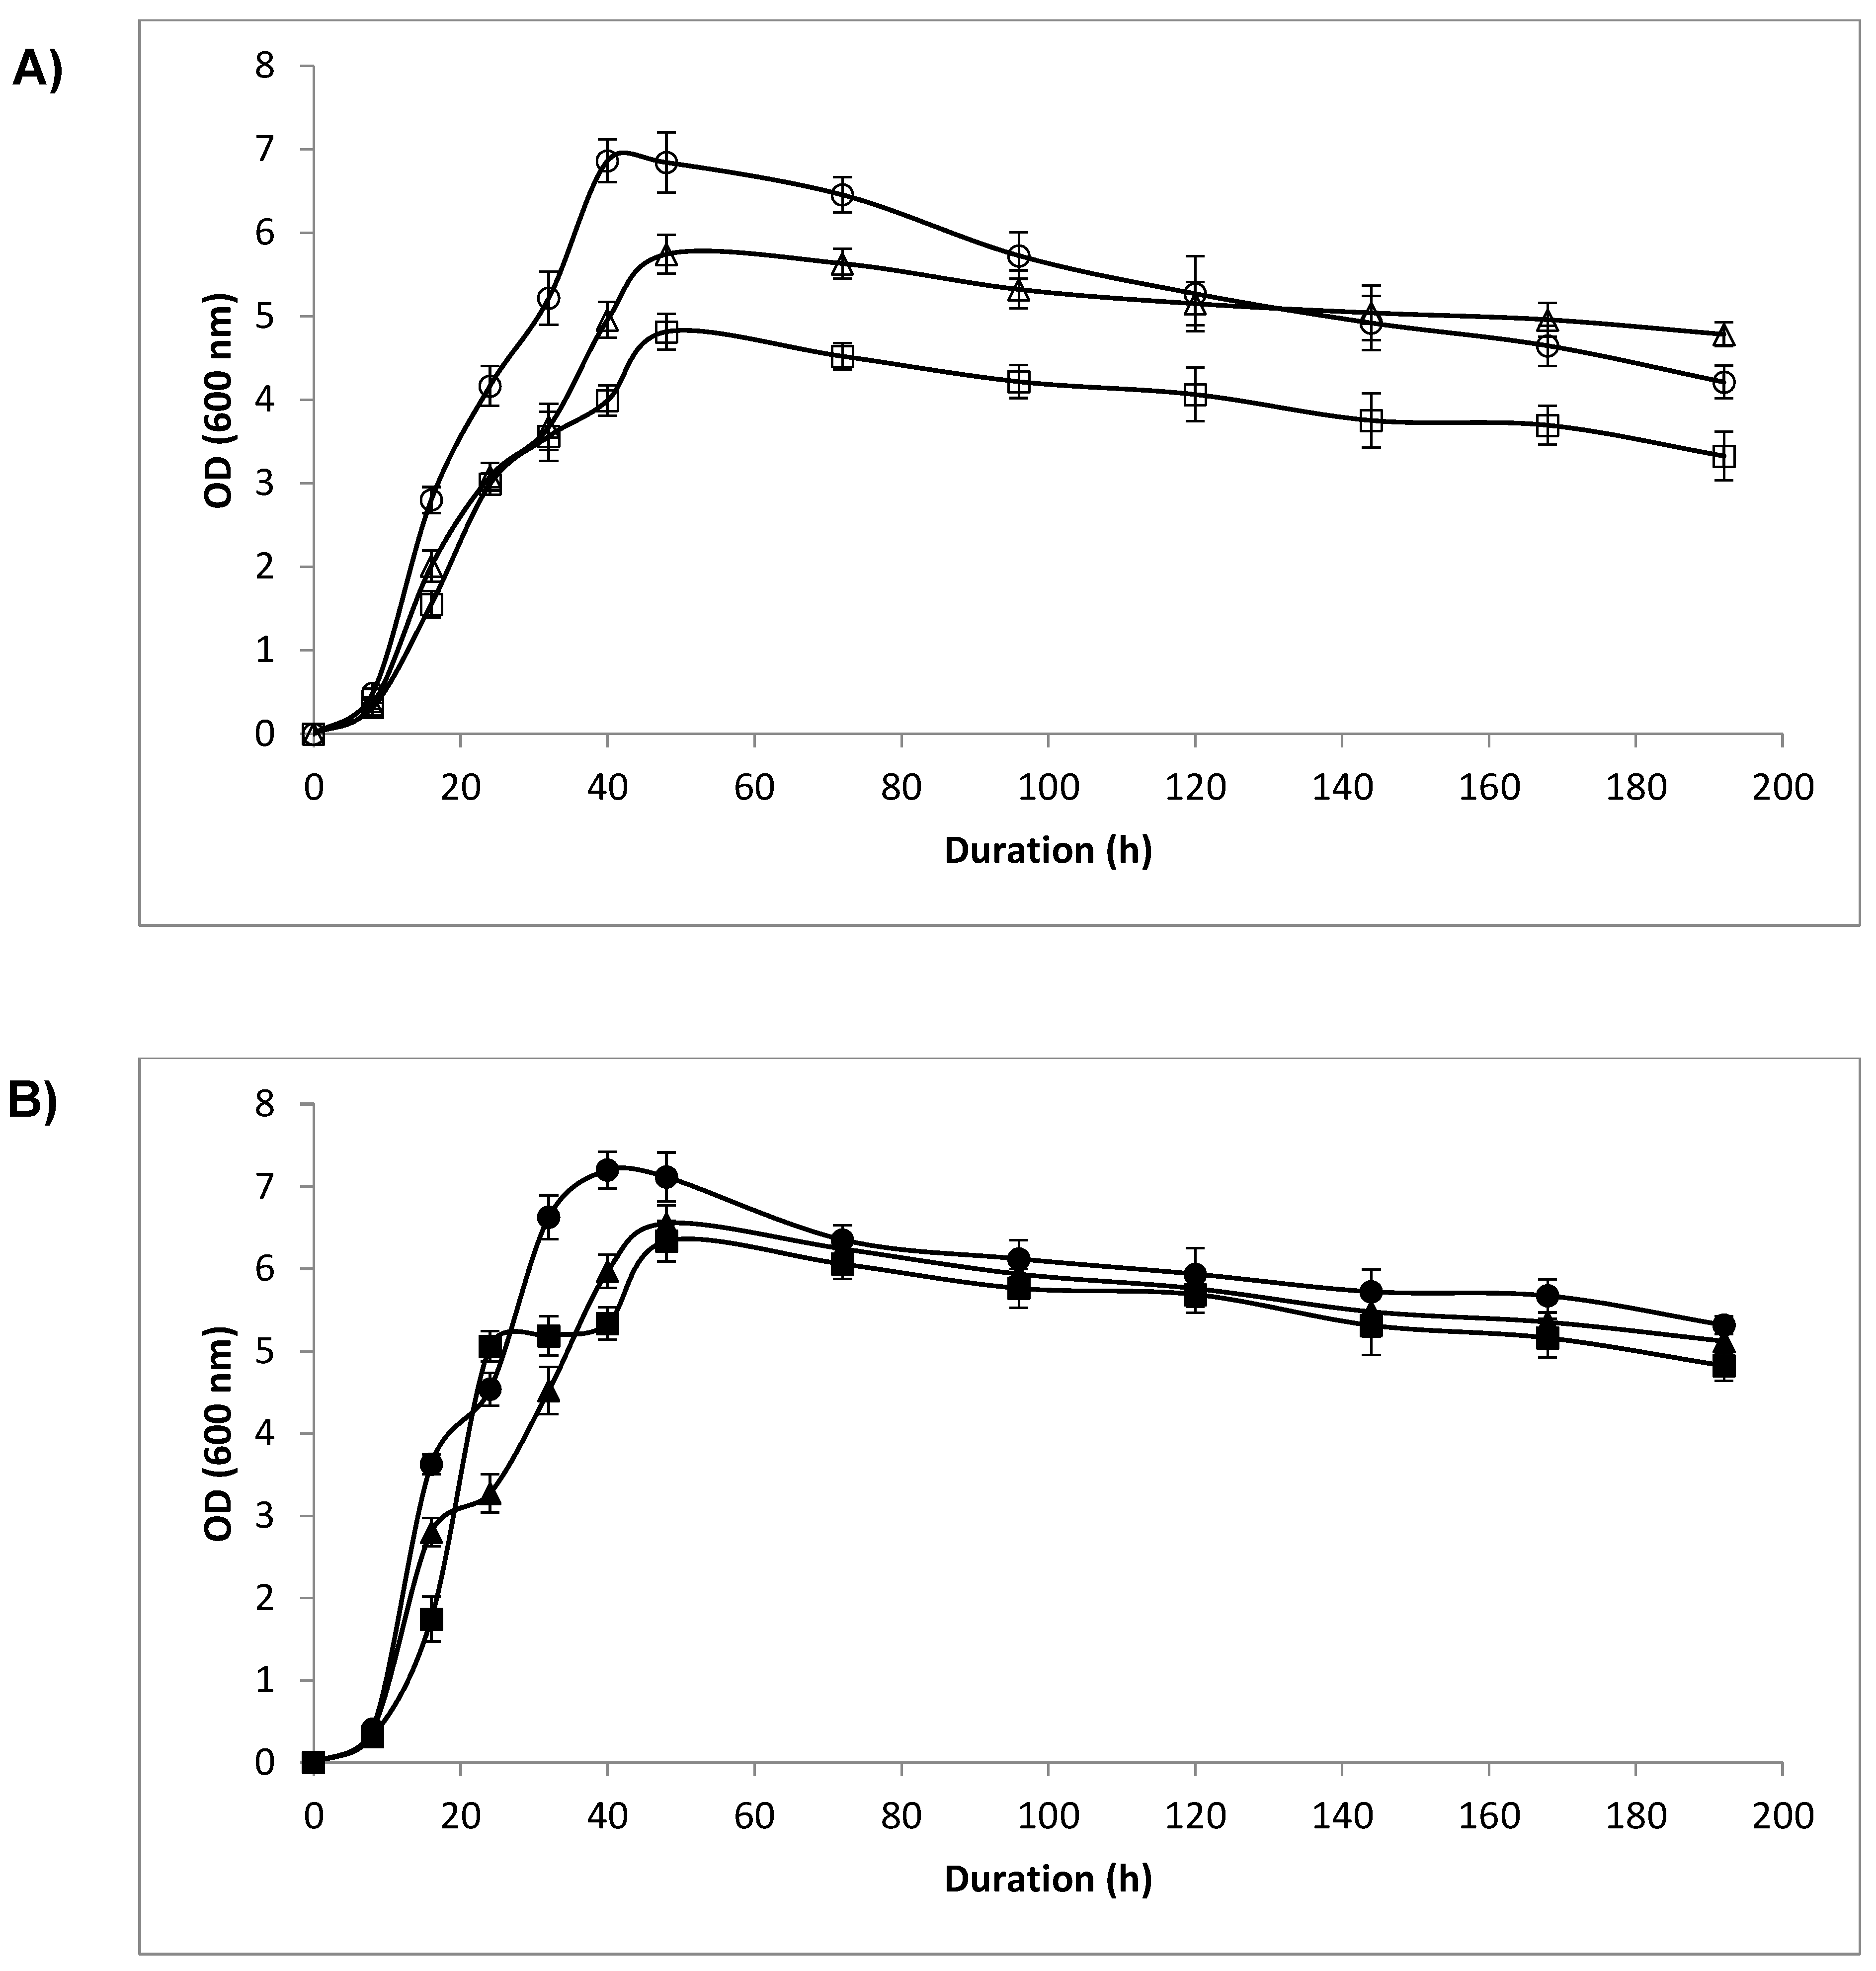
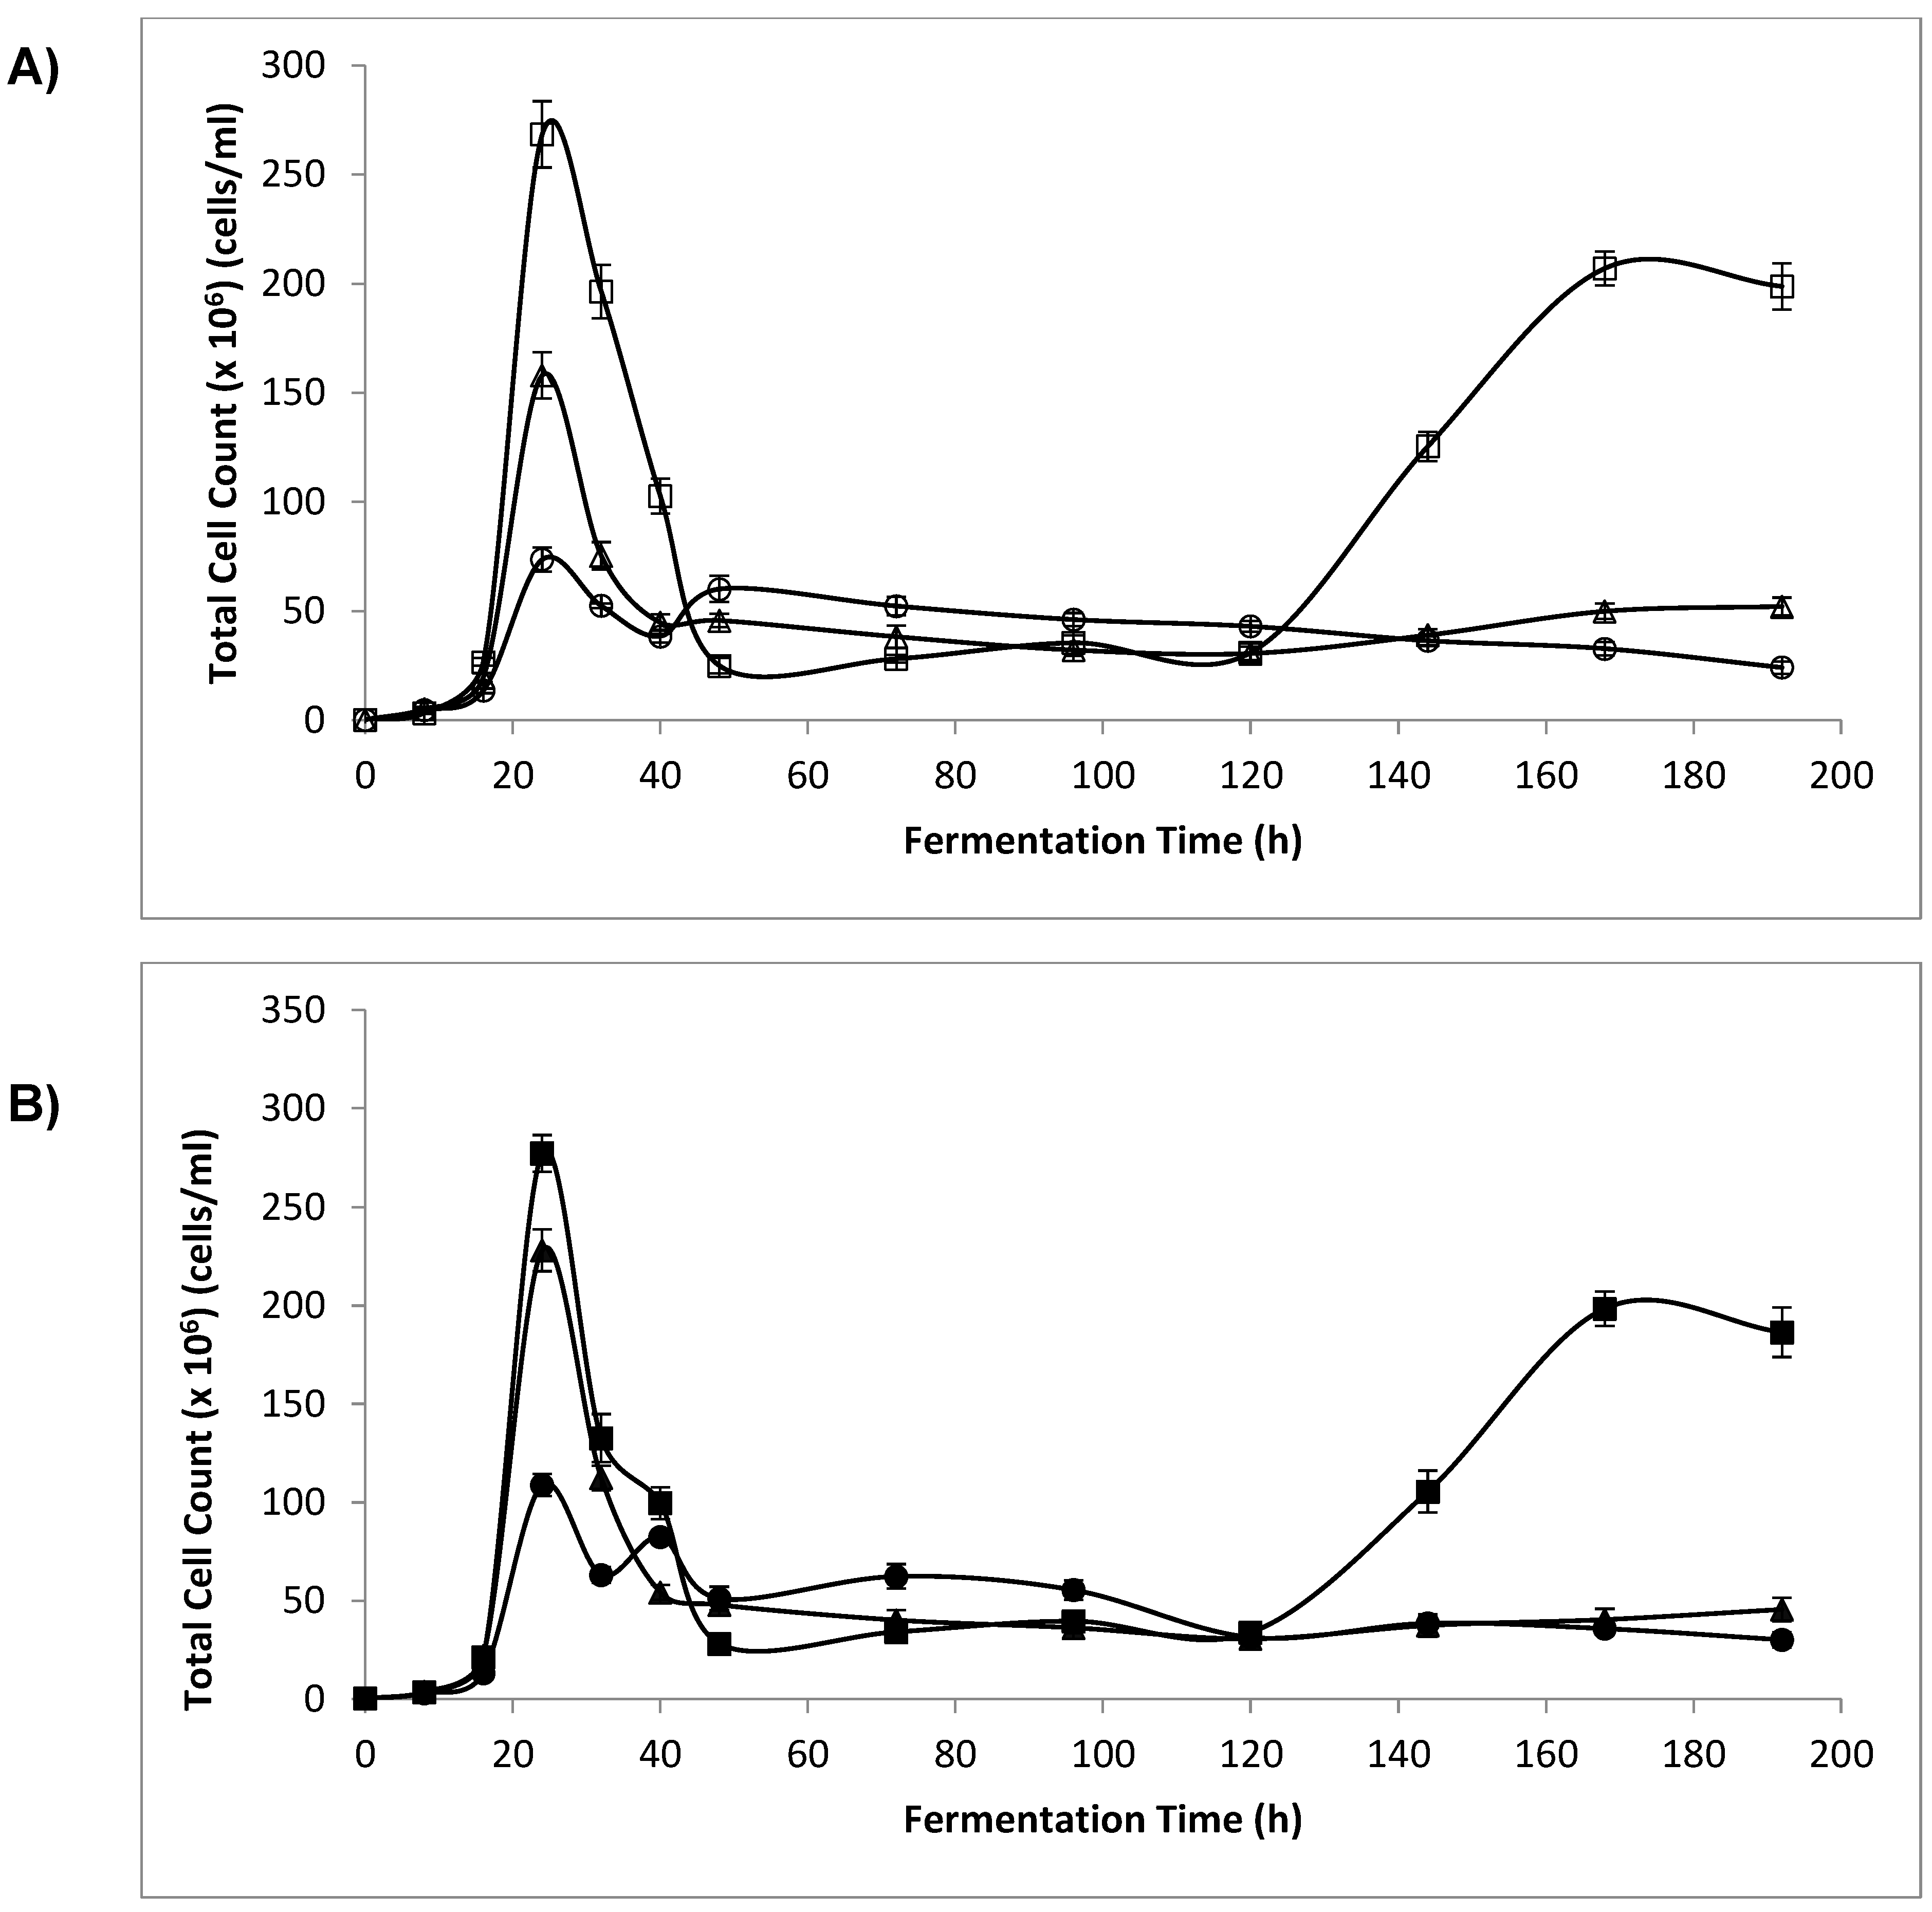
3.3. Optical Density (OD) and Cell Count

The results of OD (600 nm) measurements showed that the lag phase was 0–8 h for all the fermented samples; the exponential phase was between 0–40 h for the samples (200 g/L glucose, 0% NaCl) and (200 g/L glucose, 6% NaCl) and 0–48 h for the others. The stationary phase for the samples (200 g/L glucose, 0% NaCl) and (200 g/L glucose, 6% NaCl) was short (40–48 h), while for the other samples it was longer (48–72 h). The death phase was determined to be between 48 and 192 h for the samples (200 g/L glucose, 0% NaCl) and (200 g/L glucose, 6% NaCl)) and 72–192 h for the samples (300 g/L glucose, 0% NaCl), (300 g/L glucose, 6% NaCl), (400 g/L glucose, 0% NaCl), and (400 g/L glucose, 6% NaCl) (Figure 2).
The cell count was used in order to determine the total yeast cell number during the fermentation process. Our results revealed that during the death phase, the OD (600 nm) and the cell number decreased for all the samples but, surprisingly, between 120 and 192 h the number of cells grown in 400 g/L glucose (0% and 6% NaCl) increased considerably (198.75 × 10⁶ and 186.44 × 10⁶ cells/mL respectively) compared with the other media (200 g/L glucose, 0% NaCl), (200 g/L glucose, 6% NaCl), (300 g/L glucose, 0% NaCl) and (200 g/L, 6% NaCl) (24.15 × 10⁶, 30.12 × 10⁶, 52.13 × 10⁶ and 45.54 × 10⁶ cells/mL respectively) (Figure 3). The samples with 200 g/L glucose showed two peaks, at 24 and 48 h, with the first peak a little higher than the second. The other samples (200 g/L glucose, 0% NaCl), (200 g/L glucose, 6% NaCl), (300 g/L glucose, 0% NaCl), (200 g/L glucose, 6% NaCl) showed one peak at 24 h, which was significantly higher compared to that of samples (200 g/L glucose, 0% NaCl) and (200 g/L glucose, 6% NaCl), thus indicating a higher cell number (Figure 3).

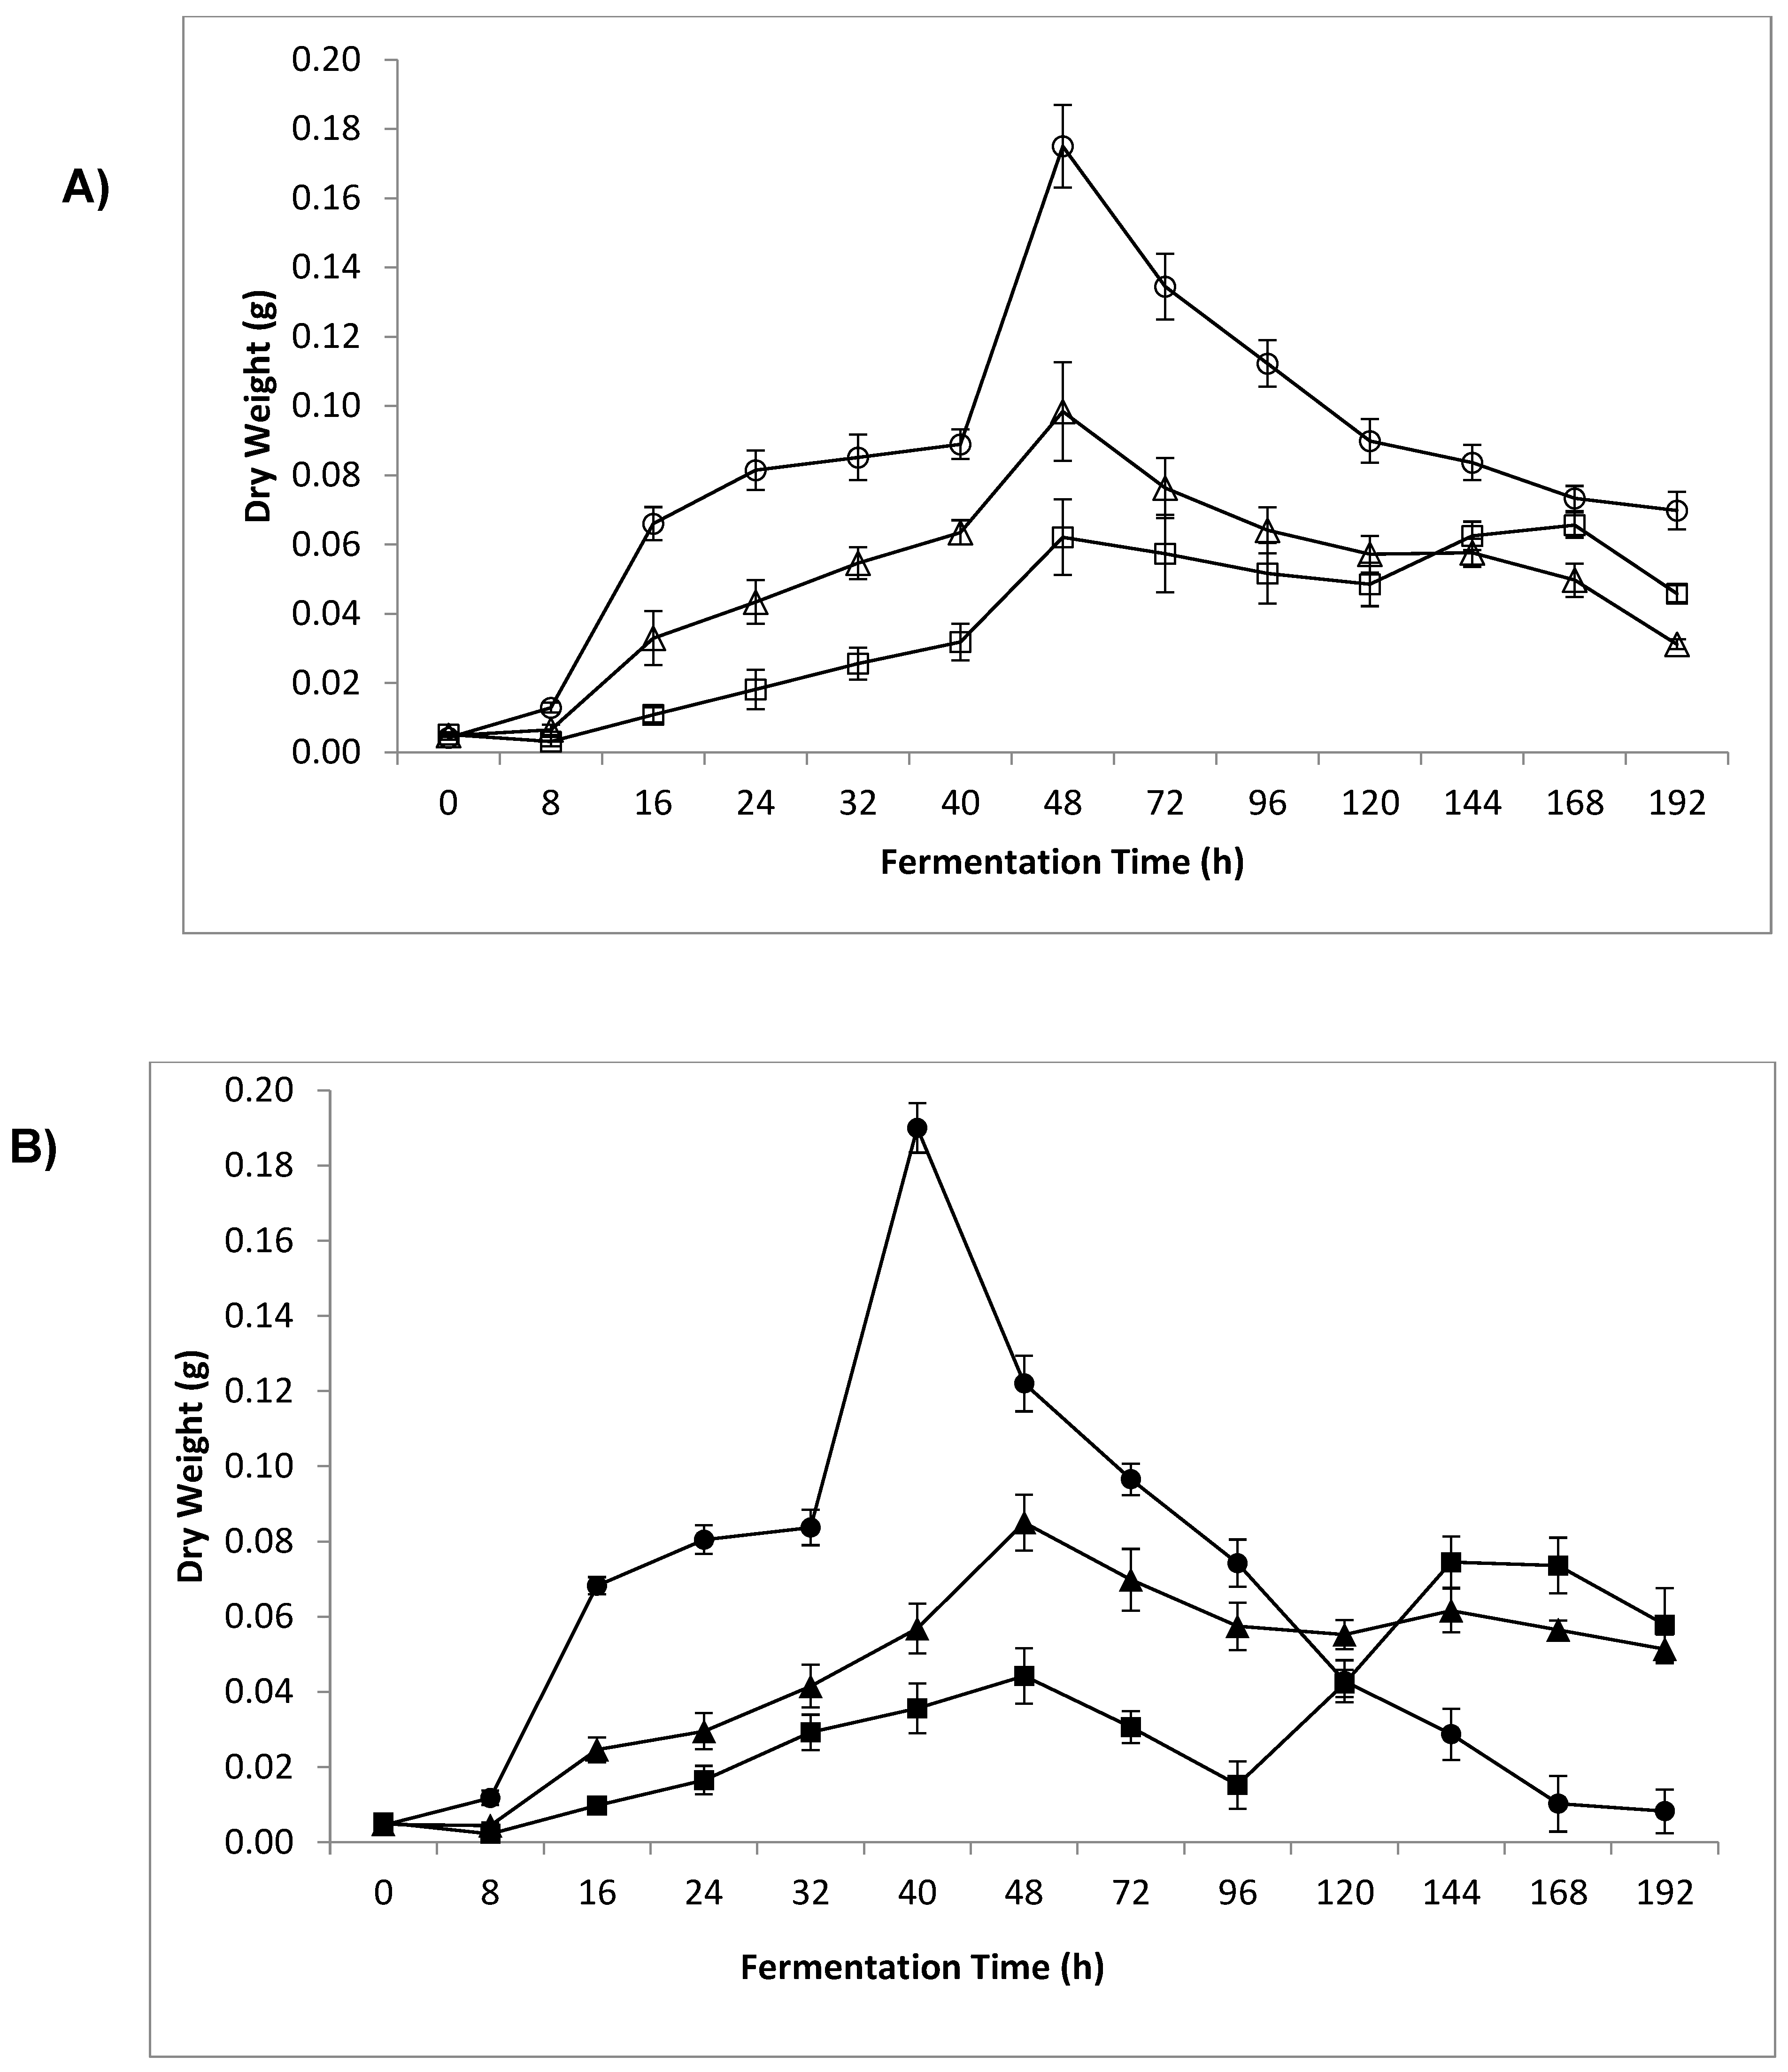
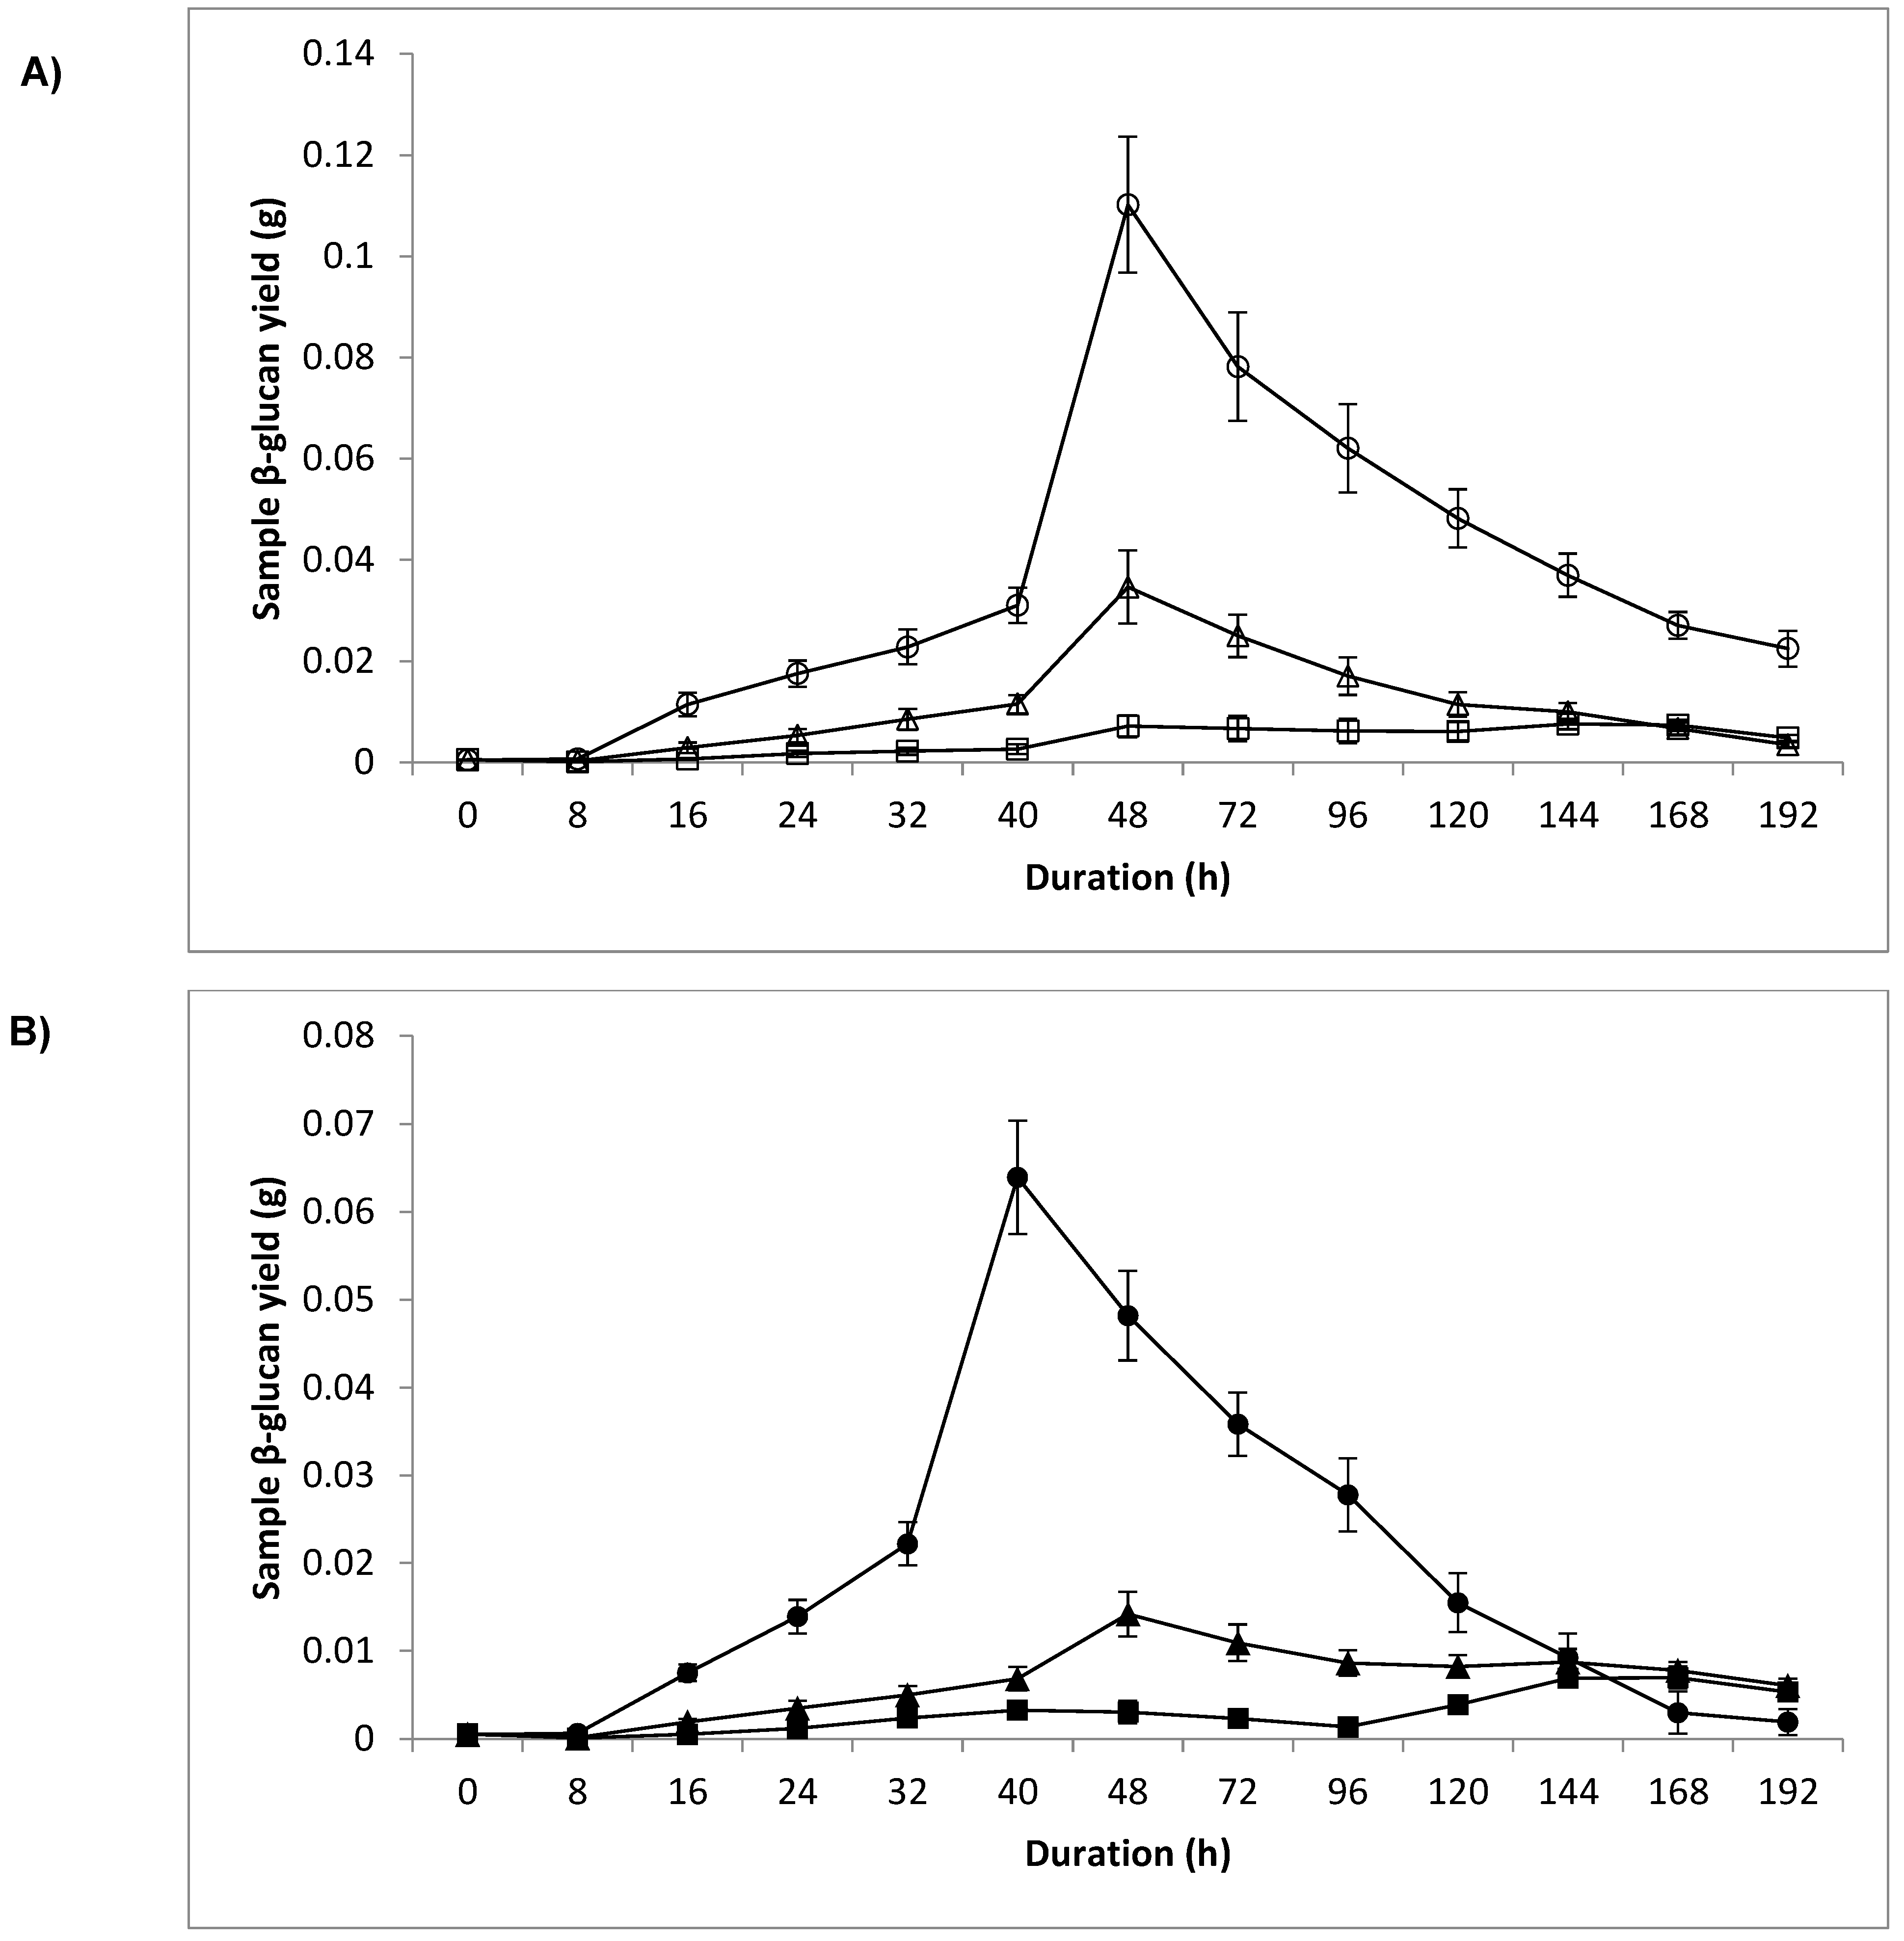
3.4. Dry Weight and Sample β-Glucan Yield

The freeze-dried yeast cell biomass obtained from a 50-mL sample of fermented medium at various times was determined gravimetrically. For each of the fermented media, the dry weight of yeast biomass rose constantly until the early stationary phase and then decreased constantly during the death phase only for media (200 g/L glucose, 0% NaCl), (200 g/L glucose, 6% NaCl) and (300 g/L glucose, 0% NaCl). The fermented media (300 g/L glucose, 6% NaCl), (400 g/L glucose, 6% NaCl) and (400 g/L glucose, 6% NaCl) showed a smaller decline, with a slight increase in yeast biomass for (300 g/L glucose, 6% NaCl) and (400 g/L glucose, 0% NaCl) and a more significant one for (400 g/L glucose, 6% NaCl) at the end of the fermentation (144–192 h) (Figure 4). The highest value of yeast dry weight (0.1900 ± 0.0066 g) was obtained with 200 g/L glucose, NaCl-stressed cells, with 40 h fermentation time (Figure 4).
The β-Glucan yield (g) was optimum for media (200 g/L glucose, 0% NaCl), (200 g/L glucose, 6% NaCl), (300 g/L glucose, 0% NaCl) and (300 g/L glucose, 6% NaCl) at the stationary phase (p ≤ 0.05), while for medium (400 g/L glucose, 0% NaCl) it reached a peak at the stationary phase and remained constant until the end of fermentation and for medium (400 g/L glucose, 6% NaCl) it was optimum at the end of fermentation (Figure 5). The highest β-Glucan yield (0.1038 ± 0.0073 g) was obtained with fermented medium (200 g/L glucose/0% NaCl (non-stressed cells)/48 h fermentation time) at the stationary phase (Figure 5).

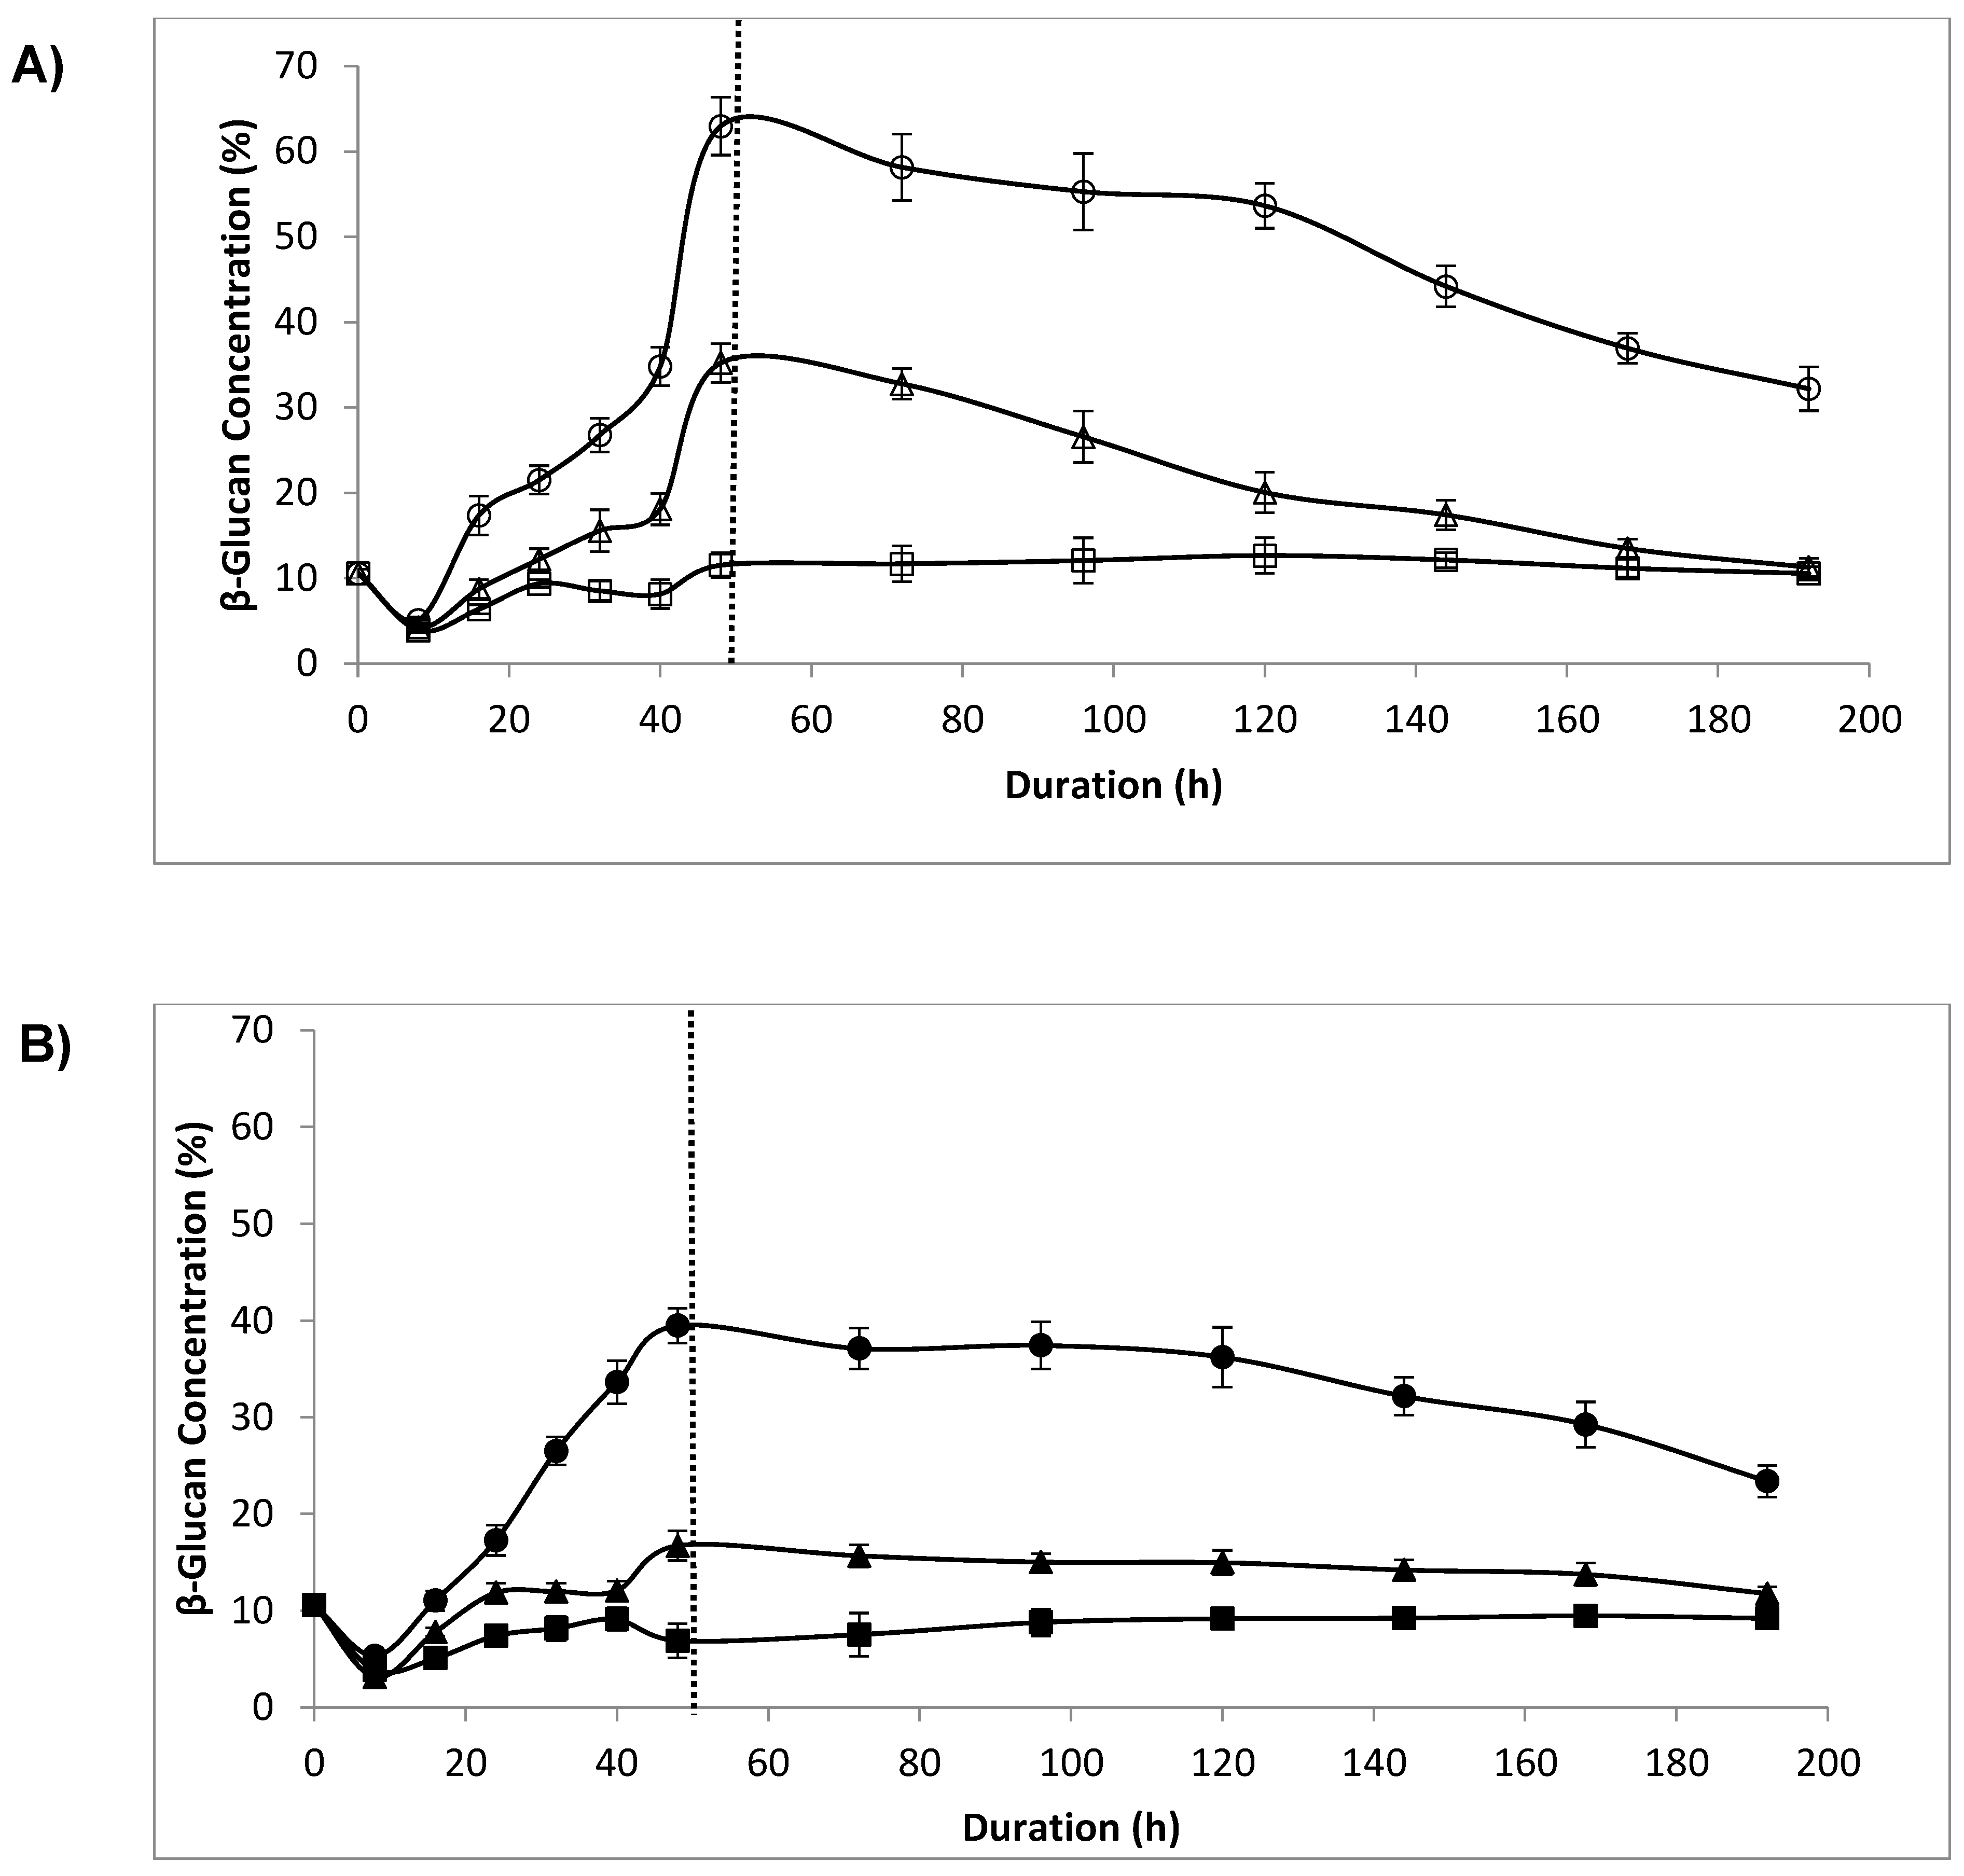
3.5. β-Glucan Concentration

For the fermented media (200 g/L glucose, 0% NaCl), (200 g/L glucose, 6% NaCl), (300 g/L glucose, 0% NaCl) and (300 g/L glucose, 6% NaCl), the highest yeast cell wall β-glucan concentration was observed at the stationary phase (p ≤ 0.05) (Figure 6). For media (400 g/L glucose, 0% NaCl) and (400 g/L glucose, 6% NaCl), the β-glucan concentration rose until the cell culture entered the stationary phase and remained stable during the death phase (Figure 6). The highest β-glucan yeast cell concentration was observed for non-NaCl-stressed and NaCl-stressed cells grown in a medium containing 200 g/L glucose (62.95 ± 3.39 % and 39.49 ± 1.78 % respectively). Also, cells grown in these media showed a β-glucan concentration higher at the end of the alcoholic fermentation compared to the cells grown with the other media (Figure 6).

3.6. Cell Wall Treatment with Lytic Enzyme and Sonication

The highest cell wall resistance to the end of exponential phase either to lytic enzyme or to sonication was observed for sample (200 g/L glucose, 0% NaCl), which had the highest β-glucan concentration. A decline in these results was observed for the fermented media (400 g/L glucose, 0% NaCl) and (400 g/L glucose, 6% NaCl) during the death phase (120–192 h of fermentation); despite their lowest β-glucan cell wall content, they appeared to be more resistant to the action of lytic enzyme but not to ultrasounds when compared to cells of samples (300 g/L glucose, 0% NaCl) and (300 g/L glucose, 6% NaCl) (Figure 7 and Figure 8).

4. Discussion

The impact of various environmental stresses on the yeast fermentation performance has been well studied and reviewed before [27,28,29,30,31,32,42,43], but the study of the yeast cell wall composition during the fermentation process is insufficient, with only a few published works referring to the impact of fermentation growth conditions and mode of cultivation on the yeast cell wall structure [20,21,44], the mode of fermentation on yeast cell wall β-glucan content [18], and the role of additives in the culture medium in β-glucan production [22,45]. The impact of glucose and NaCl stress on yeast cell wall remodelling via the study of the fluctuation of β-glucan concentration during the fermentation process has not been studied until now.

4.1. Cell Viability

Cell viability measurement with the methylene blue method is an established technique for yeast cell staining [46], used for the estimation of clear viable yeast cells [36,38]. Cell viability measurements were conducted: (a) for the estimation of the impact of stress conditions on cell viability during the fermentation process, and (b) for the correlation of yeast β-glucan concentration with cell biomass dry weight and total cell number, as non-viable and lysed cells were expected to have a higher β-glucan concentration (expressed as % of the yeast dry weight). In our experiments, cell viability reached two peaks and then decreased for all the fermented samples (Figure 1). At this point, the glucose concentration stress seems to be critical as cell viability decreases as glucose increases but the corresponding values for NaCl-stressed and non-stressed cells were similar for the same glucose concentration for all fermented samples (Figure 1). At the death phase (48–120 h), the synergistic action of glucose and NaCl stress seems to impact negatively on the cell viability, with a larger decrease in viable cell count for fermented samples with NaCl-stressed cells grown in media containing 300 and 400 g/L glucose (Figure 1).
Our results differed from the observations of other researchers under the same glucose (200 g/L) and NaCl (6%) stress conditions with the use of the S. cerevisiae VIN 13 strain, which observed a constant decrease of cell viability during the fermentation process [27]. These differences might be due to the different cell NaCl pre-culturing time (24 h in our experiments, 48 h in their work), the different volume of fermented medium (1000 mL in our experiments, 250 mL in their work) and the different package containing dry yeast used for carrying out the fermentations.
Also, at the end of death phase, the NaCl-preconditioned cells grown in the denser glucose medium had the highest viable cell values. These results cannot be compared with other researchers’ results that used the same yeast strain with salt pre-culturing (NaCl 6% w/v) but in an even denser glucose medium (550 g/L), as cell viability values are not given [41]. Our results were in accordance with the observations of other researchers who found that NaCl pre-cultured yeast cells showed an increased cell viability at the end of the fermentation process [36]. Despite this increase, for all samples, after 192 h of fermentation, cell viability was lower compared to the values of the second peak. Lower cell viability was possibly caused by cell autolysis during the death phase of the alcoholic fermentation and consequently to a rise in the cell’s dry weight due to cytoplasm leaking out from the cell to the supernatant [43]. Concerning the impact of NaCl 6% (w/v) concentration on yeast cells, our results with NaCl pre-cultured and non-pre-cultured yeast cells growing in a medium containing 200 g/L glucose differed from results of other researchers that indicated that higher osmotic shock conditions (˃5% w/v NaCl) resulted in a higher cell viability at the end of the fermentation compared to the non-NaCl-stressed cells, while the viability value (83.44 ± 0.8%) for NaCl-stressed cells was in accordance with the corresponding one that previous researchers reported [27,47] (Figure 1). Concerning all the fermented media with the same glucose concentration, they appeared to have almost the same cell number at the end of fermentation (Figure 1), thus indicating that NaCl stress for the same glucose concentration had almost no impact on the cell viability at the end of the fermentation (Figure 1). As a general rule, the viability results were in accordance with the results reported by Logothetis et al. (2014), which suggested that salt pre-culturing of yeast S. cerevisiae impacts positively on cell viability [36].

4.2. Optical Density and Cell Count

Optical density (OD) is used for the estimation of yeast growth and the determination of exponential, stationary and lag phase during batch fermentations [18,21]. For media (300 g/L glucose, 0% NaCl), (300 g/L glucose, 6%), (400 g/L glucose, 0% NaCl) and (400 g/L glucose, 6% NaCl) the three fermentation phases coincided while for media (200 g/L glucose, 0% NaCl) and (200 g/L glucose, 6% NaCl) the fermentation phases also coincided but the exponential and stationary phases were shorter compared to the other media, thus indicating that NaCl stress had no impact on fermentation kinetics, while glucose concentration had a slight impact (Figure 2). Our OD results cannot be compared with those of other researchers who used the same yeast strain and stress conditions, as OD measurements are not given [27,47]. Also, our OD results differed from the report of Kim et al. (2006), but these researchers used a different S. cerevisiae strain with no glucose and NaCl-stressed yeast cells, and also used different media and fermentation times [18].
The cell count was used in order to determine the total yeast cell number during the fermentation process and correlate it with cell viability [47], but also with dry yeast mass weight (g) and β-glucan yield (%). During the death phase, the cell number decreased, with a simultaneous decrease in OD (600 nm) for all the fermented media; surprisingly, though, between 120 and 192 h, the number of cells grown in 400 g/L glucose increased spectacularly compared to the other samples. This cell number increase of glucose- and NaCl-stressed cells was not accompanied by a cell dry mass increase. This probably indicates a smaller yeast cell but further observations with electron microscopy must be performed in order to validate such a hypothesis (Figure 3). These results differed from other researchers’ studies that used the same yeast strain, glucose and NaCl stress conditions, which suggests that NaCl-induced osmotic stress caused growth arrest in yeast cells, while an increase in osmotic stress with elevated NaCl concentration caused a decrease in yeast growth and total cell number over time [27]. During the first 40 h of fermentation, the cell count of media (200 g/L glucose, 0% NaCl) and (200 g/L glucose, 6% NaCl) was lower than that of the other media, while their dry weights appeared to be higher and their cell walls contained much more β-glucan (Figure 3 and Figure 6), thus indicating fewer cells but larger ones, those with wider cell walls or both.

4.3. Dry Weight and Sample β-Glucan Yield

The determination of yeast dry weight at the various fermentation phases was done in order to calculate the β-glucan yield (g) at the different fermentation phases and optimise the phase at which the cells must be harvested. The highest value of dry weight (g) and β-glucan yield (g) was obtained with 200 g/L glucose/NaCl-non-stressed and 200 g/L glucose/stressed cells at 48 and 40 h, respectively, thus indicating that the stationary phase is the most appropriate time for cell harvesting, a result that is in accordance with the observations of Kim et al. (2006) [18]. From the obtained results, it is shown that glucose and NaCl stress impacts negatively on yeast dry weight and β-glucan yield (Figure 4 and Figure 5). Also, for media (400 g/L glucose, 0% NaCl) and (400 g/L glucose, 6% NaCl), the highest value for yeast dry weight and β-glucan yield appeared at the end of the death phase and, despite the fact that β-glucan concentration was lowered, the total cell number increased. It seems that, in this way, the yeast cell maintains homeostasis in order to cope with the conditions of glucose and NaCl stress during the fermentation process, but this needs further investigation and is proposed as future research.

4.4. β-Glucan Concentration, Lytic Enzyme and Sonication

The determination of yeast β-glucan concentration was done for the estimation of polysaccharide and its accumulation in the yeast cell, while furthering the understanding of yeast cell wall β-glucan modification during the fermentation process under stress conditions, the estimation of cell wall lysis and disruption resistance against lytic enzymes and sonication was tested with cell viability measurements.
Generally, for all the fermented media, the β-glucan yeast cell wall concentration rose constantly during the exponential phase and rose to a peak value at the stationary phase and then decreased during the death phase (Figure 6). Also, the cell treatment with lytic enzyme and sonication revealed that the cell’s resistance against lysis and disruption increased as the cell entered the stationary phase. Next, as the cell entered the death phase, its resistance against lytic enzymes and sonication lowered, thus supporting the observations of a constant accumulation of β-glucan in the cell wall during the exponential phase, with its maximum quantity at the stationary phase and consequently a decrease during the death phase (Figure 7 and Figure 8). During yeast alcoholic fermentation, the accumulation of ethanol causes an increase in yeast cell membrane permeability [42]. During the death phase, all the samples appeared to be more susceptible to lytic enzyme and sonication treatment (Figure 7 and Figure 8) but for NaCl-stressed cells grown in a medium containing 300 g/L glucose and both NaCl-stressed and non-stressed yeast cells grown in a medium containing 400 g/L glucose, there was not a direct correlation between β-glucan concentration and cell wall resistance as these cells appeared to be more susceptible to lytic enzyme and sonication treatment, probably due to the additional impact of ethanol toxicity [48] (Figure 7 and Figure 8).
Our results were in accordance with the observations of Kim et al. (2006), according to which, during the yeast growth in a defined medium, the cell wall resistance to the action of β-glucanase increases until the yeast cells enter the stationary phase, while their resistance to the enzyme decreases at the end of the stationary phase [18]. Also, our results support the reports of Klis et al. (2002), which indicate that as cells enter the stationary phase, they become thicker [49]. This yeast cell wall resistance is a result of the cell wall increase during the exponential phase [18].
In non-continuous fermentation, during the transition from the exponential to the stationary phase, the action of β-1,3-glucan synthetase decreases while the action of glycogen synthetase increases [50]. During the exponential phase, the autolytic action of endo β-glucanases is higher compared to that in the stationary phase of yeast cells’ growth, while a significant increase in endoglucanases’ activity into the soluble fraction of β-glucan during the stationary phase in non-continuous fermentation of Saccharomyces exiguus has also been reported [51]. The stationary phase is characterised by carbon limitation, and as the cell culture enters this, more glucan is necessary for the maintenance of the cell’s viability [18]. The higher β-glucan concentration at the stationary phase can also be explained by the decreased action of cell’s glucanases, with the less active cell’s growth at the exponential phase, which is accompanied by a non-severe carbon limitation, similar to the one at the end of the stationary phase [18]. During aerobic fermentation, when yeast cells enter the stationary growth phase, the cells become more resistant to the action of β-1,3-glucanase and are less permeable to macromolecules with the expression of Sed1p protein [52,53].
In addition to the above, our results show that the increase of glucose osmotic stress in the growth medium, but also the NaCl hyperosmotic stress in the pre-cultured yeast cells, impacts negatively on the β-glucan concentration in the yeast cell wall. This negative impact on the β-glucan concentration was even more intense from the stationary phase until the end of the fermentation (death phase) (Figure 6).
Our results differed from those of other researchers, who reported a β-glucan increase at the end of fermentation; however, these researchers incorporated NaCl in the fermented medium and did not pre-culture yeast cells under salt hyperosmotic stress, and also used a different yeast strain [22]. Also, in their work, cell viability and total cell count were not taken into consideration and an increase in β-glucan concentration may have resulted from cell lysis, cytoplasm efflux and consequently a higher cell wall:cell ratio [14]. Our results cannot be compared with the results of Aguilar-Uscanga et al. (2003), who studied the impact of growth conditions and the mode of cultivation on the yeast cell wall structure and not the impact of stress conditions, with the collection of cell samples (50 mL volume) only in the early exponential phase [21].
Our β-glucan concentration results differed from the reports of other researchers that suggest that the cell wall integrity (CWI) pathway, in cooperation with the high osmotic response (HOG) pathway, regulates the action of zymolyase, the enzyme hydrolysing the β-1,3 glucan network, and thus result in an increase in the amount of cell wall β-glucan. These researchers used different yeast strains and different fermented medium components [24], while the data concerning osmotic stress responses were based on a previous research work in which KCl and NaCl had been diluted in the fermented substrate [54,55]. Our results are in accordance with the observations of Ene et al. (2015), who reported that the cell wall is not rigid but elastic and that sudden decreases in cell volume due to hyperosmotic conditions result in rapid increases in cell wall thickness, and thus a decrease in β-glucan content [25].
Our results are in accordance with the results of other researchers who used Glucanex 200G for the estimation of yeast cell wall resistance to lytic enzyme during batch fermentation and reported a higher cell resistance in the stationary phase [18]. Also, our results differ from other researchers’ results (97 ± 0.18% breaking rate, 10–15% cell concentration), but these differences may arise from the fact that these researchers used sonication for yeast cell lysis during a β-glucan extraction protocol in dry yeast first treated with hot water for mannoprotein removal and not in yeast from various fermentation phases [38].
The yeast cells appeared to be more susceptible to sonication treatment compared to lytic enzyme treatment. The higher cell wall resistance to lytic enzymes in the various fermentation phases could be attributed to the variation in cell number during the fermentation process (Figure 3 and Figure 7) and thus to the enzyme dispersion to a larger volume of cells [56] (e.g., the stable resistance of cells of fermented media with 400 g/L glucose to the action of the lytic enzyme at the end of the death phase where they appeared the highest cell number), while cell disruption of yeast cells treated with ultrasounds is independent of cell concentration but mainly proportional to the acoustic power [57,58] (Figure 3 and Figure 8).

5. Conclusions

In recent years, there has been increasing interest in industrial production of yeast β-glucan and its incorporation in functional foods and medicines due to its immunological properties in human and animal health systems. This study could comprise a quantitative indicator for the industrial production of yeast β-glucan from defined cell cultures but also from other yeast sources like breweries’ [23] and wineries’ spent yeast biomass [40].
The stationary growth phase appears to be optimal for β-glucan isolation from pure cell fermentation cultures. NaCl and glucose stress have a negative impact on β-glucan production. Yeast NaCl-stressed cells have a reduced β-glucan concentration compared to non-stressed for the same glucose concentrations, while this difference is more significant at the end of the fermentation for a fermented medium containing 200 g/L glucose, which is close to the wine must concentration intended for wine production. For the other two glucose concentrations (300 and 400 g/L), the differences at the end of the fermentation are not statistically significant. In the present study, it seems that the two different stresses act synergistically, with an additive negative impact on the cell wall β-glucan concentration; as for the same glucose concentration, the preconditioned NaCl cells had a lower β-glucan concentration compared to the non-preconditioned ones. Another significant observation was that for a yeast cell grown in a medium containing 400 g/L glucose, the cell wall β-glucan concentration remained almost the same from the end of the exponential phase until the end of the fermentation for both NaCl-stressed and non-stressed cells.
The study of cell wall physiology, which is still a poorly explored research field, and yeast cell growth under various stress conditions (glucose, ethanol, temperature, SO2, etc.), could comprise a key tool for the biotechnological development of new products like functional foods and antifungal drugs for medical and agricultural applications. Further study on the impact of stress conditions on the immunological properties of the isolated β-glucan from the various fermentation phases, as well as the study of glycolysis–glycogenesis biochemical pathways in the yeast cell wall under stress conditions, is proposed as it could offer new perspectives on yeast β-glucan-based drugs, adding to a deeper understanding of yeast stress biology phenomena and a more comprehensive view of alcoholic fermentation biochemical pathways. Additionally, the study of the genes encoding β-glucan accumulation in the yeast cell wall during the fermentation process and under various environmental stresses is proposed as it could enlighten us as to the molecular mechanisms of the yeast cell.

Author Contributions

Vassileios Varelas conceived, designed and performed the experiments, analyzed the data and wrote the paper. Evangelia Sotiropoulou and Maria Liouni analyzed the data. Xara Karambini performed the experiments. Elias T. Nerantzis conceived and designed the experiments.

Conflicts of Interest

The authors declare no conflict of interest.

References

  1. Reggiori, F.; Klionsky, D.J. Autophagic processes in yeast: Mechanism, machinery and regulation. Genetics 2013, 194, 341–361. [Google Scholar] [CrossRef] [PubMed]
  2. Ribéreau-Gayon, P.; Dubourdieu, D.; Donèche, B.; Lonvaud, A. Biochemistry of Alcoholic Fermentation and Metabolic Pathways of Wine Yeasts. In Handbook of Enology; John Wiley & Sons, Ltd.: Somerset, NJ, USA, 2006; pp. 53–77. [Google Scholar]
  3. Branduardi, P.; Porro, D. Yeasts in Biotechnology. In Yeast; Wiley-VCH Verlag GmbH & Co. KGaA: Weinheim, Germany, 2012; pp. 347–370. [Google Scholar]
  4. Ballou, C.E. Genetics of Yeast Mannoprotein Biosynthesis. In Fungal Polysaccharides; American Chemical Society: Washington, DC, USA, 1980; Volume 126, pp. 1–14. [Google Scholar]
  5. François, J.M.; Walther, T.; Parrou, J.L. Genetics and Regulation of Glycogen and Trehalose Metabolism in Saccharomyces cerevisiae. In Microbial Stress Tolerance for Biofuels; Liu, Z.L., Ed.; Springer: Berlin/Heidelberg, Germany, 2012; pp. 29–55. [Google Scholar]
  6. Wilson, W.A.; Hughes, W.E.; Tomamichel, W.; Roach, P.J. Increased glycogen storage in yeast results in less branched glycogen. Biochem. Biophys. Res. Commun. 2004, 320, 416–423. [Google Scholar] [CrossRef] [PubMed]
  7. Arvindekar, A.U.; Patil, N.B. Glycogen—A covalently linked component of the cell wall in Saccharomyces cerevisiae. Yeast 2002, 19, 131–139. [Google Scholar] [CrossRef] [PubMed]
  8. Orlean, P. Architecture and biosynthesis of the Saccharomyces cerevisiae cell wall. Genetics 2012, 192, 775–818. [Google Scholar] [CrossRef] [PubMed]
  9. Klis, F.M. Review: Cell wall assembly in yeast. Yeast 1994, 10, 851–869. [Google Scholar] [CrossRef] [PubMed]
  10. Van der Rest, M.E.; Kamminga, A.H.; Nakano, A.; Anraku, Y.; Poolman, B.; Konings, W.N. The plasma membrane of Saccharomyces cerevisiae: Structure, function, and biogenesis. Microbiol. Rev. 1995, 59, 304–322. [Google Scholar] [PubMed]
  11. Rank, G.H.; Robertson, A.J. Protein and lipid composition of the yeast plasma membrane. In Yeast Genetics: Fundamental and Applied Aspects; Spencer, J.F.T., Spencer, D.M., Smith, A.R.W., Eds.; Springer: New York, NY, USA, 1983; pp. 225–241. [Google Scholar]
  12. Stier, H.; Ebbeskotte, V.; Gruenwald, J. Immune-modulatory effects of dietary yeast β-1,3/1,6-D-glucan. Nutr. J. 2014, 13. [Google Scholar] [CrossRef] [PubMed]
  13. Ahmad, A.; Anjum, F.M.; Zahoor, T.; Nawaz, H.; Dilshad, S.M.R. β glucan: A valuable functional ingredient in foods. Crit. Rev. Food Sci. Nutr. 2012, 52, 201–212. [Google Scholar] [CrossRef] [PubMed]
  14. Varelas, V.; Liouni, M.; Calokerinos, A.C.; Nerantzis, E.T. An evaluation study of different methods for the production of β-D-glucan from yeast biomass. Drug Test. Anal. 2016, 8, 46–55. [Google Scholar] [CrossRef] [PubMed]
  15. Klis, F.M.; Boorsma, A.; de Groot, P.W.J. Cell wall construction in Saccharomyces cerevisiae. Yeast 2006, 23, 185–202. [Google Scholar] [CrossRef] [PubMed]
  16. Levin, D.E. Regulation of cell wall biogenesis in Saccharomyces cerevisiae: The cell wall integrity signaling pathway. Genetics 2011, 189, 1145–1175. [Google Scholar] [CrossRef] [PubMed]
  17. Hahn-Hägerdal, B.; Karhumaa, K.; Larsson, C.U.; Gorwa-Grauslund, M.; Görgens, J.; van Zyl, W.H. Role of cultivation media in the development of yeast strains for large scale industrial use. Microb. Cell Fact. 2005, 4. [Google Scholar] [CrossRef] [PubMed] [Green Version]
  18. Kim, K.S.; Yun, H.S. Production of soluble β-glucan from the cell wall of Saccharomyces cerevisiae. Enzym. Microb. Technol. 2006, 39, 496–500. [Google Scholar] [CrossRef]
  19. Catley, B.J. Isolation and analysis of cell walls. In Yeast, A Practical Approach; Campbell, I., Duffus, J.H., Eds.; Oxford University Press: London, UK, 1988; pp. 163–183. [Google Scholar]
  20. McMurrough, I.; Rose, A.H. Effect of growth rate and substrate limitation on the composition and structure of the cell wall of Saccharomyces cerevisiae. Biochem. J. 1967, 105, 189–203. [Google Scholar] [CrossRef] [PubMed]
  21. Aguilar-Uscanga, B.; François, J.M. A study of the yeast cell wall composition and structure in response to growth conditions and mode of cultivation. Lett. Appl. Microbiol. 2003, 37, 268–274. [Google Scholar] [CrossRef] [PubMed]
  22. Naruemon, M.; Romanee., S.; Cheunjit, P.; Xiao, H.; McLandsborough, L. A.; Pawadee, M. Influence of additives on Saccharomyces cerevisiae β-glucan production. Int. Food Res. J. 2013, 20, 1953–1959. [Google Scholar]
  23. Bastos, R.; Coelho, E.; Coimbra, M.A. Modifications of Saccharomyces pastorianus cell wall polysaccharides with brewing process. Carbohydr. Polym. 2015, 124, 322–330. [Google Scholar] [CrossRef] [PubMed]
  24. García, R.; Rodríguez-Peña, J.M.; Bermejo, C.; Nombela, C.; Arroyo, J. The high osmotic response and cell wall integrity pathways cooperate to regulate transcriptional responses to zymolyase-induced cell wall stress in Saccharomyces cerevisiae. J. Biol. Chem. 2009, 284, 10901–10911. [Google Scholar] [CrossRef] [PubMed]
  25. Ene, I.V.; Walker, L.A.; Schiavone, M.; Lee, K.K.; Martin-Yken, H.; Dague, E.; Gow, N.A.R.; Munro, C.A.; Brown, A.J.P. Cell wall remodeling enzymes modulate fungal cell wall elasticity and osmotic stress resistance. MBio 2015. [Google Scholar] [CrossRef] [PubMed]
  26. Erasmus, D.J.; van der Merwe, G.K.; van Vuuren, H.J.J. Genome-wide expression analyses: Metabolic adaptation of Saccharomyces cerevisiae to high sugar stress. FEMS Yeast Res. 2003, 3, 375–399. [Google Scholar] [CrossRef]
  27. Logothetis, S.; Nerantzis., E.T.; Gioulioti, A.; Kanelis, T.; Tataridis, P.; Walker, G. Influence of sodium chloride on wine yeast fermentation performance. Int. J. Wine Res. 2010, 2, 35–42. [Google Scholar] [CrossRef]
  28. Ishmayana, S.; Learmonth, R.P.; Kennedy, U.J. Fermentation performance of the yeast Saccharomyces cerevisiae in media with high sugar concentration. In Proceedings of the 2nd International Seminar on Chemistry, Jatinangor, Indonesia, 24–25 November 2011; pp. 379–385. [Google Scholar]
  29. Lei, H.; Xu, H.; Feng, L.; Yu, Z.; Zhao, H.; Zhao, M. Fermentation performance of lager yeast in high gravity beer fermentations with different sugar supplementations. J. Biosci. Bioeng. 2016, 122, 583–588. [Google Scholar] [CrossRef] [PubMed]
  30. Novo, M.; Gonzalez, R.; Bertran, E.; Martínez, M.; Yuste, M.; Morales, P. Improved fermentation kinetics by wine yeast strains evolved under ethanol stress. LWT Food Sci. Technol. 2014, 58, 166–172. [Google Scholar] [CrossRef]
  31. Trainotti, N.; Stambuk, B.U. NaCl stress inhibits maltose fermentation by Saccharomyces cerevisiae. Biotechnol. Lett. 2001, 23, 1703–1707. [Google Scholar] [CrossRef]
  32. Pratt, P.L.; Bryce, J.H.; Stewart, G.G. The effects of osmotic pressure and ethanol on yeast viability and morphology. J. Inst. Brew. 2003, 109, 218–228. [Google Scholar] [CrossRef]
  33. Ren, H.; Wang., X.; Liu, D.; Wang, B. A glimpse of the yeast Saccharomyces cerevisiae responses to NaCl stress. Afr. J. Microbiol. Res. 2012, 6, 713–718. [Google Scholar]
  34. Dhar, R.; Sägesser, R.; Weikert, C.; Yuan, J.; Wagner, A. Adaptation of Saccharomyces cerevisiae to saline stress through laboratory evolution. J. Evol. Biol. 2011, 24, 1135–1153. [Google Scholar] [CrossRef] [PubMed] [Green Version]
  35. Tilloy, V.; Ortiz-Julien, A.; Dequin, S. Reduction of ethanol yield and improvement of glycerol formation by adaptive evolution of the wine yeast Saccharomyces cerevisiae under hyperosmotic conditions. Appl. Environ. Microbiol. 2014, 80, 2623–2632. [Google Scholar] [CrossRef] [PubMed]
  36. Logothetis, S.; Nerantzis, E.T.; Tataridis, P.; Goulioti, A.; Kannelis, A.; Walker, G.M. Alleviation of stuck wine fermentations using salt-preconditioned yeast. J. Inst. Brew. 2014, 120, 174–182. [Google Scholar] [CrossRef]
  37. Prieto, M.A.; Vázquez, J.A.; Murado, M.A. Comparison of several mathematical models for describing the joint effect of temperature and ph on glucanex activity. Biotechnol. Prog. 2012, 28, 372–381. [Google Scholar] [CrossRef] [PubMed] [Green Version]
  38. Magnani, M.; Calliari, C.M.; de Macedo Jr, F.C.; Mori, M.P.; de Syllos Cólus, I.M.; Castro-Gomez, R.J.H. Optimized methodology for extraction of (1→3)(1→6)-β-d-glucan from Saccharomyces cerevisiae and in vitro evaluation of the cytotoxicity and genotoxicity of the corresponding carboxymethyl derivative. Carbohydr. Polym. 2009, 78, 658–665. [Google Scholar] [CrossRef]
  39. Varelas, V.; Tataridis, P.; Liouni, M.; Nerantzis, E.T. Application of different methods for the extraction of yeast β-glucan. e-J. Sci. Technol. 2016, 11, 75–89. [Google Scholar]
  40. Varelas, V.; Tataridis, P.; Liouni, M.; Nerantzis, E.T. Valorization of winery spent yeast waste biomass as a new source for the production of β-glucan. Waste Biomass Valori. 2016, 7, 807–817. [Google Scholar] [CrossRef]
  41. Logothetis, S.; Tataridis, P.; Kanellis, A.; Nerantzis, E.T. The effect of preconditioning cells under osmotic stress on high alcohol production. Zb. Matice Srp. za Prir. Nauke 2013, 405–414. [Google Scholar] [CrossRef]
  42. Bauer, F.F.; Pretorius, I.S. Yeast stress response and fermentation efficiency: How to survive the making of wine—A Review. S. Afr. J. Enol. Viticult. 2000, 21, 27–51. [Google Scholar]
  43. Patynowski, R.J.; Jiranek, V.; Markides, A.J. Yeast viability during fermentation and sur lie ageing of a defined medium and subsequent growth of Oenococcus oeni. Aust. J. Grape Wine Res. 2002, 8, 62–69. [Google Scholar] [CrossRef]
  44. Morris, G.J.; Winters., L.; Coulson, G.E.; Clarke, K.J. Effect of osmotic stress on the ultrastructure and viability of the yeast Saccharomyces cerevisiae. Microbiology 1986, 132, 2023–2034. [Google Scholar] [CrossRef] [PubMed]
  45. Naruemon, M.; Romanee., S.; Cheunjit, P.; Xiao, H.; McLandsborough, L.A.; Pawadee, M. Effect of three additives on the cell morphology and β-glucan production in Saccharomyces cerevisiae. Res. J. Pharm. Biol. Chem. Sci. 2011, 2, 283–295. [Google Scholar]
  46. Gilliland, R.B. Determination of yeast viability. J. Inst. Brew. 1959, 65, 424–429. [Google Scholar] [CrossRef]
  47. Logothetis, S.; Walker, G.; Nerantzis, E.T. Effect of salt hyperosmotic stress on yeast cell viability. Zb. Matice Srp. za Prir. Nauke 2007, 113, 271–284. [Google Scholar] [CrossRef]
  48. Stanley, D.; Bandara, A.; Fraser, S.; Chambers, P.J.; Stanley, G.A. The ethanol stress response and ethanol tolerance of Saccharomyces cerevisiae. J. Appl. Microbiol. 2010, 109, 13–24. [Google Scholar] [CrossRef] [PubMed]
  49. Klis, F.M.; Mol, P.; Hellingwerf, K.; Brul, S. Dynamics of cell wall structure in Saccharomyces cerevisiae. FEMS Microbiol. Rev. 2002, 26, 239–256. [Google Scholar] [CrossRef] [PubMed]
  50. Fleet, G.H. Cell walls. In The Yeasts; Rose, A.H.H.J.D., Ed.; Academic Press: London, UK, 1991; Volume 4, pp. 199–277. [Google Scholar]
  51. Inouhe, M.; Sugo, E.; Tohoyama, H.; Joho, M.; Nevins, D.J. Cell wall metabolism and autolytic activities of the yeast Saccharomyces exiguus. Int. J. Biol. Macromol. 1997, 21, 11–14. [Google Scholar] [CrossRef]
  52. Shimoi, H.; Kitagaki, H.; Ohmori, H.; Iimura, Y.; Ito, K. Sed1p is a major cell wall protein of Saccharomyces cerevisiae in the stationary phase and is involved in lytic enzyme resistance. J. Bacteriol. 1998, 180, 3381–3387. [Google Scholar] [PubMed]
  53. De Nobel, H.; Ruiz, C.; Martin, H.; Morris, W.; Brul, S.; Molina, M.; Klis, F.M. Cell wall perturbation in yeast results in dual phosphorylation of the slt2/mpk1 map kinase and in an slt2-mediated increase in fks2–lacz expression, glucanase resistance and thermotolerance. Microbiology 2000, 146, 2121–2132. [Google Scholar] [CrossRef] [PubMed]
  54. Rep, M.; Krantz, M.; Thevelein, J.M.; Hohmann, S. The transcriptional response of Saccharomyces cerevisiae to osmotic shock: Hot1p and msn2p/msn4p are required for the induction of subsets of high osmolarity glycerol pathway-dependent genes. J. Biol. Chem. 2000, 275, 8290–8300. [Google Scholar] [CrossRef] [PubMed]
  55. O′Rourke, S.M.; Herskowitz, I. Unique and redundant roles for HOG MAPK pathway components as revealed by whole-genome expression analysis. Mol. Biol. Cell 2004, 15, 532–542. [Google Scholar] [CrossRef] [PubMed]
  56. Kim, K.S.; Chang, J.E.; Yun, H.S. Estimation of soluble-glucan content of yeast cell wall by the sensitivity to glucanex® 200g treatment. Enzym. Microb. Technol. 2004, 35, 672–677. [Google Scholar] [CrossRef]
  57. Liu, D.; Zeng, X.A.; Sun, D.W.; Han, Z. Disruption and protein release by ultrasonication of yeast cells. Innov. Food Sci. Emerg. Technol. 2013, 18, 132–137. [Google Scholar] [CrossRef]
  58. Apar, D.K.; Ozmek, B. Protein releasing kinetics of bakers’ yeast cells by ultrasound. Chem. Biochem. Eng. Q. 2008, 22, 113–118. [Google Scholar]
Figure 1. (A) Yeast cell viability (%) of non-NaCl-stressed cells during various fermentation times (h) with three different media containing 200, 300, or 400 g/L glucose (n = 3 replications for each time). (B) Yeast cell viability (%) of NaCl-stressed cells during the fermentation process (h) with three different media containing 200, 300, or 400 g/L glucose (n = 3 replications for each time) (○): (200 g/L glucose, 0% NaCl), (∆): (300 g/L glucose, 0% NaCl), (): (400 g/L glucose, 0% NaCl), (): (200 g/L glucose, 6% NaCl), (): (300 g/L glucose, 6% NaCl), (): (400 g/L glucose, 6% NaCl).
Fermentation 03 00044 g001
Figure 2. (A) OD (600 nm) of non-NaCl-stressed cells during various fermentation times (h) with three different media containing 200, 300, or 400 g/L glucose (n = 3 replications for each time); (B) OD (600 nm) of NaCl-stressed cells during the fermentation process (h) with three different media containing 200, 300,or 400 g/L glucose (n = 3 replications for each time) (○): (200 g/L glucose, 0% NaCl), (∆): (300 g/L glucose, 0% NaCl), (□): (400 g/L glucose, 0% NaCl), (●): (200 g/L glucose, 6% NaCl), (▲): (300 g/L glucose, 6% NaCl), (■): (400 g/L glucose, 6% NaCl).
Fermentation 03 00044 g002
Figure 3. (A) Total cell count (cells/mL) of non-NaCl-stressed cells during various fermentation times (h) with three different media containing 200, 300, or 400 g/L glucose after cell treatment with sonication (n = 3 replications for each time and error bars represent standard deviation of the average value of all replications with each range of fermentation time); (B) Total cell count (cells/mL) of NaCl-stressed cells during various fermentation times (h) with three different media containing 200, 300, or 400 g/L glucose after cell treatment with sonication (n = 3 replications for each time and error bars represent standard deviation of the average value of all replications with each range of fermentation time) (○): (200 g/L glucose, 0% NaCl), (∆): (300 g/L glucose, 0% NaCl), (□): (400 g/L glucose, 0% NaCl), (●): (200 g/L glucose, 6% NaCl), (▲): (300 g/L glucose, 6% NaCl), (■): (400 g/L glucose, 6% NaCl).
Fermentation 03 00044 g003
Figure 4. (A) Dry weight (g) of a 50-mL sample of non-NaCl-stressed cells during various fermentation times (h) with three different media containing 200, 300, or 400 g/L glucose (n = 3 replications for each time and error bars represent standard deviation of the average value of all replications with each range of fermentation time); (B) Dry weight (g) of a 50-mL sample of non-NaCl stressed cells during various fermentation times (h) with three different media containing 200, 300, or 400 g/L glucose (n = 3 replications for each time and error bars represent standard deviation of the average value of all replications with each range of fermentation time) (○): (200 g/L glucose, 0% NaCl), (∆): (300 g/L glucose, 0% NaCl), (□): (400 g/L glucose, 0% NaCl), (●): (200 g/L glucose, 6% NaCl), (▲): (300 g/L glucose, 6% NaCl), (■): (400 g/L glucose, 6% NaCl).
Fermentation 03 00044 g004
Figure 5. (A) β-Glucan yield (%) of a 50-mL sample of non-NaCl-stressed cells during various fermentation times (h) with three different media containing 200, 300, or 400 g/L glucose (n = 3 replications for each time and error bars represent standard deviation of the average value of all replications with each range of fermentation time). Mean values between 0–144 h were significantly different at p ≤ 0.05 level. (B) β-Glucan yield (%) of a 50-mL sample of non-NaCl-stressed cells during various fermentation times (h) with three different media containing 200, 300, or 400 g/L glucose (n = 3 replications for each time and error bars represent standard deviation of the average value of all replications with each range of fermentation time). Mean values between 0–144 h were significantly different at p ≤ 0.05 level. (○): (200 g/L glucose, 0% NaCl), (∆): (300 g/L glucose, 0% NaCl), (□): (400 g/L glucose, 0% NaCl), (●): (200 g/L glucose, 6% NaCl), (▲): (300 g/L glucose, 6% NaCl), (■): (400 g/L glucose, 6% NaCl).
Fermentation 03 00044 g005
Figure 6. (A) Yeast cell wall β-glucan (%) of non-NaCl-stressed cells during various fermentation times (h) with three different media containing 200, 300, or 400 g/L glucose (n = 3 replications for each time and error bars represent standard deviation of the average value of all replications with each range of fermentation time). Mean values between 0–144 h were significantly different at p ≤ 0.05 level. (B) Yeast cell wall β-glucan (%) of NaCl-stressed cells during various fermentation times (h) with three different media containing 200, 300, or 400 g/L glucose (n = 3 replications for each time and error bars represent standard deviation of the average value of all replications with each range of fermentation time). Mean values between 0–144 h were significantly different at p ≤ 0.05 level. The stationary phase is indicated with the vertical line. (○): (200 g/L glucose, 0% NaCl), (∆): (300 g/L glucose, 0% NaCl), (□): (400 g/L glucose, 0% NaCl), (●): (200 g/L glucose, 6% NaCl), (▲): (300 g/L glucose, 6% NaCl), (■): (400 g/L glucose, 6% NaCl).
Fermentation 03 00044 g006
Figure 7. (A) Yeast cell viability (%) of non-NaCl-stressed cells during various fermentation times (h) with three different media containing 200, 300, or 400 g/L glucose after cell treatment with Glucanex 200G lytic enzyme (n = 3 replications for each time and error bars represent standard deviation of the average value of all replications with each range of fermentation time); (B) Yeast cell viability (%) of NaCl-stressed cells during various fermentation times (h) with three different media containing 200, 300, or 400 g/L glucose after cell treatment with Glucanex 200G lytic enzyme (n = 3 replications for each time and error bars represent standard deviation of the average value of all replications with each range of fermentation time) (○): (200 g/L glucose, 0% NaCl), (∆): (300 g/L glucose, 0% NaCl), (□): (400 g/L glucose, 0% NaCl), (●): (200 g/L glucose, 6% NaCl), (▲): (300 g/L glucose, 6% NaCl), (■): (400 g/L glucose, 6% NaCl).
Fermentation 03 00044 g007
Figure 8. (A) Yeast cell viability (%) of non-NaCl-stressed cells during various fermentation times (h) with three different media containing 200, 300, or 400 g/L glucose after cell treatment with sonication (n = 3 replications for each time and error bars represent standard deviation of the average value of all replications with each range of fermentation time); (B) Yeast cell viability (%) of NaCl-stressed cells during various fermentation times (h) with three different media containing 200, 300, or 400 g/L glucose after cell treatment with sonication (n = 3 replications for each time and error bars represent standard deviation of the average value of all replications with each range of fermentation time) (○): (200 g/L glucose, 0% NaCl), (∆): (300 g/L glucose, 0% NaCl), (□): (400 g/L glucose, 0% NaCl), (●): (200 g/L glucose, 6% NaCl), (∆): (300 g/L glucose, 6% NaCl), (■): (400 g/L glucose, 6% NaCl).
Fermentation 03 00044 g008

