Micro-Malting for the Quality Evaluation of Rye (Secale cereale) Genotypes
by
Yujuan Wang
, 
Zhao Jin
,
John Barr
,
James Gillespie
,
Senay Simsek
,
Richard D. Horsley
and
Paul B. Schwarz
* Department of Plant Sciences, Dept. 7670, North Dakota State University, P.O. Box 6050, Fargo, ND 58108, USA
*
Author to whom correspondence should be addressed.
Fermentation 2018, 4(3), 50; https://doi.org/10.3390/fermentation4030050
Submission received: 7 June 2018
/
Revised: 20 June 2018
/
Accepted: 21 June 2018
/
Published: 27 June 2018
(This article belongs to the Special Issue Brewing & Distilling)
Abstract
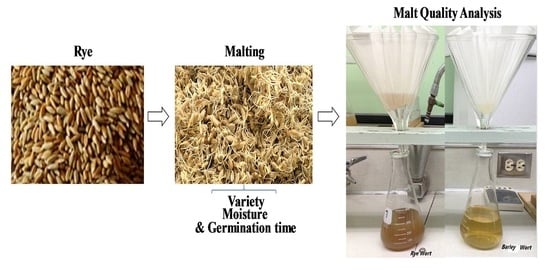
:Malting of rye and the use of rye malts presents several challenges to maltsters and brewers, like the lack of a hull, dense packing in steep, and high wort viscosity. While empirical evidence shows that rye genotypes differ in malting and brewing performance and flavor, there is little published information on the malting of rye or the malt quality attributes of rye genotypes. The objective was to evaluate laboratory micro-malting conditions that could be used in quality screening. Parameters included germination time, moisture and kernel size. Wort arabinoxylan and phenolic acid contents were determined in addition to standard malt quality parameters. In general, high extract and lower viscosity were achieved by malting for at least 4 days at 45%–48% moisture under the temperature of 16 °C. However, as some commercial maltsters indicated the difficulty of handling of germinating rye at the highest moisture levels, we recommend 5 days of germination at 45% moisture for the future evaluation of rye cultivars.
1. Introduction
Although the use of rye in alcoholic beverages has several thousand years of history, the past decade has seen a renewed interest in the application of rye grain and malt in brewing and distilling. Use of rye from the iron age through medieval times was common, as individuals depended upon locally available grains [1]. Traditional fermented beverages using rye include, kvass and sahti [2]. Bavarian Roggenbier, which can trace its history to late medieval times, is perhaps, the best known of traditional examples. Recent interest in rye has largely come from the rapidly growing craft brewing, malting and distilling segments. As an example, Stambor (2010) [3] reported that just as almost every brewery produces one wheat beer, one pale ale and one stout, now, there’s seemingly a rye beer on every beer maker’s menu. This interest, at least in part, is from the grain’s dry, spicy and astringent characteristics. The beer style guidelines of the Brewers Association states that rye beers are often versions of classic styles that contain noticeable rye character in balance with other qualities of the beer…, and the grist should include sufficient rye such that rye character is evident in the beer [4]. The guidelines further state, competition directors may create specific styles of rye beer, such as rye pale ale or rye brown ale. In terms of distilled beverages, rye was historically the signature whiskey of the USA, having been produced by the first president of the USA, George Washington [5]. However, it had all but disappeared until being recently revived by craft distillers. American rye whiskeys are defined by being prepared from at least 51% rye grain, and rye malt whiskeys being produced from a fermented mash of not less than 51% rye malt [6].
In botanical terms, Rye (Secale cereale), like barley (Hordeum vulgare) and wheat (Triticum sp.) is a member of the grass family Poaceae and the tribe Triticeae. While grown for grain, it is also widely produced as a cover (green-manure) or forage crop. There are both fall-sown (winter) and spring-sown rye genotypes, but winter-types are much more common in commercial production, and have better grain quality [7]. Winter ryes are generally more winter hardy than either winter wheat or winter barley, and as such, are often grown in the northernmost regions for winter cereal production. Leading producers include, Germany, the Russian Federation and Poland. The 2013 grain production in these countries was 4.69, 3.36 and 3.36 million metric tons, respectively, compared to 222,900 and 193,170 tons in Canada and the USA [8]. Considerably more rye was once grown in the USA, with excess of 2.8 million hectares seeded during some years of the 1930’s [9]. A sustained and steady decline in acreage began around 1970 and continued through 2010. The USDA National Agricultural Statistics Service reported 728,000 hectares seeded in 2015 [10]. Almost 40% of recent USA rye acreage was in Georgia and Oklahoma, where it is largely utilized as winter forage. Less than 25% of seeded materials have been harvested for grain. Major US producers of rye for grain include South Dakota, North Dakota, Nebraska, and Minnesota [11]. Renewed interest in several states is evident from recently published variety trials [10,12,13]. While these reports may reflect growing interest in the artisanal uses of rye, health benefits, and environmental or sustainability concerns, they also likely reflect the tremendous yield potential of hybrid rye varieties that have recently become available.
Rye grain is used as a feed, and in baking, distilling and brewing [14]. Its use in baking has been most widely studied, and while malted rye can be purchased from many suppliers, there is limited information on the malting of rye and the malting performance of rye genotypes. Briggs, in his 1998 text Malts and Malting, states that because of the lack of husk, malting rye has all the problems (risk of tight packing and crushing, and ease of damage) and all the advantages (rapid water uptake and high potential extract values) of wheat [15]. Likewise, Taylor et al. [16] cautioned that it is important to avoid over-steeping rye, and to avoid bed compaction in germination and kilning. Despite the rapid uptake of moisture, rye has been reported as slow to modify in germination [15]. Additional problems can relate to poor homogeneity of the grain, which, in part, is likely due to the crop’s propensity for cross-pollination. Pomeranz et al. [17] evaluated the malting and brewing performance of eight rye cultivars grown in Nebraska and North Dakota in 1969 and 1970. Significant varietal effects were observed on kernel weight, malt extract, and alpha-amylase. Overall rye malts were reported have higher levels of extract and alpha-amylase activity when compared to the control barley malts. Worts from rye were significantly darker. Work by Narziss in the 1960’s [15] also cited significant differences in the malting quality of rye cultivars. Hübner et al. [18] utilized surface response methodology to determine the optimal malting conditions for rye in terms of viscosity, arabinoxylans, and several other parameters. Variables included germination and steep temperatures, steep moisture and germination time. The high wort viscosity often associated with rye is caused by water extractable arabinoxylans. They found that a germination time of 6 days at 10 °C resulted in the lowest wort viscosity, and acceptable free amino nitrogen (FAN levels) and malt extract. Amylolytic and proteolytic enzyme activities increased with germination time.
The primary objective of this research was to evaluate micro-malting conditions for the evaluation of rye genotypes. Moisture content and germination time were the main variables. Steep temperature was not assessed as craft maltsters typically have limited control over this variable. The impact of kernel size on quality was also evaluated, as this variable can show significant variation in commercially produced grain samples.
2. Materials and Experiment
2.1. Rye Samples
Upon initiation of the rye malt research project, numerous winter rye samples (N = 48) were obtained from several university research trials and several commercial or farm sources. These included forage types, as well as conventional and hybrid grain types. All samples were screened for basic grain quality (Table 1). While several samples had acceptable quality, only two were available in amounts required for this research. These were an experimental line, DR02 (since released as ND Dylan) grown in 2014 at the NDSU Carrington Research Extension Center (Carrington, ND, USA), and an unknown variety which was produced in Iowa in 2014 (Emden Grain Company, Emden, ND, USA). These will subsequently be referred to as samples A and B.
2.2. Rye Grain Quality Tests
Analysis of rye 1000-thousand kernel weight and assortment were determined according to the official methods of the American Society of Brewing Chemists (Barley 2. Physical tests) [19]. Plump kernels were reported as the total grain weight (%) retained on the sieves of 2.4 mm plus 2.8 mm. Kernels remaining on the 2.0 mm sieve were considered as medium, and thin kernels were those passing through the 2.0 mm. Grain moisture was determined with a Brabender Moisture Tester (C. W Brabender Corp. Rochelle Park, NJ, USA) by heating a ground sample for 1 h at 130 °C. Protein content was determined with a FOSS 1241 NIR (FOSS in North America, Eden Prairie, MN, USA) using the calibration supplied with the instrument. Germination rate of rye grains was tested by setting 100 kernels in a petri dish with 2 layers of filter paper and 4 mL of water for 3 days.
2.3. Micro-Malting
The steeping time for each rye sample to reach 40%, 45%, and 48% moisture was determined by pilot-steeping a 10 g (dry basis) sample according to the procedures of Banasik et al. [20]. Micro-malting of 80 g (dry basis) samples was carried out as previously described [21]. After steeping, the samples were removed from the steep tank, spread over paper towels to eliminate surface water. Samples were then adjusted to the desired weight (for 40%, 45%, and 48% moisture levels) using distilled water. While this may not reflect commercial practice, it is intended to provide all samples with a consistent environment. Samples were germinated for either 3, 4, 5, or 6 days at 16 °C, and approximately 95% relative humidity. Sample weight was adjusted each day by adding distilled water, and samples were hand turned to preventing matting. After the completion of germination, all samples were moved into kiln containers. Kilning was a 24-h schedule, where the temperature was sequentially ramped from 49 °C to 85 °C. After kilning, the samples were removed from the kiln, cooled to room temperature, de-rooted, and stored at room temperature prior to analysis.
2.4. Malt Quality Tests
Malt analyses were carried out according to the ASBC Official Methods [19]. The measurement of malt moisture, extract, diastatic power (DP), alpha-amylase, wort free amino nitrogen (FAN), viscosity, Wort soluble protein, β-glucan content was based on Malt-3, Malt-4, Malt-6A, Malt-7A, Wort-12, Wort-13, Wort-17 and Wort-18, respectively. The major modification of the extract method was that rye samples were centrifuged at 3000× g prior to filtration (20 °C, 10 min). Malting loss was calculated as the difference in weight (dry basis) between the rye grain and de-rooted malt [22].
2.5. Wort Quality Tests
Wort fermentable sugars were determined according to ASBC Method, Wort-14B [19] with modifications. Ten microliters of wort were mixed with 200 mg AG 501-X8 resin and shaken for 15 min. After filtering through a 0.45 µm NLY filter (Whatman Inc., Sanford, ME, USA), the sample was analyzed by HPLC (HP 1050, Agilent, San Diego, CA, USA) with a refractive index detector (HP 1047A) in the range of 1/64 × 10−5 RIU/F.S. Glucose, fructose, maltose and maltotriose were separated on a Hi-Plex Ca (Duo) column (6.5 mm × 300 mm, 8 µm (p/n PL1F70-6850), Agilent, Santa Clara, CA, USA) at 85 °C, with 100% DI H2O as mobile phase. The flow rate was 0.4 mL/min, and the injection volume was 5 µL. Wort β-glucan content was determined according to ASBC Method, Wort-18B [19] using a Waters 515 HPLC pump (Waters Corporation, Milford, MA, USA) a Waters 717 autosampler and a Waters 474 scanning fluorescence detector. A 20 µL sample was injected into a capillary (4.37 m × 0.54 mm) mixing column. The flow rate was 3.0 mL/min, the detector was set to 365 nm excitation and 420 nm emission wavelengths.
The arabinoxylan content of wort was determined by the modified method of Carpita and Shea [23]. A 100 µL aliquot of each rye wort sample was hydrolyzed with 2.5 mol/L trifluoroacetic acid (200 µL) by heating at 121 °C for 1 h, with an added internal standard of inositol (10 mg/mL). The hydrolysates were dried at 55 °C under nitrogen. The hydrolyzed sample was reduced by ammonium hydroxide (1 mol/L, 100 µL) and sodium borohydride in DMSO (20 mg/mL, 500 µL), and neutralized by glacial acetic acid after heating at 40 °C for 90 min. Then, 100 µL of 1-methylimidazol and 500 µL of acetic anhydride were added into each tube for acetylation and the reaction was stopped after 10 min with 4 mL of water. The acetylates were extracted with 1 mL of methylene chloride two times, the combined methylene chloride fractions were dried at 45 °C under nitrogen [24], and finally re-dissolved in 1 mL of acetone for GC analysis.
The derivatized arabinose and xylose were analyzed with an Agilent 7890 gas chromatograph (GC) with flame ionization detector (Agilent technologies, Santa Clara, CA, USA). Separation was performed on a Supelco SP-2380 fused silica capillary column (30 m × 0.25 mm × 2 µm) (Supelco Bellefonte, PA, USA) with an injection volume of 5 µL. The system parameters were as follows: flow rate, 0.8 mL/min; flow pressure, 82,737 Pa; oven temperature, 100 °C; detector temperature, 250 °C; and injector temperature, 230 °C. The carrier gas was helium. A standard curve was prepared that contained monosaccharide standards in the concentrations of 0, 250, 500, 750 and 1000 ng/µL and inositol was added at 750 ng/µL as an internal standard. Arabinoxylan content in acetone was calculated as 0.88 × (Arabinose + Xylose). These results were multiplied by 10 to get yield the concentration of arabinoxylan in wort (mg/L). A/X was the ratio of total contents of arabinose and xylose [25].
The phenolic acid content of wort was determined according to a modification of method reported by McMurrough et al. [26]. After adjusting pH to 2.0–2.5, 5 mL of the wort was extracted three times with ethyl ether/ethyl acetate (5/5, v/v). The extracts were combined and dried under nitrogen gas at 40 °C. Acetonitile (0.5 mL) was added to dissolve the phenolics and extracts were then filtered through a 0.2 μm Nylon membrane (Pall Life Sciences, Ann Arbor, MI, USA) into an amber vial. These concentrated samples were then analyzed on an Agilient 1290 series liquid chromatography with a 6540 UHD Accurate-Mass Quadrupole Time-of-Flight (Q-TOF) LC/MS (Agilent Technologies, Santa Clara, CA, USA).
Separation was performed on a ZORBAX SB-C18 column (1.8 µm, 2.1 mm × 50 mm, Agilent) at 30 °C. The mobile phase consisted of water containing 0.1% formic acid (solvent A) and acetonitrile containing 0.1% formic acid (solvent B). Gradient conditions were as follows: 0–1 min isocratic with 3% B; then a linear increase from 3 to 97% B for 1–10 min; followed by an isocratic washout step for 5 min and shifting back to initial setting for 2 min. Flow rate was 0.4 mL/min, and injection volume was 2.0 µL.
The selecting reference wavelengths in DAD were 260.0 nm, 275.0 nm, 294.0 nm and 324.0 nm with the band width of 2.0 nm, respectively. The AJS electrospray ionization interface (ESI) was used in the positive mode, and the absorbance threshold of the data storage was 200 (Rel. 0.01%). The stop time was 15 min and cycle time 0.5 s. Source parameters were set as the following: drying gas at the temperature of 300 °C with the flow rate of 10 L/min; 30 psig nebulizer gas at 300 °C and 7 L/min; and 125 V fragmentor energy. The mass range (m/z) of TOF Spectra was 100–1000, and the acquisition rate and time were 2 spectra/s and 5 ms/spectrum, respectively. The m/z of reference masses were 121.0509 and 922.0098. Ferulic acid, p-coumaric acid, vanillic acid, sinapinic acid, caffeic acid, catechin, syringic acid and gallic acid were quantitated with their hydrogen adduct of m/z 195.0654, 165.0545, 169.0494, 225.0756, 181.0494, 291.0882, 199.0600 and 171.0287, respectively. Calibration curves were prepared by spiking phenolic acids standards into the extract, and the response area was calculated by deducting that in control extract. The limit of detection (LOD) and quantification (LOQ) for Ferulic acid, p-Coumaric acid, Sinapinic acid, Caffeic acid and Catechin were 0.02 µg/mL wort and 0.1 µg/mL wort, respectively. For Vanillic acid, Syringic acid and Gallic acid, LOD and LOQ were 0.05 µg/mL wort and 0.2 µg/mL wort, respectively.
2.6. Experimental Design and Statistical Analysis
This study was designed according to a randomized complete block design (RCBD) with five factors in a factorial arrangement. The factors were 2 levels of samples, three levels of steep moisture (40%, 45% and 48%), four levels of germination days (3, 4, 5, and 6 days), and two levels of kernel size (plump and medium). Malting was replicated (n = 2). Data was analyzed by Analysis of Variance (ANOVA), performed with procedures of the Statistical Analysis System (version 9.3, SAS Institute, Cary, NC, USA), and analyzed using interactions, with mean separation by F-protected LSD (p = 0.05).
Main effects and interactions were evaluated using the general linear models (GLM) procedure. Duncan’s multiple range test was used to compare treatment means. Stepwise regression was used to evaluate how much variability could be explained by each independent variable (e.g., sample, kernel size, germination moisture, days of germination) for the dependent variable (e.g., malting loss, extract, DP, α-amylase, soluble protein, FAN, wort viscosity, AX, β-glucans, fermentable sugars, and phenolics).
3. Result and Discussion
3.1. Statistical Interpretation
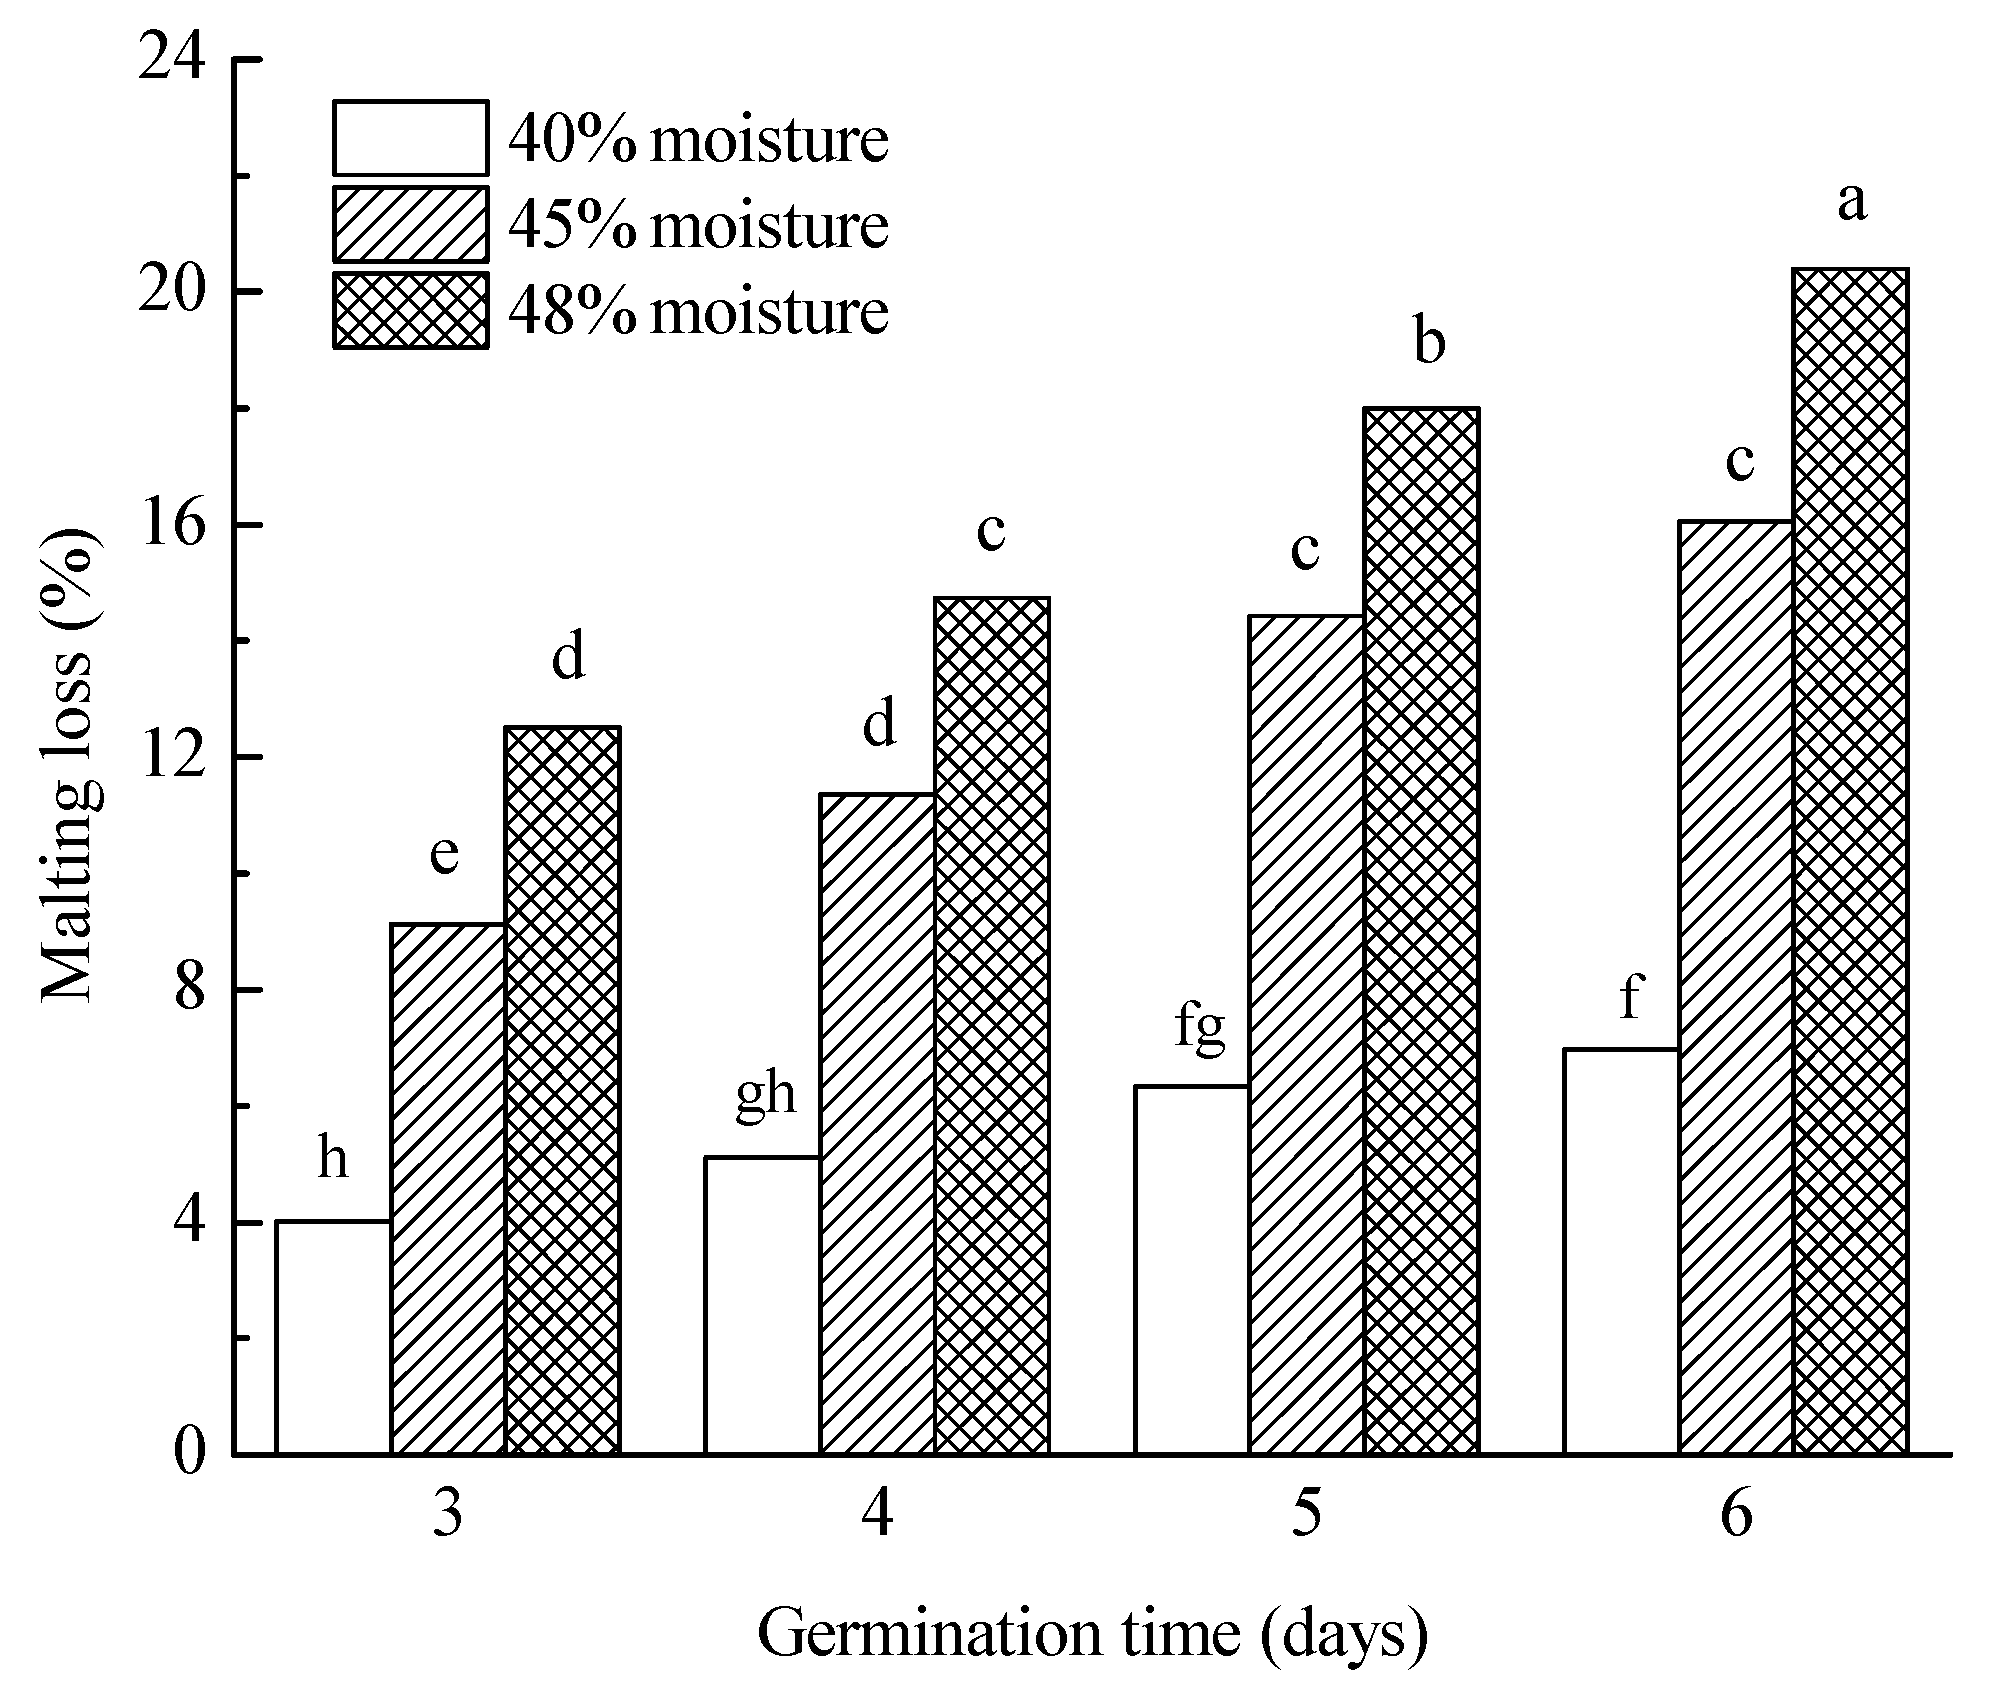
The statistical significance of the parameters was determined by ANOVA. Interactions are discussed prior to main effects, as a statistically significant interaction indicates the results for a certain analytical parameter may not have responded uniformly across a combination of factors (e.g., sample, germination, moisture level, etc.). However, while statistically significant, some interactions may not be a “true” interaction, as the rank of one factor may have remained the same across all levels of treatments. In these cases, the significance is usually caused by differences in the magnitude of responses to different treatments, which would be illustrated by the interaction of germination time × moisture on malting loss (Figure 1). Only two-way interactions are considered in the current study. The 3- or 4-way were not analyzed.
3.2. Rye Grain Quality
The 48 rye samples (32 cultivars) obtained for this study exhibited a wide range in quality. As not all cultivars were grown at all locations, statistical comparison is not possible. However, when categorized by type (Table 1), it can be seen that the forage types generally had the thinnest grain and highest protein content, and as such, are not ideal for malting. The hybrid rye samples exhibited the plumpest grain and lowest protein, while there was more variation in the conventional grain types. As previously stated, two conventional grain types (sample A and B) were selected for the subsequent malting study based upon quality and the amount of grain available. The germination rates ranged from 75% to 100%, but samples A and B had uniform germination rates of 98%–100%. All grain (thin), passing through 2.0 mm sieve, was removed prior to malting. The plump fraction was materials retained on or above a 2.4 mm sieve, while the medium fraction was material passing the 2.4 mm sieve, but retained on the 2.0 mm.
3.3. Rye Malt Quality Evaluation
3.3.1. Malting Loss
Malting loss can be attributed to loss of soluble substances in the steeping, respiration during germination, and the removal of rootlets from malt. Maltsters desire good modification but lower malting loss as an economic consideration [22]. For single factors, malting loss was significantly affected (p < 0.05) by sample, germination moisture and time, but not grain size Table 2). The mean malting loss of all samples significantly increased from 5.6 to 16.4% when the germination moisture was increased from 40% to 48%, and from 8.5% to 14.5% when germination time was extended from 3 to 6 days. Sample had a relatively small impact, with only a 0.7% difference in malting loss between samples B and A. The two-way interaction of germination time × germination moisture was also significant. This, however, was due to differences in magnitude between moisture levels across germination times (Figure 1). This is of practical malting significance, as it indicates malting loss increases with germination time, and becomes more pronounced at a higher germination moisture levels. Overall, the malting loss seemed prone to exceed 15% with germination moisture of 45% or higher, and germination time of more than five days. The 40% moisture level was clearly too low for good modification, as malting losses were all below 8%.
3.3.2. Malt Extract
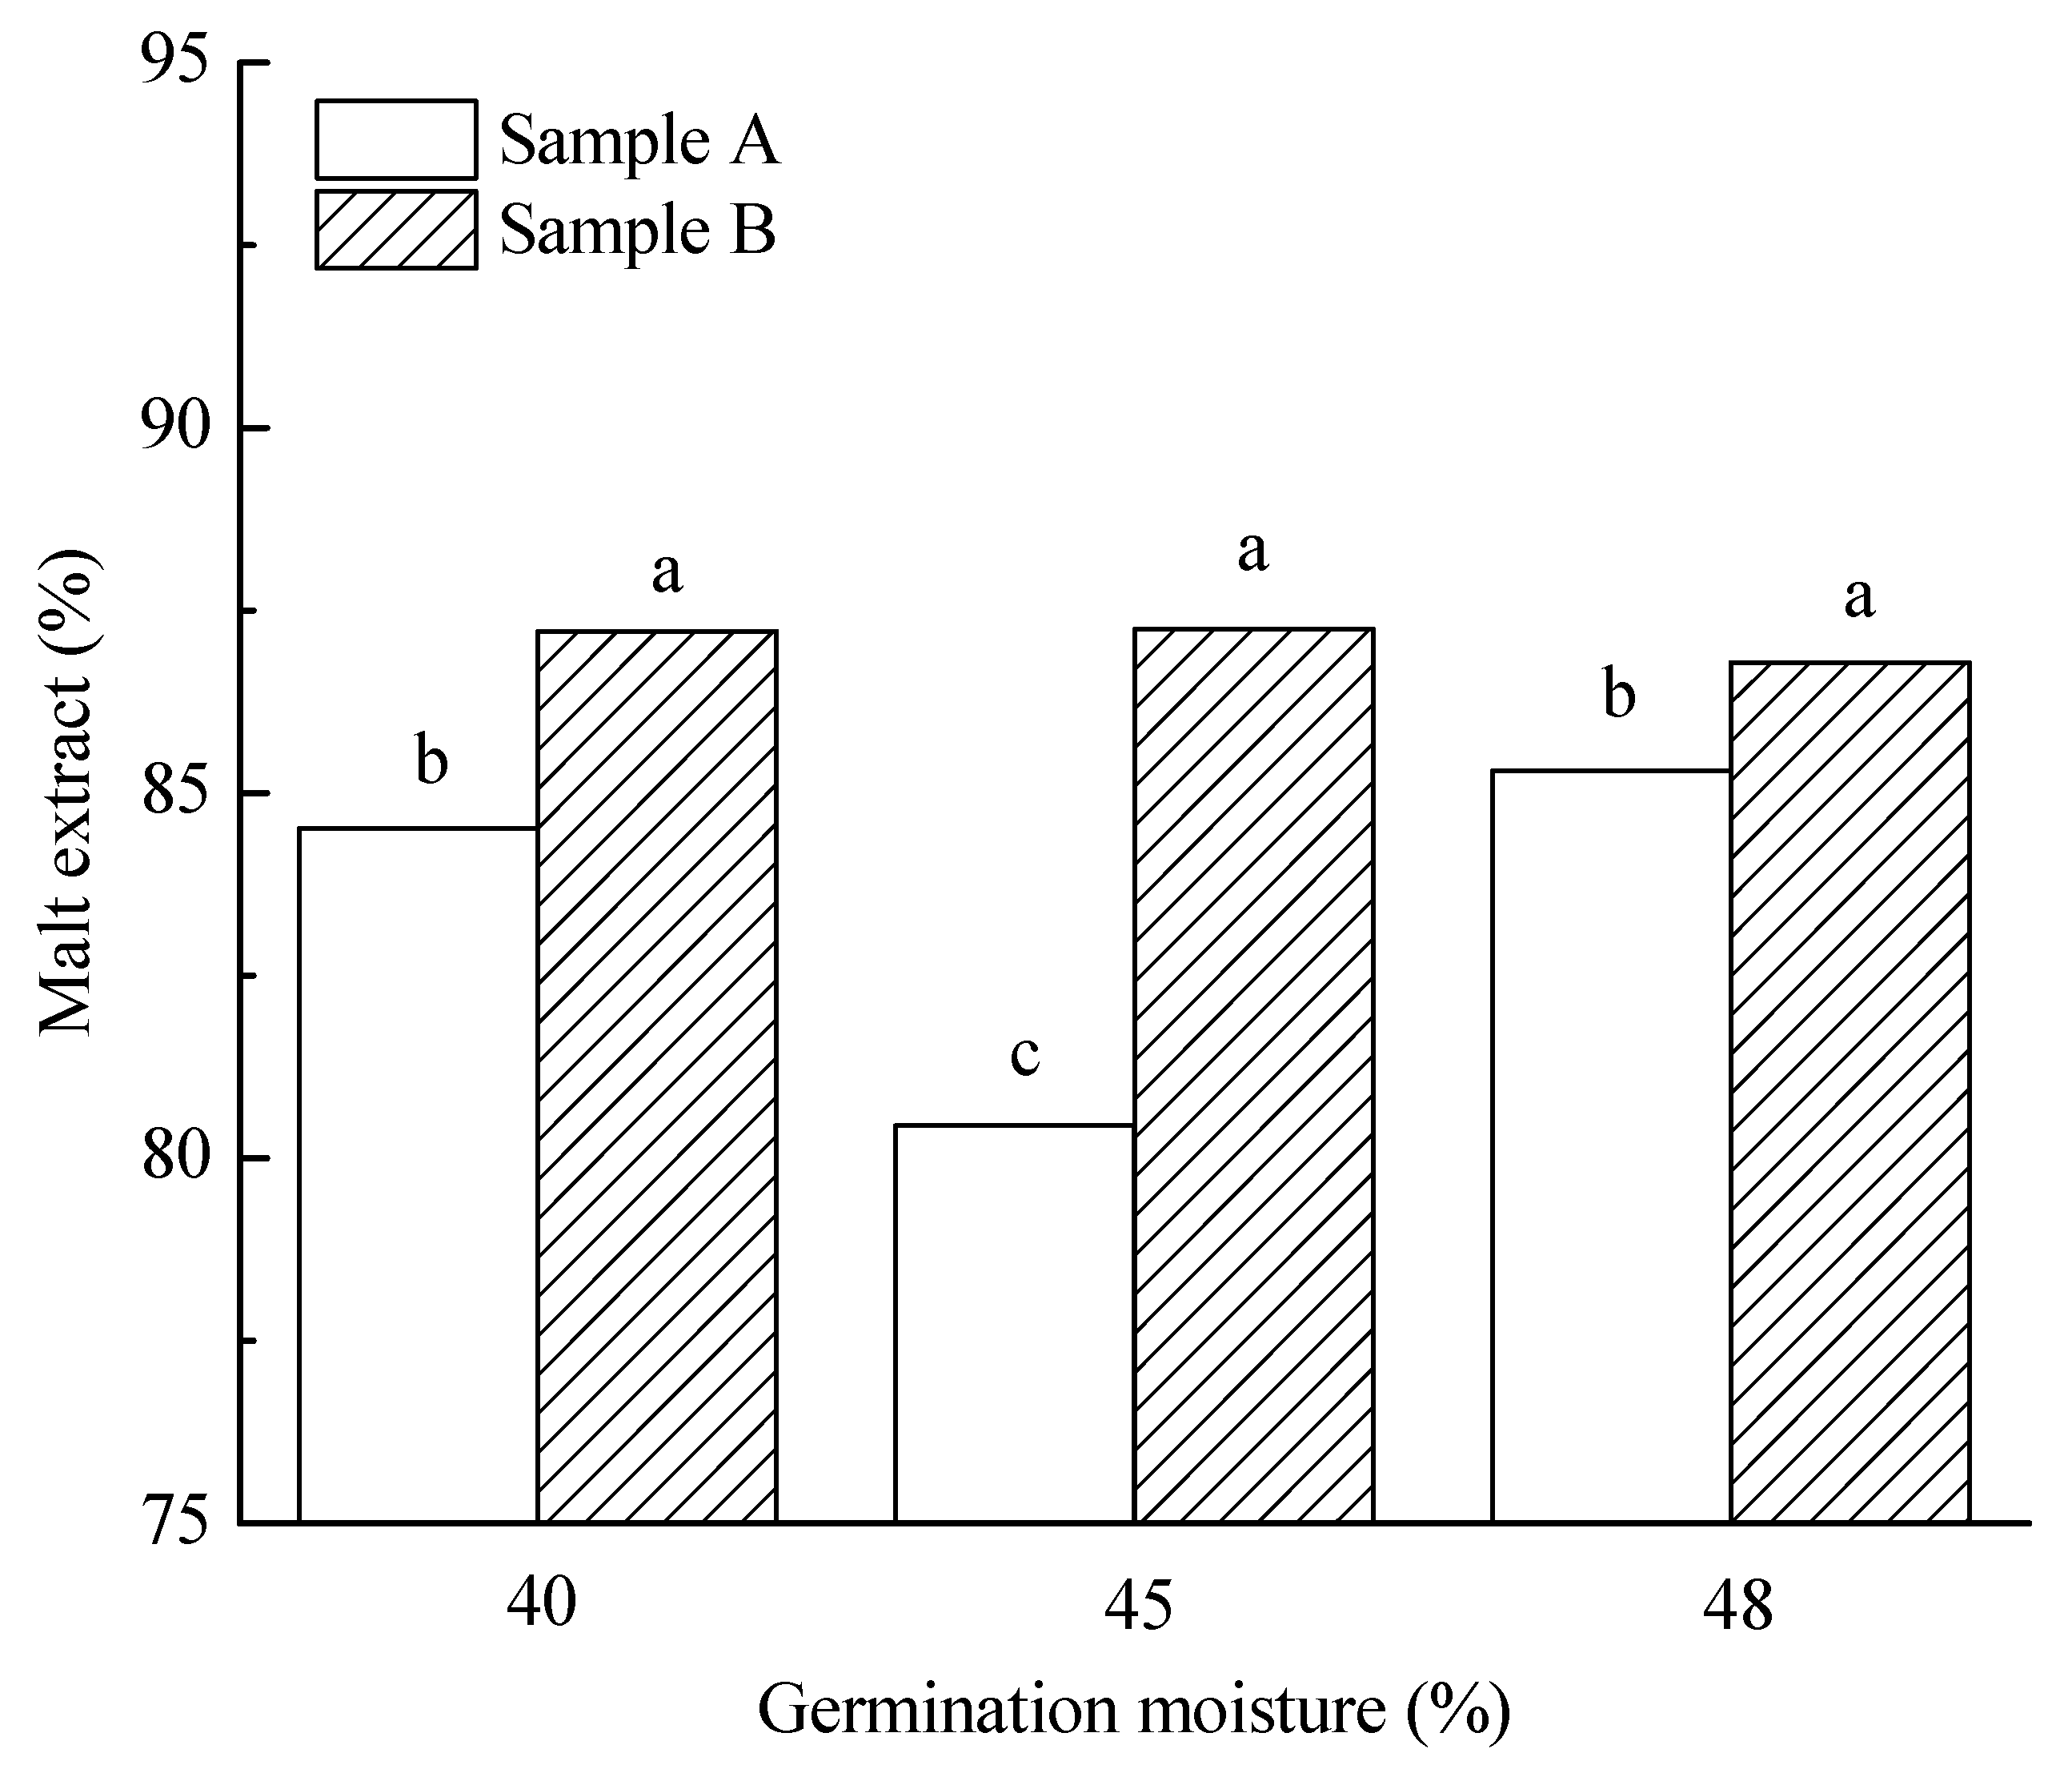
It is generally accepted that high malt extract can be achieved with good grain quality and optimized malting conditions [19]. In this study, extract exceeded 84.0% under all malting operational conditions (Table 2), which reflects the fact that unlike barley, rye grain lacks a husk. Malt extract was significantly affected by sample, with 84.0% in sample A and 87.1% in sample B (p < 0.05). However, a significant interaction between sample and germination moisture (p < 0.05) was observed (Figure 2). This was caused by the decrease in extract observed for sample B at 45% moisture (Table 2). This observation is quite unusual in terms of what is typically observed in malting, and is not readily explained. Laboratory error should not be excluded.
The mean of malt extract across all samples increased from 85.0% to 85.7% by extending germination time from 3 to 4 days (p < 0.05), but then remained largely unchanged through 6 days. Malt extract levels were not significantly different between the 40% and 45% moisture conditions, but increased significantly at 48% (p < 0.05). Grain size had significant effect on the malt extract, but the difference between plump and medium fractions was only 0.75%.
3.3.3. Malt Amylolytic Enzymes
DP and α-amylase levels are routinely analyzed as part of malt quality testing. α-amylase hydrolyzes the α-1, 4 glycosidic linkage in starch as an endo-enzyme and is largely responsible for reducing starch molecular weight and viscosity. Beta-amylase acts on the non-reducing end of starch and dextrins, produces maltose, and plays an important role in wort fermentability. Alpha-glucosidase and limit-dextrinase in grain malts also contribute to starch degradation. DP is a measure of all enzymes that hydrolyze starch, but is predominately related to β-amylase level [22] because of its high turnover number (kcat). Previous research has shown rye malt to have high levels of amylolytic activity [15,17].
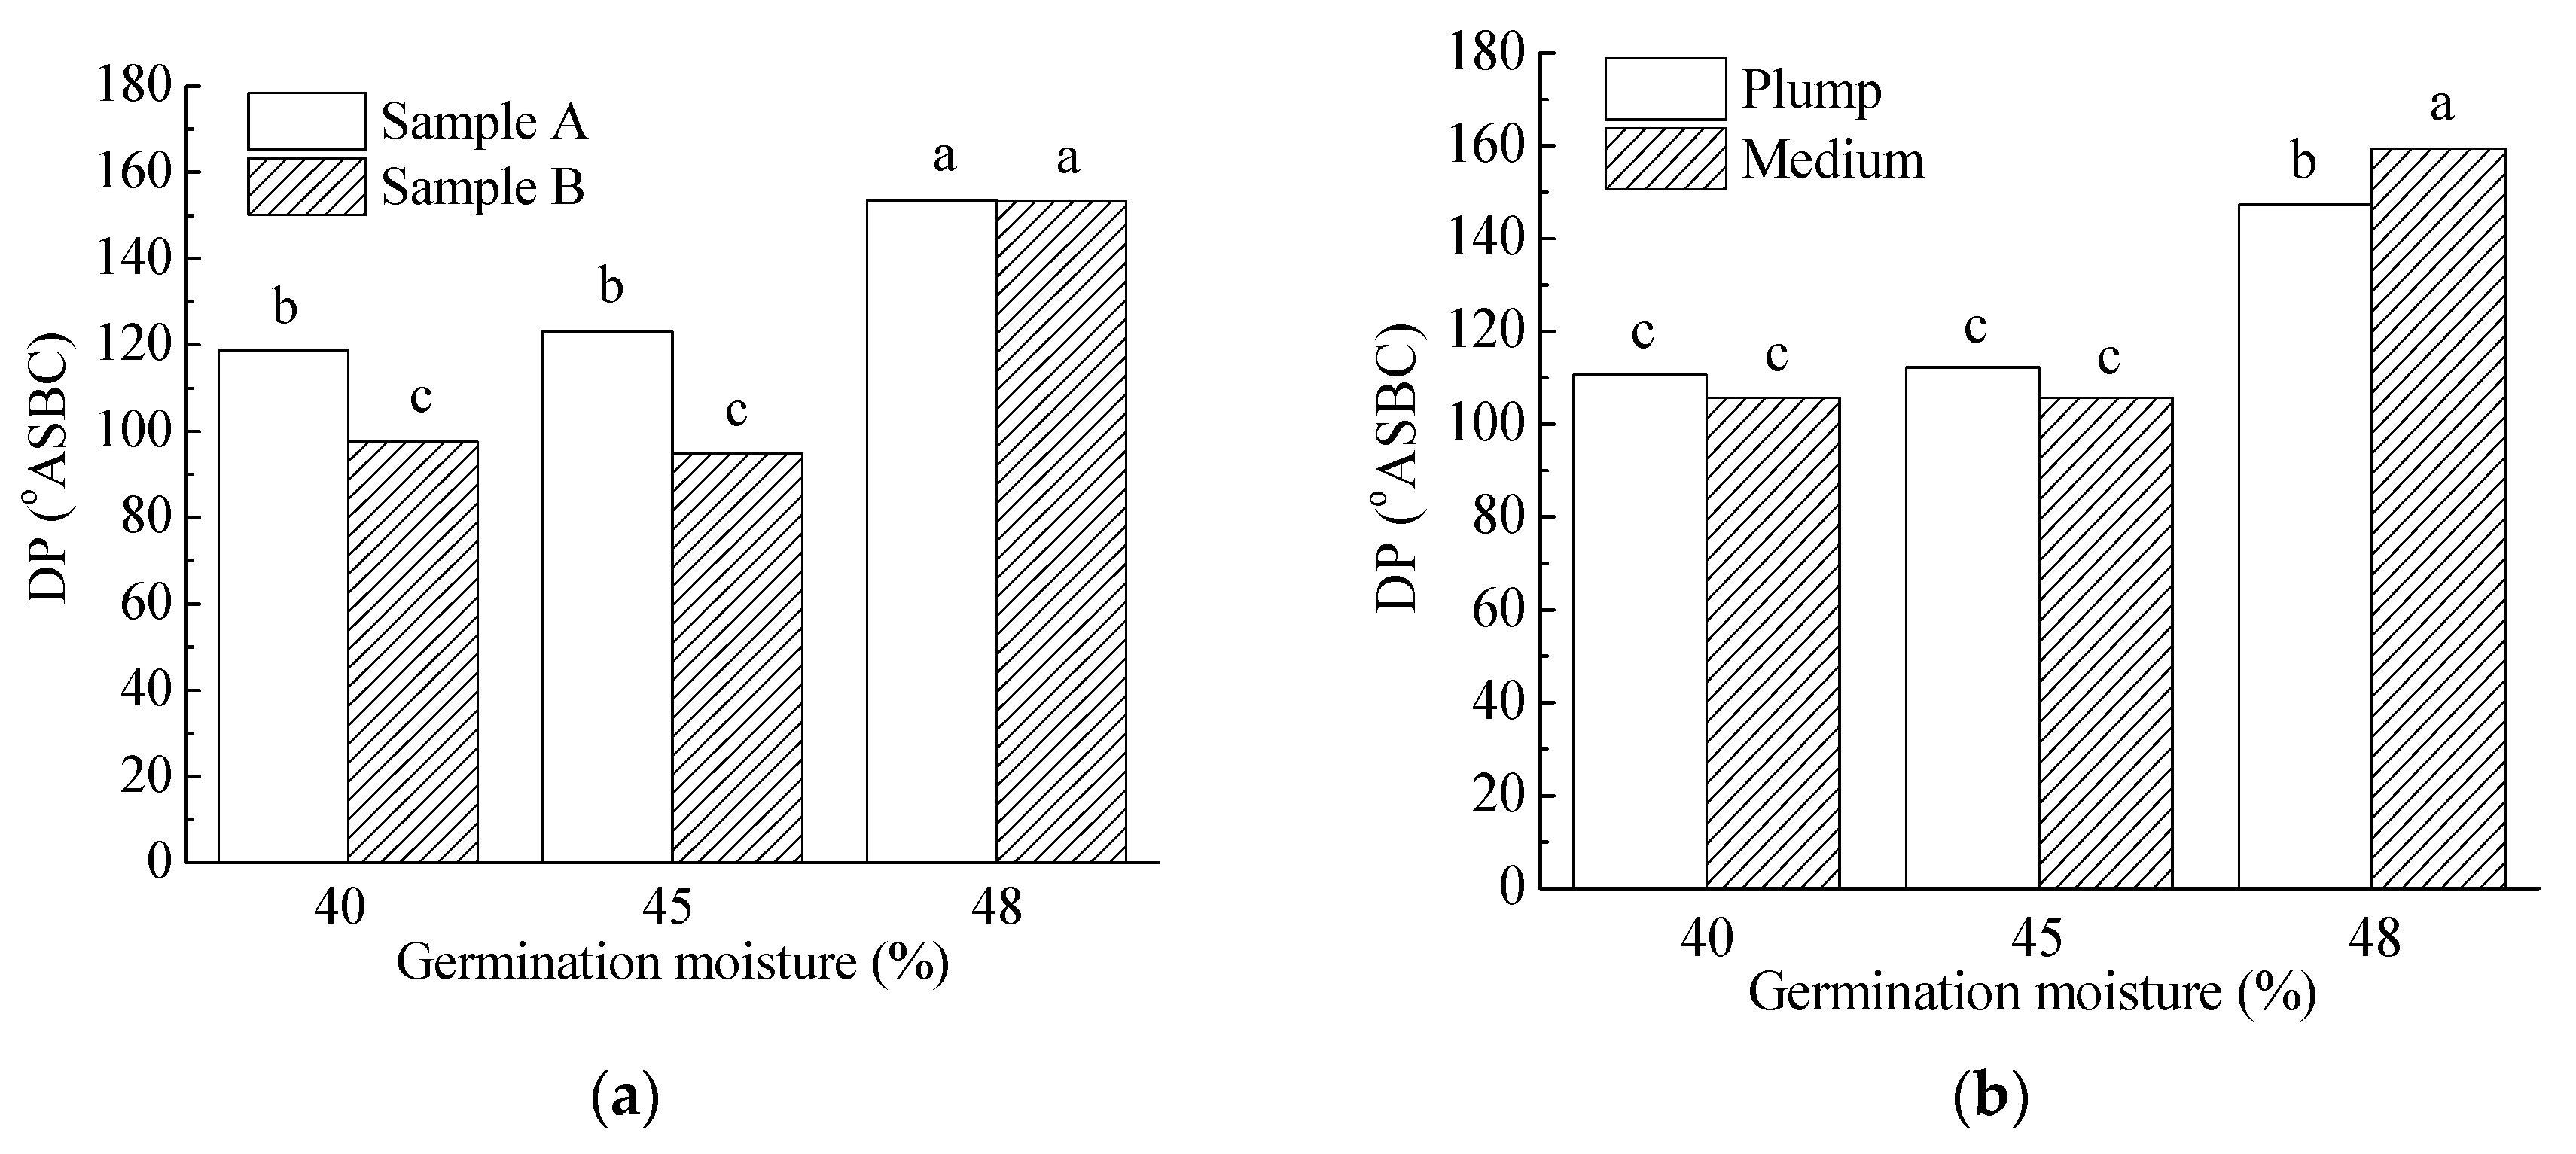
Significant (p < 0.05) interactions of sample × germination moisture and grain size × germination moisture were observed for DP (Figure 3). Sample A showed slightly higher levels of DP at 40 and 45% moisture, but there was no difference at 48%. The DP levels were not significantly different between plump and medium kernels. In terms of individual factors DP was significantly affected by sample, germination moisture, and germination time (Table 2). DP levels varied between 133 and 119 °ASBC for samples A and B. While this suggests variety has an impact, the difference in the case of these two samples was of minimal practical significance. Mean DP values did not change significantly across germination time, but increased from 109 to 153 °ASBC as germination moisture increased from 45% to 48%. It is generally accepted that there is no de novo synthesis of β-amylase during germination [15], so this increase in DP at high moisture is likely attributable the higher α-amylase activity at 48% of moisture (Table 2).
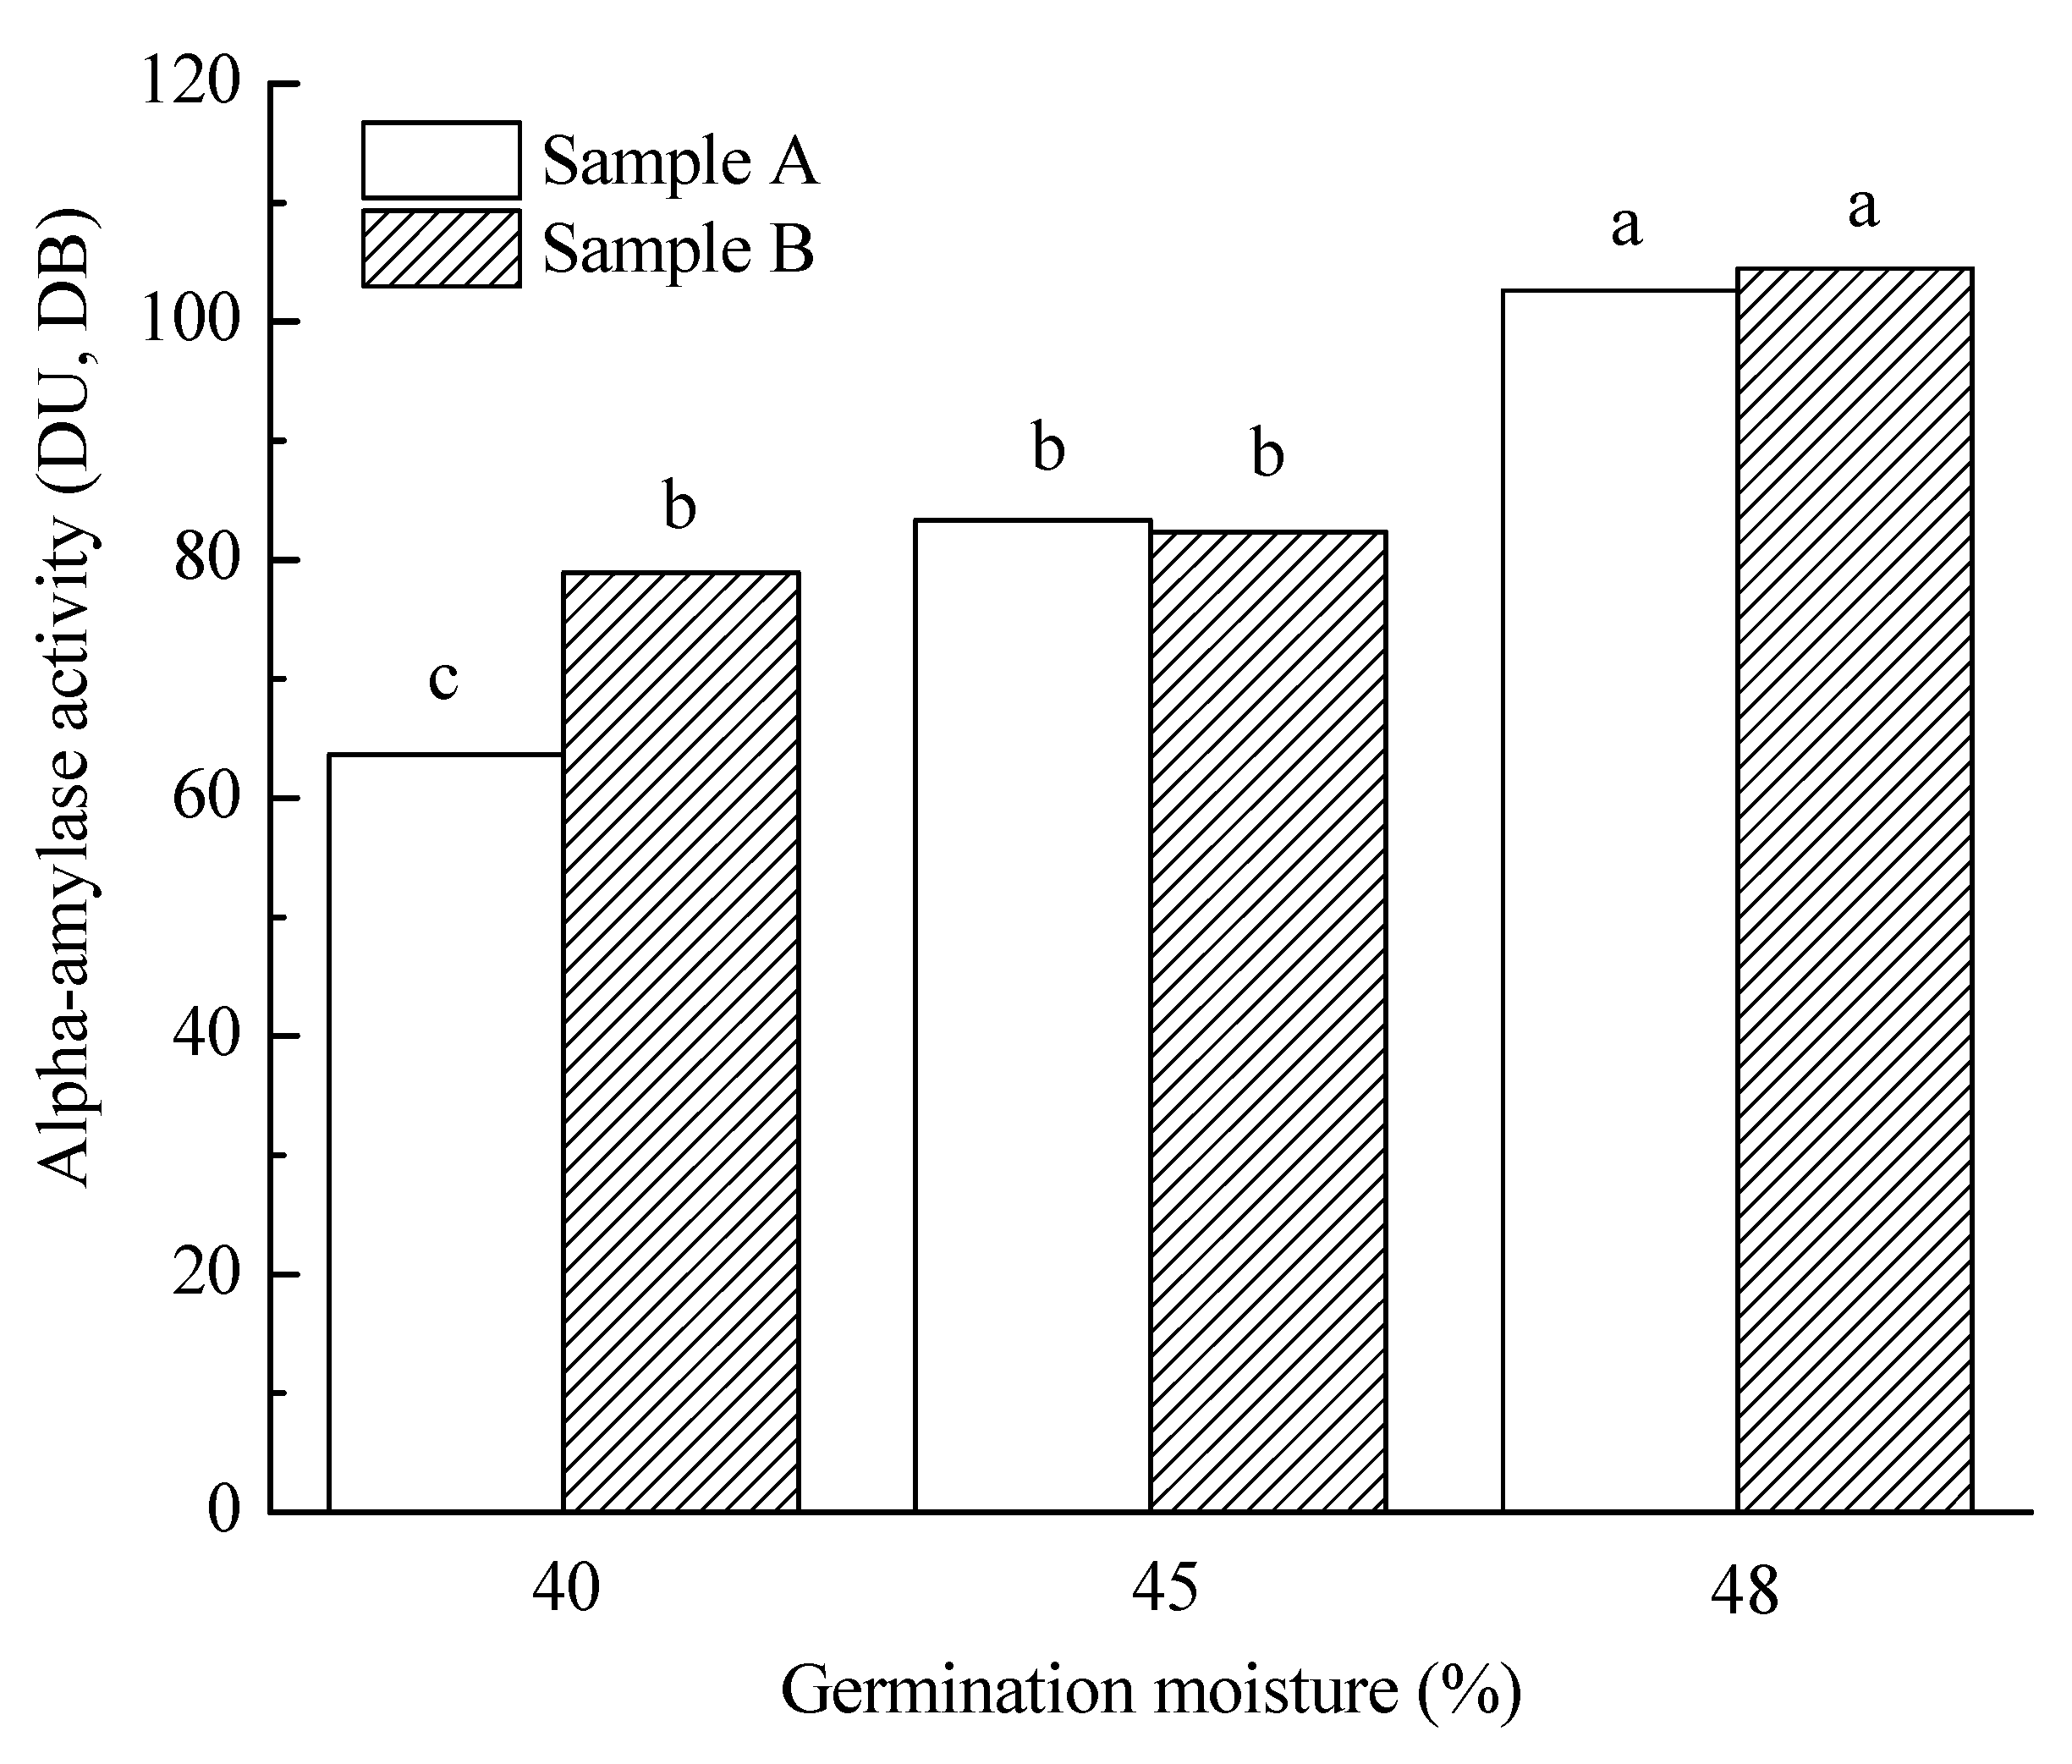
Alpha-amylase was significantly affected (p < 0.05) by all malting parameters (Table 2), and the interaction between sample × germination moisture was also significant (Figure 4). Samples showed a different response at the lowest moisture level but were similar at 45% and 48% moisture. Significant differences were observed between samples, when averaged across all treatments, but they were of minimal practical significance. The activity of malt α-amylase dramatically increased with germination time and moisture. The activity was slightly higher in the medium kernel size fraction, which was not unexpected as this is if often seen with thinner barley. Figure 4 clearly shows the different responses between samples A and B across germination moisture levels. The activity of α-amylase was much lower in sample A than sample B at the 40% moisture, but both increased to above 80 DU and 100 DU at 45% and 48% moisture. These results are not surprising as α-amylase is synthesized de novo in barley, and its activity is known to increase in germination [15].
3.3.4. Wort Fermentable Sugars
Fermentable sugar levels in the rye worts were evaluated (Table 3). As seen for barley, maltose was the dominant fermentable sugar, followed by lesser amounts of maltotriose, glucose and fructose. The interaction of sample × germination moisture was significant for all individual sugars (except of fructose), suggesting that varieties or samples may behave differently across moisture levels. The levels of each fermentable sugar and their total content were significantly affected (p < 0.05) by sample, germination time and germination moisture. Levels were higher in sample B and increased with increasing germination moisture and time. This is not surprising as the synthesis/release of amylolytic enzymes increases with time, and higher moisture levels favor diffusion of the enzymes into the endosperm. Grain size did not affect the sugars, with the exception of slightly lower maltose after five days germination.
3.3.5. Wort Soluble Protein Content, S/T and FAN
Soluble protein is expressed as a percentage of the malt on a dry basis. Some soluble protein is considered necessary for beer foam and proper yeast nutrition, but a high content is often considered problematic because of the potential for haze formation in beer and loss of fermentable extract. The ratio of soluble to total grain protein (S/T) is often referred as the Kolbach index and is considered as a measure of protein modification during malting. FAN is considered as a measure of amino acids in the wort, which are necessary to support yeast growth. Levels of 150 mg/mL in barley malt are generally considered adequate.
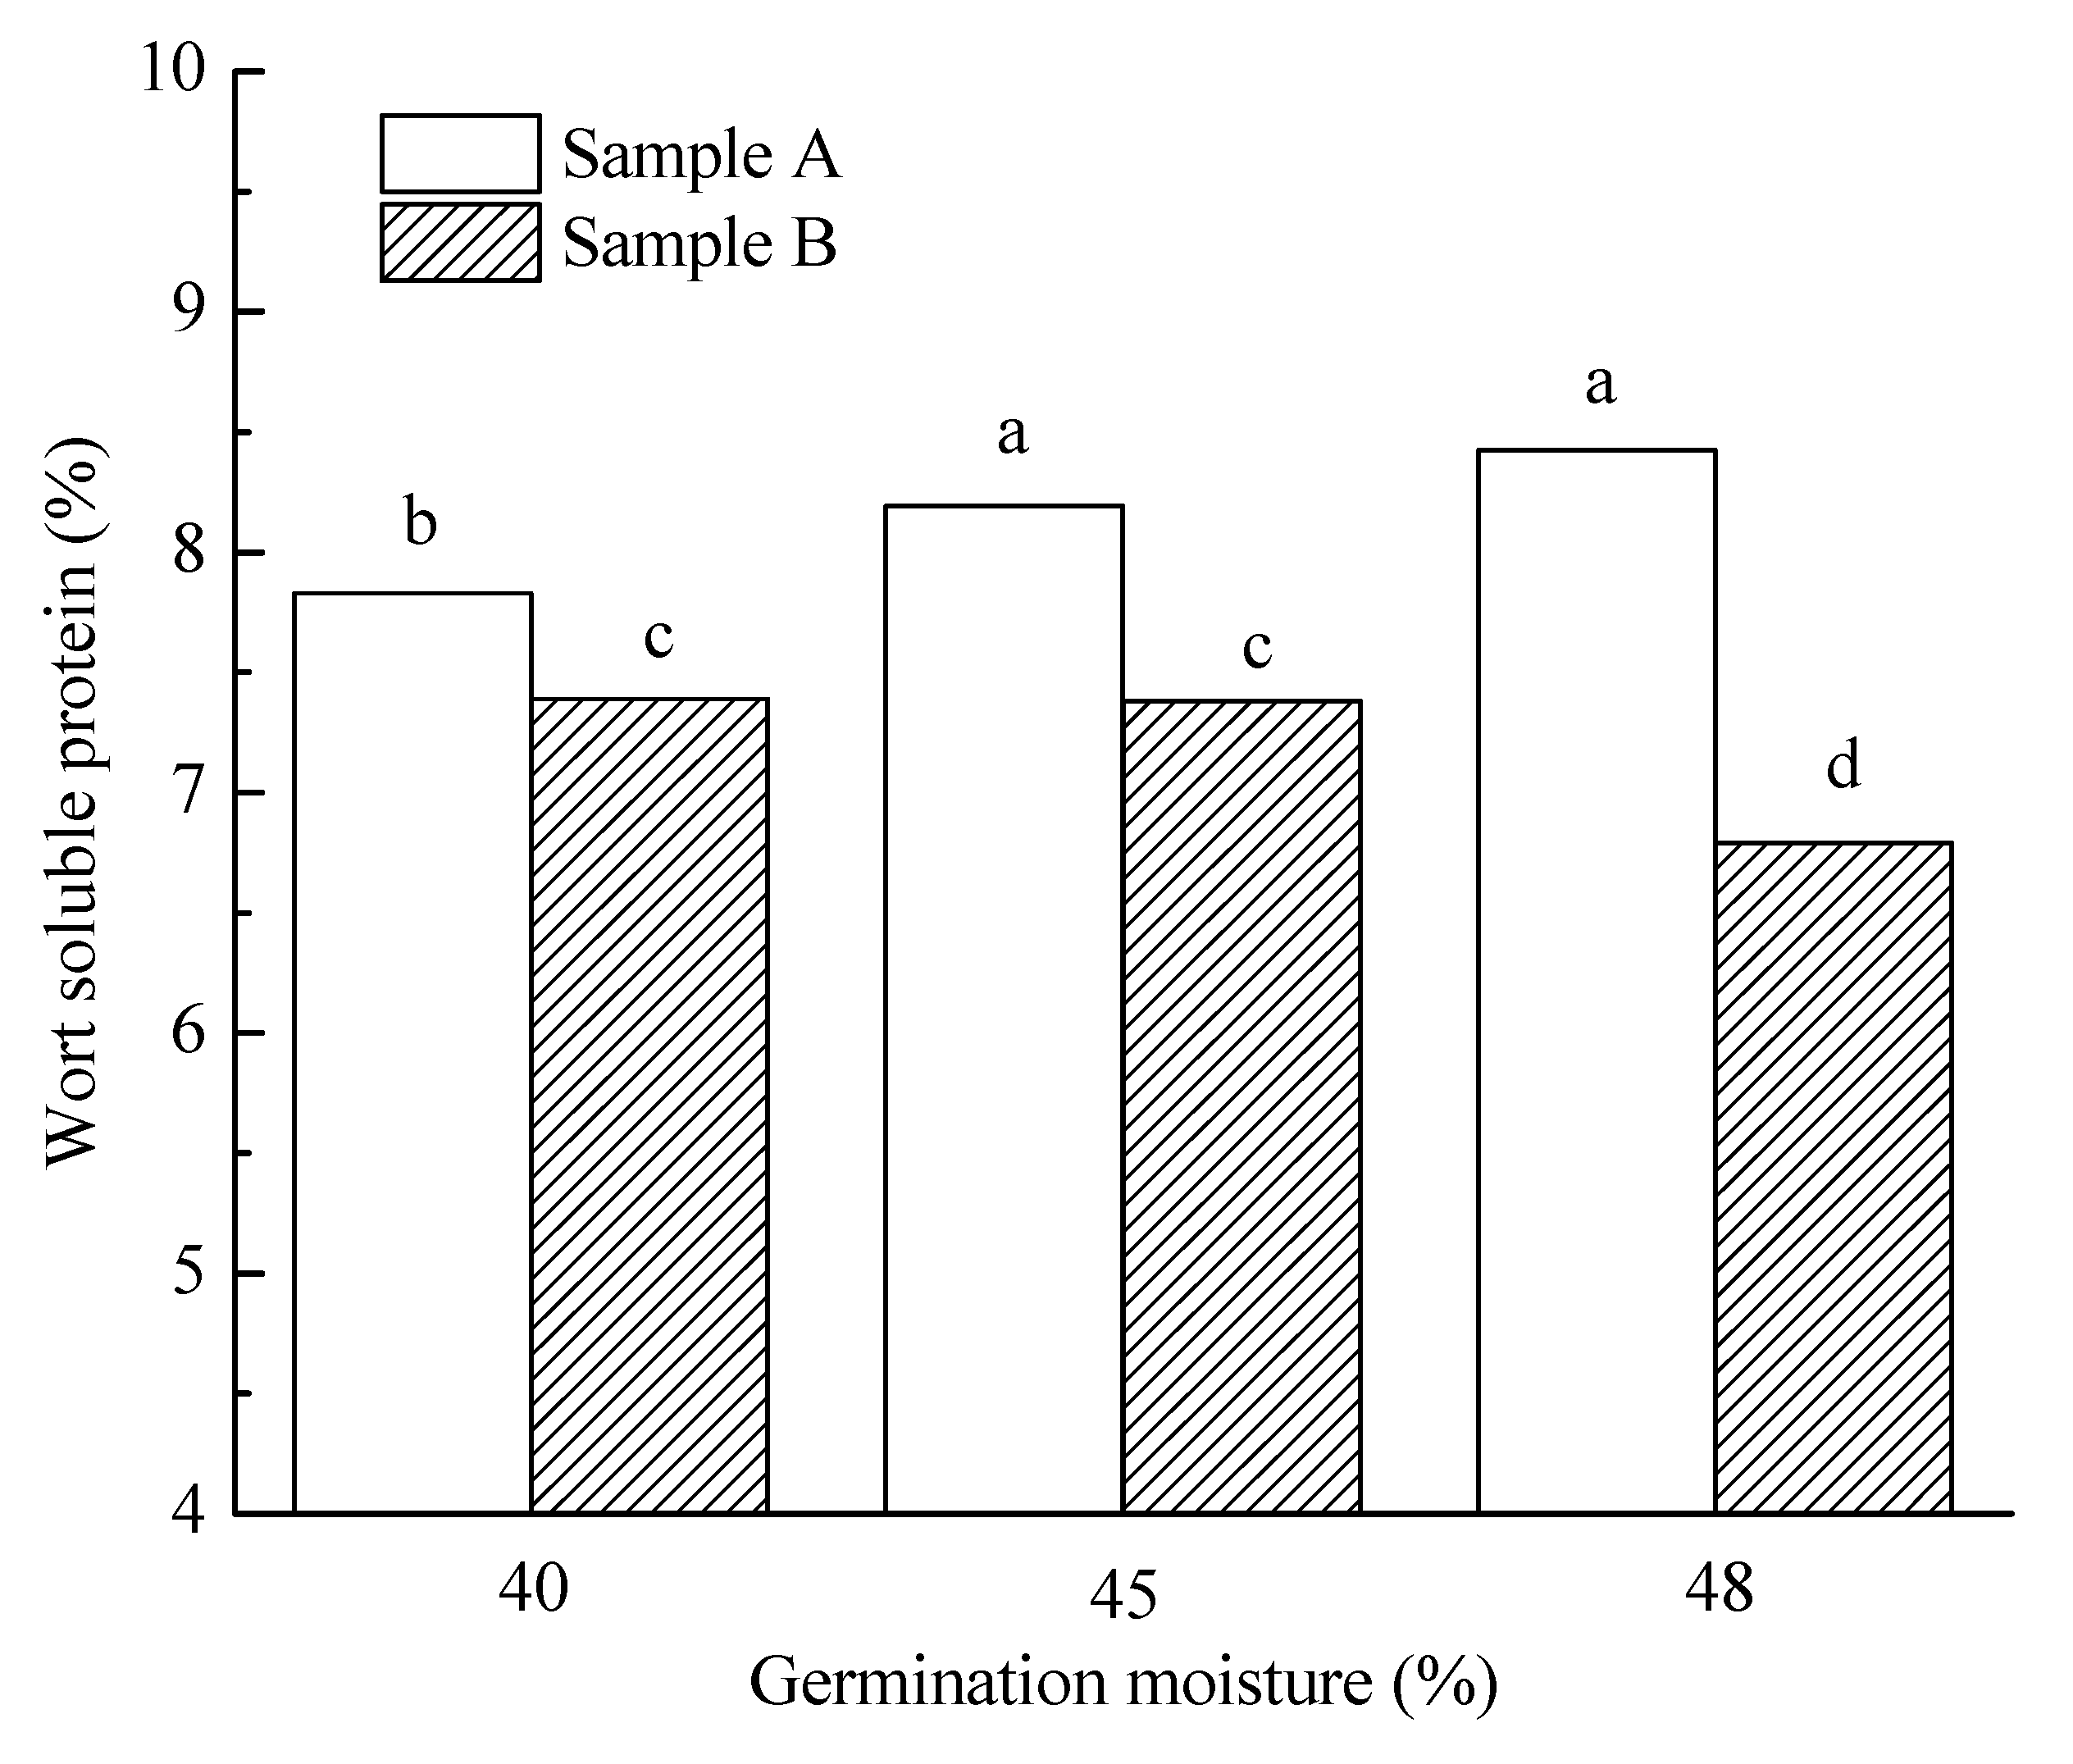
As reported by others, rye soluble protein levels were observed to be considerably higher than those of barley (15, 26, 27, 28). Soluble protein was significantly impacted (p < 0.05) by all variables evaluated, but the differences were often relatively small (Table 2). The largest differences were actually observed between samples, with 8.2% and 7.2% in samples A and B respectively. The interactions of sample × germination moisture, grain size × germination moisture and sample × germination time were all significant, which again suggests that samples may not respond uniformly across conditions. As shown in Figure 5, the soluble protein of sample A increased as germination moisture levels increased, while levels in sample B decreased slightly at higher moisture levels. In former studies on barley and rye [18,27], soluble protein was reported to increase as germination time progressed, but the germination moisture levels were not comparable with those in the current study. Results of the current study suggest that the vast majority of soluble protein in rye has already been formed after three days.
The ratio of soluble/total protein was significantly affected by all malting parameters and interactions between sample × germination moisture, grain size × germination moisture and sample × germination time. However, mean values in this experiment only varied from 62.9% to 67.2%, which represents very little variation. Further it suggests that there is little chance to reduce the content of soluble protein of rye malt by adjusting the malting parameters used in this study. The high S/T values for rye malt are directly attributable to higher levels of soluble protein and lack of a husk. The modification or solubilization of rye endosperm protein appears to be less affected by germination time or moisture.
FAN was significantly affected (p < 0.05) by grain size, germination moisture and their interactions. However, as was the case for soluble protein and S/T, the range of values observed was relatively small. Mean values of FAN ranged from 211 to 240 mg/100 mL wort, which is of minimal practical significance. Again, it seems that the bulk of FAN is formed very early in germination or may even partially exist in the raw grain.
3.3.6. Wort Viscosity, AX and β-Glucan
Wort viscosity is often used as an indicator of lautering and filtration problems in the brewery, and with barley malts is mainly attributed to high molecular weight of β-glucans [22]. Values of greater than 1.5 cP are seen as potentially problematic [15,28]. As expected, rye malt based worts had high viscosities when compared to barley based worts, and the values in the study were between 4.4 and 5.4 cP (Table 2). The high viscosity of rye worts was previously mentioned, and largely attributed to the high level of soluble AX, although rye also contains some β-glucans [15,17]. Water-extractable AX (WEAX) can be cross-linked with the possibility of causing the filtration problems [29]. Research by Schwarz and coworkers [30] showed that β-glucan and AX had equivalent effects on viscosity and filterability with barley malts. As the enzymes that degrade AX are synthesized later in the germination stage [30], significant amounts of AX can exist in the final beer [31]. The amount of AX in commercial beer is approximately 10 times more than that of β-glucan.
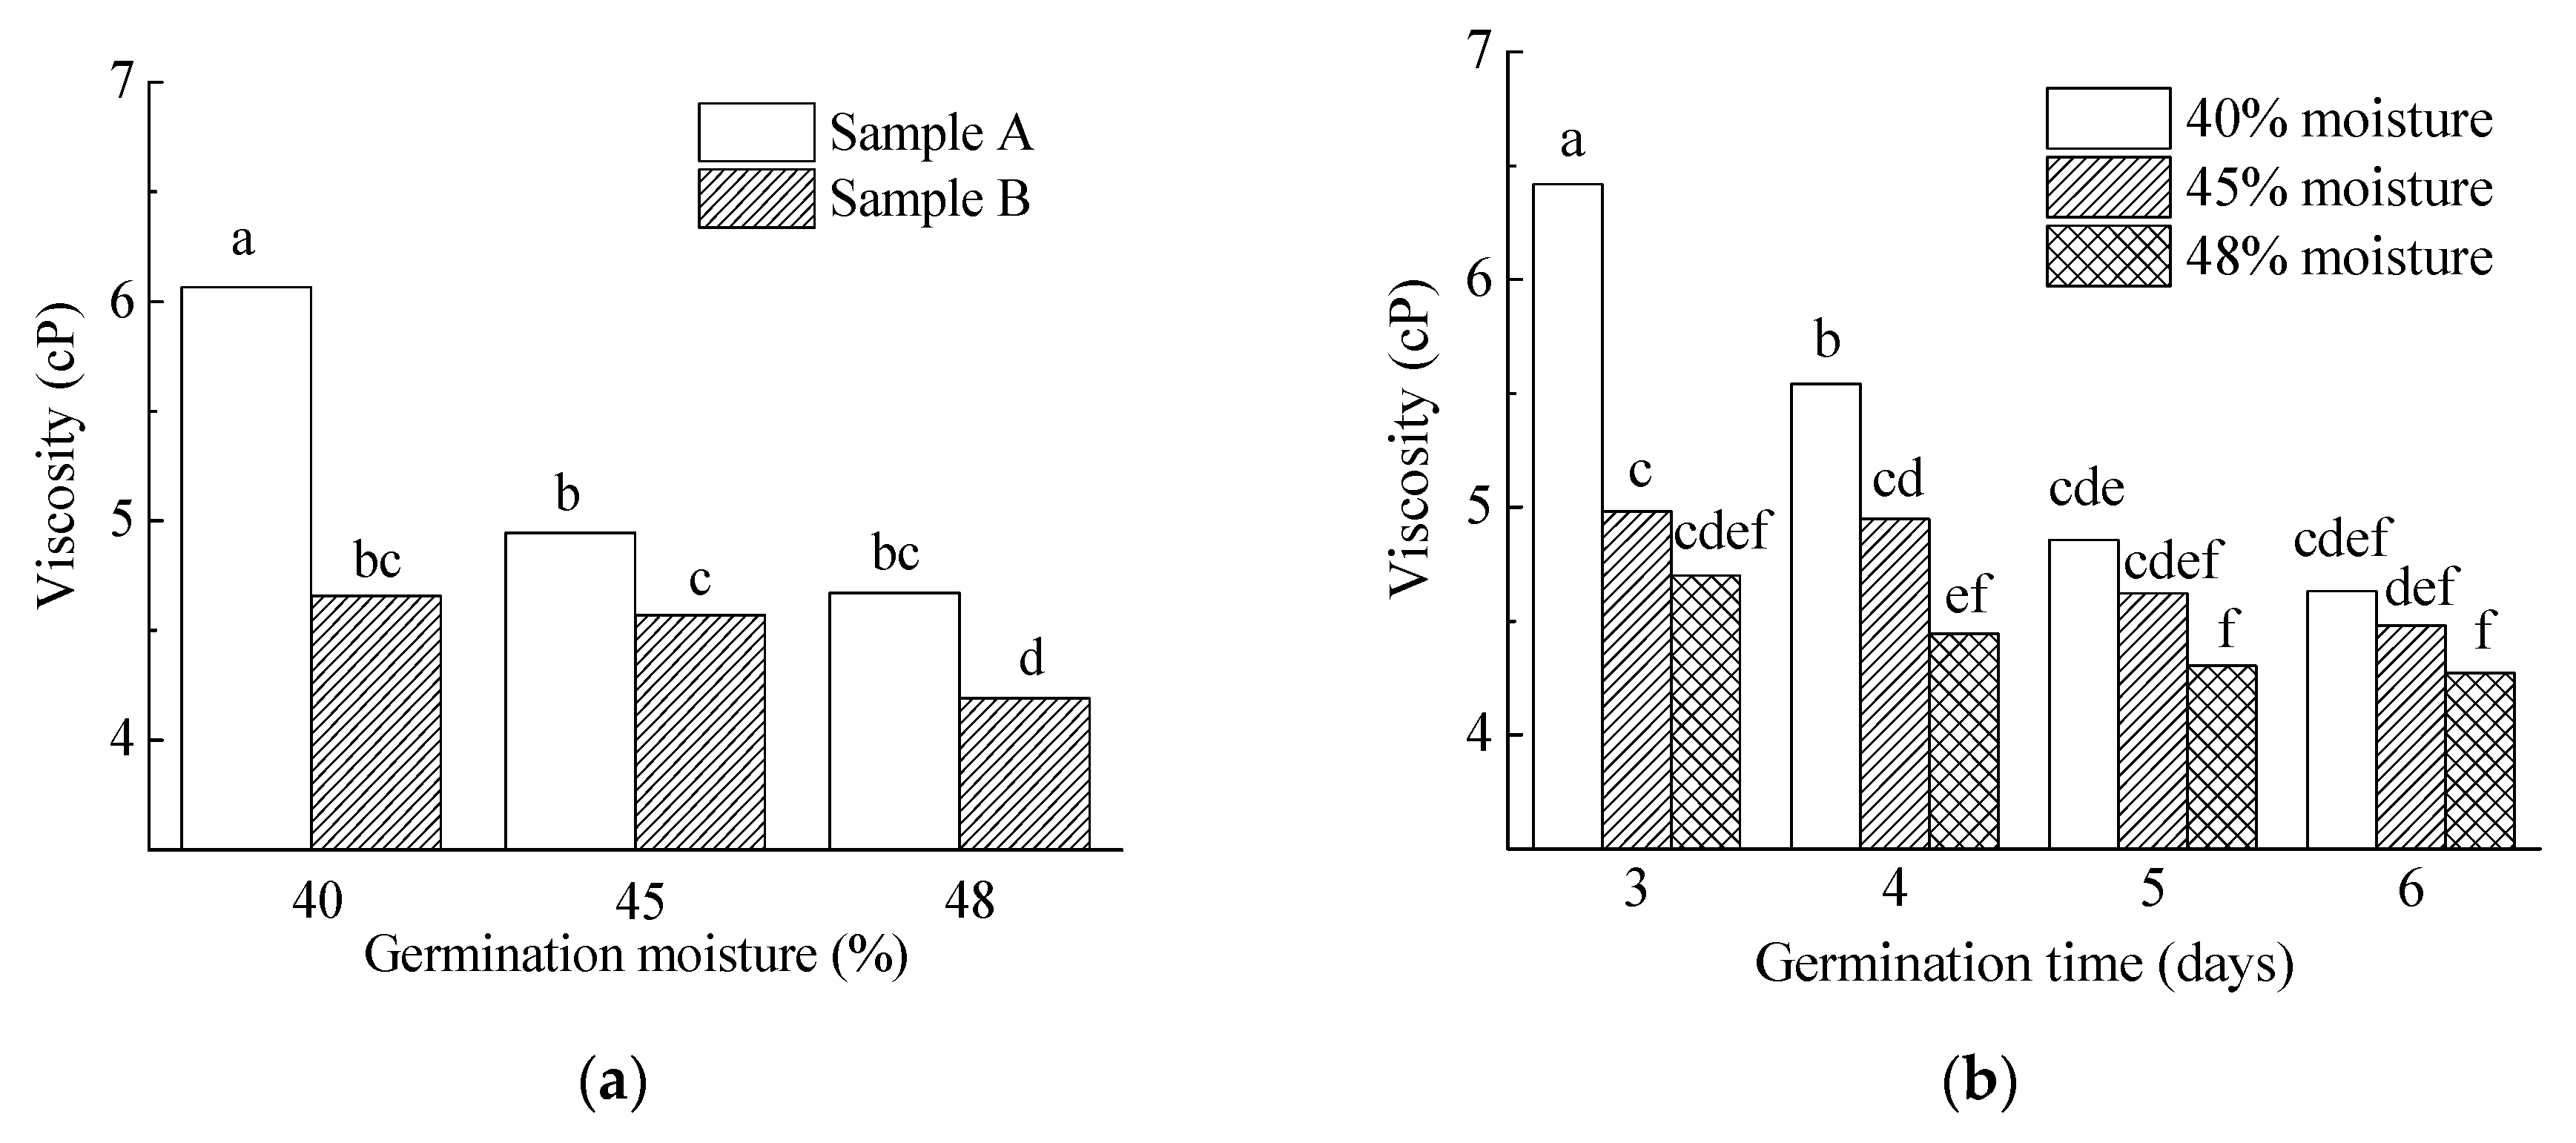
Viscosity was significantly affected (p < 0.05) by sample, germination moisture, and germination time, and interactions of sample × germination moisture and germination moisture × time. The viscosity of both samples declined as the germination moisture level increased, which indicated the possibility of using a high germination moisture level to decrease the viscosity level (Figure 6a). Figure 6b showed that the interaction of germination moisture × time was due to differences in magnitude. Viscosity was always highest at 40% moisture, but the viscosity differences between moisture became less pronounced as time progressed. Samples prepared at high moisture levels were 1.8 cP lower in viscosity at 3 days. However, the difference was only 0.4 cP at 6 days. This indicates that the benefit of higher germination moisture was maximum when the malt endosperm matrix was less modified. Changes in viscosity should be reflected in β-glucan and AX levels.
The only factor to significantly affect wort AX content was germination time. A slight decrease was observed from 3 to 4 days, but no significant differences were seen after 4 days (Table 2). The literature suggests that as the germination time progresses, enzymes that degrade AX are produced. However, a high percentage of AX survives and persists into the final beer [31,32], which contributes difficulties associated with the filtration. Regrettably, results for AX in the current study do not reflect molecular weight, as the wort samples were hydrolyzed, and total arabinose and xylose content (×0.88) used to estimate AX. Xylose and arabinose measured could have been monosaccharides, part of oligosaccharides, in addition to components of higher molecular weight AX. Changes in AX molecular weight could have occurred, but were not measured.
The levels of β-glucan in the rye worts were several fold lower than those of AX (Table 2). Nevertheless, they were comparable to what might be seen in worts from barley malt. As such they shouldn’t be ignored, and together with the AX, likely contribute rye’s notorious reputation of being difficult to lauter. Wort β-glucan content was significantly affected (p < 0.05) by sample, germination moisture, germination time and the interaction of germination moisture × time. Beta-glucan levels decreased with both increasing germination time and moisture levels, which is in line with the observations for wort viscosity (Table 2).
3.3.7. Wort Phenolic Acids
Phenolic acids in wort were measured because rye is known to be a very rich source, and the phenolic acids can play multiple roles in beer flavor, non-biological stability, color and other characteristics [33]. As an example, some brewing yeasts are known to decarboxylate ferulic acid to form 4-vinylguaicol, which is associated with the spicy clove-like flavor in some German wheat and roggenbiers [34].
In this research, ferulic (58.6%), vanillic (32.1%), and p-coumaric acids (1.8%) were the most abundant phenolic acids present in rye wort. Gallic acid (1.4%), sinapinic acid (1.0%), syringic acid (1.0%), caffeic acid (1.0%), and a small amount of catechin (0.01%) were also found (Table 4). Phenolic acid content in wort were significantly affected (p < 0.05) by all the parameters. The content of each phenolic acid in wort was higher in sample B than A, except catechin which is found at very low levels. Extension of germination time to 5 or 6 days significantly increased ferulic, vanillic, p-coumaric and caffeic acids, as well as the total phenolic acid content. Medium size grain yielded higher levels of total phenolic acids than plump, which might be related to a larger portion of bran tissues.
3.4. Relationships between Rye Malt Quality Parameters
Relationships between the rye malt and wort quality are shown in Table 5. Malting loss was strongly and positively correlated with α-amylase activity (r = 0.84), DP (r = 0.63), and FAN (r = 0.39). Malting loss was negatively correlated with wort viscosity (r = −0.56) and wort β-glucan (r = −0.87). Malting losses are known to increase with germination time and increased endosperm modification. Beta-glucan is degraded to a greater extent as germination time and enzymatic activities increase. Alpha-amylase was positively correlated with DP, extract, and FAN, and negatively correlated with wort viscosity (r = 0.77) and wort β-glucan (r = 0.83). Diastatic power was been found to be positively correlated with FAN, and negatively correlated with wort viscosity, wort β-glucan, S/T, and ratio of arabinose and xylose (A/X). As expected, extract was positively correlated with S/T, FAN, and negatively correlated with wort viscosity. It is possible because the higher extract increased the soluble protein and FAN in the wort, and decreased the rye wort viscosity. On the other hand, the wort viscosity was correlated positively with wort β-glucan content (r = 0.76), and negatively with S/T (−0.25).
4. Conclusions
In this study, grain size was found to have important influence on the quality parameters of rye malt, with the exception of the S/T ratio. Germination moisture did not influence extract level but increasing moisture levels were found to increase the malting loss and decrease viscosity. Viscosity was lowest (3.8 cP) after six days of germination at 48% moisture. However, there was no significant difference between viscosity for samples germinated for five or six days. Germination time increased extract values only up to four days. As expected, a longer germination times contributed to lower viscosity, but also greater malting loss. Significant interactions between some parameters confounded the interpretation of data, but in general high extract and lower viscosity were achieved by malting for at least 4 days at higher moisture. Based on the correlation coefficient analysis, the higher extracts were related to higher soluble protein and FAN in the wort, although viscosities were reduced. Malting loss was largest (22.2%) after six days of germination at 48% moisture. Moisture explained 75% of the variation, and germination time explained another 20% variation.
Based upon results of this study we recommend five days of germination at 45% moisture for the future evaluation of rye genotypes for malt quality. Five days will provide adequate modification and extract for most types. While viscosity can be reduced at 48% moisture, malting losses, and perhaps FAN, increase to unacceptable levels. In addition, conversations with craft maltsters (Andrea Stanley, personal communication) have indicated that rye becomes “too sticky” and very difficult to handle during germination, when steeped to the moisture levels in excess of 45%. There is also the added consideration of extra energy costs with the removal of more moisture in kilning. However, maltsters seeking only high enzymatic activity, as in the production of some distillers’ malt, may wish to consider higher moistures because of the favorable impact on alpha-amylase and diastatic power.
Author Contributions
Y.W.: a portion of this research was conducted in partial fulfillment of the requirements for the degree of Master of Science at North Dakota State University. Disquisition: Y.W., Malting Conditions for Evaluation of Rye Cultivars. Cereal Science, NDSU. May 2017. Z.J.: help to wright the current manuscript; J.B.: malting and partial malt quality evaluation; J.G.: method development and partial malt quality evaluation; S.S.: partial malt quality evaluation; R.D.H.: statistical analysis; and P.B.S.: organizing and supervising the whole project.
Funding
The current research received no external funding.
Conflicts of Interest
The authors declare no conflict of interest.
References
- Stika, H.P. Early Iron Age and Late Mediaeval malt finds from Germany-attempts at reconstruction of early Celtic brewing and the taste of Celtic beer. Archaeol. Anthropol. Sci. 2011, 3, 41–48. [Google Scholar] [CrossRef]
- Oliver, G.; Colicchio, T. The Oxford Companion to Beer; Oxford University Press: Oxford, UK, 2011; ISBN 0195367138. [Google Scholar]
- Stambor, Z. Trend: Rye Beers. Available online: http://draftmag.com/rye-not/ (accessed on 28 June 2017).
- Brewers Association Presents 2017 Great American Beer Festival® Competition Style List. Descriptions and Specifications. 2017, 14–15. Available online: https://www.greatamericanbeerfestival.com/wp-content/uploads/2017/05/17_GABF_Beer_Style_Guidelines_Final.pdf (accessed on 5 October 2017).
- Asimov, E. All But Lost, Rye Is Revived as the Next Boutique Find. Available online: http://www.nytimes.com/2006/11/29/dining/29wine.html (accessed on 29 November 2006).
- Ralph, R. The production of American whiskies (Bourbon, Corn, Rye, Wheat and Tennessee). In The Alcohol Textbook; Jacques, K.A., Lyons, T.P., Kelsall, D.R., Eds.; Nottingham University: Nottingham, UK, 1999; p. 211. [Google Scholar]
- Bushuk, W. Rye production and uses worldwide. Cereal Foods World 2001, 46, 70–73. [Google Scholar]
- Food and Agriculture Organization of the United Nations Top 10 Country Production of Rye 2016. Available online: http://www.fao.org/faostat/en/#rankings/countries_by_commodity (accessed on 7 June 2018).
- USDA National Agricultural Statistics Service Crop Production Historical Track Records 2016, 240. Available online: http://usda.mannlib.cornell.edu/MannUsda/viewDocumentInfo.do?documentID=1593 (accessed on 7 June 2018).
- Darby, H.; Cubins, J.; Calderwood, L.; Cummings, E.; Gupta, A.; Post, J.; Ziegler, S. 2015 Cereal Rye Variety Trial; University of Vermont: Burlington, VT, USA, 2016; pp. 1–2. [Google Scholar]
- Schlegel, R. Rye: Genetics, Breeding, and Cultivation; CRC Press Taylor & Fracis Group, LLC: Boca Raton, FL, USA, 2014; ISBN 9781466561434. [Google Scholar]
- Sorrells, M.E. 2017 Small Grains Performance Trials for New York; Cornell University: Ithaca, NY, USA, 2017; pp. 1–9. [Google Scholar]
- Hansen, D. 2017 Winter Rye Field Crop Trials Results; University of Minnesota: Minneapolis, MN, USA, 2017; pp. 1–2. [Google Scholar]
- Bushuk, W. Rye: Production, Chemistry, and Technology, 2nd ed.; American Association Cereal Chemistry Inc.: St. Paul, MN, USA, 2001; ISBN 9780913250112. [Google Scholar]
- Briggs, D. Malts and Malting; Chapman and Hall: London, UK, 1998; ISBN 978-0-412-29800-4. [Google Scholar]
- Taylor, D.G.; Humphrey, P.M.; Boxall, J.; Smith, P.J. Brewing of Englihs-style ales with malted cereals, other than barley. Tech. Q. 1998, 35, 20–23. [Google Scholar]
- Pomeranz, Y.; Standridge, N.; Schreck, J.J.; Goplin, E.D. Rye in malting and brewing. Crop Sci. 1973, 13, 213–215. [Google Scholar] [CrossRef]
- Hübner, F.; Schehl, B.D.; Gebruers, K.; Courtin, C.M.; Delcour, J.A.; Arendt, E.K. Influence of germination time and temperature on the properties of rye malt and rye malt based worts. J. Cereal Sci. 2010, 52, 72–79. [Google Scholar] [CrossRef]
- American Society of Brewing Chemists. ASBC Methods of Analysis (Online), 14th Edition. Barley-2 Physical Tests (B. Bushelweight, C. Assortment, D. 1000-Kernel Weight, H. Injury by Sprout); Barley-3 Germination; Barley-5 Moisture; Malt-3 Moisture; Malt-4 Extract; Malt-6 Diastatic Power; Malt-7 Alpha-Amylas; American Society of Brewing Chemists: St. Paul, MN, USA, 2009; ISBN 978-1-881696-21-6. [Google Scholar]
- Banasik, O.J.; Myhre, D.; Harris, R.H. A micro-malting method for nursery samples. I. Apparatus and development of the method. Brewer’s Dig. 1955, 31, 50–55. [Google Scholar]
- Karababa, E.; Schwarz, P.B.; Horsley, R.D. Effect of kiln schedule on micromalt quality parameters. J. Am. Soc. Brew. Chem. 1993, 51, 163–167. [Google Scholar] [CrossRef]
- Mallett, J. Malt: A Practical Guide from Field to Brewhouse; Hertrich, J., Palmer, J., Eds.; Brewer Publication: Boulder, CO, USA, 2014; ISBN 1938469127. [Google Scholar]
- Carpita, N.; Shea, E. Linkage structure of carbohydrates by gas chromatography-mass spectrometry (GC-MS) of partially methylated alditol acetates. In Analysis of Carbohydrates by GLC and MS; Biermann, C., McGinnis, G., Eds.; CRC Press: Boca Rton, FL, USA, 1989; pp. 157–216. [Google Scholar]
- Blakeney, A.B.; Harris, P.J.; Henry, R.J.; Stone, B.A. A simple and rapid preparation of alditol acetates for monosaccharide analysis. Carbohydr. Res. 1983, 113, 291–299. [Google Scholar] [CrossRef]
- Mendis, M.; Ohm, J.-B.; Delcour, J.A.; Gebruers, K.; Meinhardt, S.; Simsek, S. Variability in arabinoxylan, xylanase activity, and xylanase inhibitor levels in hard spring wheat. Cereal Chem. 2013, 90, 240–248. [Google Scholar] [CrossRef]
- Mcmurrough, I.; Roche, G.P.; Cleary, K.G. Phenolic acids in beers and worts. J. Inst. Brew. 1984, 90, 181–187. [Google Scholar] [CrossRef]
- Schwarz, P.B.; Li, Y.; Barr, J.; Horsley, R.D. Effect of operational parameters on the determination of laboratory extract and associated wort quality factors. J. Am. Soc. Brew. Chem. 2007, 65, 219–228. [Google Scholar] [CrossRef]
- Clerck, J.D. A Textbook of Brewing; Chapman & Hall Ltd.: London, UK, 1957. [Google Scholar]
- Jin, Y.; Zhang, K.; Du, J. Effects of wheat protein content on endosperm composites and malt quality. J. Inst. Brew. 2008, 114, 289–293. [Google Scholar] [CrossRef]
- Sadosky, P.; Schwarz, P.B.; Horsley, R.D. Effect of arabinoxylans, β-glucans, and dextrins on the viscosity and membrane filterability of a beer model solution. J. Am. Soc. Brew. Chem. 2002, 60, 153–162. [Google Scholar] [CrossRef]
- Schwarz, P.B.; Han, J.-Y. Arabinoxylan Content of Commercial Beers. J. Am. Soc. Brew. Chem. 1995, 53, 157–159. [Google Scholar] [CrossRef]
- Coote, N.; Kirsop, B.H. A haze consisting largely of pentosan. J. Inst. Brew. 1976, 82, 34. [Google Scholar] [CrossRef]
- Bamforth, C.W.; Russell, I.; Stewart, G. Handbook of Alcoholic Brebages—Beer: A Quality Perspective; Elsevier: New York, NY, USA, 2008; ISBN 978-0-12-669201-3. [Google Scholar]
- Cui, Y.; Wang, A.; Zhang, Z.; Speers, R.A. Enhancing the levels of 4-vinylguaiacol and 4-vinylphenol in pilot-scale top-fermented wheat beers by response surface methodology. J. Inst. Brew. 2015, 121, 129–136. [Google Scholar] [CrossRef] [Green Version]
Figure 1.
Interaction of germination moisture × time on malting loss. Note: Different letters on the columns indicate significant difference (p < 0.05).
Figure 1.
Interaction of germination moisture × time on malting loss. Note: Different letters on the columns indicate significant difference (p < 0.05).

Figure 2.
Interaction of rye variety × germination moisture on malt extract. Note: Different letters on the columns indicate significant difference (p < 0.05).
Figure 2.
Interaction of rye variety × germination moisture on malt extract. Note: Different letters on the columns indicate significant difference (p < 0.05).

Figure 3.
Interaction of sample × germination moisture (a) and grain size × germination moisture (b) on DP. Note: Different letters on the columns indicate significant difference (p < 0.05).
Figure 3.
Interaction of sample × germination moisture (a) and grain size × germination moisture (b) on DP. Note: Different letters on the columns indicate significant difference (p < 0.05).
Figure 4.
Interaction of sample × germination moisture on the activity of α-amylase. Note: Different letters on the columns indicate significant difference (p < 0.05).
Figure 4.
Interaction of sample × germination moisture on the activity of α-amylase. Note: Different letters on the columns indicate significant difference (p < 0.05).

Figure 5.
Interaction of sample × germination moisture on the content of soluble protein in wort. Note: Different letters on the columns indicate significant difference (p < 0.05).
Figure 5.
Interaction of sample × germination moisture on the content of soluble protein in wort. Note: Different letters on the columns indicate significant difference (p < 0.05).

Figure 6.
Interaction of sample × germination moisture (a) and germination moisture × time (b) on viscosity. Note: Different letters on the columns indicate significant difference (p < 0.05).
Figure 6.
Interaction of sample × germination moisture (a) and germination moisture × time (b) on viscosity. Note: Different letters on the columns indicate significant difference (p < 0.05).


Table 1.
Grain quality of rye samples screened for micro-malting.
| Rye Type | Samples/Cultivars (N) | Plump Kernels (%) | Thin Kernels (%) | 1000 Kernel Weight (g) | Protein (%) | ||||
|---|---|---|---|---|---|---|---|---|---|
| Mean | Range | Mean | Range | Mean | Range | Mean | Range | ||
| Forage | 11/7 | 13.4 | 1.2–57.2 | 35.0 | 7.5–66.2 | 20.2 | 15.2–29.9 | 15.7 | 10.5–19.6 |
| Conventional Grain | 25/13 | 54.5 | 7.9–90.0 | 8.6 | 0.3–30.3 | 28.3 | 19.8–34.4 | 11.3 | 7.7–13.9 |
| Hybrid Grain | 12/12 | 70.5 | 58.3–79.0 | 2.4 | 1.4–8.5 | 30.9 | 27.1–37.7 | 8.6 | 7.6–11.3 |
| Selected for Malting | |||||||||
| Sample A | 63.1 | 8.6 1 | 28.5 | 10.9 | |||||
| Sample B | 42.1 | 4.1 1 | 28.3 | 12.7 | |||||
1 Thin grain was removed prior to malting.
Table 2.
Mean of rye malt quality values as affected by malting operational parameters (N = 48) a.
| Parameters | Malting Loss (%) | Extract (% Malt, db) | Diastatic Power (°ASBC) | α-Amylase (DU, db) | Wort Soluble Protein (% Malt, db) | S/T (%) | Wort FAN (mg/L) | Wort Viscosity (cP) | Wort AX (mg/L) | A/X Ratio (%) | Wort β-Glucans (mg/L) |
|---|---|---|---|---|---|---|---|---|---|---|---|
| Sample | |||||||||||
| Sample A | 11.9 a | 84.0 a | 131.8 a | 83.2 a | 8.2 a | 64.2 a | 223.0 a | 5.2 a | 3791.5 a | 85.2 a | 68.6 a |
| Sample B | 11.3 b | 87.1 b | 115.2 b | 88.6 b | 7.2 b | 65.9 b | 221.8 a | 4.5 b | 3849.2 a | 88.1 a | 59.4 b |
| Germination time | |||||||||||
| Three day | 8.6 a | 85.0 a | 117.8 a | 69.3 a | 7.5 a | 63.4 a | 217.1 a | 5.4 a | 3579.7 a | 88.9 a | 113.2 a |
| Four day | 10.4 b | 85.7 b | 121.5 ab | 80.6 b | 7.7 b | 65.2 b | 223.4 ab | 5.0 b | 4112.2 ab | 87.7 a | 66.9 b |
| Five day | 12.9 c | 85.7 b | 129.9 b | 93.5 c | 7.7 b | 65.1 c | 227.1 b | 4.6 c | 3860.1 b | 84.4 a | 43.1 c |
| Six day | 14.5 d | 85.9 b | 125.0 ab | 100.2 d | 7.9 b | 66.6 d | 222.1 ab | 4.5 c | 3729.3 b | 85.7 a | 32.9 d |
| Grain Size | |||||||||||
| Plump | 11.5 a | 85.9 a | 123.4 a | 83.2 a | 7.9 a | 67.2 a | 230.6 a | 4.8 a | 3823.3 a | 84.8 a | 63.7 a |
| Medium | 11.7 a | 85.2 b | 123.6 a | 88.6 b | 7.4 b | 62.9 b | 214.2 b | 4.9 a | 3817.4 a | 88.5 a | 64.4 a |
| Germination moisture | |||||||||||
| 40% | 5.6 a | 85.9 a | 108.2 a | 71.3 a | 7.6 a | 64.7 ab | 215.9 a | 5.4 a | 3907.2 a | 85.1 a | 136.1 a |
| 45% | 12.7 b | 84.8 a | 109.0 a | 82.8 b | 7.8 b | 66.1 b | 211.0 a | 4.8 b | 3834.2 a | 90.5 a | 40.2 b |
| 48% | 16.4 c | 86.1 b | 153.4 b | 103.6 c | 7.6 a | 64.3 a | 240.3 b | 4.4 c | 3719.7 a | 84.4 a | 15.7 c |
Note: a It was the mean of quality values that had been affected by the other malting parameters; means followed by the different letter are significantly different (p ≤ 0.05) within each factor.
Table 3.
Mean of wort fermentable sugars (g/100 mL) as affected by malting operational parameters a.
Table 3.
Mean of wort fermentable sugars (g/100 mL) as affected by malting operational parameters a.
| Parameters | Fructose | Glucose | Maltose | Maltotriose | Total Fermentable Sugar |
|---|---|---|---|---|---|
| Sample | |||||
| Sample A | 0.1 a | 0.7 a | 3.7 a | 1.0 a | 5.5 a |
| Sample B | 0.2 b | 0.9 b | 3.8 b | 1.2 b | 6.0 b |
| Germination Time | |||||
| Three day | 0.1 a | 0.7 a | 3.8 a | 1.0 a | 5.5 a |
| Four day | 0.1 a | 0.8 b | 3.8 a | 1.1 b | 5.7 b |
| Five day | 0.1 b | 0.8 c | 3.7 ab | 1.1 c | 5.9 bc |
| Six day | 0.2 c | 0.9 d | 3.7 b | 1.2 c | 5.9 c |
| Grain Size | |||||
| Plump | 0.1 a | 0.8 a | 3.8 a | 1.1 a | 5.8 a |
| Medium | 0.1 a | 0.8 a | 3.7 b | 1.1 a | 5.7 a |
| Germination Moisture | |||||
| 40% | 0.1 a | 0.7 a | 3.8 a | 1.0 a | 5.5 a |
| 45% | 0.1 b | 0.8 b | 3.7 b | 1.1 b | 5.7 b |
| 48% | 0.2 c | 0.9 c | 3.8 a | 1.2 c | 6.1 c |
Note: a It was the mean of quality values that had been affected by the other malting parameters; means followed by the different letter are significantly different (p ≤ 0.05) within each factor.
Table 4.
Mean of phenolic acids (mg/L) as affected by malting operational parameters a.
| Parameters | Caffeic Acid | Ferulic Acid | p-Coumaric Acid | Sinapinic Acid | Syringic Acid | Vanillic Acid | Gallic Acid | Catechin | Total Phenolic Acids |
|---|---|---|---|---|---|---|---|---|---|
| Sample | |||||||||
| Sample A | 11.0 a | 326.5 a | 10.3 a | 6.8 a | 6.5 a | 170.7 a | 22.7 a | 0.1 a | 554.9 a |
| Sample B | 17.0 b | 448.6 b | 22.1 b | 8.1 b | 7.9 b | 257.4 b | 10.3 b | 0.1 a | 770.5 b |
| Germination Time | |||||||||
| Three day | 11.5 a | 323.8 a | 12.2 a | 6.8 a | 6.6 a | 183.2 a | 23.3 a | 0.0 a | 567.3 a |
| Four day | 12.3 a | 340.1 a | 13.4 a | 6.6 a | 7.0 ab | 190.2 a | 17.7 ab | 0.1 a | 587.4 a |
| Five day | 15.3 b | 426.1 b | 17.6 b | 7.0 a | 8.0 bc | 245.3 b | 17.0 ab | 0.1 a | 736.4 b |
| Six day | 16.8 b | 460.3 b | 21.7 b | 7.1 a | 8.3 c | 237.5 b | 8.1 b | 0.1 a | 759.8 b |
| Grain Size | |||||||||
| Plump | 13.6 a | 367.0 a | 13.4 a | 6.6 a | 7.5 a | 186.6 a | 21.1 a | 0.1 a | 615.8 a |
| Medium | 14.4 a | 408.2 b | 19.0 b | 7.1 b | 7.5 a | 241.6 b | 12.0 a | 0.1 a | 709.7 b |
| Moisture | |||||||||
| 40% | 13.4 a | 384.0 a | 12.8 a | 6.6 a | 7.6 a | 256.7 a | 24.0 a | 0.2 a | 704.8 a |
| 45% | 12.1 a | 328.6 b | 11.0 a | 6.5 a | 6.0 b | 183.2 b | 9.1 b | 0.0 b | 556.6 b |
| 48% | 16.4 b | 450.0 c | 24.9 b | 7.5 b | 8.9 c | 202.7 b | 16.4 ab | 0.1 b | 726.8 a |
a Means followed by the same letter are not significantly different (p ≤ 0.05).
Table 5.
Correlation coefficients of rye wort characteristics (N = 48) a.
| Factor | α-Amylase | Diastatic Power | Extract | Wort Viscosity | Wort Soluble Protein | S/T | Wort FAN | Wort β-Glucan | Wort AX | Wort A/X |
|---|---|---|---|---|---|---|---|---|---|---|
| Malting loss | 0.84 *** | 0.63 *** | 0.04 | −0.56 *** | 0.12 | 0.06 | 0.39 *** | −0.87 *** | −0.10 | −0.04 |
| α-Amylase | 1 | 0.60 *** | 0.23 * | −0.77 *** | −0.01 | 0.10 | 0.33 *** | −0.83 *** | −0.06 | 0.00 |
| Diastatic Power | 1 | −0.07 | −0.22 * | 0.06 | −0.25 * | 0.49 *** | −0.48 *** | −0.10 | −0.22 * | |
| Extract | 1 | −0.22 * | −0.07 | 0.44 *** | 0.42 *** | −0.11 | 0.16 | 0.00 | ||
| Wort Viscosity | 1 | 0.15 | −0.25 * | −0.18 | 0.76 *** | 0.02 | −0.01 | |||
| Wort Soluble Protein | 1 | 0.66 *** | 0.14 | −0.11 | −0.02 | 0.14 | ||||
| Kolbach Index | 1 | 0.13 | −0.18 | 0.02 | 0.25 * | |||||
| Wort FAN | 1 | −0.39 *** | 0.07 | −0.26 * | ||||||
| Wort β-Glucan | 1 | 0.03 | 0.01 | |||||||
| Wort AX | 1 | −0.43 *** | ||||||||
| A/X | 1 |
a *, **, ***, significant at 0.05, 0.001, and 0.0001 probability levels, respectively.
© 2018 by the authors. Licensee MDPI, Basel, Switzerland. This article is an open access article distributed under the terms and conditions of the Creative Commons Attribution (CC BY) license (http://creativecommons.org/licenses/by/4.0/).
Share and Cite
MDPI and ACS Style
Wang, Y.; Jin, Z.; Barr, J.; Gillespie, J.; Simsek, S.; Horsley, R.D.; Schwarz, P.B. Micro-Malting for the Quality Evaluation of Rye (Secale cereale) Genotypes. Fermentation 2018, 4, 50. https://doi.org/10.3390/fermentation4030050
AMA Style
Wang Y, Jin Z, Barr J, Gillespie J, Simsek S, Horsley RD, Schwarz PB. Micro-Malting for the Quality Evaluation of Rye (Secale cereale) Genotypes. Fermentation. 2018; 4(3):50. https://doi.org/10.3390/fermentation4030050
Chicago/Turabian StyleWang, Yujuan, Zhao Jin, John Barr, James Gillespie, Senay Simsek, Richard D. Horsley, and Paul B. Schwarz. 2018. "Micro-Malting for the Quality Evaluation of Rye (Secale cereale) Genotypes" Fermentation 4, no. 3: 50. https://doi.org/10.3390/fermentation4030050
Note that from the first issue of 2016, this journal uses article numbers instead of page numbers. See further details here.