1. Introduction
A major issue hindering efficient industrial fermentation of sugar-based feedstock into ethanol is unwanted bacterial contamination [
1,
2]. The bacterial contamination can be introduced into the fermentation system from different hardware components such as instruments, reactors, pipelines of the feed stream, and added chemicals, and nutrients. These bacterial contaminations can also be introduced to the system by recycling yeast [
2,
3]. Approximately 500 different strains of bacteria have been isolated from different stages of a fermentation process, which predominantly are lactic acid producing bacteria as they have a relatively better tolerance for low pH environments as well as higher ethanol concentrations [
4,
5].
The presence of bacterial contamination in a fermentation process can noticeably decrease the final ethanol yields and process profitability. In continuous, semi-batch or batch mode fermentation processes, the substrate and nutrient sources are provided for the yeast
Saccharomyces cerevisiae to thrive in and to produce ethanol. However, the competition between yeast and bacteria to utilize nutrients to survive, grow, and reproduce leaves inadequate levels of food components for the yeast, resulting in a considerably lower ethanol yield. Moreover, the contaminating microorganisms produce metabolites such as lactic and acetic acids that disturb and inhibit the metabolic activity of yeast, as well as reduce the quality of the final product [
2]. In certain cases, the bioethanol yield may decrease as much as 30% due to bacterial metabolites, causing a major loss for the ethanol producers [
6]. In addition, in processes where yeast cells are recycled in consecutive fermentation batches, a high level of bacterial contamination may lead to yeast flocculation, resulting in poor mass transfer, low cell viability, and reduction in ethanol yield. This could also lead to excessive foam formation, and the need of antifoam agents that increase the overall costs [
7].
In industrial large-scale fermentation, a fully contamination-free process is difficult to achieve. Complete sterilization and maintaining sterility of the feedstock and instruments are costly and laborious processes. In order to alleviate the contamination issue and control bacterial growth in fermentation systems, conventional anti-bacterial agents such as the antibiotic virginiamycin, sodium fluoride and hydrogen peroxide have been added at different stages of the process [
8,
9,
10,
11]. However, these anti-bacterial agents have not proven to be fully effective for long-term bacterial control and system disinfection. Moreover, the presence of antibiotic residues in certain by-products of the ethanol fermentation process such as Distiller’s Dried Grains with Solubles (DDGS) result in environmental and health concerns that render their commercialization problematic. Antibiotic residues in DDGS used as animal feed risk ending up in animal products such as milk, or if used as fertilizers, may cause resistance in the bacterial cultures grown on the crops [
12].
Another approach to partially decontaminate the fermentation system involves the use of acids, e.g., sulfuric acid, in order to temporarily (1–3 h) lower the pH to about 1.5–3 for the treatment of a diluted yeast culture [
7]. Contaminating bacteria (with favorable pH 6) are less resistant to lower pH than yeast (favor pH above 4), therefore, a pH drop in the beginning of the fermentation cycle ameliorates issues related to bacterial activity. However, this approach may also deteriorate the yeast’s viability and metabolic activity [
13,
14].
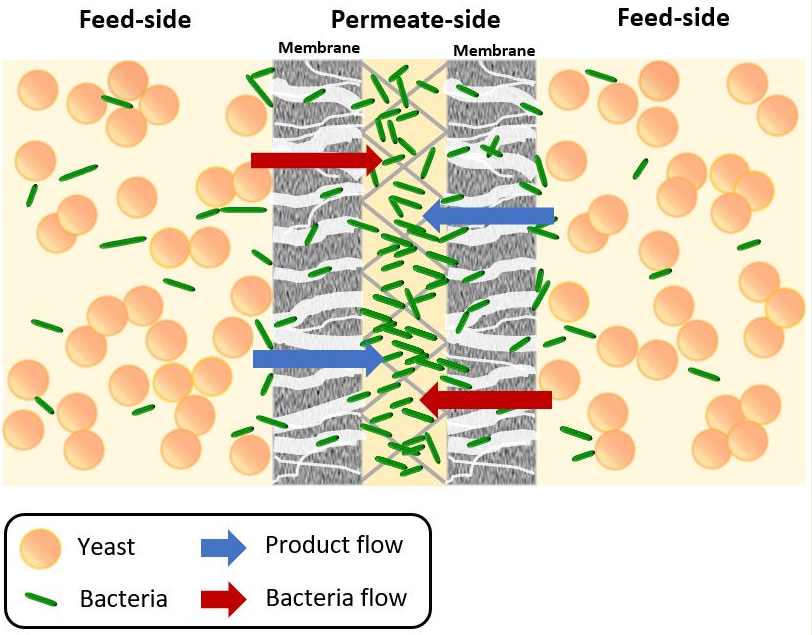
Membrane bioreactor (MBR) systems could potentially solve the contamination issue by means of a physical approach. Membrane-related applications are generally based on the ability of the semi-selective membrane to efficiently separate different compounds and/or cells/particles on size-exclusion and affinity mechanisms since they are permeable to some components while retaining others [
15]. Based on this capability of synthetic membranes, it is suggested that a selective washout of bacterial contamination, while retaining the larger yeast cells, could be achieved through proper choice of membrane pore size, membrane material hydrophobicity and affinity for different cells and chemical compounds. By this approach, not only the bacterial contamination in the fermentation process can be physically removed, but also higher ethanol yield and productivity can be expected, as high yeast cell concentrations are present in the medium during a continuous fermentation. However, as the suspended bacteria can cause bio-fouling due to internal and external membrane pore blockage and/or biofilm formation, the viability of this physical decontamination method needs to be studied in more detail [
16,
17].
In this paper, the capability of an immersed MBR (iMBR) set-up to actively decontaminate a fermentation system from unwanted bacteria while retaining yeast is examined for a Saccharomyces cerevisiae-Enterobacter cloacae model system. In this regard, the effects of different filtration parameters (like transmembrane pressure, permeate flow rate, backwash flowrate, and backwash pressure difference), membrane characteristics (like pore size and effective membrane filtration area), media (phosphate buffered saline (PBS) and glucose semi-synthetic medium), pH, and inoculum size on bacterial decontamination behavior are evaluated.
2. Materials and Methods
2.1. Microorganisms
The yeast Saccharomyces cerevisiae and a bacterial complex of Enterobacter cloacae were used as fermentation agent and bacterial contamination, respectively. Throughout the text the bacterial complex is referred to as bacteria.
2.1.1. Saccharomyces Cerevisiae
The yeast strain S. cerevisiae CBS 8066, provided by Centraalbureau voor Schimmelcultures (Delft, The Netherlands), was loop-inoculated on sterile Yeast extract Peptone Dextrose (YPD) agar plates consisting of 20 g/L peptone, 10 g/L glucose, 20 g/L agar, and 10 g/L yeast extract, incubated for 24 h at 30 °C, and then kept at 4 °C until use.
2.1.2. Enterobacter Cloacae
The bacteria used were an
Enterobacter cloacae complex. This bacillus acetic acid-producing bacterial contamination was first isolated from a xylose-glucose fermentation system at the University of Borås, Sweden, and was further identified at the Culture Collection University of Göteborg (Sweden) as CCUG 68890. The identified
E. cloacae complex consists of nearly 30 different bacterial species with Enterobacter cloacae being dominant.
E. cloacae is a facultative anaerobic gram-negative, rod-shaped bacteria that grows well in mesophilic conditions (37 °C) and at a pH around 7.0.
E. cloacae is capable of consuming a variety of carbon sources such as glycerol, cellulose, glucose, and xylose [
18,
19]. The
E. cloacae complex was kept on nutrient agar plates consisting of 5 g/L peptone, 5 g/L NaCl, 15 g/L agar, and 3 g/L yeast extract and stored at 4 °C until use.
2.2. Culture Preparations
A synthetic nutrient medium consisting of 30 g/L glucose, 10 g/L peptone, 5 g/L yeast extract and 3.5 g/L KH2PO4, was used for the cultivation of yeast and bacteria precultures in shake flasks. The nutrient broth and KH2PO4 were autoclaved separately, and mixed under sterile conditions before the addition of yeast/bacteria inoculum. Originally, the pH of the medium was 5, but for some preparations, the pH was adjusted to 7 by adding 10 M NaOH for bacteria cultivation.
2.3. Maximum Growth Rate Measurement
An understanding of the maximum growth rate of yeast and bacteria is of great importance when defining the maximum dilution rate of a continuous fermentation process. Therefore, the growth rates of yeast at pH 5 and bacteria at pH 5 and 7 were investigated. For shake flask cultivations, 10 mL of PBS (8 g/L NaCl; 0.2 g/L KCl; 1.42 g/L Na
2HPO
4; 0.24 g/L KH
2PO
4) was loop-inoculated with a colony of yeast and/or bacteria and placed in a shaking water bath (Grant OLS 200, Grant Instrument Ltd., Cambridge, UK) at 30 °C/125 rpm for 30 min. Subsequently 100 mL of nutrient broth was inoculated with 1 mL of the preculture prepared in 250 mL Erlenmeyer flasks and placed in a shaking water bath. Frequent samplings were done at different time intervals, and the absorbance of the cell samples was measured with a spectrophotometer against a PBS blank. Readings were plotted against time, and the slope of the graphs in the exponential growth phase was measured to define the maximum growth rate (
Section 3.1).
2.4. Yeast and Bacteria Size Determination
Estimation of the dimensions of both yeast and bacteria was essential to decide on the pore size of the membranes to be used for filtration purposes. In order to evaluate the average size of both yeast and bacteria, samples were taken with an inoculation loop from the culture broth, Gram stained [
20], and observed and scaled under a light microscope at ×1000 magnification. A Burker’s counting chamber was used to count the yeast cells. Size distribution charts were prepared from the gathered data to calculate the average dimensions of yeast and bacteria.
2.5. Membrane Bioreactor Set-Up and Operation Conditions
2.5.1. Immersed Membrane Bioreactor
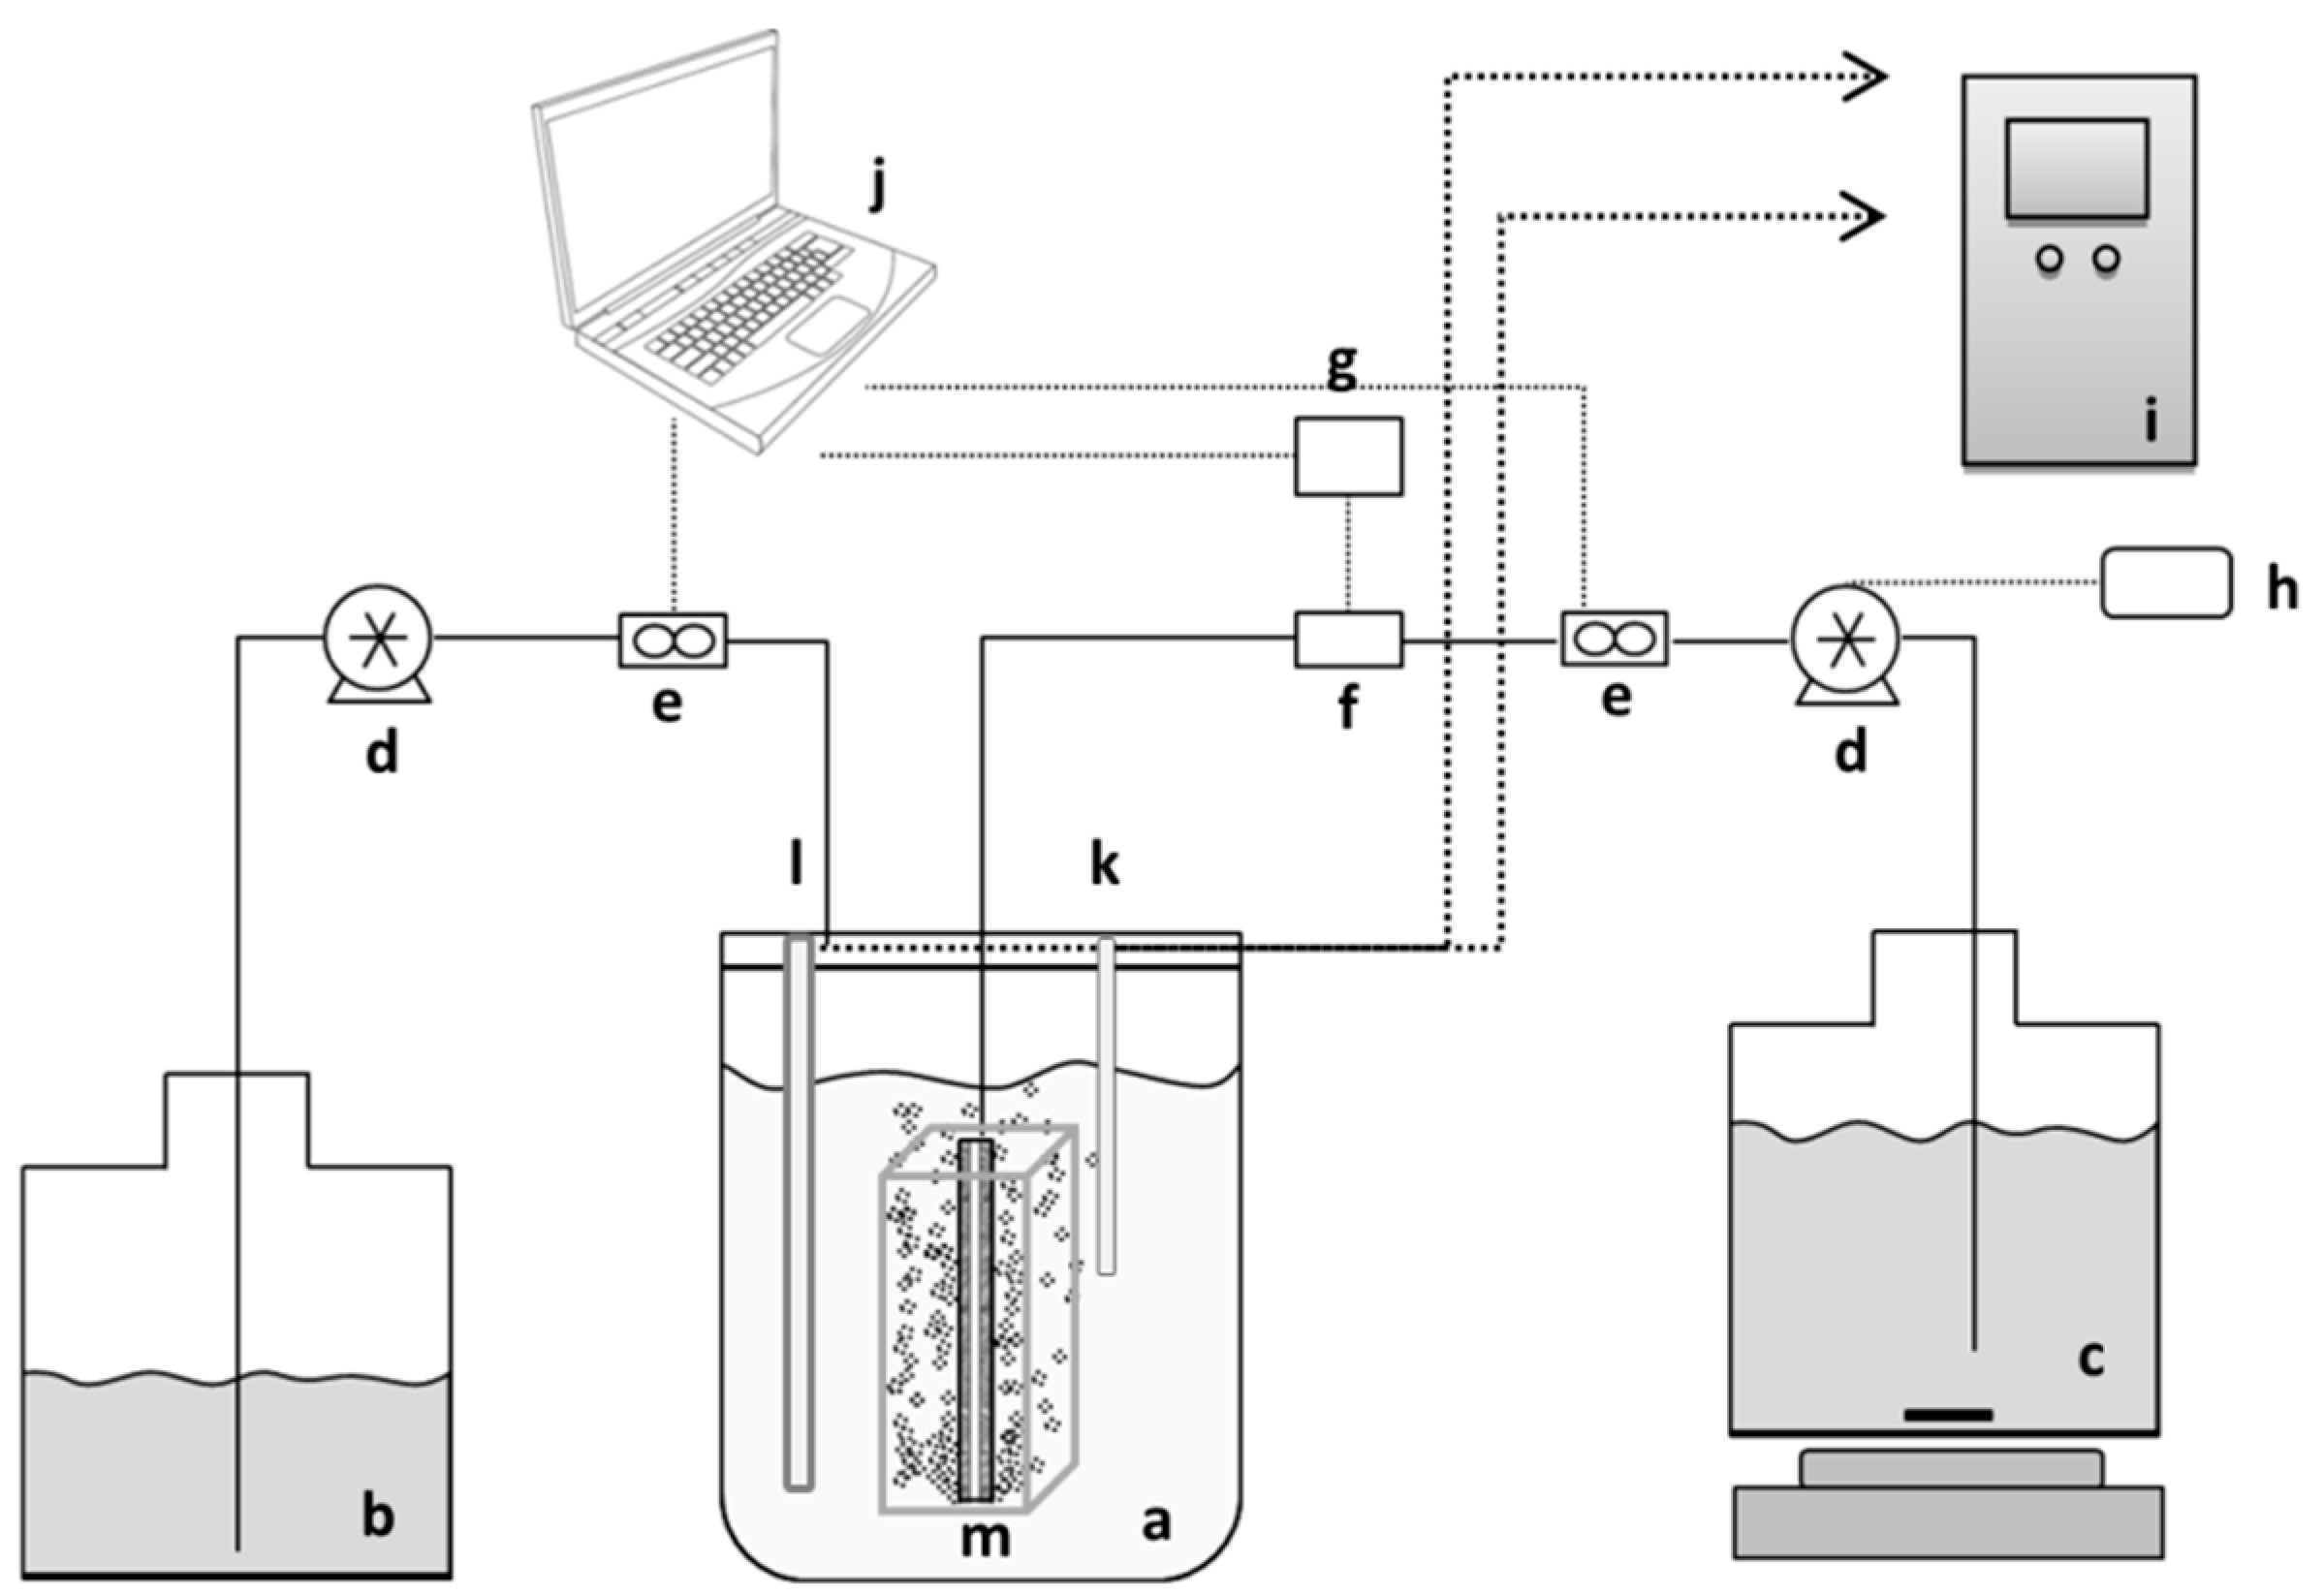
The general schematic of the membrane bioreactor set-up is illustrated in
Figure 1. The membrane panels used for MBR filtration were 2nd generation flat-sheet Integrated Permeate Channel (IPC) panels [
21] with polyester spacer-fabric support, developed by the Flemish Institute for Technological Research (VITO NV, Mol, Belgium). For better oriented aeration and membrane fouling prevention the panels had inbuilt air/gas diffusers (6 on each side) of 0.5 mm in diameter, at the bottom of the panel. The total membrane-coated area per panel was 68.6 cm
2. Membranes were made from hydrophilized polyethersulfone (PES) possessing a clean water permeability of 3000–4000 L/h·m
2·bar. IPC membranes with membrane layers with mean pore sizes in the microfiltration range of, respectively, 1 µm and 2.4 µm were used. The 2nd generation IPC panels were integrated inside a 1.5 L bench-top reactor for single panel experiments and a 2 L water-jacketed bioreactor (Biostat B plus, Sartorius BBI Systems GmbH, Melsungen, Germany). A special spacer box for double panel experiments was used in order to improve membrane cleaning and medium mixing efficiencies. The experiments were conducted with both single and double membrane panels to enable observation of the effect of membrane surface area on filtration and bacterial washout performances.
The applied MBR was operated at a constant flux filtration mode. However, since the initial flow was set by implementing a specific pump rotation speed, small drops in flow could occur during the tests. The filtrate flow rate and the TMP were monitored by means of a 710 Atrato ultrasonic flowmeter (Titan Enterprises Ltd., Sherborne, UK) and a Microfluidic pressure sensor MPS3 (Elveflow, Paris, France), respectively. The recorder flow rates have not been presented in the figures as constant flux filtration mode was applied. The raw data provided from the measurement devices were logged and processed in a computer connected to the measurement instruments. The reactor was fed from the feed tank and the filtrate was removed from the hollow space between 2 membrane layers of the IPC membranes using Watson-Marlow 403U/R1peristaltic pumps (Watson Marlow, Wilmington, MA, USA). In the cases where backwashing was applied, the cycle was controlled through a Schneider Zelio logic relay (Schneider Electric Automation GmbH, Lahr, Germany) attached to the permeate pump. Two different cycles of backwash were investigated for their effect on reversible fouling: A 4-min cycle (30 s of backwash + 3.5 min of permeation) and a 3-min cycle (30 s of backwash + 2.5 min of permeation). Backwash flow rates were the same as the forward flow rates.
In experiments where the 1.5 L bench reactor was used, the temperature was controlled at 30 °C through a heating jacket, pH was monitored by the control unit and was manually adjusted by the addition of 10 M NaOH. In examinations with the 2 L water-jacketed bioreactor, temperature, pH and aeration were monitored through a Biostat B plus fermentation controlling unit.
In fermentation cycles, foaming was controlled manually by adding fatty acid ester anti-foam, and the reactor was aerated with 250 L/h N2 to provide anaerobic conditions. When PBS medium was used, the reactor was aerated with 250 L/h air through a rotameter.
Before each run, reactors and tubings were autoclaved at 120 °C for 20 min, the membrane was subsequently chemically cleaned with sterilization solutions of 2% NaOH, 1% H3PO4, and 200 ppm NaOCl at 45 °C each for 30 min followed by rinsing with sterile distilled water.
2.5.2. Evaluation of Retention and Washout of Microorganisms
In order to evaluate the ability of the membrane filtration to selectively retain yeast and remove bacteria, membrane filtration at different filtration conditions was performed in sterile PBS buffer. PBS was used as the bioreactor medium to maintain the viability of the cells during the filtration cycle in both 1.5 L and 2 L MBRs.
The reactor was inoculated with yeast, bacteria, or yeast and bacteria to observe the influence of the presence of the cells on the membrane filtration capabilities and to measure the extent of filterability and separation of microorganisms. The inoculum preparation was as described in
Section 2.2. After the precultures were prepared in shake flasks, the content was centrifuged at 3000×
g for 5 min. The supernatant was then removed and the cells were re-suspended in the same amount of PBS to avoid a color change that would have disturbed spectrophotometry readings. To ensure homogeneity of the zero-hour samples taken for turbidity measurements, feeding and permeate withdrawal was started after the medium and the inoculum had been mixed for 5 min. A range of dilution rates were tested: 0.25–0.66 1/h, when the reactor working volume was 1.5 L, and 0.5–0.75 1/h when the working volume was 2 L. Tested biomass concentrations were 0.3–0.02 g/L for bacteria and 0.6–0.135 g/L for yeast.
2.5.3. MBR Fermentation and Filtration
Regarding continuous fermentation and bacteria filtration (washout) conditions, the sterile synthetic medium consisting of glucose, peptone, yeast extract and K
2HPO
4 was used in two different concentrations: 30 g/L Glucose + 10 g/L Peptone + 6 g/L Yeast Extract + 3.5 g/L K
2HPO
4 and 20 g/L Glucose + 1 g/L Peptone + 1 g/L Yeast Extract + 3.5 g/L K
2HPO
4. Before starting the experiment, the K
2HPO
4 and nutrient solutions were autoclaved separately and were mixed inside the reactor. The pumps for permeation and feeding were started after the medium and the inoculum were mixed for 5 min to ensure homogeneity of the zero-hour samples. Inoculum preparation was as described in
Section 2.2, and the contents of the shake flasks were used to inoculate the reactor. The filtration behavior during ethanol fermentation of the bacteria-contaminated medium was performed at a permeate flux range representing dilution rates of 0.25 and 0.5 1/h using the 1.5 L reactor and 0.11–1 1/h for the 2 L reactor. Cell concentrations of ~8 × 10
−6–0.039 g/L (~1.1 × 10
5–0.6 × 10
9 CFU) of bacteria and 0.013–0.183 g/L (~0.03 × 10
6–0.51 × 10
6 CFU) of yeast were used to determine the optimum bacteria washout capabilities at different fermentation and filtration conditions.
2.6. Analytical Methods
The changes in the concentration of bacteria and yeast in shake flasks, MBR and permeate tank were monitored through optical density measurements at 600 nm in the linear range in a Libra S60 (Biochrom Ltd., Cambridge, UK) spectrophotometer. For growth-rate measurement and MBR fermentation samples, changes in the turbidity were checked by centrifuging the sample (3000× g, 5 min), removing the supernatant, re-suspending cells in the initial feed medium, and checking the absorbance of the samples against the relevant pure feed medium. In the cases where bacteria and yeast cultures were to be added together, the turbidity of the bacteria was measured first, and then the turbidity of the mixed culture. Samples were taken on average every 20 min from the reactor and permeate tank, and readings were plotted against time.
The concentration of different nutrients and metabolites during preculture preparation and MBR fermentation cycles were analyzed using high performance liquid chromatography (HPLC). Samples taken at different time intervals were centrifuged at 15,000× g for 5 min, and the supernatant was used for HPLC analysis. The HPLC (Waters 2695, Waters Corporation, Milford, CT, USA) had a hydrogen-based column (Aminex HPX-87H, Bio-Rad, Hercules, CA, USA) working at 60 °C with 5 mM H2SO4 eluent flowing at 0.6 mL/min, sufficient for detection and quantification of sugars and fermentation metabolites such as glucose, ethanol, glycerol, and acetic acid.
Cell dry weight (CDW) measurement was performed by collecting 5 mL of the culture in duplicate at different time intervals, centrifuging at 3000× g for 5 min, replacing the supernatant with Milli-Q water and repeating the process, and then drying the cell pellet in previously dried and weighed test tubes at 70 °C for 24 h.
Cell counts were performed as follows. For yeast cells, 10−1 diluted and non-diluted samples of 0.2 mL were inoculated on YPD plates. Duplicates were incubated for 24 h at 30 °C. For bacteria, nutrient agar plates were inoculated with 50 µL samples taken at 0, 5 and 10 h, or serial dilutions thereof. Duplicates were incubated for 24 h in 30 °C.
3. Results and Discussion
In this study, the potential of an iMBR set-up for yeast retention and washout of bacteria was evaluated. First, filtration performance of yeast, bacteria or a mixture of both microorganisms was investigated in a synthetic buffer medium. Then, the optimal conditions were applied in continuous fermentation experiment with the mixed culture on semi-synthetic medium.
3.1. Growth Rate Measurement of Yeast and Bacteria
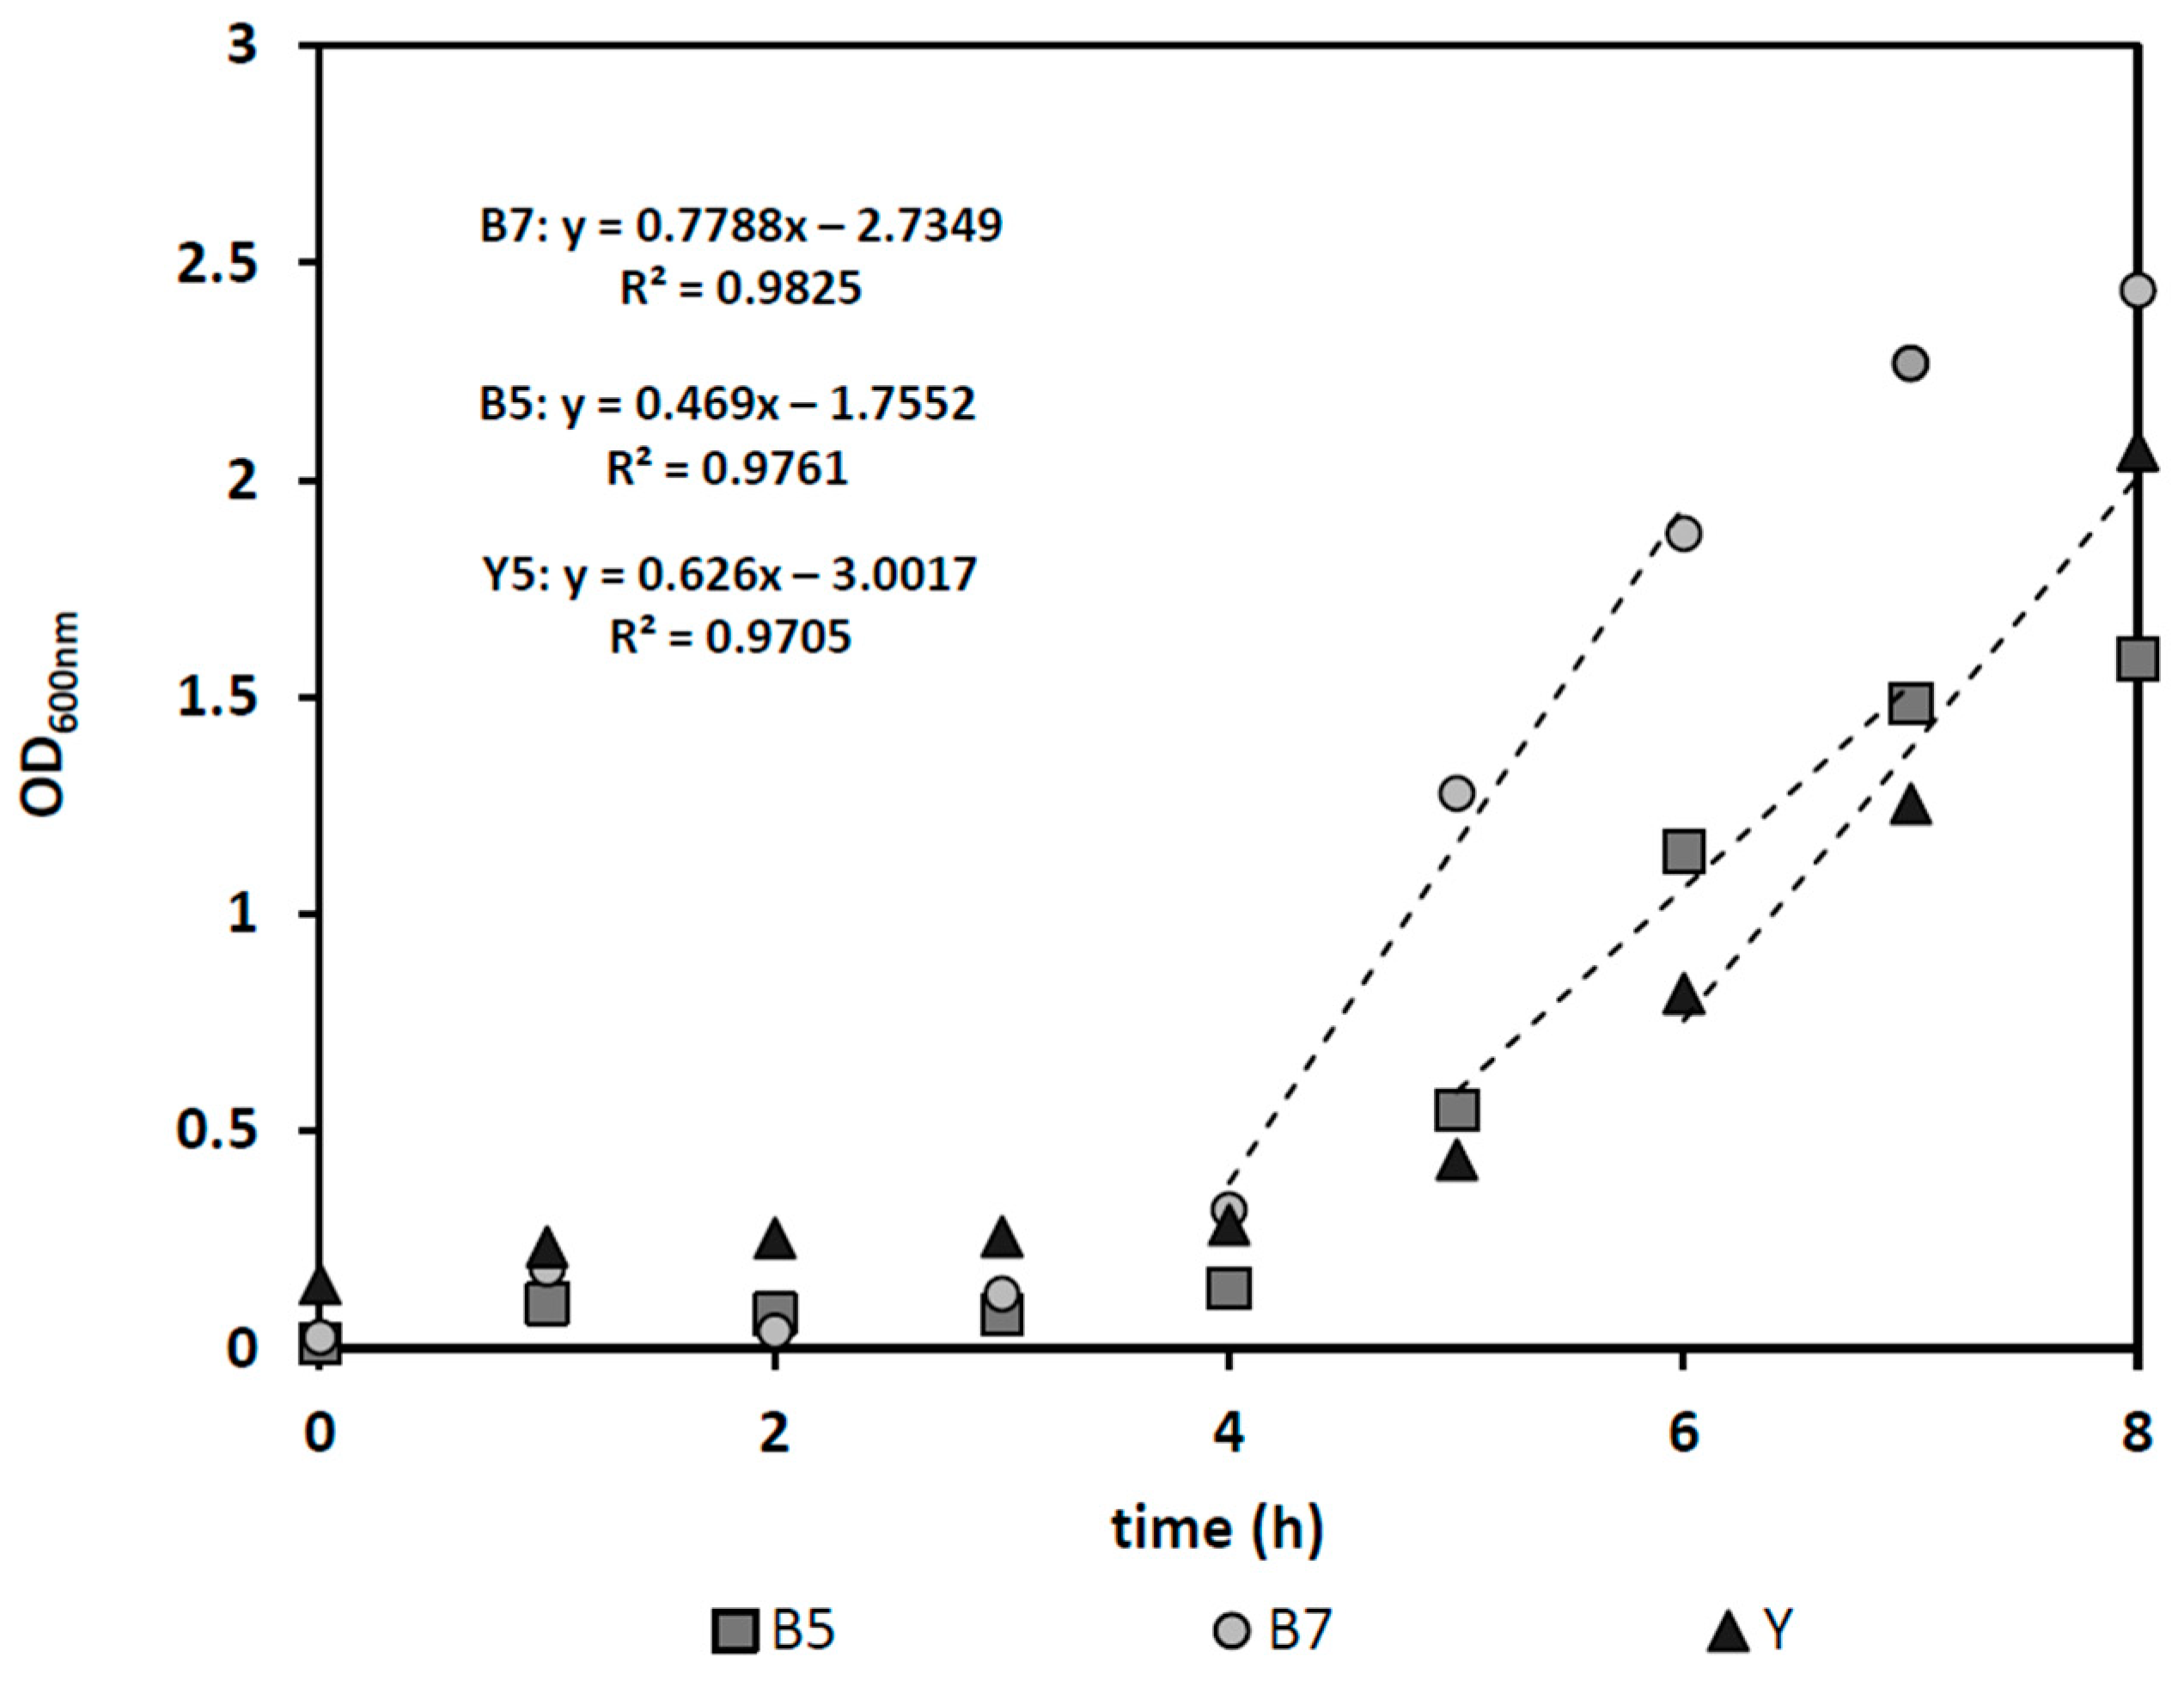
The specific growth rate of microorganisms has a significant role in defining the optimum dilution rate for effective bacteria removal. For yeast and
E. cloacae the maximum growth rates were determined to be 0.63, 0.47, and 0.78 1/h, representing 1.0, 1.47, and 0.89 h doubling times for yeast at its optimum pH 5, and for bacteria at pH 5 and the optimum pH 7, respectively (see
Figure 2). Considering continuous fermentation in a steady-state condition (1) using sterile feed and having negligible cell death, cells are removed from the reactor equal to their growth rate. That means, according to the Monod growth model (2) [
22], cell growth rate (µ) is equal to the dilution rate (D):
In steady-state continuous fermentation:
where µ is the cell growth rate, µ
max the cell maximum growth rate (1/h),
S the concentration of the limiting substrate (g/L),
Ks the half saturation constant (g/L).
If high concentration of substrate is available (S >> Ks) the dilution rate nearly equals µmax. When the dilution rate is higher than µmax washout of bacterial cells will occur. In addition, because at pH 5 (the favorable pH for fermentation) the bacteria have a slower maximum growth rate than S. cerevisiae, a selective microorganism separation can in principle be achieved through the proper choice of dilution rate.
3.2. MBR Filtration Using Buffer as Feed Solution
MBR fermentation systems have significant advantages over conventional fermentation modes as they can provide high cell concentrations in the reactor that allow efficient conversion of substrates into products and also higher tolerance to cell inhibitory compounds [
23]. Moreover, higher dilution rates can be achieved since undesired cell washout is prevented [
24]. However, higher dilution rates require higher permeate fluxes through a given membrane surface area which increases membrane fouling tendency [
25]. Therefore, prior to fermentation runs, filtration tests were implemented using PBS as the reactor medium to maintain viable cells at constant cell numbers [
26]. The effect of filtration parameters such as initial transmembrane pressure (TMP) and permeate flux, backwash cycles, and membrane characteristics such as pore size and effective membrane filtration area on cell washout and retention behavior were investigated.
3.2.1. Yeast Retention in the iMBR
As yeast retention in the MBR was desired, and the yeast’s average diameter is 2.5 ± 0.2 µm, membranes with pore sizes of 1 µm and 2.4 µm were applied. While in conventional continuous bioreactors
D > µ
max is an unfavorable condition leading to yeast washout, this is not the case in a MBR, where the membrane guarantees total yeast cell retention. Therefore, dilution rates well above the µ
max of yeast were also evaluated.
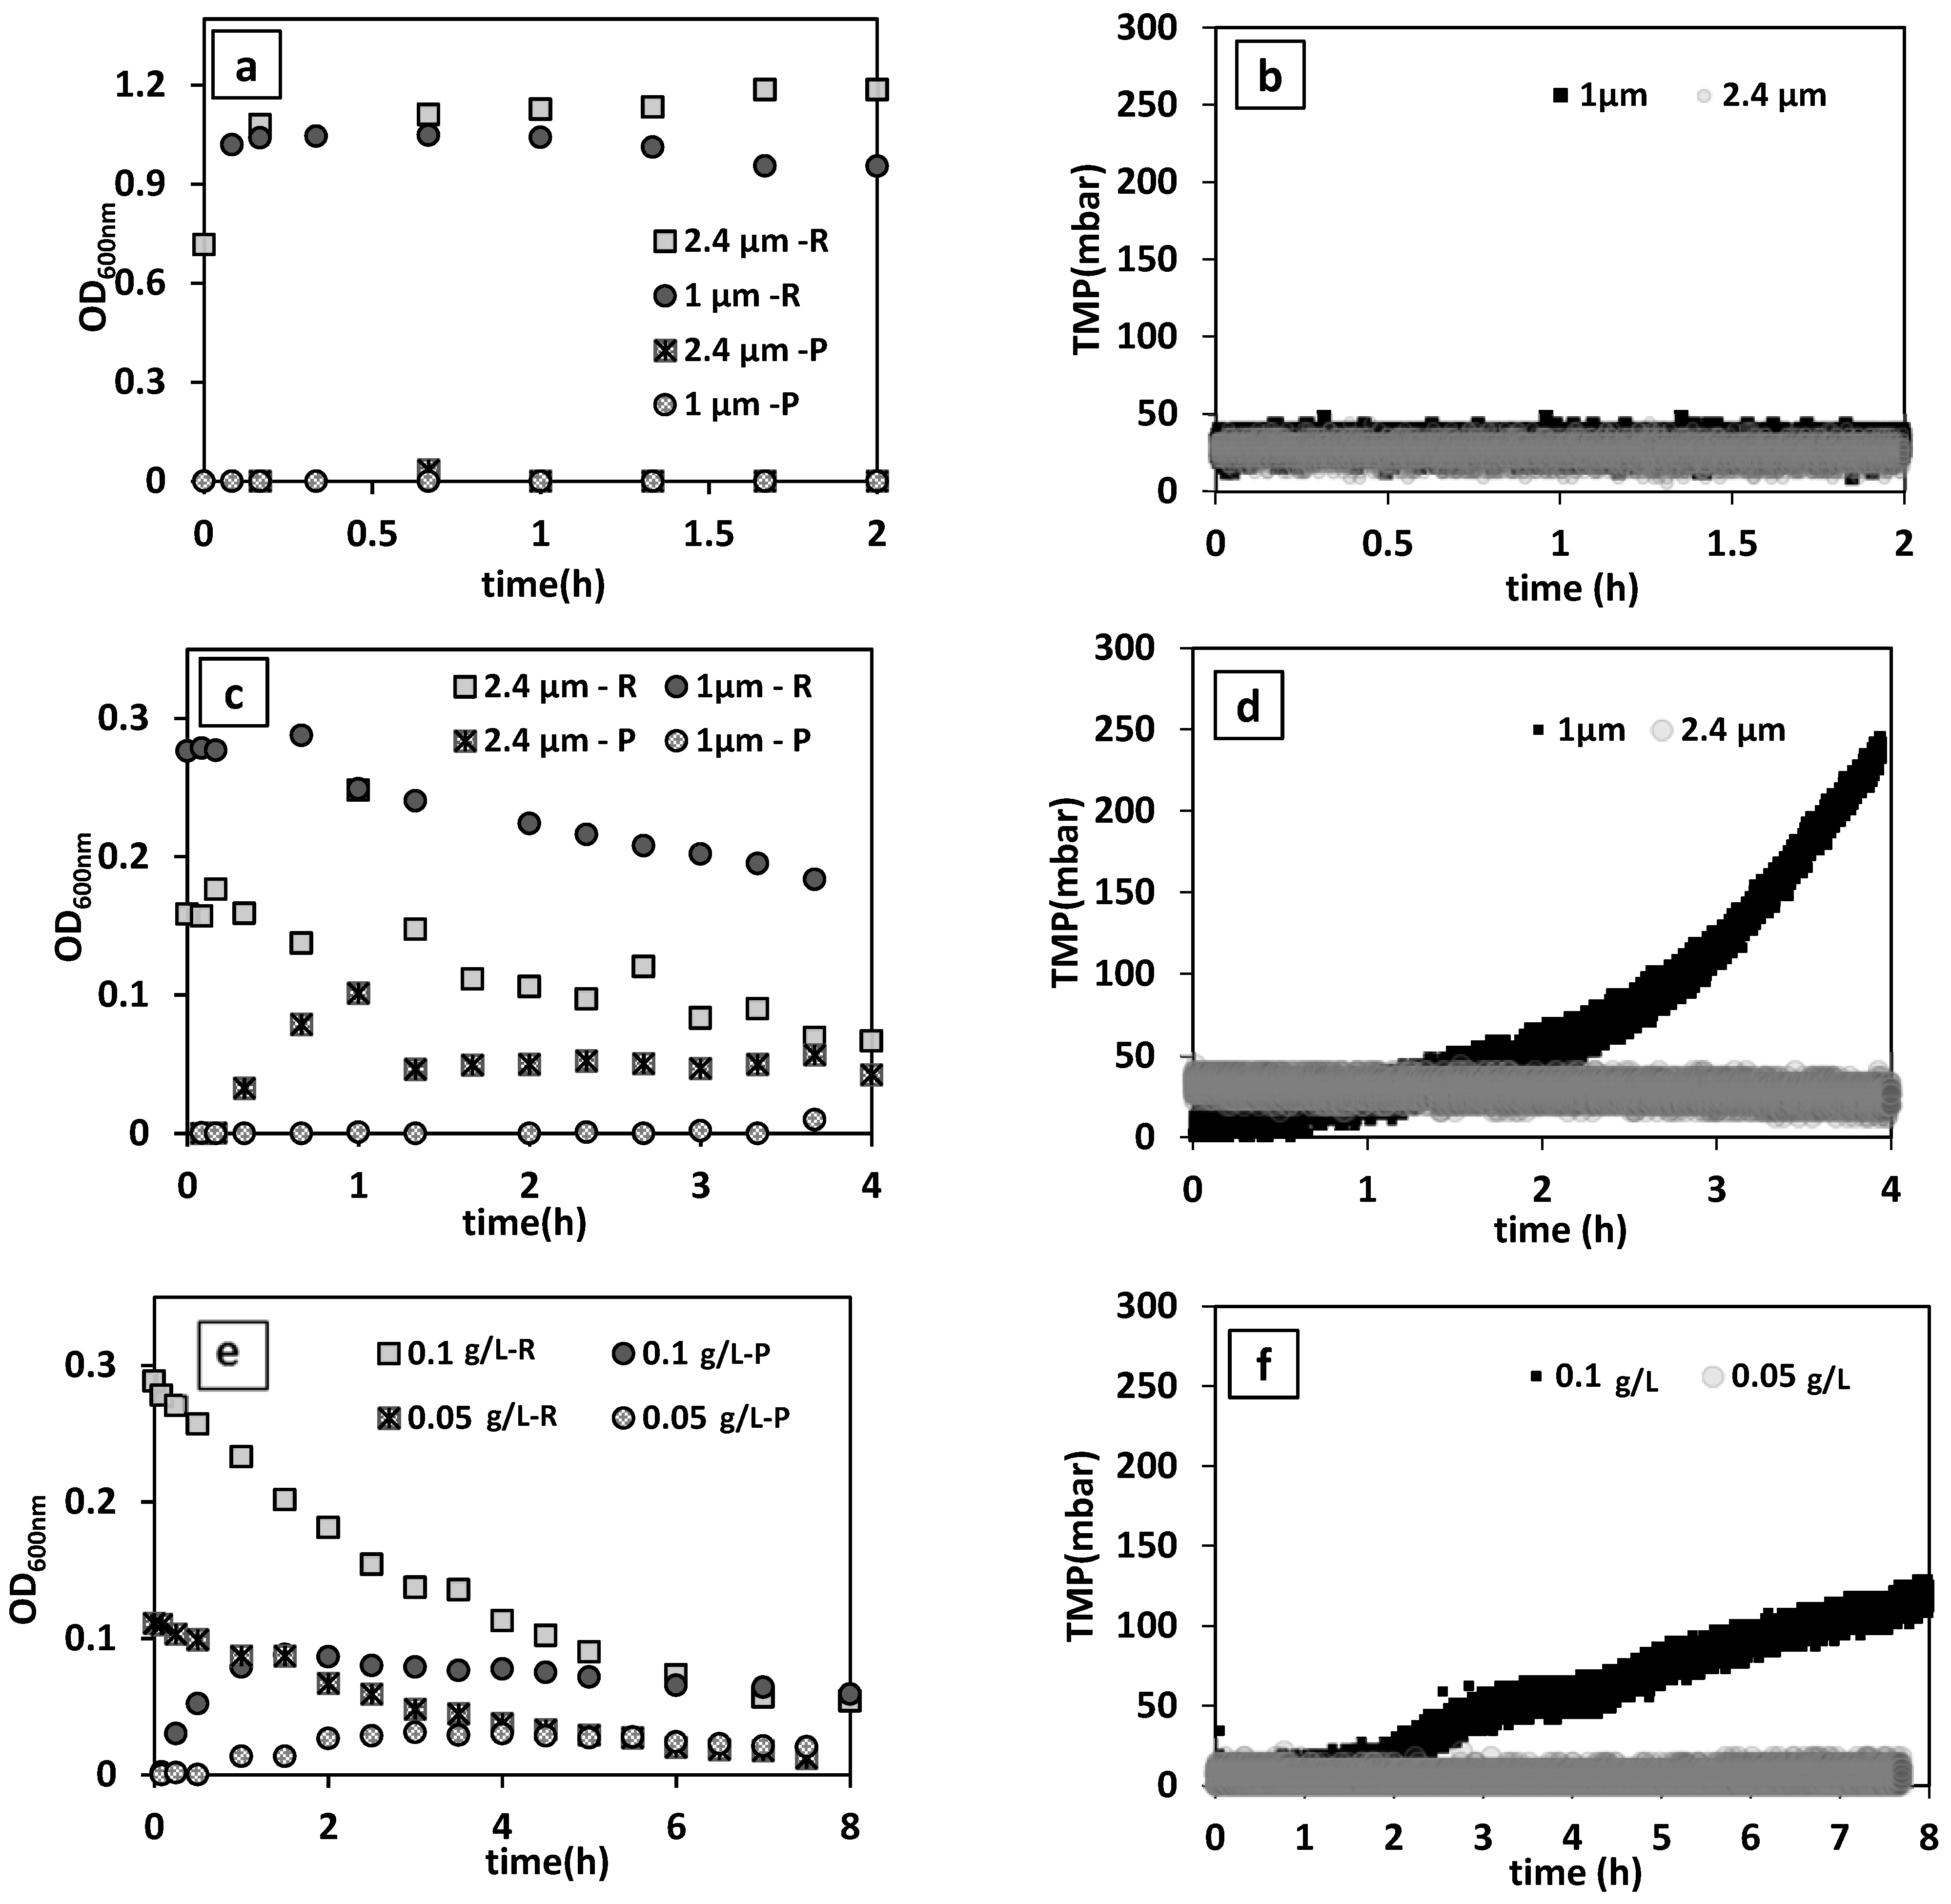
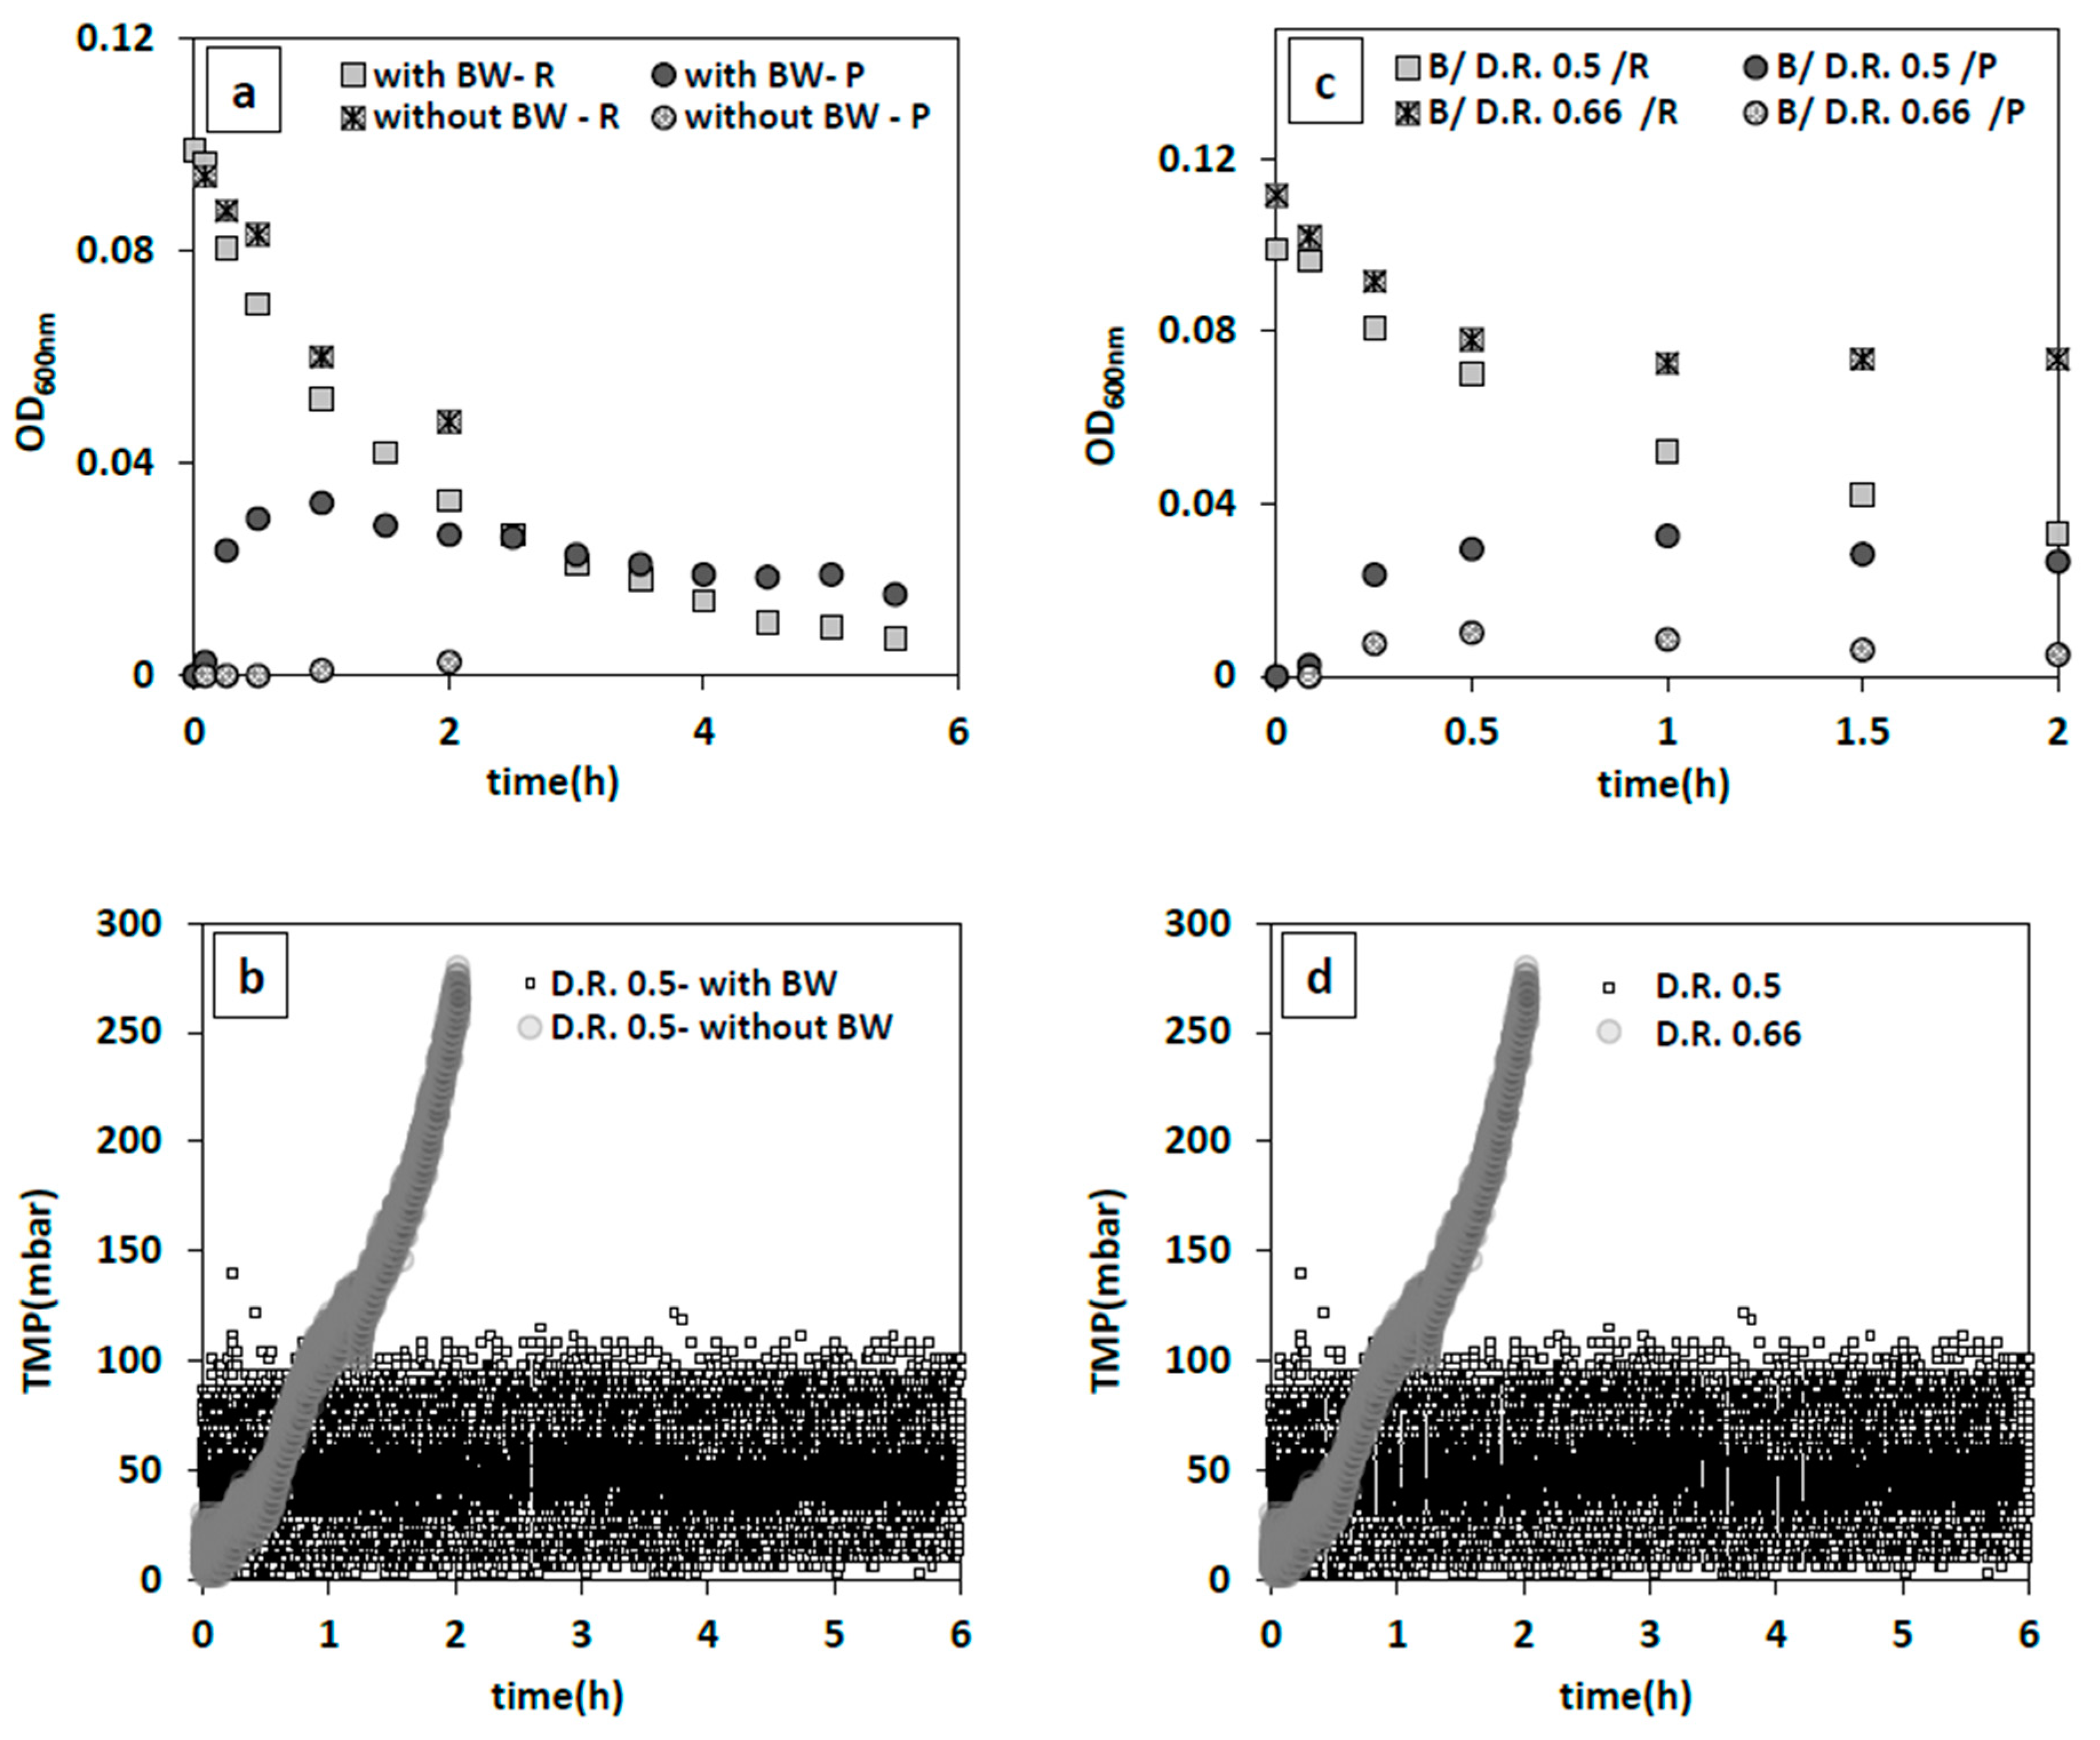
Figure 3a,b present the changes in the turbidity of reactor and permeate medium and TMP during the filtration of yeast suspension. For both membrane pore sizes, nearly stable TMP and permeate flow rates were recorded. This indicates that there was no considerable fouling or cake layer formation on the membrane surface in this filtration condition with 0.5 1/h dilution rate and 0.7 ± 0.14 g/L initial yeast concentration. Furthermore, there was no noticeable change in the permeate and MBR medium turbidity, or in permeate plate counts, confirming that yeast was completely retained inside the reactor. Hence, membranes with both pore sizes were tested for the bacteria removal evaluations.
3.2.2. Bacteria Removal in the iMBR
Bacterial size (length of 0.7–1.2 μm and diameter of 0.3–0.5 μm) has a significant importance for membrane fouling and pore clogging [
27]. In addition to a variation in membrane pore sizes, different permeate fluxes, and TMP were examined to achieve the maximum percentage of bacteria removal with the shortest cycle time possible.
3.2.2.1. The Effect of Membrane Pore Size on Bacteria Removal
The effect of membrane pore sizes (1 µm and 2.4 µm) was examined at an average initial permeate flux of 55.01 ± 0.85 L/h·m
2 (0.25 1/h dilution rate). As shown in
Figure 3c,d, there was only a slight decrease in the concentration of bacteria in the reactor medium with the 1 µm pore size membrane, while the turbidity of the permeate stayed at zero. This indicates that bacteria could not be readily washed out across the membrane pores and their deposition on membrane surface and pores caused pore clogging and/or membrane fouling, as evidenced by the increased TMP. While it has been reported that the flexibility of the peptidoglycan cell wall of Gram-negative bacteria (e.g.,
E. cloacae) may allow deformation and penetration across the membrane to some extent [
28,
29], the results of our tests proved otherwise. In contrast, with the membrane of 2.4 µm pore size, a noticeable decreasing and increasing trend in the concentration of bacteria in the reactor medium and permeate was observed, respectively. Moreover, a stable TMP during filtration indicates that bacteria were effectively washed out without severe membrane-bacteria interaction. This membrane was, therefore, chosen for all other experiments.
3.2.2.2. The Effect of Initial Inoculum Size on Bacterial Removal
In industrial fermentation systems, the initial concentration of bacterial contaminants is about 10
5–10
8 colony forming units (CFU) per ml [
4,
30]. However, if the process is ran in batch mode the propagation of contamination occurs at an accelerated pace and this leads to the loss of nutrients, low product yield and product quality deterioration. In order to have an understanding of the maximum starting inoculum size which does not cause extensive membrane fouling and can be washed out effectively before complete bacterial breakout, filtration performance was evaluated at a starting dilution rate of 0.25 1/h by inoculating the MBR containing PBS with either 0.1 g/L (~1.4 × 10
9 CFU) or 0.05 g/L of
E. cloacae.
The results showed a remarkable 89% reduction in bacteria concentration when the inoculum concentration was 0.05 g/L (
Figure 3e). However, a two-fold higher inoculum concentration of 0.1 g/L caused progressive elevation in TMP (
Figure 3f).
3.2.2.3. The Effect of Dilution Rate, Backwash and Membrane Surface Area on Bacteria Removal
A higher dilution rate and filtration flux is desirable because it raise the productivity in continuous fermentation processes [
24,
31]. However, for every membrane filtration system there is a critical flux below which extensive cake layer formation and fouling can be prevented [
32]. Hence, the optimum operable flux for a given iMBR set-up has to be determined. To this end, various dilution rates of 0.25, 0.5, 0.66 1/h were examined using the same inoculum size of 0.05 g/L with and without backwashing. While a dilution rate of 0.25 1/h (permeate flux ~55 L/h·m
2) yielded favorable results as mentioned in
Section 3.2.2.1, this was no longer the case at the higher permeate fluxes (~112–145 L/h·m
2). These induced greater fouling tendency as the TMP showed a dramatic jump up to 280 mbar in only 2 h (
Figure 4b). Apparently, quick formation of a cake layer hindered effective removal of bacteria, because only 49% reduction in the reactors initial bacterial population was observed (
Figure 4a). As there are minimal changes in the turbidity of the permeate (
Figure 4a), the reported decrease in bacteria concentration in the main reactor must probably be attributed to the attachment/deposition of bacterial cake on the membrane surface [
33,
34].
The surface condition of an immersed membrane directly affects its filtration capability [
25]. In order to keep the membrane surface clean and prevent fouling, backwashing is an effective physical cleaning remedy [
34]. Hence, 2 different backwashing regimes were applied: 3.5 min forward flow, and 0.5 min backwash (4 min cycle) at a dilution rate 0.5 1/h (109 L/h·m
2), and a more frequent backwash of 2.5 min forward flow plus 0.5 min backwash (3 min cycle) at a higher dilution rate of 0.66 1/h (144 L/h·m
2). In the latter case, TMP stayed nearly constant at 90 mbar following an increase and flowrate was stable (
Figure 4d), while it did not result in a considerable drop in bacteria concentration (34%) (
Figure 4c). Consequently, a more frequent cleaning of the membrane surface could not compensate the effect of a higher dilution rate of 0.66 1/h compared to 0.5 1/h in the tested range and at the tested backwash rates. Therefore, a 0.5 1/h dilution rate combined with a 4 min backwash cycle proved to be the most desirable out of the tested filtration conditions leading to an optimum bacteria removal of 93%.
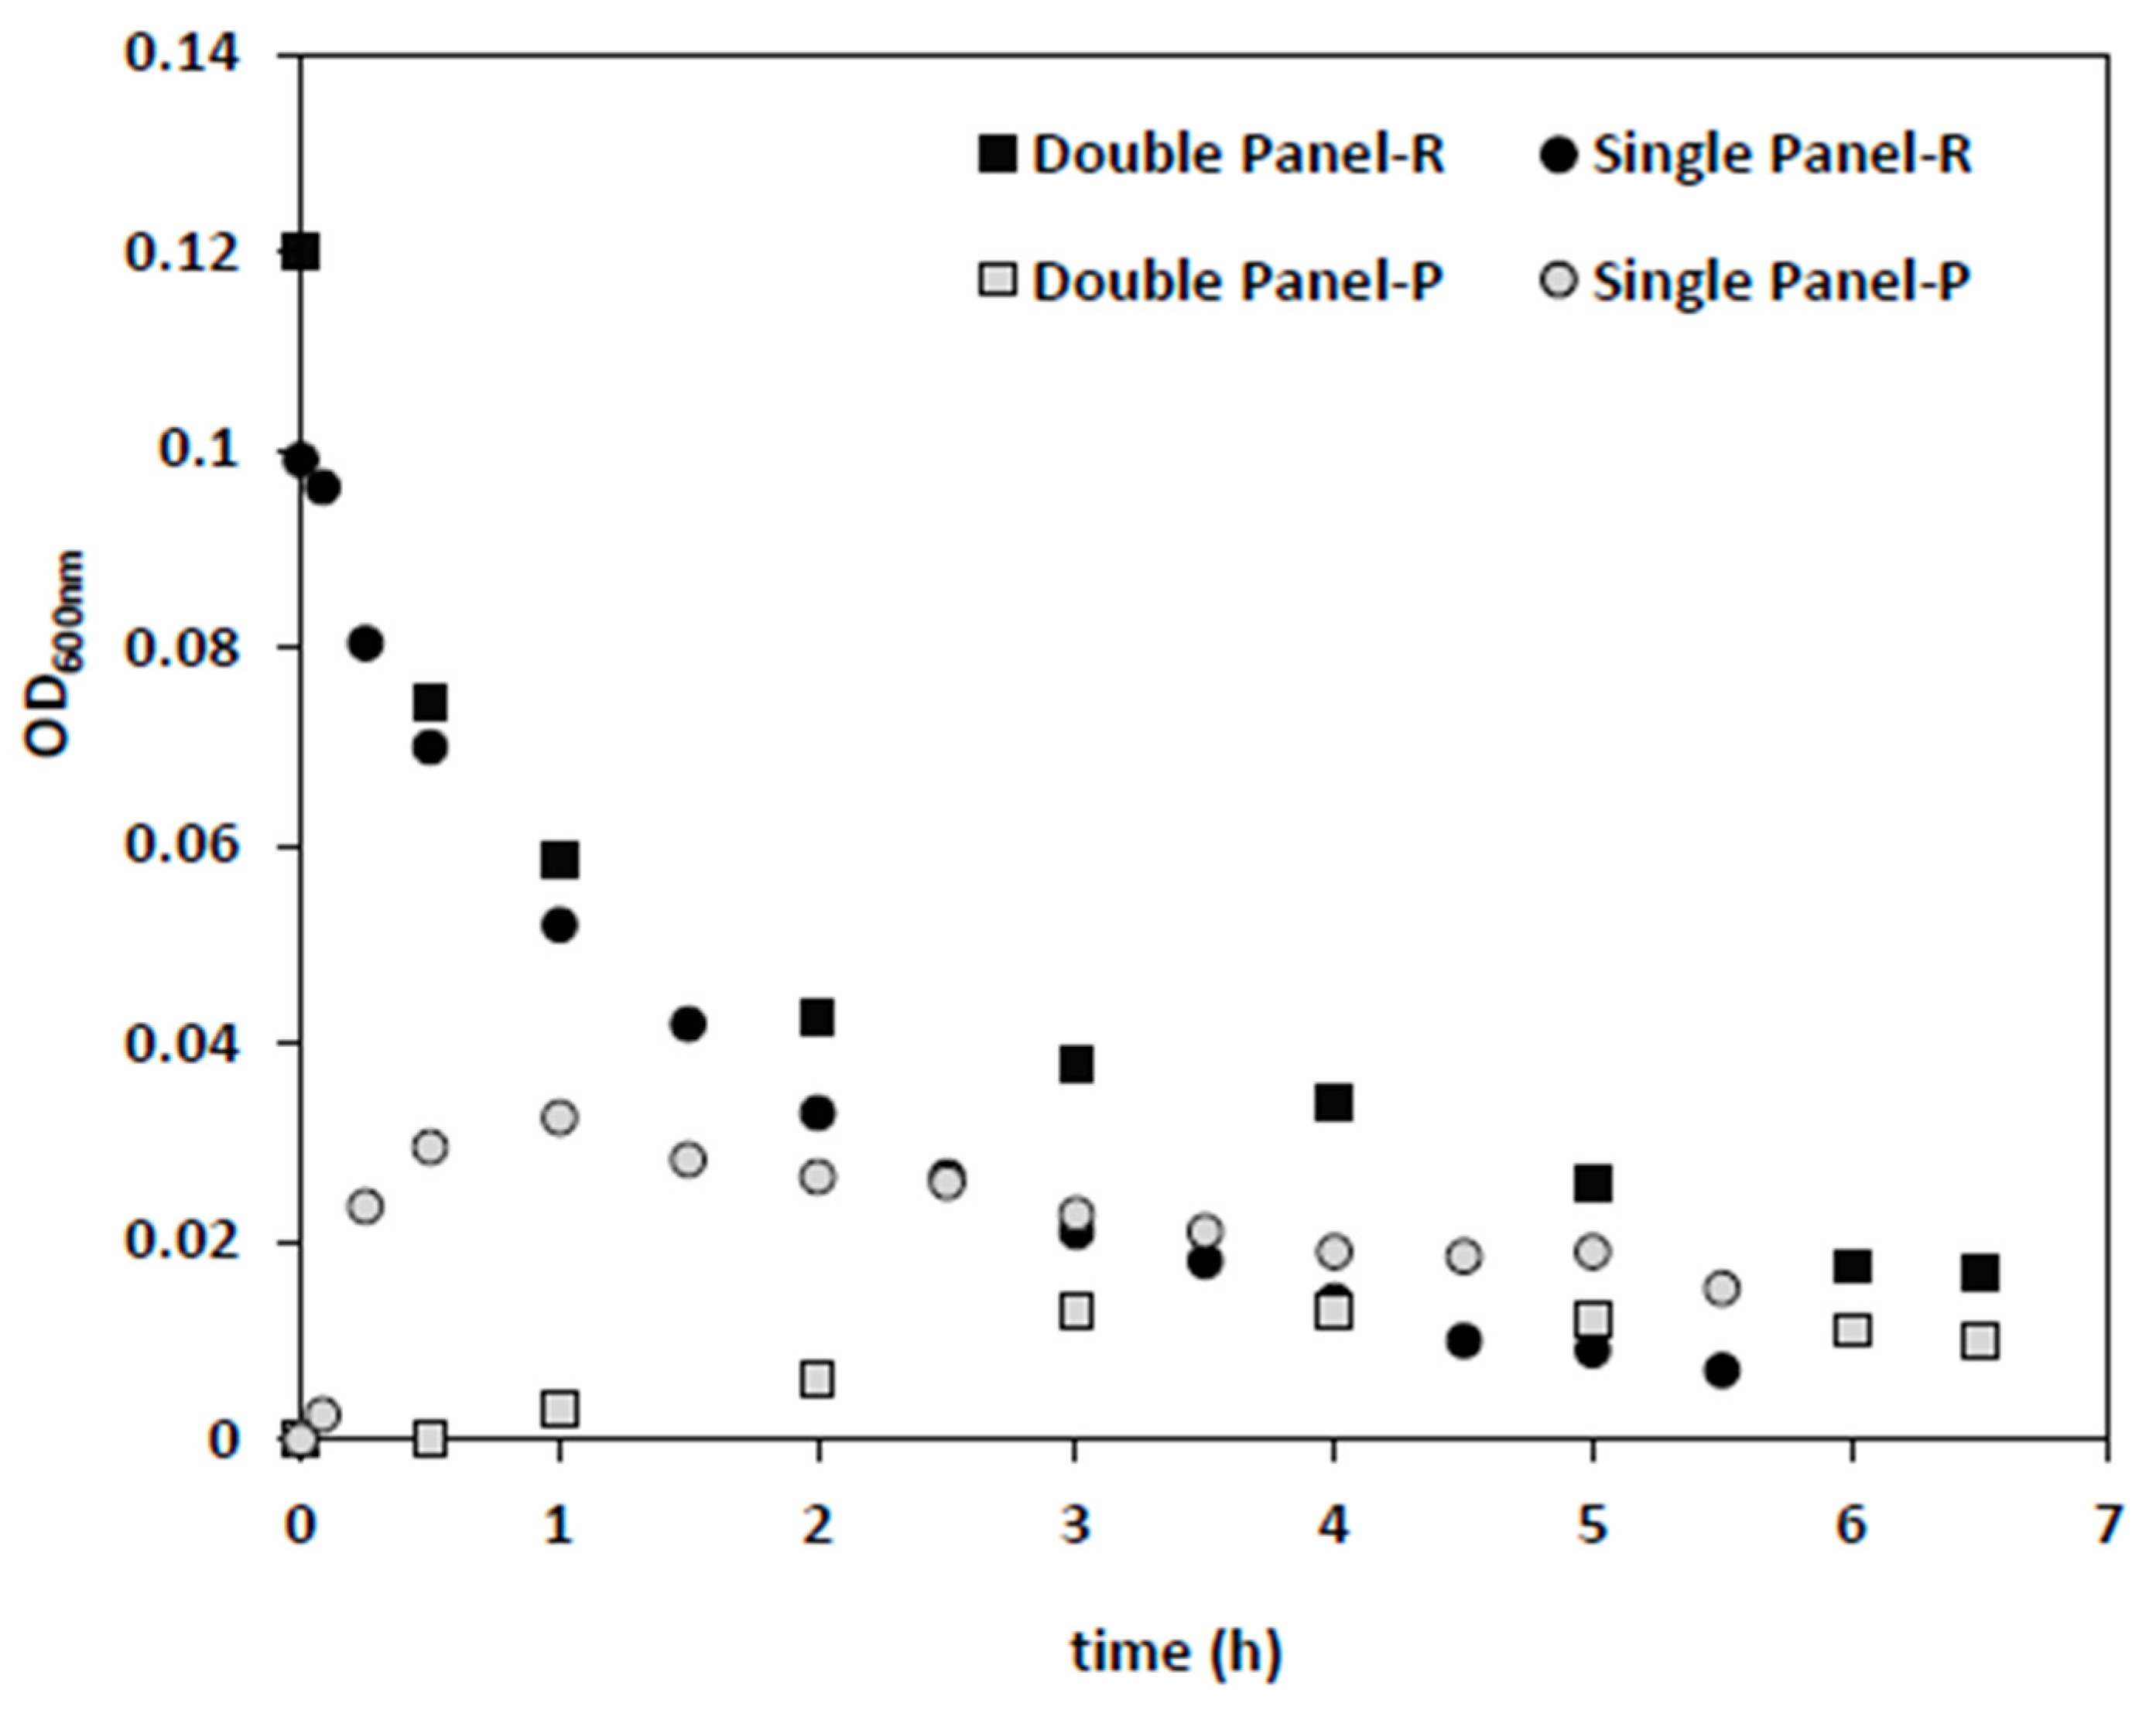
In the next step, single and double membrane panels were applied under the same conditions (dilution rate of 0.5 1/h, backwash cycle of 4 min), with 0.042 g/L (~0.6 × 10
9 CFU) and 0.033 g/L (~0.5 × 10
9 CFU) initial bacteria concentration (
Figure 5). Since permeate flow was the same in both conditions, the flux applied on a single panel (145 L/h·m
2) membrane was twice that of the double panel (73 L/h·m
2). The same extent of bacteria removal was achieved 1.6-times faster for a single panel (
Figure 5). While the initial drop in reactor biomass levels was similar in both cases, the corresponding increase in permeate optical density was higher in the single panel test, which might be related to the higher fluxes and convective flow.
3.2.2.4. The Effect of Concomitant Presence of Bacteria and Yeast on Bacteria Removal
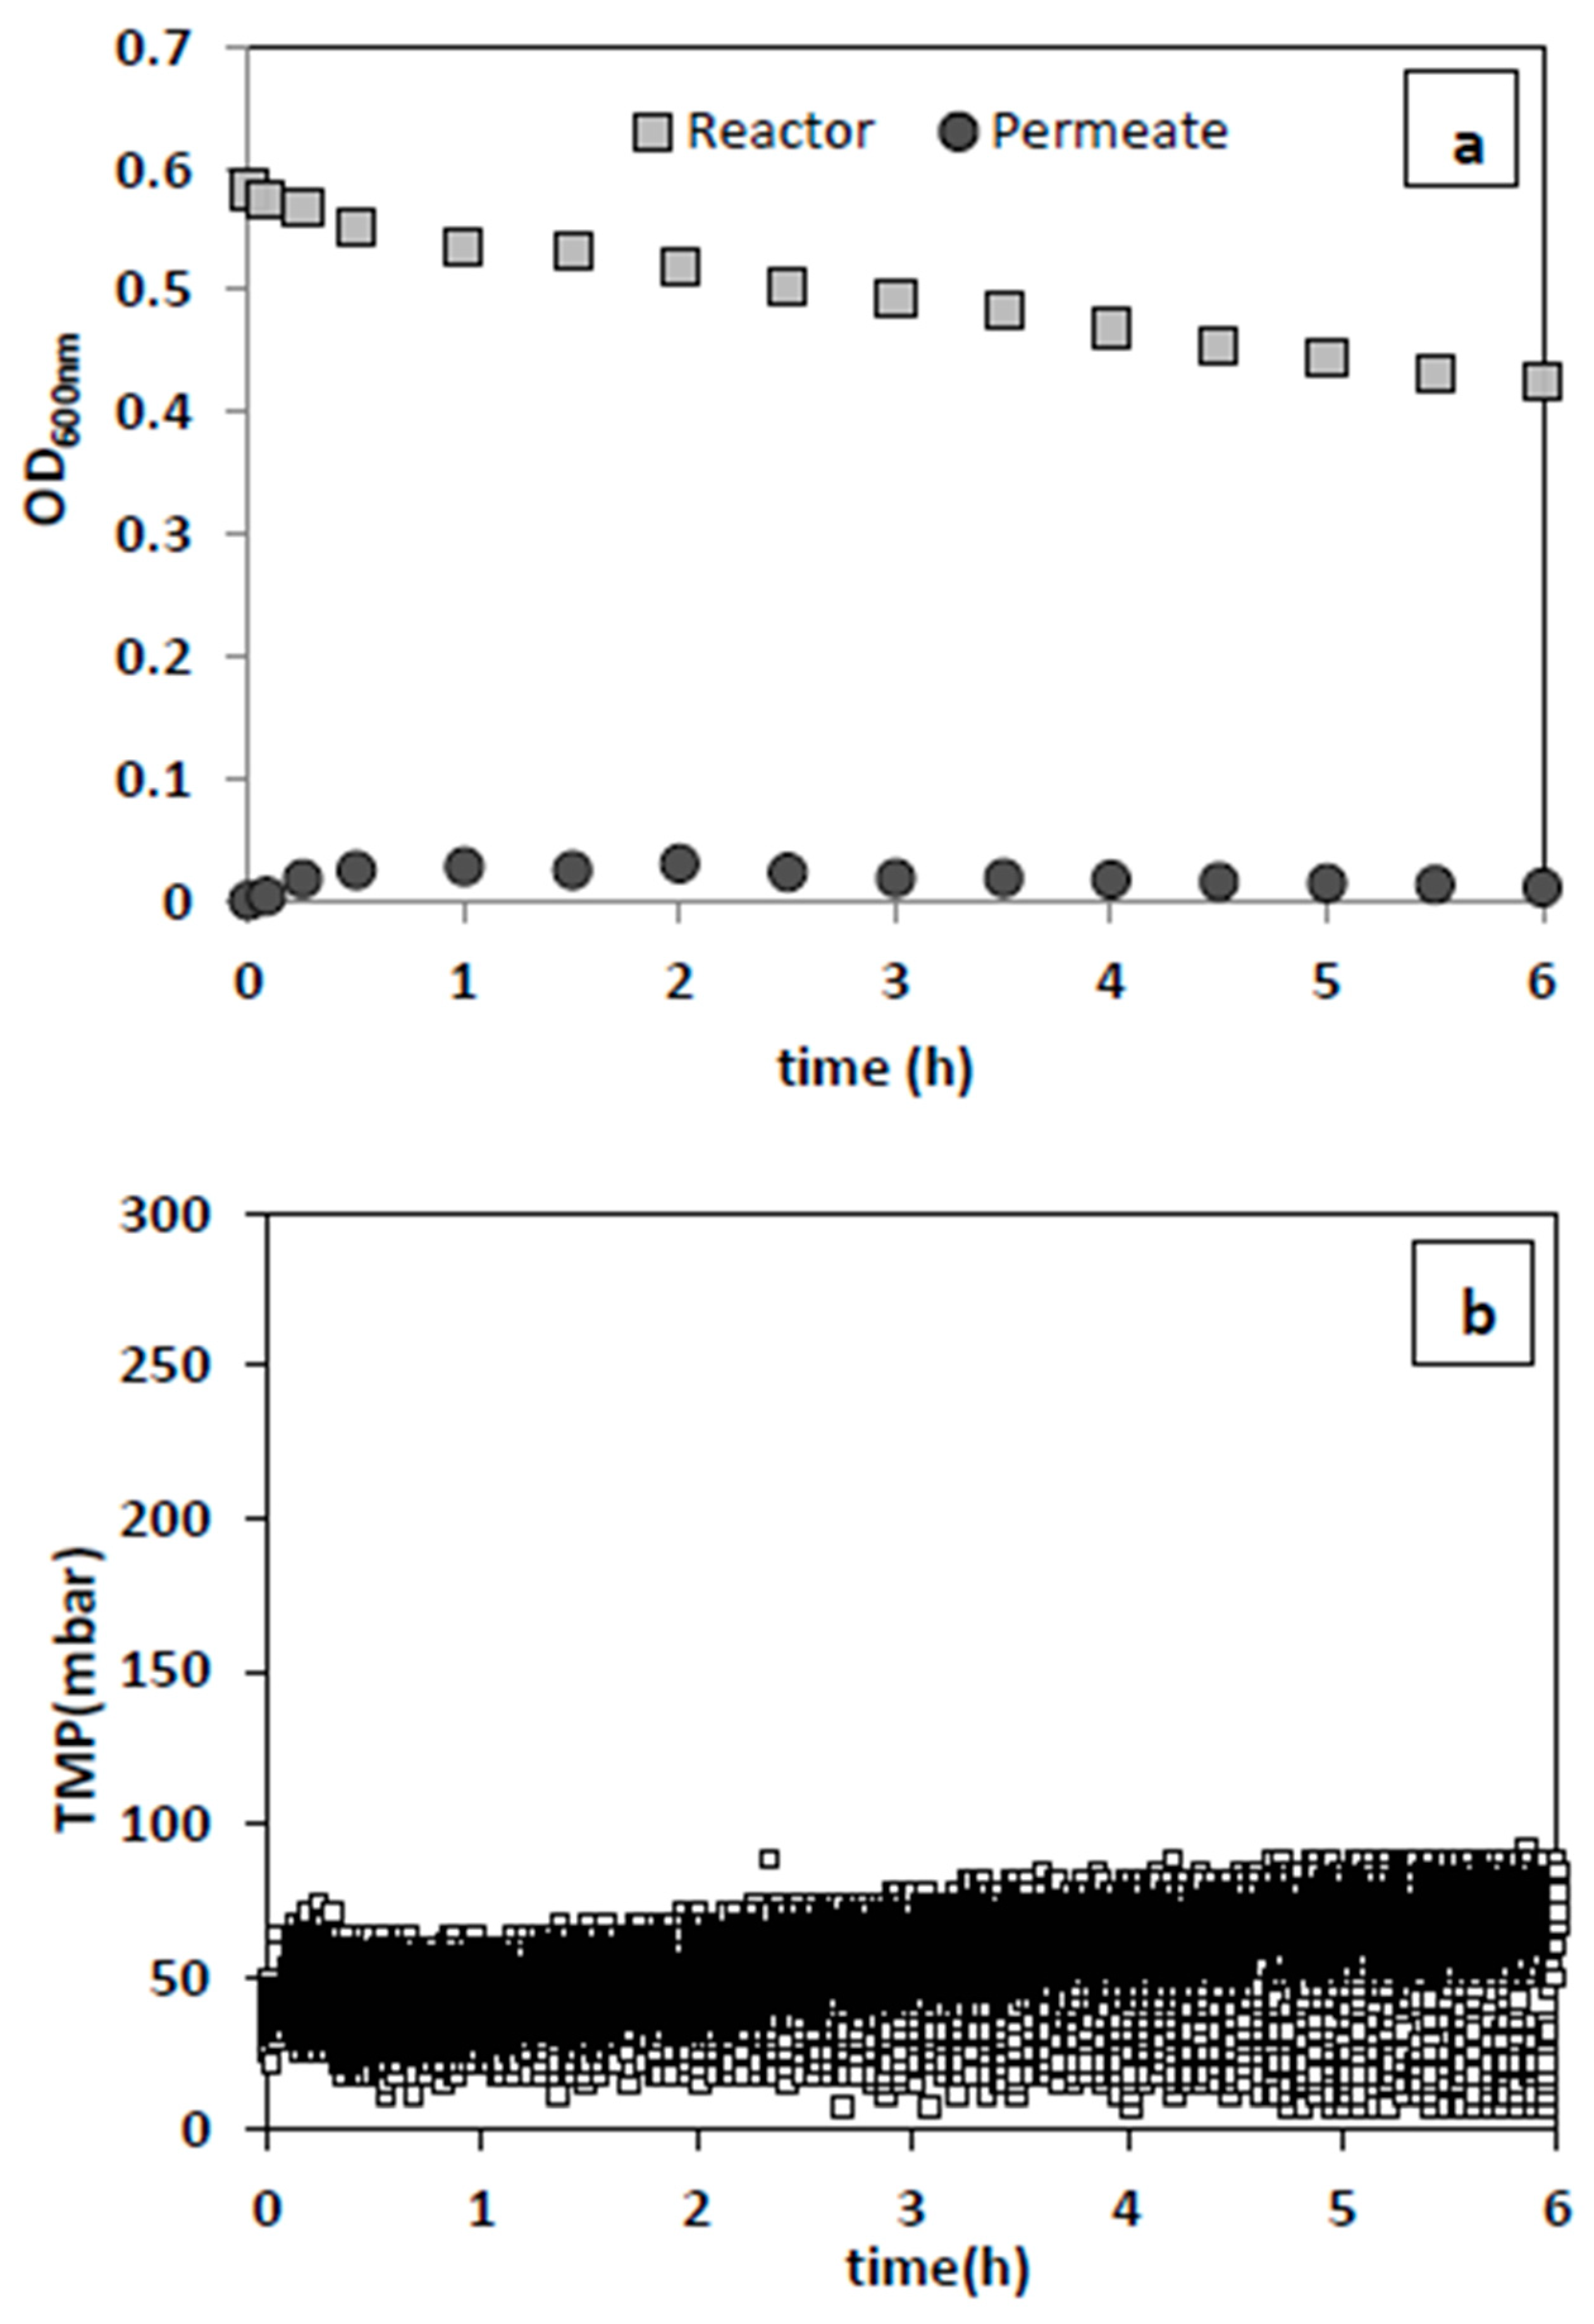
In a condition resembling that of a contaminated fermentation system, bacteria removal was examined in concomitant existence with yeast. The results showed that nearly complete bacteria removal was achieved successfully over 6 h of filtration (
Figure 6a) with a single membrane panel, and the previously proven favorable filtration conditions of 0.5 1/h dilution rate and 4 min backwash cycle. Moreover, a slight increase in TMP (initial increase before reaching a plateau) was observed at an inoculum concentration of bacteria and yeast of 0.067 g/L and 0.173 g/L, respectively (
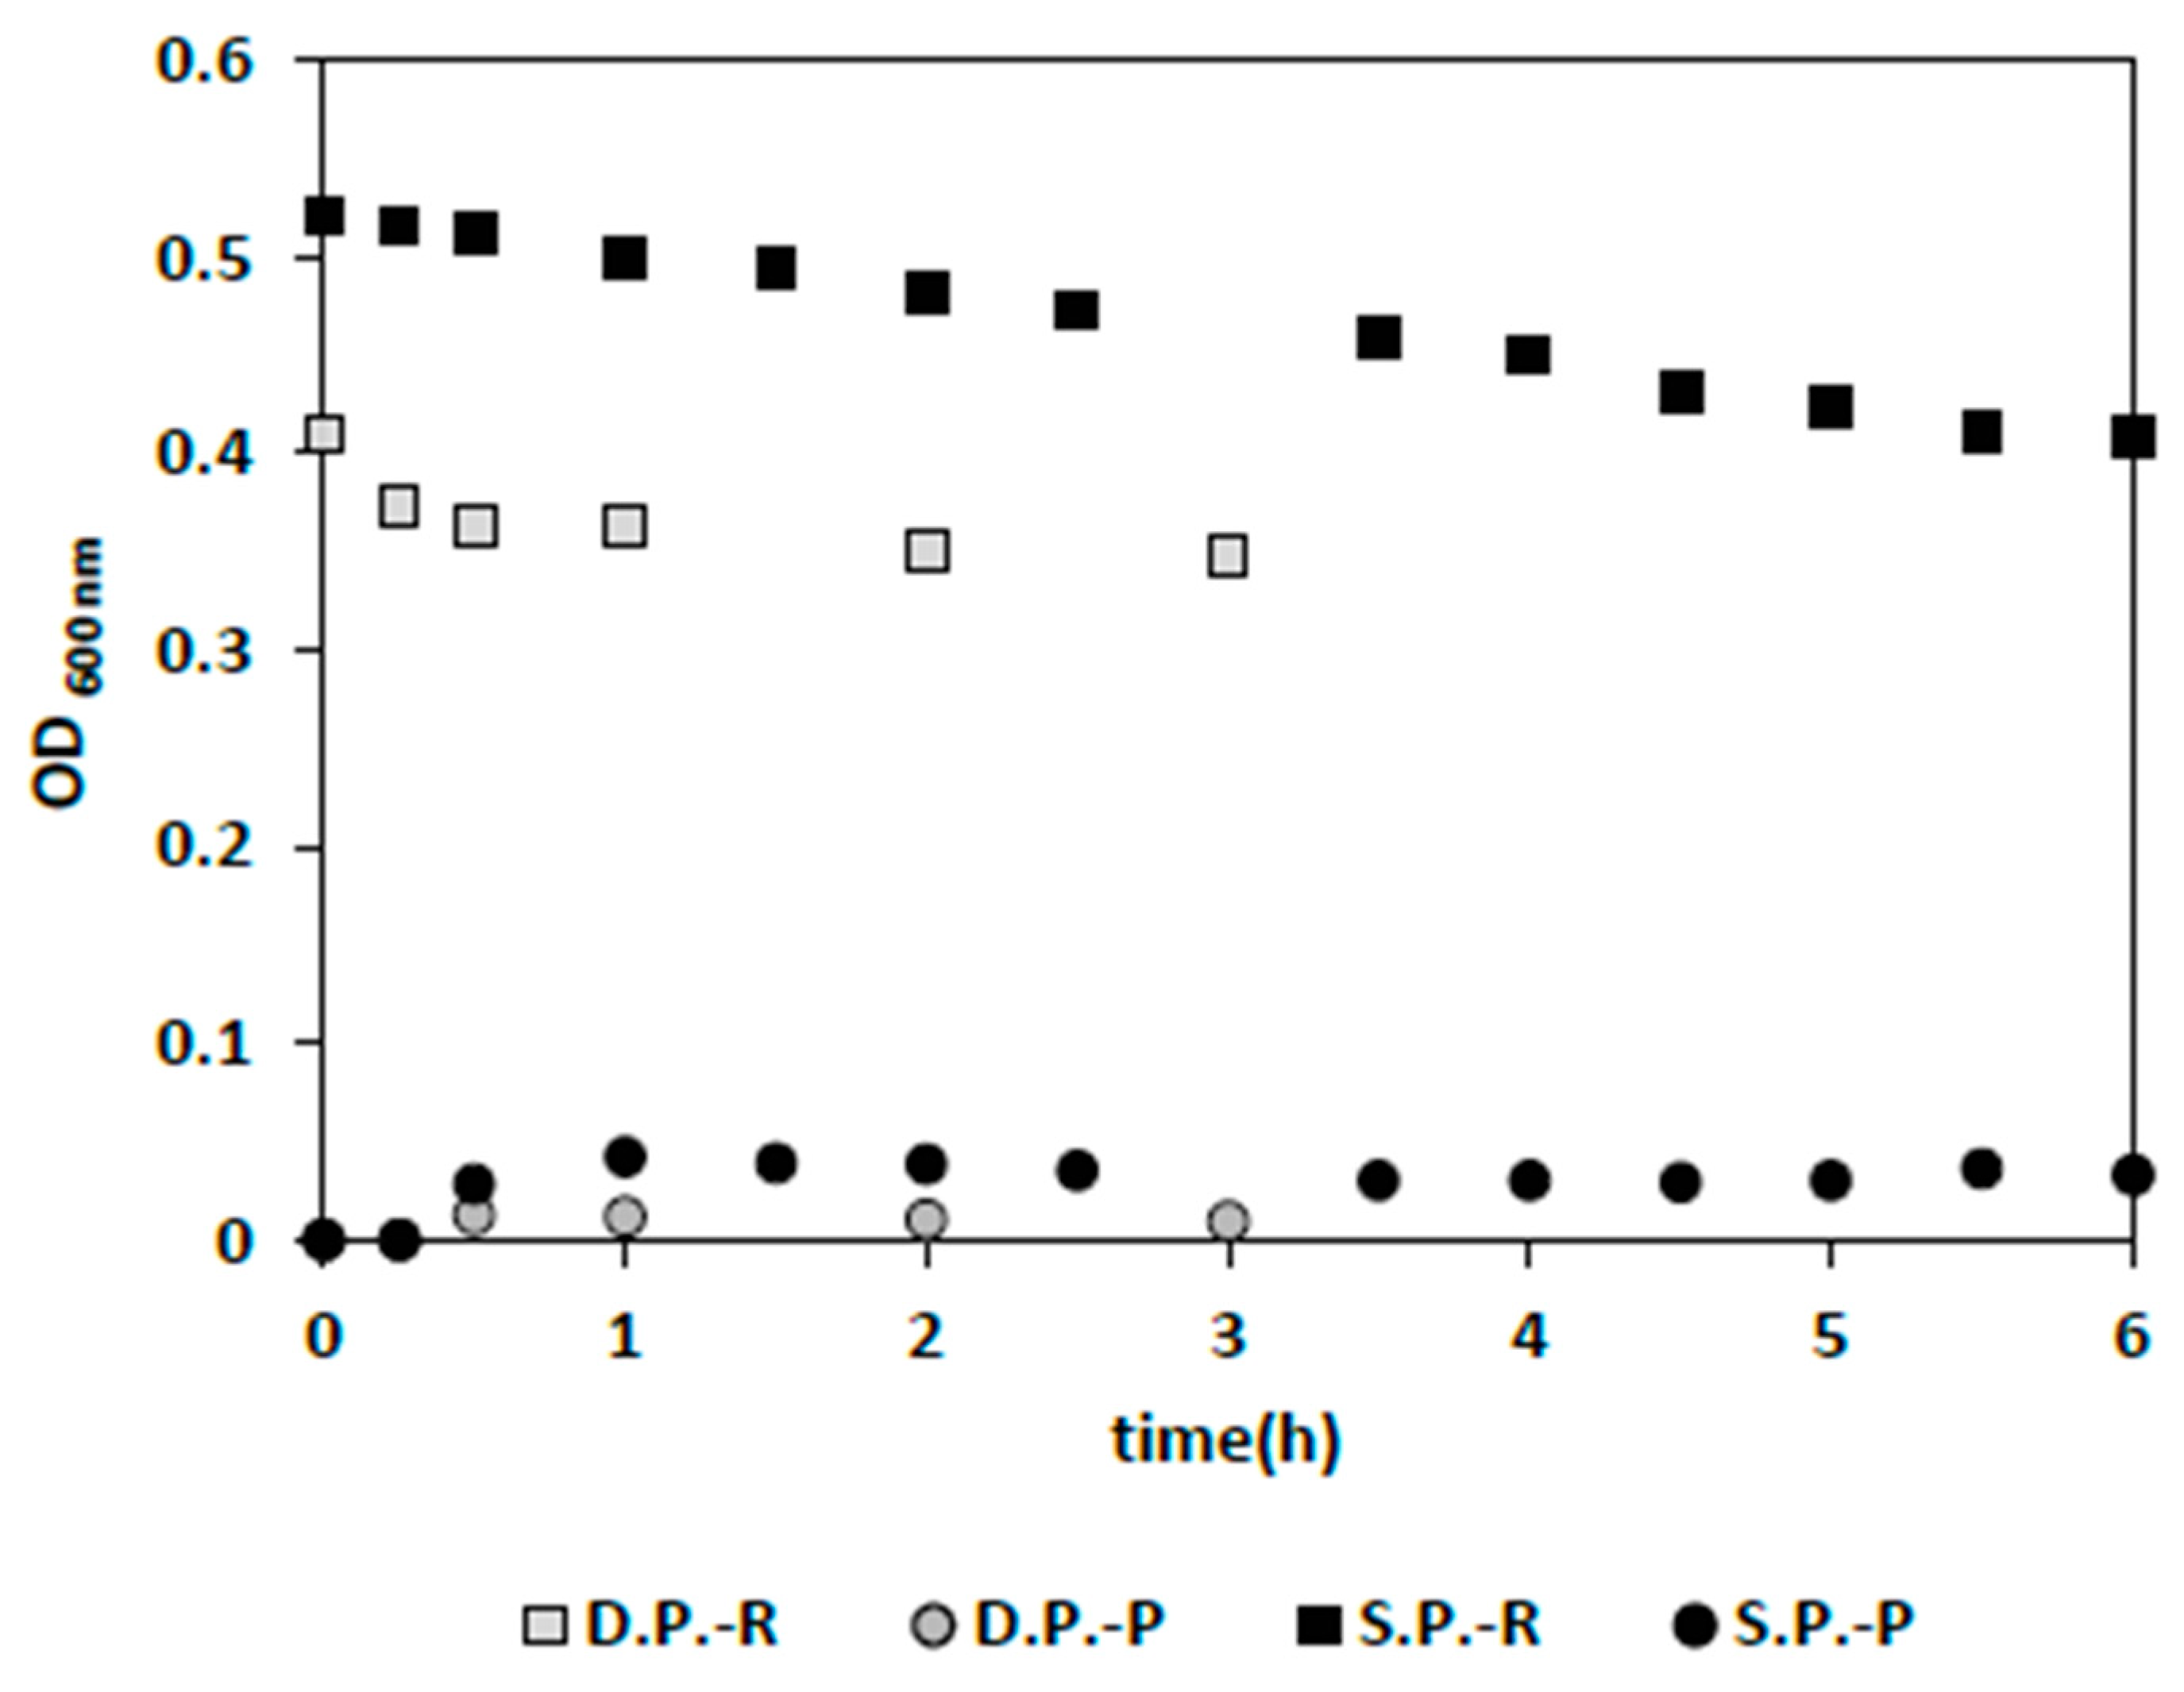
Figure 6b). This exceptionally good bacterial washout in the presence of yeast could be due to the interaction of yeast with the membrane surface or between yeast and bacteria. However, a definite answer cannot be given at this point without thorough membrane surface imaging and analysis. Moreover, when the membrane surface area was doubled using two IPC membrane panels while providing the initial overall permeate flux, complete bacteria washout was achieved in 2 h, which is significantly faster than for a single panel (6 h) (
Figure 7). However, it is noteworthy that having the same flow rate, while increasing the surface area could become problematic for bacterial washout if a proper relation between the bacteria (any suspended particulated matter) permeation velocity (drag) towards the membrane surface and back-transport velocity away from the surface is not met [
25]. Therefore, reduction in flux by increasing the membrane surface area can proceed to the point that back-transport mechanisms do not dominate the direction of the movement of bacteria. This was also observed for the filtration of bacterial culture (
Section 3.2.2.3), where increasing membrane surface area at a fixed permeate flow rate deteriorated washout (
Figure 5).
3.3. The Effect of the Presence of Yeast and Bacteria on the Fermentation Process
Fermentation experiments were conducted to observe the growth characteristics and metabolite productions of both bacteria and yeast as well as to determine the effect of metabolic activity of one microorganism on that of the other. As is in batch fermentations, these experiments also provided an insight in yeast behavior under accumulated acetate levels. Separate bacteria or yeast cultures, or combined bacteria and yeast cultures were cultivated in batch mode with semi-synthetic medium (
Section 2.5.3) (
Figure 8).
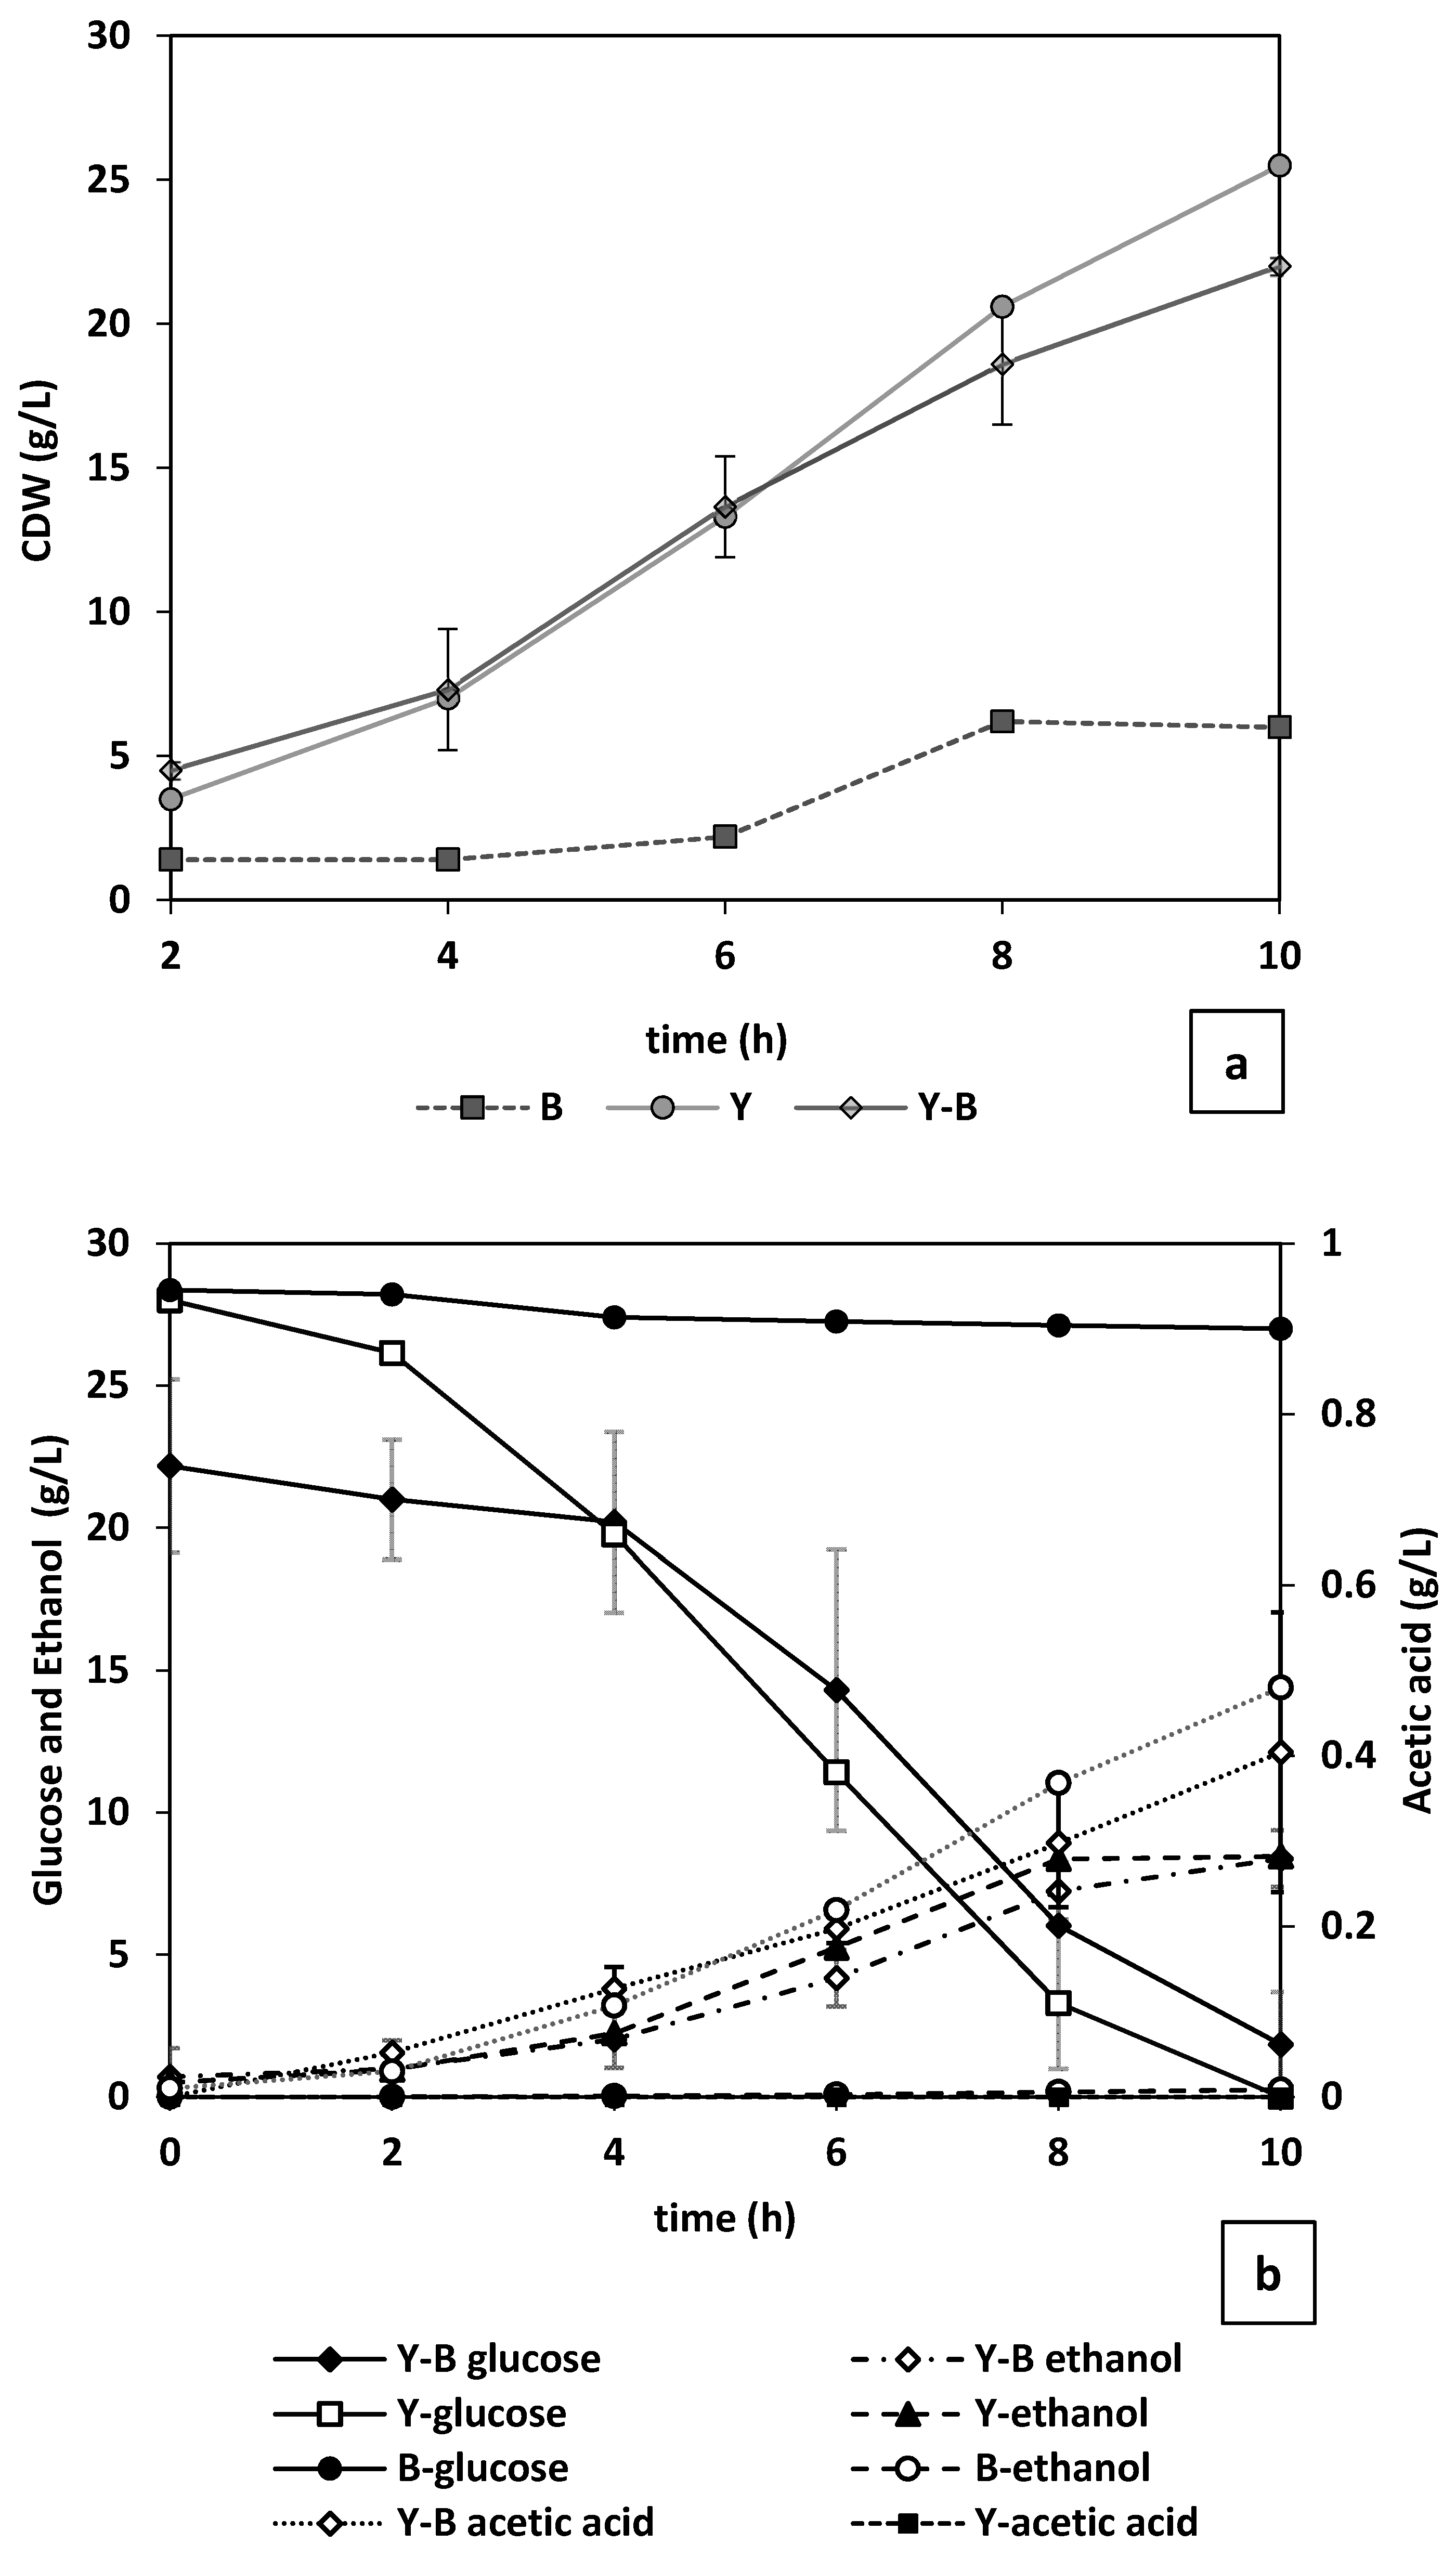
Through dry mass measurements, it was observed that, although yeast started growing without a lag phase, noticeable change in
E. cloacae only occurred after the first 6 h from the start of the cultivation (
Figure 8a). Considering that in a mixed culture there is competition over nutrient consumption, the final biomass concentration acquired in pure yeast culture (25.5 g/L) was higher than that of the mixed culture (22 g/L). As seen in
Figure 8b, this nutrient consumption competition is mostly focused on the present nitrogen sources (yeast extract, peptone etc.) as the changes in the glucose concentration during cultivation of only bacteria was minimal (4.5%) (
Figure 8b). Where yeast and bacteria are cultivated together or when yeast is cultivated solely, more than 96% of the glucose content of the reactor is depleted within the first 10 h. The trend of glucose consumption for the mixed culture followed a less steep decline with more residual glucose (4%) after 10 h of cultivation. This could be the effect of acetic acid produced by bacteria on yeast energy level (in form of ATP) and therefore cell growth [
35]. The competition over the nutrients is the reason for the 2-fold higher acetate concentration in the bacterial culture (0.48 g/L) compared with mixed culture (
Figure 8b). In addition, it could be perceived that the increase in cell dry mass in the mixed cultures after the 6th hour is attributed to yeast growth (
Figure 8a).
As illustrated in
Figure 8b, regardless of the presence of bacteria in the medium, nearly similar final (10 h) concentrations of ethanol (9 g/L) were achieved. However, in the culture with only yeast the maximum level of ethanol is reached after 8 h. It is concluded from the changes in metabolites during bacteria cultivation that the complex inoculum mostly included homofermentative bacteria producing acetic acid (
Figure 8b). No ethanol and lactic acid was detected.
3.4. Bacteria Decontamination during Fermentation in MBR
In the previous sections, filtration of microbial cell suspensions was studied in PBS medium, which preserves cell viability while negligible growth occurs. The ultimate goal is, however, to investigate bacterial washout under actual fermentation conditions, on a growth-supporting semi-synthetic medium.
The Effect of Inoculum Size and Dilution Rate on Bacteria Decontamination
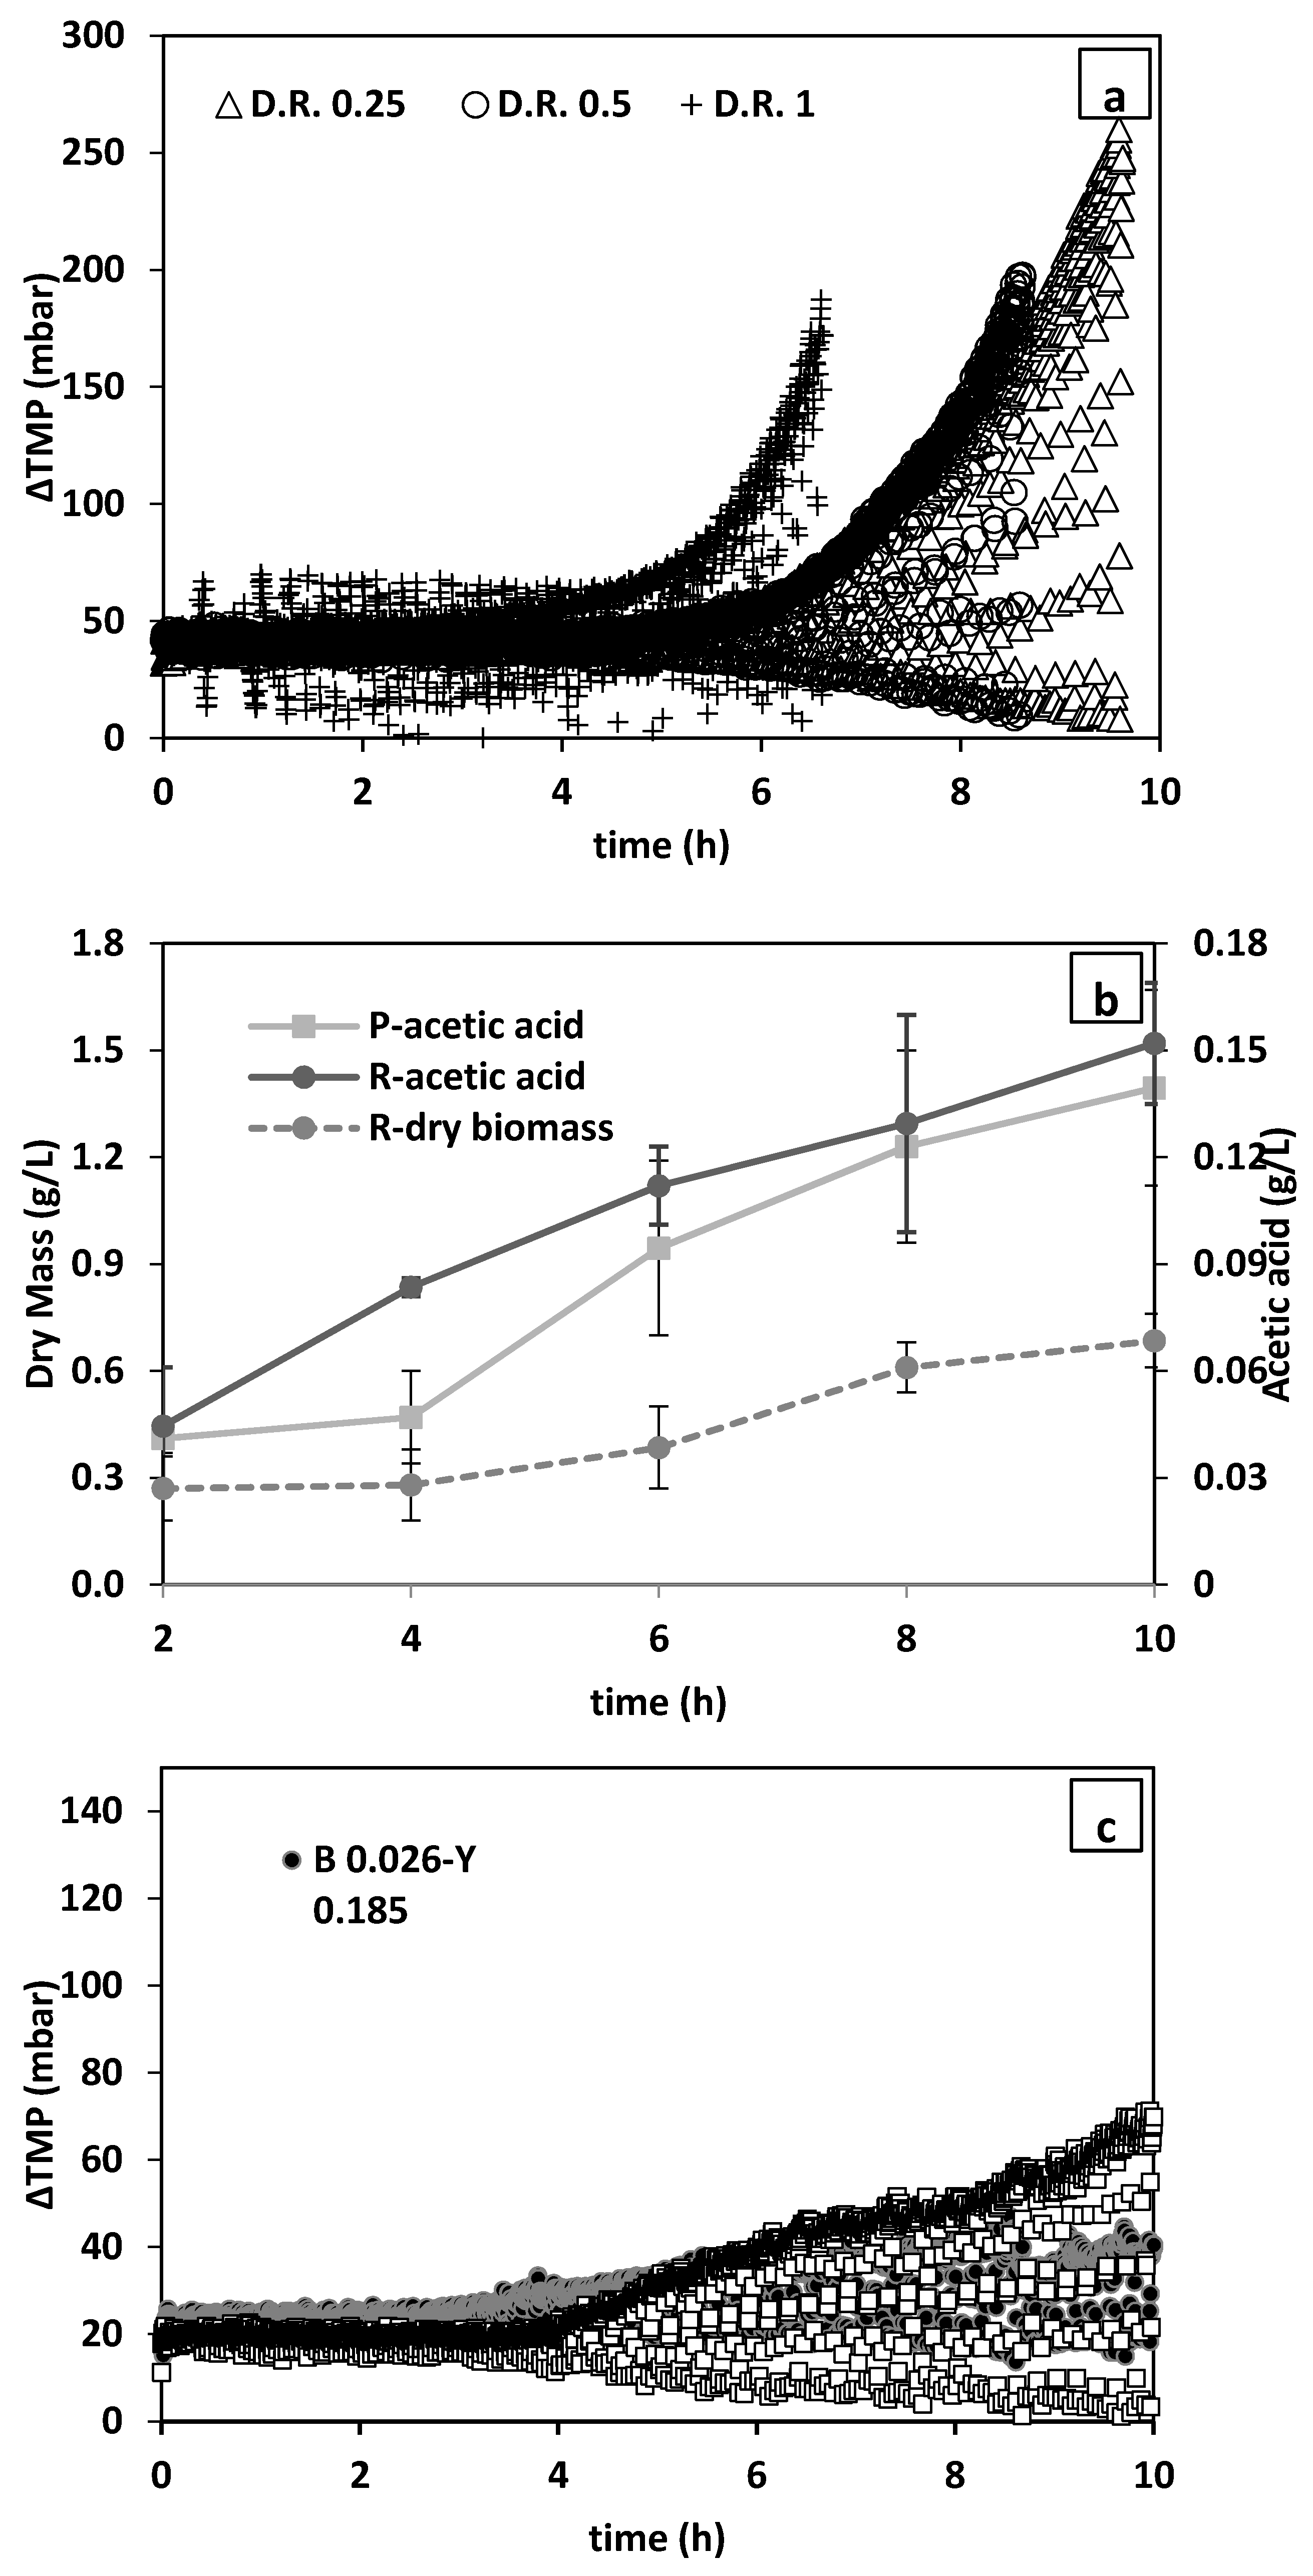
In the first stage, the reactor was only inoculated with only bacteria (0.001 g/L ≈ 0.1 × 10
9 CFU) and different dilution rates of 1, 0.5, and 0.25 1/h were applied during filtration to investigate the effect of permeate flux on bacteria removal.
Figure 9a shows that in all conditions the pressure began to build up between 4–6 h from the start of the tests, while the rate of TMP increase is faster at higher dilution rates (
Figure 9a). Therefore, the lowest dilution rate of 0.25 L/h (permeate flux ~55 L/h·m
2) was chosen for further tests.
Next, fermentation of a mixed culture (bacteria and yeast) was investigated. Conform the PBS filtration results, the final TMP values were lower for mixed cultures (
Figure 9c) than for pure bacterial cultures (
Figure 9a), even though the overall initial inoculum size of the mixed cultures (0.07–0.211 g/L) (separate bacteria and yeast inoculum size is presented on the figure) (
Figure 9c) was 70 and 200-times higher (
Figure 9a).
The changes in the concentration of biomass in the reactor and the changes in the acetate concentration are presented in
Figure 9b. As can be seen, biomass content constantly inclined. In addition to yeast, bacteria must also have accounted for this growth in biomass as evidenced by the increase in the acetate content of the media (
Figure 9b). It is, however, anticipated that the lower TMP in mixed culture could be due to lower growth of bacteria due to competition over nutrients in addition to the mitigating effect of yeast on membrane surface cake layer formation [
36]. Therefore, bacteria removal prior to bacteria growth breakout should be aimed for to reduce membrane fouling and TMP rise (
Figure 9).
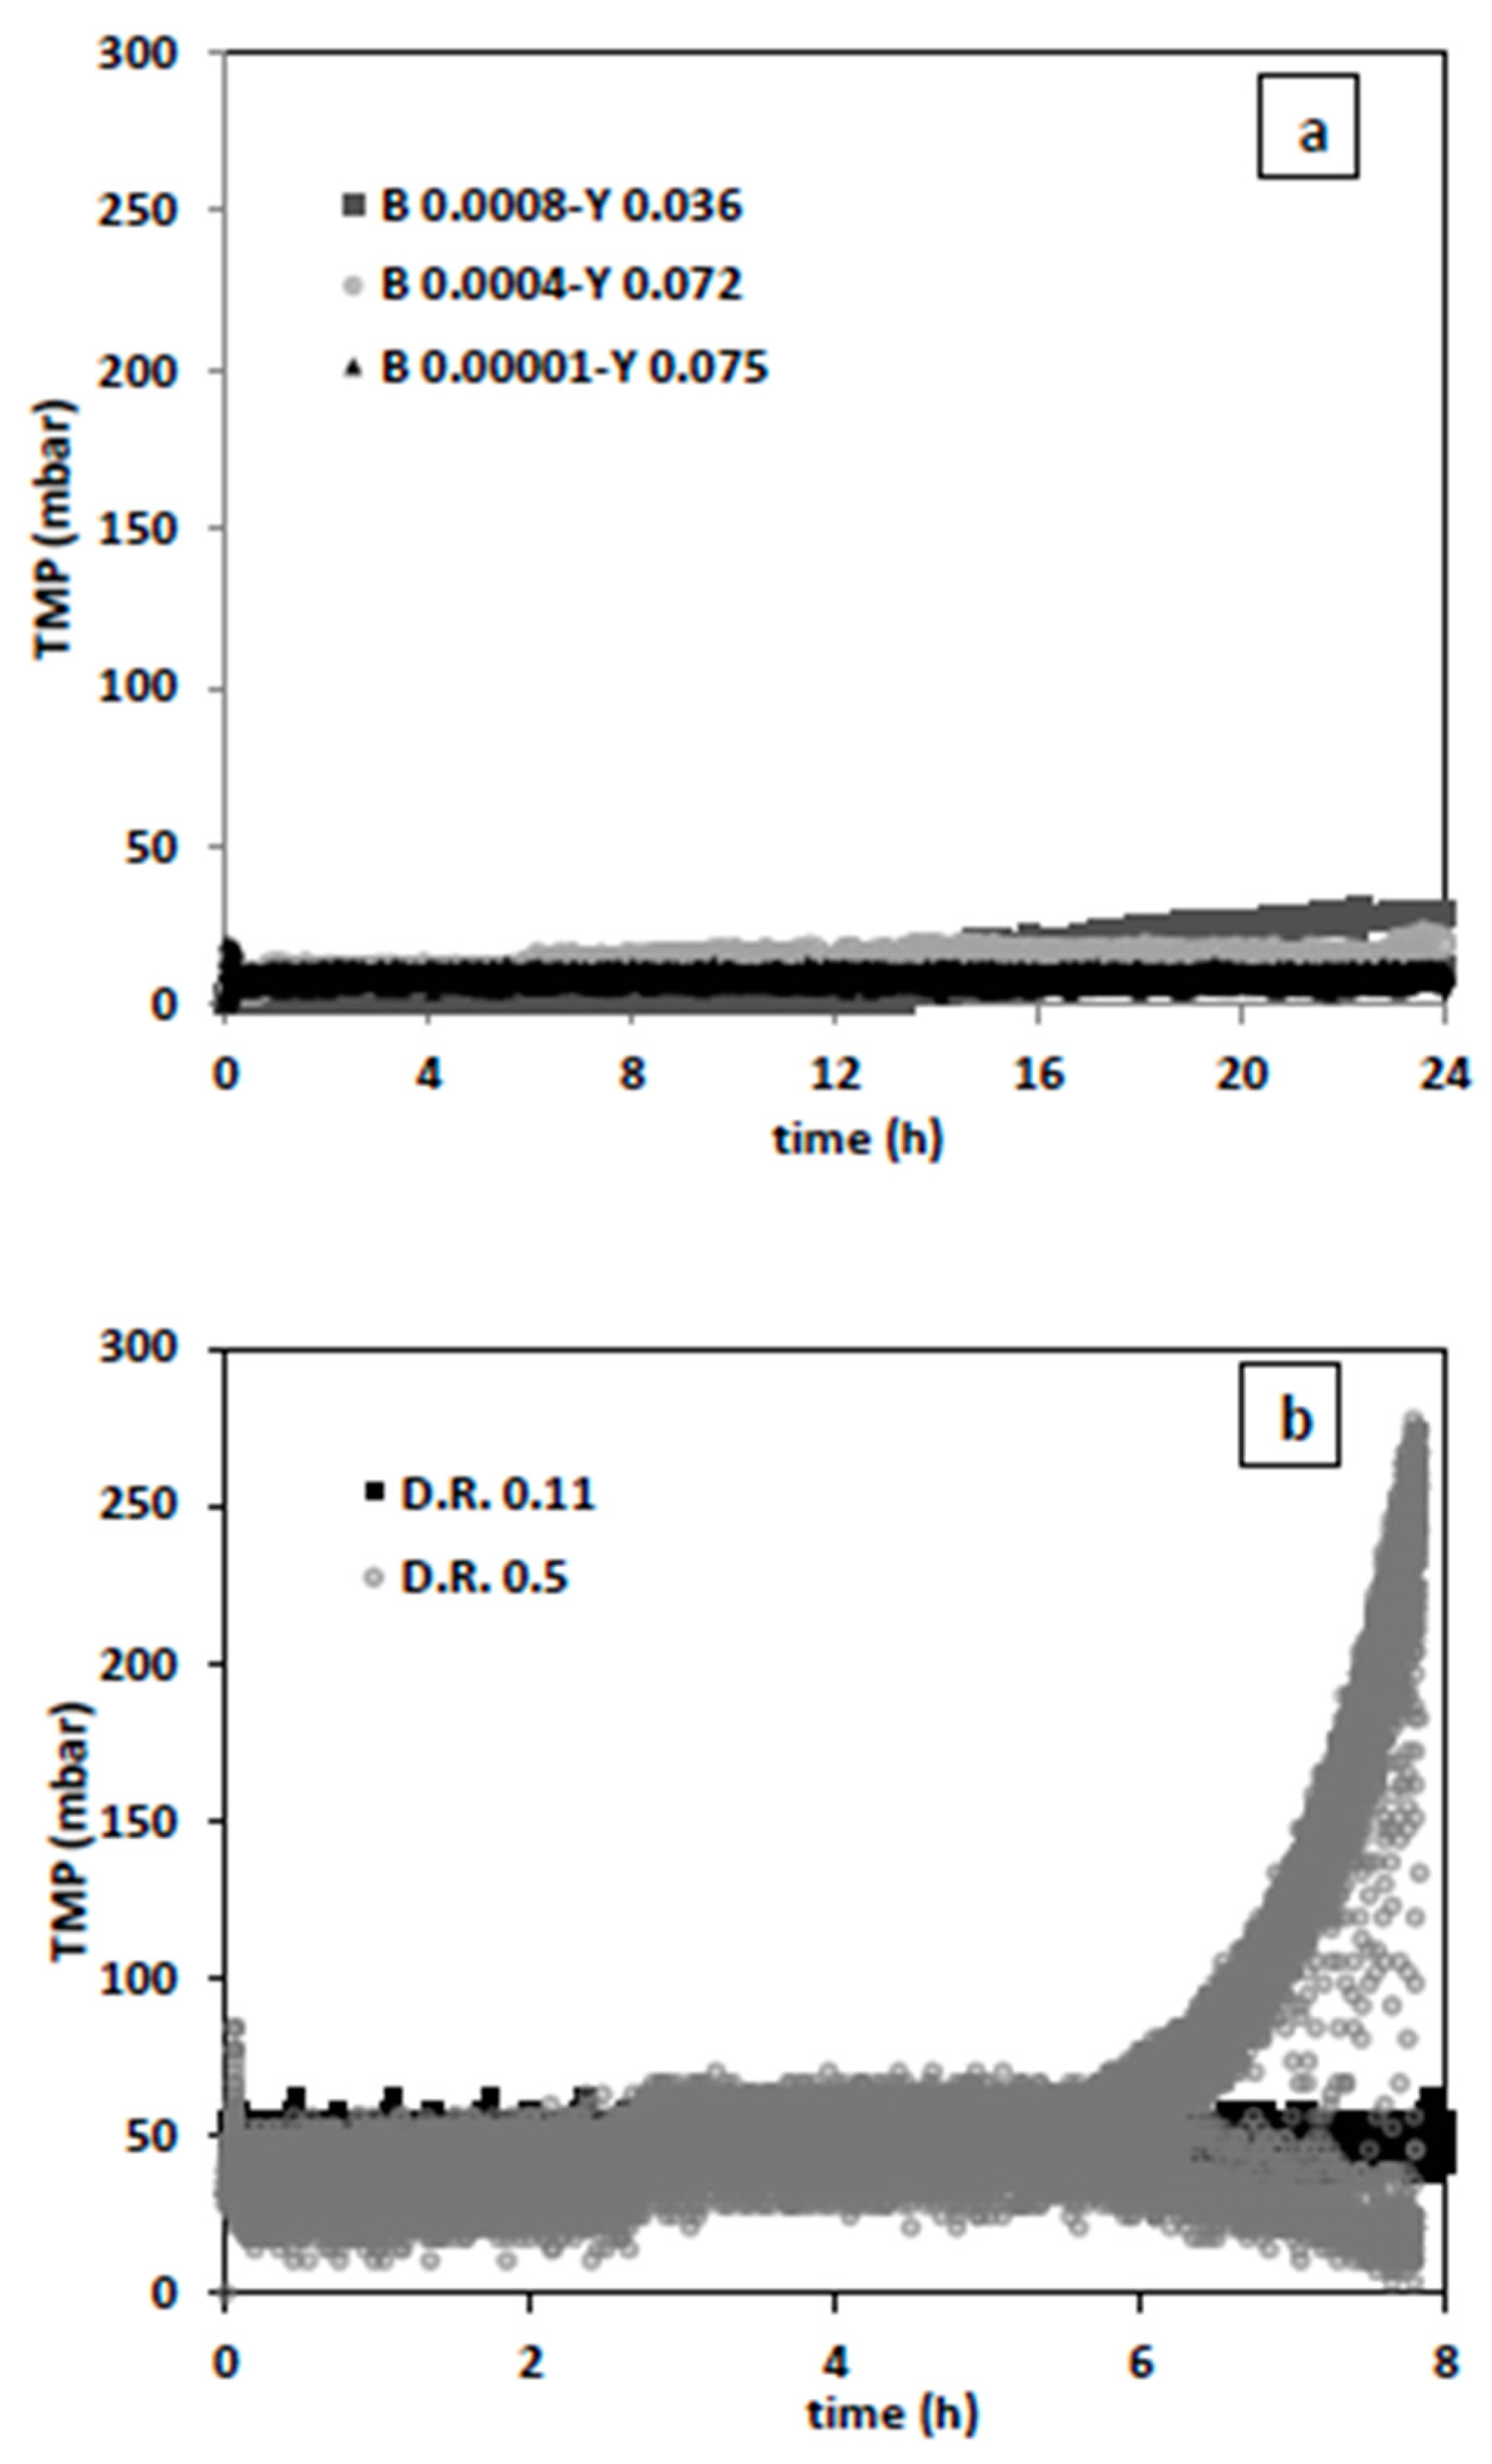
Additional experiments were executed with relatively higher yeast and smaller bacterial inoculum and at permeate fluxes of 16 L/h·m
2 (dilution rate 0.11 1/h) and 73 L/h·m
2 (dilution rate 0.5 1/h) (
Figure 10).
As expected, the condition with lowest bacteria (0.0001 g/L) and highest yeast (0.075 g/L) concentration showed best filtration performance (
Figure 10a). This may imply that if the initial bacteria concentration is less than 0.1% of that of yeast, bacteria washout during filtration can be efficiently conducted and chemical decontamination steps can be reduced or even skipped. While the filtration results for a non-growing culture in PBS give the notion that the dilution rate of 0.5 1/h provides better bacterial washout, this is not the case during actual fermentation conditions. After 6 h of fermentation and filtration, excessive fouling occurred. (
Figure 10b). By present assessment, the bacteria washout performance can be sustained throughout fermentation and filtration, only if filtration regime is improved. Further, in-depth research is required on filtration performance through optimization of backwash conditions and applying constant flux or TMP operations. While higher fluxes contribute to more initial washout, they increase the fouling tendency. Considering that, more fouling may lead to more retention, generalization of this physical bacteria decontamination approach to different fermentation systems requires a profound understanding of yeast-bacteria-membrane interactions contributing to fouling at microscopic level.

 ,
, 


