Article

Physico-Chemical Characteristics and Amino Acid Content Evaluation of Citric Acid by-Product Produced by Microbial Fermentation as a Potential Use in Animal Feed

by
Mutyarsih Oryza.S
1,
Sawitree Wongtangtintharn
1,*,
Bundit Tengjaroenkul
2,
Anusorn Cherdthong
1,
Sirisak Tanpong
1,
Pasakorn Bunchalee
3,
Padsakorn Pootthachaya
1,
Alissara Reungsang
4 and
Sineenart Polyorach
5
1
Department of Animal Science, Faculty of Agriculture, Khon Kaen University, Khon Kaen 40002, Thailand
2
Department of Veterinary Public Health, Faculty of Veterinary Medicine, Khon Kaen University, Khon Kaen 40002, Thailand
3
Department of Biology, Faculty of Science, Mahasarakham University, Mahasarakham 44150, Thailand
4
Department of Biotechnology, Faculty of Technology, Khon Kaen University, Khon Kaen 40002, Thailand
5
Department of Animal Production, Faculty of Agricultural Technology, King Mongkut’s Institute of Technology, Ladkrabang, Bangkok 10520, Thailand
*
Author to whom correspondence should be addressed.
Fermentation 2021, 7(3), 149; https://doi.org/10.3390/fermentation7030149
Submission received: 22 July 2021 / Revised: 7 August 2021 / Accepted: 9 August 2021 / Published: 11 August 2021
(This article belongs to the Special Issue Yeast Biotechnology 5.0)

Abstract

:
The production of citric acid produces 70% waste product or by-product. This by-product is produced by microbial fermentation which could be used as an alternative raw material for animal feed because it still contains citric acid, which could help to reduce pathogenic bacteria. The objective of this study is to evaluate the physical and chemical value of citric acid by-product from rice (CABR) to compare the properties with those of rice bran and broken rice and to determine its potential as an alternative energy source in animal feed. The chemical composition of CABR was calculated using proximate analysis. The color of CABR was darker, and the bulk density value was 549.65 (g/L) (p < 0.05). With free flow, the angle of repose was 40°, and the particle size had less polygonal starch granules. CABR had a low pH of 4.77 and contained 19.80% crude protein, 11.97% crude fiber, and 4005.72 kcal/kg of energy. CABR had a higher crude protein value than broken rice and rice bran and a higher gross energy value than broken rice but less than rice bran. It also had a higher crude fiber value (p > 0.05). The results suggest that CABR could be utilized as an energy and protein source for animal feed formulations.

1. Introduction

Citric acid is a source of organic acid and is produced by microbe fermentation. It has wide uses, but 75% of it is used in the beverage and food industries as an ingredient in carbonated drinks, followed by pharmaceuticals, cosmetics, and animal feed [1]. Globally, 1.7 million tons of citric acid are produced per year, and the amount is predicted to increase annually [2]. Corn and cassava are the main raw materials for citric acid production, and nowadays, there is a chance of producing citric acid from plants [3]. In particular, rice is also commonly used for citric acid production in Thailand. Rice is one of the most important cereals and a primary food for the majority of the world population, especially in Asian countries. Global rice production has increased by 2.5 percent per year on average over the last decade, reaching 744.4 million tons in 2014. The citric acid industry generates a lot of waste and by-product, which can lead to pollution and environmental issues if not effectively managed. Therefore, there is a need to develop economically and environmentally friendly methods for citric acid production. Converting the by-products as feed is the way to increase their value and decrease the environtmental problem [4]. Tanpong et al. [5] reported that the by-product of citric acid production contains cellulose, sugar, starch, and protein. Citric acid by-products from cassava contain 3.588 kcal/kg of energy and 6.11% crude protein and could be utilized as animal feed.
Feed is an essential factor in animal stock sectors. Feed is the most significant expenditure in the livestock industry and represents around 70% of the total production cost. Feed containing formulations with functional components are needed to improve livestock productivity, minimize mortality, and improve the feed conversion ratio [6]. As a general rule, feedstuff’s physical and chemical properties are very influential in selecting ingredients in feed formulation.
The physical characteristics of alternative feeds are essential for planning feed rations. They affect the planning and design of feed storage on farms [7]. The physical properties include the shape, particle size, bulk density, angle of repose, color, and pH related to processing and handling in feed production [5]. By-products have advantages that are directly related to their low price as a feed additive, which can decrease animal feed costs when used as a feed replacement. Thus, the objective of this study was to evaluate the physical and chemical properties of citric acid by-product from rice (CABR) produced by microbial fermentation and its potential as an alternative energy source in animal feed.

2. Materials and Methods

2.1. Sample Collection

Samples were provided by PS Nutrition Company Limited, Sai Mai, Bangkok, Thailand. Citric acid production was carried out using rice extract media and inoculated with Aspergillus niger. Then, the waste products from the citric acid production from rice (CABR), broken rice (BR), and rice bran (RB) were used as samples. The total weight of each sample was 50 kg, which was collected by random sampling using a tapered bag trier. The samples were carefully handled whilst maintaining their original state for analysis in the Laboratory Department of Animal Science, Faculty of Agriculture, Khon Kaen University, Khon Kaen, Thailand. The methods of Association of American Feed Control Official (AAFCO) were followed [8].

2.2. Physical Characteristic Measurement

The physical characteristics of the samples were observed, such as the color, bulk density, angle of repose, and particle distribution. The procedures reported by Tanpong et al. [5] were used to measure the physical properties of each feedstuff. The particle size and distribution were calculated as follows:
Retain (%) = (the total sample weight in the sieve/total weight of sample) × 100
Passing (%) 100 − retain (%)
D g w = l o g 1 [ i = 1 n ( w i l o g d i ) ÷ i = 1 n w i ]
where W i is the mass in each sieve (g) and d i is the sieve size (mm), which is calculated as ( d × ) . The geometric mean diameters or median size of particle ( D g w ) followed the method from [9].

2.3. Microscopy Compound

According to the method reported by Vasconcelos et al. [9], the structure of morphological starch granules and plant cell walls of the samples was described and observed under a compound microscope (JNOEC, XS-212-201, Beijing, China) at 40× magnification and a stereo microscope (NIKON SMZ-1, Tokyo, Japan) at 20–60× magnification. Scanning Electron Microscope (SEM) analysis was conducted using an SEM electron microscope (JEOL-JSM 6460 LV, Tokyo, Japan) at 50×, 500×, and 1000× magnifications at an accelerating voltage of 20 kV.

2.4. Chemical Composition

Proximate analysis was performed using the methods of the AOAC [10]. We analyzed the moisture, ash, soluble ash, insoluble ash, crude protein, crude fiber, crude fat, and nitrogen-free extract. The gross energy (GE) was analyzed via an automatic Adiabatic bomb calorimeter (AC500 Isoperibol Clorimeter, LECO Corp., St. Joseph, MI, USA) following the method of the Leco company. The pH was measured with a pH meter after mixing 10 g of the sample in a beaker, adding 100 mL of distilled water, and stirring for 30 min.

2.5. Citric Acid Measurement

Following the method of Ezea et al. [11], the citric acid content in CABR was measured. The samples were treated by titration with 0.1 NaOH and phenolphthalein as an indicator. The citric acid content (%) was calculated with the following equation:
C i t r i c a c i d ( % ) = N × W 1 X T V × D F W 2 × 10
where N is the normality, W1 is the equivalent weight of citric acid, TV is the titrated value, DF is the dilute factor, and W2 is the weight of the sample.

2.6. Amino Acid Determination

The extraction of amino acids from CABR was performed according to Nimbalkar et al. [12]. Amino acid contents were measured according to the method of Thiele et al. [13] and Chumroenphat et al. [14] using the Liquid Chromatography with tandem mass spectrometry (LC-MS/MS) system. LC-MS/MS analysis was performed on a triple quadrupole tendem mass spectrometer (Shimadzu Corp., Kyoto, Japan) coupled with a 1290 Infinity LC system (Agilent Technologies, Santa Clara, CA, USA). The chromatographic separation of amino acids was carried out on an Atlantis Silica HILIC column (4.6 mm × 100 mm, 3 μm particle size) (Waters Corporation, Midford, MA, USA). Mobile phases were (A) 5% acetic acid in water and (B) 10% methanol in acetonitrile. The LC gradient was t(min)/B (%); 0/5, 25/50, 27/98, 29/98, 29.1/5, and 40/5 operated at a flow rate of 0.25 mL/min. The injection volume was 2 µL. The column was coupled with a mass spectrometer for quantification. The mass spectrometer was performed in multiple reaction monitoring mode (MRM) with argon. Amino acids were counted using internal standard calibration curves and external standard calibration curves. All data were demonstrated on a fresh weight (fw) basis as g/kg.

2.7. Aflatoxins and Fumonisin Measurement

The aflatoxins in the samples were detected and quantified with the in-house system of Central Laboratory (Thailand) Co., Ltd. (TE-CH-025) based on AOAC 991.31 and 994.08 [15]. Samples were blind-coded and processed at 2–8 °C. Before analysis, 50 g of ground sample was put in a clean disposable extraction bottle containing 250 mL of 70% methanol, and the bottle was shaken for 3 min to extract the sample. One minute was then allowed for the solids to fall to the bottom of the bottle, and they were filtered with filter paper.
The amount of fumonisin B1 and B2 were calculated using an in-house process using LC-MS/MS, which combines high-pressure liquid chromatography (HPLC) separation with mass spectrometry detection power. High-pressure liquid chromatography HPLC with tandem mass spectrometry (MS/MS) was used to make the determination. Samples were immediately transferred to sealed bags to prevent moisture changes and stored. The sample powders were dissolved in methanol and acetonitrile to prepare stock standard solutions. Appropriate amounts of sample standard solutions and aflatoxin standard solutions were combined and diluted to a volume with methanol to prepare mixed standard solutions of mycotoxins.
All solutions were stored in the dark at −20 °C and prepared for sample pretreatment. The final sample concentration in the extract of the sample pretreatment was injected for LC-MS/MS analysis. The sensitivity of the method was estimated by the limit of detection (LOD). The LOD was determined as the lowest concentration giving a response of three times the average of the base-line noise obtained from non-contaminated aflatoxin peanut samples that had been spiked with a mixed standard stock solution containing the four investigated aflatoxins [16].

2.8. Statistical Analysis

The data were analyzed by using the procedure of the Statistical Analysis System Institute (SAS, 2015). All data were subjected to analysis of variance (ANOVA) with a completely randomized design (CRD). Differences among means with p < 0.05 were accepted as representing statistically significant differences, which were determined by Duncan’s New Multiple Range Test (DMRT).

3. Results

3.1. Physical Characteristics

The physical characteristics of CABR are shown in Table 1, respectively compared with broken rice and rice bran. The bulk density of CABR was 549.65 g/L, which is 57.94% lower than that of broken rice (868.12 g/L) and 21.13% higher than that of rice bran (453.78 g/L). The results show that the angle of repose for CABR was 40.6°, which can be classified as fair to passable flow, whereas broken rice showed an angle of repose of approximately 39.45°, which could be classified as a fair to passable flow, and rice bran’s angle of repose value was 50.6°, which classified as very poor (46–50°). Broken rice has bulky and more massive particles (99.92 g) in mesh 20 when compared with CABR (19.92 g) and rice bran (31.21 g). The color space value was analyzed by the CIELAB system and is shown in Table 1. The results show L* = 45.02, a* = 5.64, and b* = 13.88. for CABR L* of CABR which was lower than that of broken rice (78.37) and rice bran (76.90). The a* value of CABR was higher than that of broken rice (1.66) and rice bran (1.20), and CABR’s b* value decreased from rice bran (18.89) and broken rice (17.92). The particle size and distribution of CABR are shown in Table 2. Compared with broken rice and rice bran, most CABR particle sizes were increased after processing. When comparing the passing percentage using sieve numbers 20 to 100, the result for CABR was higher than that of broken rice. The geometric mean diameter (the median particle size) was 232 μm, as a small particle size of the sample.

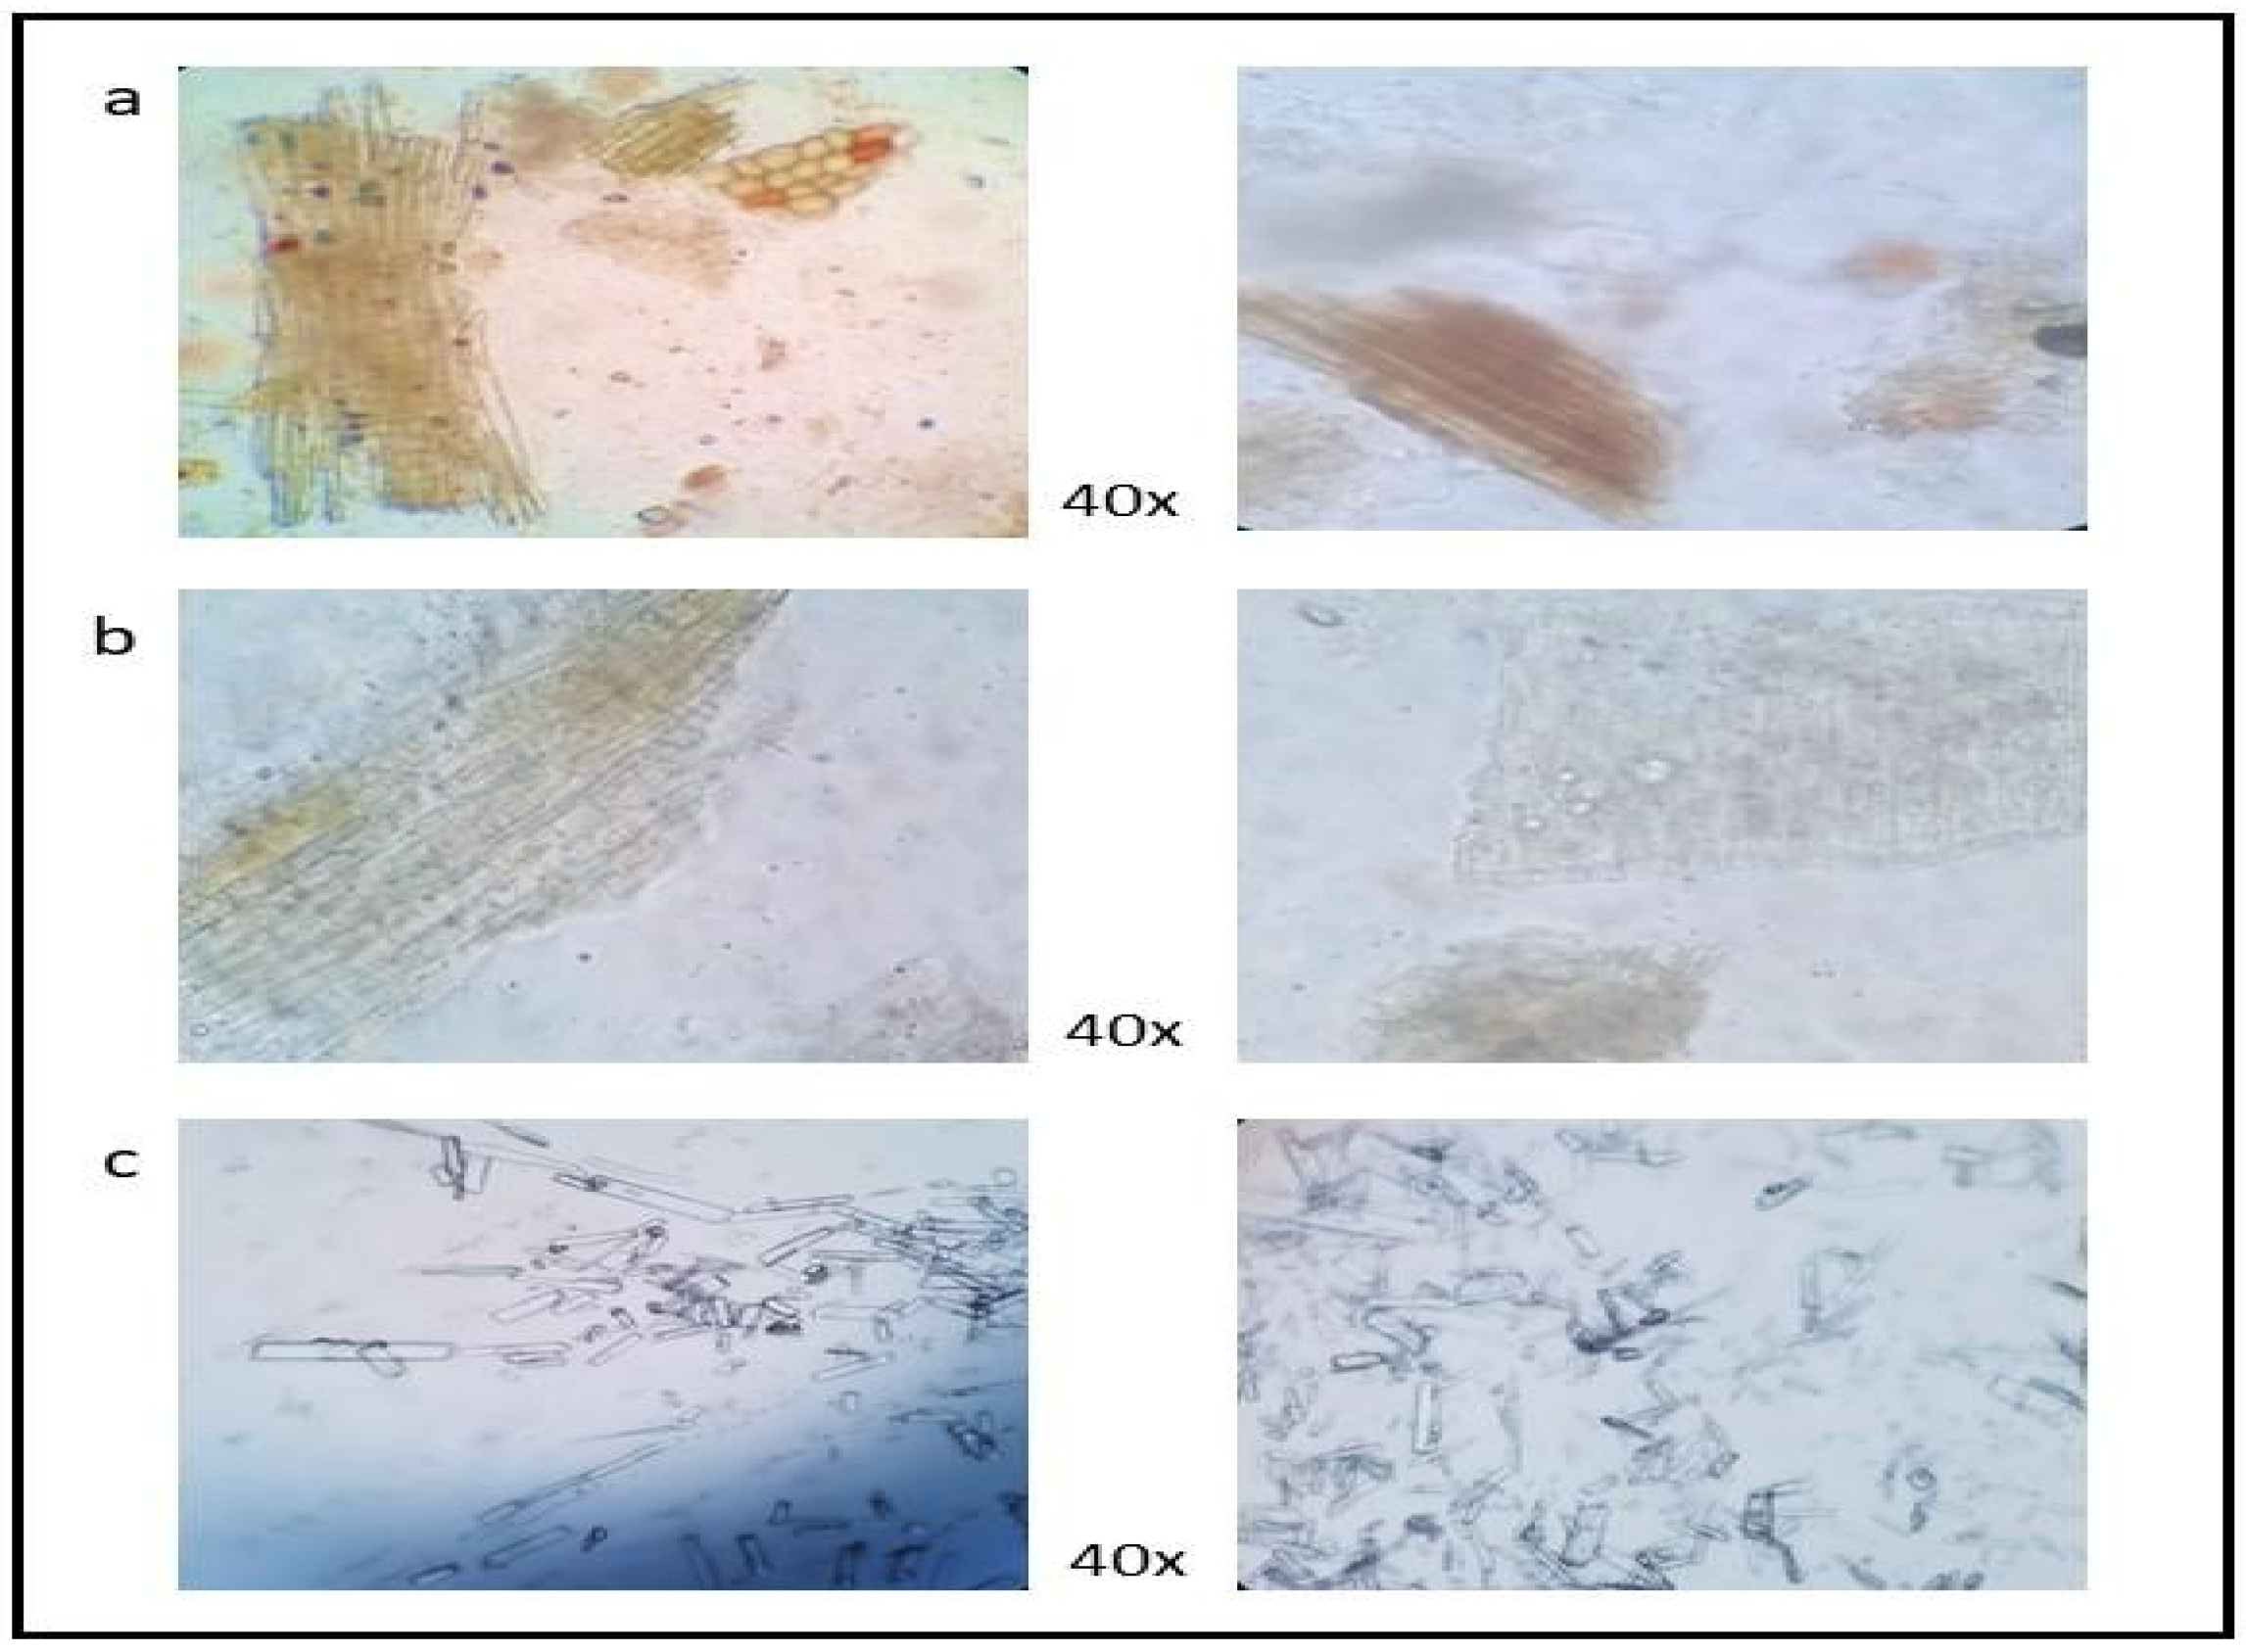
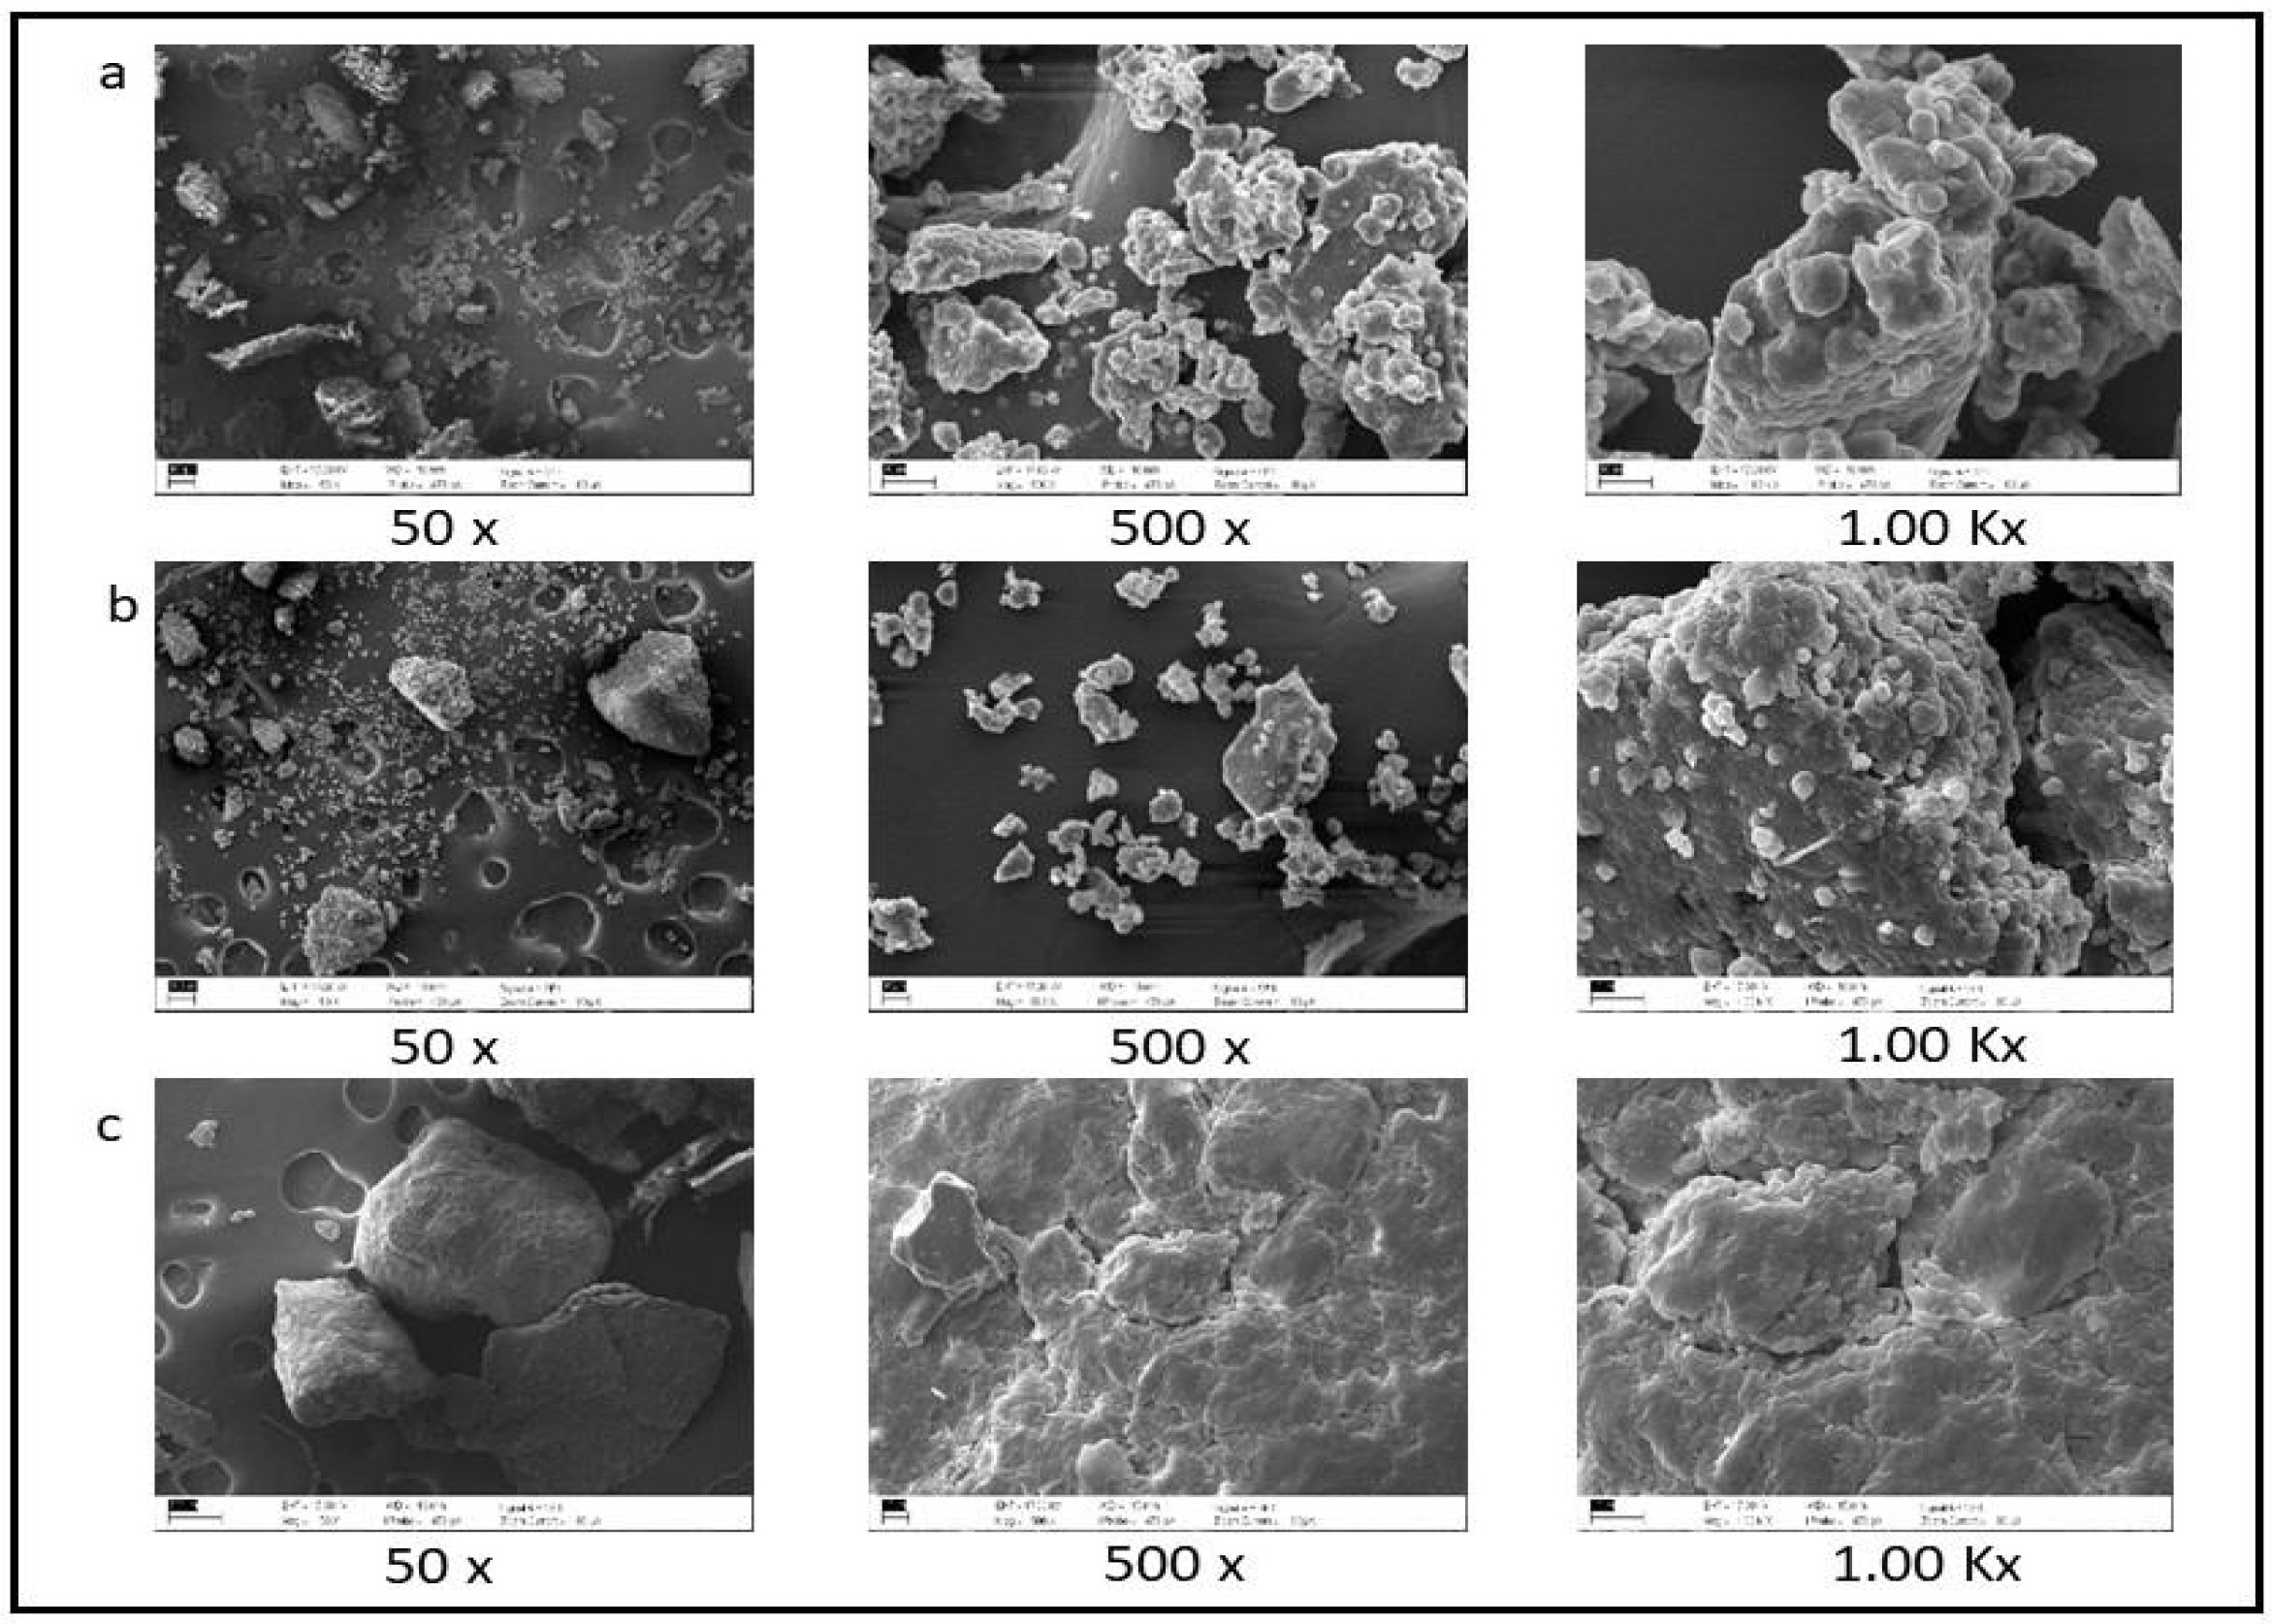
3.2. Microscopy Compound

A stereo microscope (Figure 1), compound microscope (Figure 2), and scanning electron microscope (SEM) (Figure 3) were used to show differences in particle size and content of fiber as a starch between CABR, broken rice, and rice bran. CABR exhibited a darker color under the stereo microscope when compared to rice bran and broken rice, which supported the results of the physical analysis (Table 1) and particle size and distribution (Table 2). The ultrastructure morphology of feedstuff is characterized using SEM micrographs at 50×, 500×, and 1000× magnification. The result showed CABR starch granules are polygonal in shape.

3.3. Chemical Composition

The chemical properties of CABR were determined by proximate analysis and are shown in Table 3. The results revealed that CABR contained 8.26% moisture, 9.35% ash, 5.20% soluble ash, 4.15 % insoluble ash, 3.98% ether extract, 0.43% of calcium, 0.07% of phosphorus, 19.80% of crude protein, and 4005.72 kcal/kg of gross energy. CABR contains crude protein higher than broken rice and rice bran (Table 3). Moreover, CABR contains low pH and contains citric acid 3.3%.

3.4. Amino Acid Composition

The amino acid composition of CABR, broken rice, and rice bran are shown in Table 4. The table shows the dispensable and indispensable amino acid content of each sample. CABR contained the highest value of aspartic acid, glutamic acid, threonine, alanine, and valine compared with broken rice and rice bran. CABR also contains a low value of methionine and lysine.

3.5. Mycotoxins Contamination

The mycotoxin contamination of CABR is shown in Table 5. The CABR was not contaminated with aflatoxin (B1, B2, G1 and G2) and fumonisin (B1 and B2) with LOD of 0.8 and 100.000 µg/kg for aflatoxin and fumonisin, respectively, which could be safe for animal consumption.

4. Discussion

The bulk density of CABR was lower than that of broken rice and higher than that of rice bran. Tanpong et al. [5] found that the bulk density of citric acid by-product from cassava was 601.00 g/L and was higher than that of cassava root meal (64.18%). Bulk density varies with the particle size and compaction (packing) of the feed. Increasing the value of the bulk density was influenced by the moisture of raw material. The earlier study reported that the cassava chips’ bulk density was affected by the moisture content [17]. The differences among the sizes of each sample affected the bulk density value. Broken rice has a massive particle size and contains the highest bulk density followed by CABR and rice bran. The larger the particle size of raw materials, the greater the bulk density [5]. The bulk physical property of an alternative feed is essential to plan designing, transporting, and storing the feed. Different processes during harvest and manufacturing of a product impact the end products’ physical properties or by-products used as animal feed [18].
The angle of repose of CABR is shown in Table 1. The result shows that the angle of repose of CABR classified as fair to passable flow. Baker [19] reported that the ability of powders to flow is referred to as flowability. Powder flowability is influenced by both the physical properties of the material and the specific processing conditions in the handling system. The particle size, density, surface features of materials, and the water and fat content of feed are all elements that influence the angle of repose. For feedstuffs with large particle size, the angle of repose will be small. Moreover, the average angle of repose depends on the moisture of the material. The raw material characteristics indicate flow behavior and affect the feed mixture. Fitzpatrick et al. [20] reported that feed powder properties affect the behavior during storage, handling, and processing. Therefore, it is helpful to predict storage capacity, including friction against a corroded bin wall, and to indicate the moisture content of raw material [21].
The color space value was analyzed by the CIELAB system and is shown in Table 1. The a* value of CABR was higher than that of broken rice and rice bran, and CABR’s b* value decreased compared to rice bran and broken rice. Several researchers report that the fermentation process includes a browning reaction, which explains why the by-product becomes dark during fermentation, while lightness is related to rice’s structure [5,22,23,24].
CABR had a small particle size that could pass through each sieve number better than broken rice. Comparative retention percentages retained from broken rice and rice bran with CABR in Table 1 indicate that most of the particle sizes of CABR increased after processing. The geometric mean diameter (the median particle size) of CABR shows that CABR has as a small particle size. According to Vu et al. [25], a smaller particle of the material dissolves faster than a larger one. The particle size distribution influences many material properties and indicates quality. The particle size and shape influence flow and compaction properties. A smaller particle can have lower nutrient digestibility, and larger particles can reduce animal feed intake [26]. More spherical particles enable a faster typical flow than smaller or high aspect-ratio particles. Smaller particles dissolve more quickly and lead to higher suspension viscosities than larger particles. The particle size of animal feed impacts its utilization and production. Larger particles can reduce animal feed intake by limiting surface area per unit and allowing enzyme digestion of nutrients. Smaller particles make it more difficult to separate ingredients, but they also increase viscosity in the digestive tract. Kiarie et al. [27] reveal that finer feed particles provide optimal usage of nutrients and improve animal performance due to a higher surface area that allows greater contact with digestive enzymes.
CABR exhibited a darker color under the stereo microscope when compared to rice bran and broken rice, which supported the results of the physical analysis (Table 1) and particle size and distribution (Table 2) due to the citric acid production fermentation process. However, the starch granules and cell walls of the samples were shown under the compound microscope. CABR contained a few residual starch granules, most likely due to the acidity of the citric acid, which may weaken the interaction between starch polymer chains. Mohammed [28] mentioned that after modifying the raw materials with citric acid, the starch granules were melted and fused to form a continuous phase, most likely because the acidity of the citric acid may weaken the interaction between the starch polymer chains of the starch by-products. This microscopic technology analysis could become the primary front-line protection in the program of feed quality control.
The chemical properties of CABR were shown in Table 3. CABR contains crude protein higher than rice bran at approximately 67.53% (Table 3). Tanpong et al. [29] reported that citric acid from cassava had a crude protein content of 6.11%, and when compared with the current study, the crude protein percentages of CABR were higher at 30.86% (Table 3). CABR also contained a remaining citric acid content of 3.3%, which could be beneficial in terms of microorganisms and improving animal growth. However, CABR showed the highest proportions of crude fiber, which can be a problem when fed to monogastric animals, such as poultry species, where only a small percentage of crude fiber is broken down in the gastrointestinal tract.
Rice normally has a high level of amino acids and protein when compared to other cereal varieties [30]. In the current study, CABR contained the highest value of valine, glutamic acid, alanine, threonine, and aspartic acid compared with broken rice and rice bran. CABR also includes a low value of methionine and lysine; therefore, this should also be considered when using CABR in animal diets. In protein nutrition, the balance of amino acids in the diet is essential. Amino acid antagonism occurs when chemically or structurally-related amino acids are imbalanced. Imbalanced amino acids might affect the performance of animals [31]. This report of complete amino acid profile in citric acid by-product from rice could be useful for formulating balanced animals diets.
The CABR is not contaminated with aflatoxin and fumonisin, which means it can be safe for animal consumption. A previous study in citric acid by-products from cassava showed that it contains 73.37 ppb of aflatoxin [29]. However, the aflatoxin in CABR is not detected in the current study, making this raw material safer to use as an animal feed. The aflatoxin contamination in feed could cause a reduction in immune response that may cause several diseases. Cereal grains, primarily corn, are widely used as an energy source in animal feed for different species. They were originating from tropical and subtropical regions that contain high amounts of aflatoxins. Contamination of various feeds containing mycotoxin continues to be a safety issue worldwide because it harms animal health [32]. Thus, mycotoxin contamination in feedstuff should be considered to ensure a safety product for animal and humans.

5. Conclusions

CABR’s physical properties consist of small particle size, dark color, and having fewer starch granules. CABR contains 19.80% of crude protein, 11.97% of crude fiber, and 4,005.72 Kcal/kg of energy. The results imply that CABR could be utilized as an energy source for animal feed substitution. CABR has low pH and contains 3.3% citric acid, which could help inhibit bacteria in the GI tracts of animals and improve their growth performance. CABR is also not contaminated with aflatoxin or fumonisin, which means it could be safe feed for animals. The physical and chemical data from this research could be used as guidelines for handling raw materials before use in a feed formulation.

Author Contributions

Conceptualization, M.O., S.W., B.T., A.C., S.T., P.B., P.P., A.R., and S.P.; methodology, M.O., S.T., P.P., S.W., and B.T.; investigation, S.W. and B.T.; writing—original/draft preparation, M.O. and S.W.; supervision, M.O., S.W., B.T., and A.C.; formal analysis, M.O., S.W., B.T., S.T., and P.P.; visualization, M.O. and S.W.; funding acquisition, S.W., B.T., and A.C. All authors have read and agreed to the published version of the manuscript.

Funding

This research was funded by the Program Management Unit for Human & Institutional Development, Research, and Innovation (Grant no. B05F630053), and Thailand Research Fund (TRF) Senior Research Scholar (Grant No. RTA6280001).

Institutional Review Board Statement

Not applicable.

Informed Consent Statement

Not applicable.

Data Availability Statement

The data presented in this study are available on request from the corresponding author.

Acknowledgments

The authors would like to express their genuine gratitude to the Research and Graduate Studies Division, KKU, and PS Nutrition Company Limited for providing the offices of this exploration.

Conflicts of Interest

The authors declare no conflict of interest.

References

  1. Show, P.L.; Oladele, K.O.; Siew, Q.Y.; Aziz Zakry, F.A.; Lan, J.C.W.; Ling, T.C. Overview of citric acid production from Aspergillus niger. Front. Life Sci. 2015, 8, 271–283. [Google Scholar] [CrossRef] [Green Version]
  2. Dhillon, G.; Brar, S.; Dhillon, S.; Verma, M. Bioproduction and extraction optimization of citric acid from Aspergillus niger by rotating drum type solid-state bioreactor. Ind. Crops Prod. 2013, 41, 78–84. [Google Scholar] [CrossRef]
  3. Alsudani, A.A.; Al-Shibli, M.K. Citric acid production from some local isolates of the fungus Aspergillus niger by rice husks filtrate medium. Int. J. Recent Sci. Res. 2015, 6, 5625–5633. [Google Scholar]
  4. Khalil, M.; Berawi, M.A.; Heryanto, R.; Rizalie, A. Waste to energy technology: The potential of sustainable biogas production from animal waste in Indonesia. Renew. Sustain. Energy Rev. 2019, 105, 323–331. [Google Scholar] [CrossRef]
  5. Tanpong, S.; Cherdthong, A.; Tengjaroenkul, B.; Tengjaroenkul, U.; Wongtangtintharn, S. Evaluation of physical and chemical properties of citric acid industrial waste. Trop. Anim. Health Prod. 2019, 105, 323–331. [Google Scholar] [CrossRef] [PubMed]
  6. Makkar, H. Animal nutrition in a 360-degree view and a framework for future R&D work: Towards sustainable livestock production. Anim. Prod. Sci. 2016, 56, 1561–1568. [Google Scholar] [CrossRef] [Green Version]
  7. Syamsu, J.A.; Yusuf, M.; Abdullah, A. Evaluation of physical properties of feedstuffs in supporting the development of feed mill at farmers group scale. J. Adv. Agric. Technol. 2015, 2, 147–150. [Google Scholar] [CrossRef] [Green Version]
  8. AAFCO. Association of American Feed Control Officials; Association of American Feed Control Officials Inspection and Sampling Committee: Champaign, IL, USA, 2014. [Google Scholar]
  9. Vasconcelos, L.M.; Brito, A.C.; Carmo, C.D.; Oliveira, P.H.G.A.; Oliveira, E.J. Phenotypic diversity of starch granules in cassava germplasm. Genet. Mol. Res. 2017, 16, 1–15. [Google Scholar] [CrossRef]
  10. AOAC. Association of Official Analytical Chemists; Official Methods of Analysis, 15th ed.; Association ofAnalytical Chemists: Arlington, TX, USA, 1990. [Google Scholar]
  11. Ezea, I.; Chiejina, N.V.; Ogbonna, J.C. Biological production of citric acid in solid state cultures of Aspergillus niger. ChemXpress 2016, 8, 201–207. [Google Scholar]
  12. Nimbalkar, M.S.; Pai, S.R.; Pawar, N.V.; Oulkar, D.; Dixit, G.B. Free amino acid profiling in grain Amaranth using LC–MS/MS. Food Chem. 2012, 134, 2565–2569. [Google Scholar] [CrossRef]
  13. Thiele, B.; Hupert, M.; Santiago-Schübel, B.; Oldiges, M.; Hofmann, D. Direct analysis of underivatized amino acids in plant extracts by LC-MS/MS (Improved Method). Methods Mol. Biol. 2019, 2030, 403–414. [Google Scholar] [CrossRef] [PubMed]
  14. Chumroenphat, T.; Somboonwatthanakul, I.; Saensouk, S. Changes in curcuminoids and chemical components of turmeric (Curcuma longa L) under freeze-drying and low-temperature drying methods. Food Chem. 2021, 339, 128121. [Google Scholar] [CrossRef] [PubMed]
  15. Weaver, C.; Trucksess, M. Determination of Aflatoxins in Botanical Roots by a Modification of AOAC Official MethodSM 991.31: Single-Laboratory Validation. J. AOAC Int. 2010, 93, 184–189. [Google Scholar] [CrossRef] [Green Version]
  16. Sirhan, A.Y.; Tan, G.H.; Al-Shunnaq, A.; Abdulra’uf, L.; Wong, R.C.S. QuEChERS-HPLC method for aflatoxin detection of domestic and imported food in Jordan. J. Liq. Chromatogr. Relat. Technol. 2014, 37, 321–342. [Google Scholar] [CrossRef]
  17. Nwabanne, J.T. Drying characteristics and engineering properties of fermented ground cassava. African J. Biotechnol. 2009, 8, 873–876. [Google Scholar] [CrossRef]
  18. Ndou, S.P.; Gous, R.M.; Chimonyo, M. Prediction of scaled feed intake in weaner pigs using physico-chemical properties of fibrous feeds. Br. J. Nutr. 2013, 110, 774–780. [Google Scholar] [CrossRef] [PubMed] [Green Version]
  19. Baker, S.; Herrman, T. MF2051 Evaluating Particle Size; Kansas State University: Manhattan, Kansas, 1976; pp. 1–6. [Google Scholar]
  20. Fitzpatrick, J.; Iqbal, T.; Delaney, C.; Twomey, T.; Keogh, M.K. Effect of powder properties on the flowability of milk powders with different fat contents. J. Food Eng. 2004, 64, 435–444. [Google Scholar] [CrossRef]
  21. Amidon, G.; Meyer, P.J.; Mudie, D. Particle, Powder, and Compact Characterization. In Developing Solid Oral Dosage Forms: Pharmaceutical Theory and Practice, 2nd ed.; Elsevier: Amsterdam, The Netherlands, 2017; pp. 271–293. ISBN 9780128024478. [Google Scholar]
  22. Papagianni, M.; Boonpooh, Y.; Mattey, M.; Kristiansen, B. Substrate inhibition kinetics of Saccharomyces cerevisiae in fed-batch cultures operated at constant glucose and maltose concentration levels. J. Ind. Microbiol. Biotechnol. 2007, 34, 301–309. [Google Scholar] [CrossRef]
  23. Max, B.; Salgado, J.; Rodríguez, N.; Cortes, S.; Converti, A.; Domínguez, J. Biotechnological production of citric acid. Braz. J. Microbiol. 2010, 41, 862–875. [Google Scholar] [CrossRef] [Green Version]
  24. Angumeenal, A.R.; Venkappayya, D. An overview of citric acid production. LWT-Food Sci. Technol. 2013, 50, 367–370. [Google Scholar] [CrossRef]
  25. Vu, T.V.; Delgado-Saborit, J.M.; Harrison, R.M. Review: Particle number size distributions from seven major sources and implications for source apportionment studies. Atmos. Environ. 2015, 122, 114–132. [Google Scholar] [CrossRef]
  26. Nutrition, C.A. Impacts of feed texture and particle size on broiler and layer feeding patterns. In Proceedings of the XXIV World’s Poultry Congress, Bahia, Brazil, 9 August 2012; pp. 1–8. [Google Scholar]
  27. Kiarie, E.G.; Mills, A. Role of Feed Processing on Gut Health and Function in Pigs and Poultry: Conundrum of Optimal Particle Size and Hydrothermal Regimens. Front. Vet. Sci. 2019, 6, 1–13. [Google Scholar] [CrossRef] [PubMed] [Green Version]
  28. Mohammed, H. 2 Effect of utilization organic acid supplement on broiler (ROS-308). Int. J. Adv. Res. Biol. Sci. 2016, 3, 76–81. [Google Scholar]
  29. Tanpong, S. Utilization of Citric Acid by Product from Industrial Waste Used as Poultry Feed. Ph.D. Thesis, Khon Kaen University, Khon Kaen, Thailand, 2019. [Google Scholar]
  30. Juliano, B. Rice in human nutrition; International Rice Research Institute, Food and Agriculture Organization of the United Nations: Rome, Italy, 1993; pp. 31–34. [Google Scholar]
  31. Wu, G.; Bazer, F.; Dai, Z.; Li, D.; Wang, J.; Wu, Z. Amino acid nutrition in animals: Protein synthesis and beyond. Annu. Rev. Anim. Biosci. 2014, 2, 387–417. [Google Scholar] [CrossRef] [PubMed]
  32. Dhanasekaran, D.; Panneerselvam, A.; Thajuddin, N. Evaluation of aflatoxicosis in hens fed with commercial poultry feed. Turkish J. Vet. Anim. Sci. 2009, 33, 385–391. [Google Scholar] [CrossRef]
Figure 1. Stereoscopic micrographs of citric acid by-product from rice (CABR) (a), rice bran (b), and broken rice (c) at ×20, ×40, and ×60 magnifications.
Fermentation 07 00149 g001
Figure 2. Compound micrographs of citric acid by-product from rice (CABR) (a), rice bran (b), and broken rice (c) at ×40 magnifications.
Fermentation 07 00149 g002
Figure 3. Scanning electron micrographs (SEM) of citric acid by-product from rice (CABR) (a), rice bran (b), and broken rice (c) at ×50, ×500, and ×1000 magnifications.
Fermentation 07 00149 g003
Table 1. The physical characteristics of citric acid by-product from rice (CABR), broken rice (BR), and rice bran (RB).
ParameterCABRBRRBSEMp-Value
Bulk density (g/L)549.65 b868.12 a453.78 c5.8670.0001
Angle of repose (o)40.6 b39.45 a50.6 c0.3800.0001
Color
L*45.02 b78.37 a76.90 c0.3970.0001
A*5.64 a1.66 b1.20 c0.0800.0001
B*13.88 c18.89 a17.92 b0.1470.0001
a,b,c Means in the same row without a common letter are different at p < 0.01, SEM: standard error of mean.
Table 2. Particle size and distribution analyses of citric acid by-product from rice (CABR), broken rice (BR), and rice bran (RB).
Sieve Mesh no.Sieve Size (μm)Sample (g)Retain (%)SEMCumulative (%)Passing (%)Dgw 1 (μm)SEM
CABRBRRBCABRBRRBCABRBRRBCABRBRRBCABRBRRB
2085019.9299.9231.2120.09 c99.78 a31.09 b1.5620.0999.7831.0979.910.2268.91232 c600 a338 b5.915
4042522.820.1940.323.01 b0.20 c40.15 a0.8743.0199.9871.2556.90.0228.75
6025019.350.0019.3719.51 b0.01 b19.30.8262.6199.9890.5437.390.029.46
8018014.260.007.5814.38 a0.00 c7.55 b0.9276.9899.9998.123.010.011.9
1001508.910.0001.207.77 a0.00 c1.20 b0.0984.7599.9999.315.250.010.7
Pan 15.120.010.7015.25 a0.01 c0.70 b0.20100.00100.00100.00000
Total 100.42100.14100.37100100100
1 Geometric mean diameter in μm by mass of sample, a,b,c means in the same row without a common letter are different at p < 0.01, SEM: standard error of mean.
Table 3. Nutritive values and chemical composition of citric acid by-product from rice (CABR), broken rice (BR), and rice bran (RB).
ParameterCABRBRRBSEMp-Value
Moisture (%)8.26 b9.35 a8.43 b0.1140.0012
Ash (%)9.35 a0.49 c0.49 b0.1540.0001
Soluble ash (%)5.20 b0.49 c6.88 a0.1480.0002
Insoluble ash (%)4.15 a0.00 c0.39 b0.0130.0001
Ether extract (%)3.98 b1.41 c14.28 a0.1610.0001
Crude fiber (%)11.97 a0.10 b0.76 b0.2970.0002
Nitrogen-free extract (%)46.64 c82.20 a55.89 b0.4280.0001
Ca (%)0.43 b0.76 a0.76 a0.0500.0001
Phosphorus (%)0.07 a0.04 b0.01 c0.0030.0001
Crude protein (%)19.80 a6.47 c13.37 b0.1590.0001
Gross energy (kcal/kg)4,005.72 b3,780.52 c4,287.11 a7.4300.0001
pH4.77 b6.46 a6.51 a0.0530.0001
Citric acid content (%)3.3--
a,b,c Means in the same row without a common letter are different at p < 0.05, SEM: standard error of mean.
Table 4. Amino acid composition of citric acid by-product from rice (CABR), broken rice (BR), and rice bran (RB).
Amino Acid (g/kg)CABRBRRBSEM p-Value
Essential amino acid
Leucine3.72 b2.72 c4.42 a17.230.0051
Valine2.70 a1.80 b1.53 c7.590.0012
Isoleucine2.49 b1.71 c3.48 a11.340.0013
Phenylamine1.53 b1.20 b3.63 a33.200.0098
Threonine1.44 a0.87 b0.82 b4.240.0012
Histidine0.92 b4.03 a0.93 b36.470.0052
Tryptophan0.39 c1.13 a0.61 b18.130.0565
Lysine0.31 c0.87 b1.88 a 7.240.0005
Methionine0.05 c0.96 a0.37 b50.410.3216
Non-essential amino acid
Tyrosine5.50 c6.81 b12.99 a30.370.0003
Glycine0.77 a0.770.28 b4.830.0003
Proline2.96 b1.49 c7.58 a24.040.0003
Alanine9.07 a4.26 b2.47 c12.720.0001
Cysteine0.05 b0.06 a0.07 a0.510.1828
Arginine3.77 b3.05 b5.82 a53.640.0293
Aspartic acid0.81 a0.38 b0.13 c4.280.0013
Glutamic acid1.99 a0.67 c0.99 b7.370.0008
Serine0.07 c0.09 b0.11 a1.080.0738
Asparagine0.32 b5.07 a0.66 b33.230.0013
Glutamine0.31 c0.90 b1.97 a6.900.0004
a,b,c Means in the same row without a common letter are different at p < 0.05, SEM: standard error of mean.
Table 5. Observation and LOD (limit of detection) of mycotoxin contamination in citric acid by-products from rice (CABR).
ParameterObservationLOD
Aflatoxin B1ND0.8 μg/kg
Aflatoxin B2ND0.8 μg/kg
Aflatoxin G1ND0.8 μg/kg
Aflatoxin G2ND0.8 μg/kg
Fumonisin B1ND100.00 μg/kg
Fumonisin B2ND100.00 μg/kg
ND (not detected).
Publisher’s Note: MDPI stays neutral with regard to jurisdictional claims in published maps and institutional affiliations.

